Bank Depository User Group Tampa, FL October 15-16, 2006 “Preparing for the Future” An outline of critical industry issues and emerging trends Presented by Larry Tabb Founder & CEO TABB Group
Transcript
Bank Depository User GroupTampa, FL
October 15-16, 2006
“Preparing for the Future” An outline of critical industry issues
and emerging trends
Presented byLarry Tabb
Founder & CEOTABB Group
2
Agenda
The 4 Macro Trends
Hedge Funds
Regulation
Exchange Consolidation
Dark Pools
Cost
Conclusions
3
The big picture – The 4 major macro market trends
4
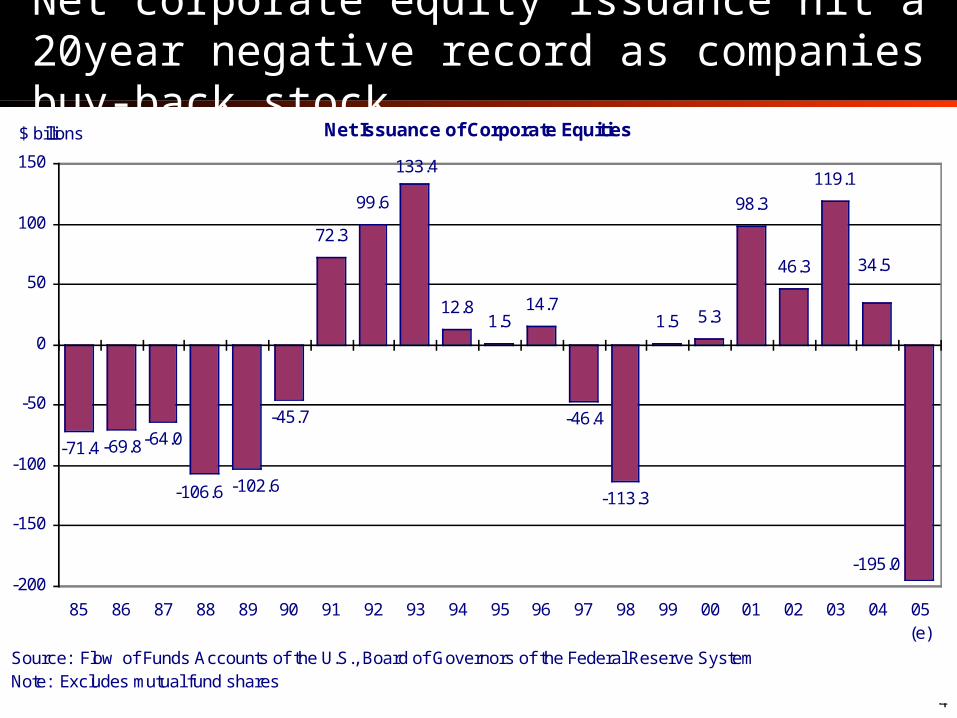
Net corporate equity issuance hit a 20year negative record as companies buy-back stock
Source: Flow of Funds Accounts of the U.S., Board of Governors of the Federal Reserve SystemNote: Excludes mutual fund shares
$ billions
(e)
5
Foreign markets over the past 2 years have outperformed the US market
India
Korea
JapanDAX
CAC
FTSEHK
S&P 500
China
6
Derivatives business are all at record levelsOver-the-Counter Interest Rate Derivatives
Outstanding Notional Principal Amounts
57.31
82.74
101.32
123.90
183.58
201.41
220.00
164.49
142.31
69.21
0
25
50
75
100
125
150
175
200
225
250
1H 2H 1H 2H 1H 2H 1H 2H 1H 2H(f)
$ trillions
2001 2002 2003 2004 2005
Source: ISDA Mid-Year 2005 Market Survey, SIA forecastNote: Interest rate derivatives, for the purpose of this Survey, include interest rate sw aps and options and cross-
Source: ISDA Mid-Year 2005 Market Survey, SIA forecastNote: Credit derivatives, for the purpose of the Survey, include credit default sw aps, baskets and portfolio transactions indexed to single names, indexes, baskets, and portfolios.Over-the-Counter Equity Derivatives
Outstanding Notional Amounts
2.32.5
3.4
4.2
5.4
3.8
2.8
4.8
0
1
2
3
4
5
6
1H 2H 1H 2H 1H 2H 1H 2H(f)
$ trillions
2002 2003 2004
Source: ISDA Mid-Year 2005 Market Survey, SIA forecastNote: Equity derivatives, for the purpose of this Survey, include equity sw aps, options and forw ards.
7
While mutual fund growth impressive, hedge fund AuM growth has not escaped notice
$0.1
$11.9 $11.7 $11.3
$14.0
$16.2
$17.8
$0.1 $0.1 $0.6 $1.0 $1.2
2000 2001 2002 2003 2004 2005
Hedge Funds Mutual Funds
8.4%
76.5%
MutualFunds
HedgeFunds
AuM growth of Hedge Funds vs. Mutual Funds (in $US trillions)
Hedge Funds vs. Mutual Funds AuM CAGRs
Long Only Value Model
.75 to 1.5% AuM
Hedge Fund Value Model
1% to 2% AuM plus
10% to 20% of profitsSource: TABB Group “Institutional Equity Trading 2006 – Preliminary
8
Hedge Funds
9
Over half of managers have hedge funds & 17% more plan on launching one in next 2 yrs
New or newly acquired ECNs Attain => Knight OnTrade (NexTrade’s ECN) =>Citi BATS
18
The NYSE Hybrid-Market, while electronic, is NOT an ECN Trading in parity
Specialist Algorithms
Reserve Orders
Speed
Pricing
NYSE already beginning to lose order flow Market share below 70% Lowest in the 29 years they have kept stats
Source: TABB Group
19
Unbundling / Soft Dollar Regulations
20
PS 05/9 – FSA-based unbundling regulations
Limit commissions to the purchase of Execution & research services
Requires IMs to disclose How commissions payments have been spent What services have been acquired with them
Promote competition between research producers by Removing distinction between brokers (bundled services) Third parties providers (soft services)
21
Included / excluded
Included Research services (original
research only) Execution services
Excluded Raw data feeds (without
modification from the exchange)
Post trade analytics (to the extent that analytical software meets “research service” criteria because it assists in the making of an investment or trading decision, it could be paid for with soft dollars
Valuation or performance measurement software
Computer hardware Dedicated phone lines
Excluded Services Dedicated phone lines Seminar fees Subscriptions for publications Travel, accommodations, or
entertainment costs Office admin software or word
processing or accounting software
Membership to professional organizations
Purchase or rental of office equipment or facilities
Employees salaries Direct money payments Publicly available information Custody services
22
Money Management Soft Dollar Trends
Greater number of large firms banning soft dollars
Source: TABB Group Institutional Equity Trading 2005
Down None Stable Up
47%
70%
40%
20%
7%7%10%
33%
17%
17%
7%
33%
47%
13%
33%
36%
25%
18%
21%
26%
26%
30%
17%
SmallMedium'05
Large'04 '05'04 '05'04
23
Bundled & soft payments to brokers expected to drop while internal, indy, and hard $ payments to rise
Expected Volume of Research by Payment Type
Source: TABB Group “The Future of Equity Research”
24
Exchange Consolidation
25
InstinetArca
Brut
From whence we come
Island
Attain
Strike
TradeBook
Redi
NextTrade
Arca
BATS
Brut
NASDAQ Knight
Citi
NYSE
Instinet
NASDAQ
26
Where we are headed
BSE BOX ISX CSX CBOE BATS NSX Philx Bank of America – 1
Order flow to sales desk continues to decline as traders direct more flow to e*channelsShares by execution venue (share weighted) 2 Year CAGR
Source: TABB Group “Institutional Equity Trading 2006 – Preliminary
28
A convergence of events forcing exchanges to look outside of themselves Exchanges are going public
Forces these organizations to Be more efficient Grow revenues 10% to 20% annually Can’t do that, trading the same old products
Crossing networks are expanding significantly Liquidnet has hit 60+ million shares per day and Pipeline
over 25million
Internal crossing Brokers matching order flow internally
Market share stats NYSE loosing almost 1% market share per month
dropping from 90% in ’04 to less than 63% Sept ’06 (including Arca volumes)
29
Reg NMS, economics, and technologies are poised to change exchange economics Incentives set up for NYSE / NASDAQ to lose share
Top of book protection incents more market centers 6 protected orders are better than 2
Market data rebate changes allows exchanges to rebate tape revenues
Greater tape rebates by regionals will incent brokers to put limit orders in regionals
Routing engines work from fastest to slowest High speed exchanges trade at 5 to 10 milliseconds Hybrid project to be 500+ milliseconds Routing engine can ping Inet 100times before NYSE responds
If limit orders move to edge and routing engines execute from edge in Fewer shares in center Liquidity will even out NYSE & NASD will lose share
That is why LSE / Euronext is vitally important !!!!
30
Because of this, US market centers are in global expansion mode Elephant dance
NASDAQ acquired 25%+ of LSE NASDAQ has veto ability to kill any acquisition deal
NYSE for Euronext Challenged by Deutsche Bourse
Price expected to escalate
Both exchanges paying top dollar
Other activity Significant investment in new equity exchanges in US & a little in UK
New Equity Exchanges ISE, Phila, Boston, CBOT, & Plus Markets (UK)
Moves to develop derivatives exchanges New Options Exchanges
NYSE/Pacific, & NASDAQ
31
Europe is the next battle ground because
European markets are basically still a monopoly Little inter-market competition
Sarbanes Oxley forces firms to list overseas
NYSE / NASDAQ need marquee names Out of the IPO gate they need a big name Asia is too far away to make a big splash except for Tokyo
Japanese will not give up the TSE – no way LSE & Euronext are the marquee brands
Euronext has many valuable pieces Euronext Liffe – 3rd largest derivatives exchange MTS – Largest sovereign debt electronic trading platform outside of US LCH Clearnet – London & Pan-European securities depository (45.1%
interest) Paris, Brussels, Lisbon, & Copenhagen Stock Exchanges GL Trade – provider of order management software Joint venture with Atos to sell and implement exchange technology and
provide general trading technology integration services LSE is the largest European stock exchange
32
LSE/Euronext are however – very expensive
Euronext / LSE performance +60 to +100% over last 12months
Acquirers performance weaker than targets Deutsche Boerse up 40%
NYSE performance up 20% Nasdaq down 20%
NASDAQ acquired 25.1% making it difficult for NYX
NYSE being out flanked by Greifield and NASD
NYSE turn sites to Euronext
Significant questions on whether Regulators and Politicians will let this happen at all
NYX, Nasdaq & Deutsche Boerse 1 yr performance
Euronext & LSE 1 year performance
33
Darkpools
34
Dark pools & crossing networks match order flow on its way to the exchange
Retail
DMA
Algo
Phone
FIX
Prime Broker
Traditional AM
InstitutionalMarket Making
Proprietary
ResidentFlow
Tra
nsie
nt F
low Dark
Pool
Executions
Matched
MarketCenters
Unmatched
ExternalOrder Flow
Source: TABB Group
35
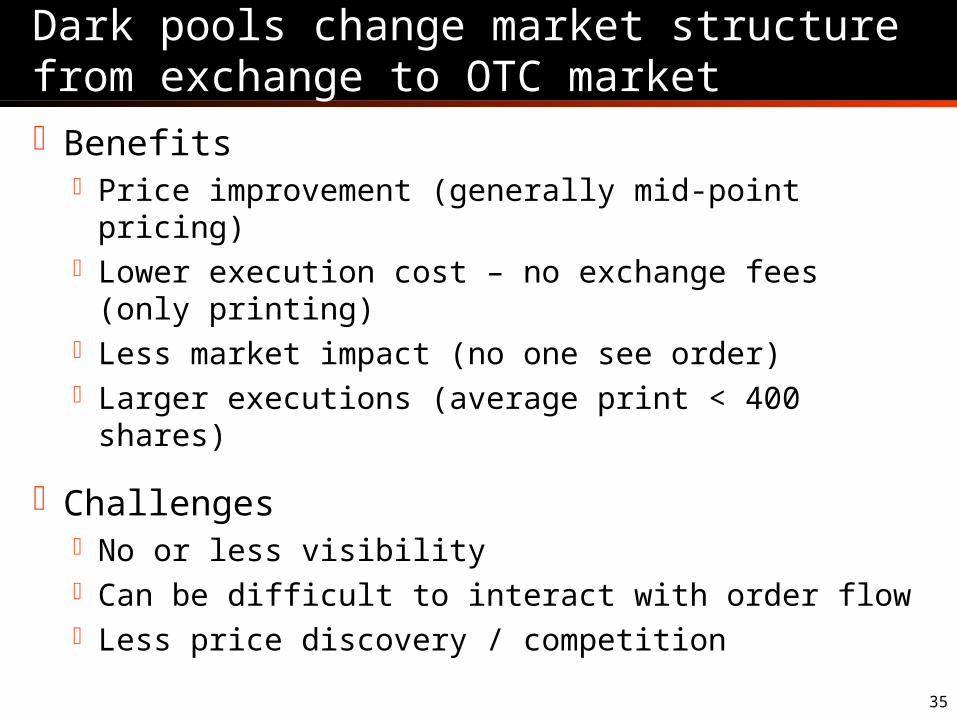
Dark pools change market structure from exchange to OTC market
Source: TABB Group, Companies, Fidelity Capital MarketsLatticeState Street
37
Fragmentation will increasing be the key industry challenge Fragmentation
12 exchanges or significant ECNs
29 unlinked dark pools Countless algorithms Inability to do size
Solutions are Crossing networks help but…
Too much of a good thing DMA/Aggregation
technologies Cost of market data and
infrastructure make development difficult
Algorithms Cause further fragmentation
9%Market
Structure
83%Liquidity /Fragmentation
9%Lack of
Transparency
8%Algo Overload
8%Cost
4%Regulatory
Environment
25%Trade Size
2005
Buy-side trader most significant challenges
Source: TABB Group – Institutional Equity Trading in America 2005
38
There is a new business in developing dark routing strategies
CS, ITG, Instinet, Piper, Lava, and other have developed dark routers
The challenge is Crossing logic
Different for all dark pools
Transient orders Taking liquidity is easier than placing
Resident orders Need to be careful with resident orders Who is in the queue ahead of you? What happens to the order if there are multiple resident orders? Time Priority? Commission Priority? Broker Priority? Parity?
39
It about cost
40
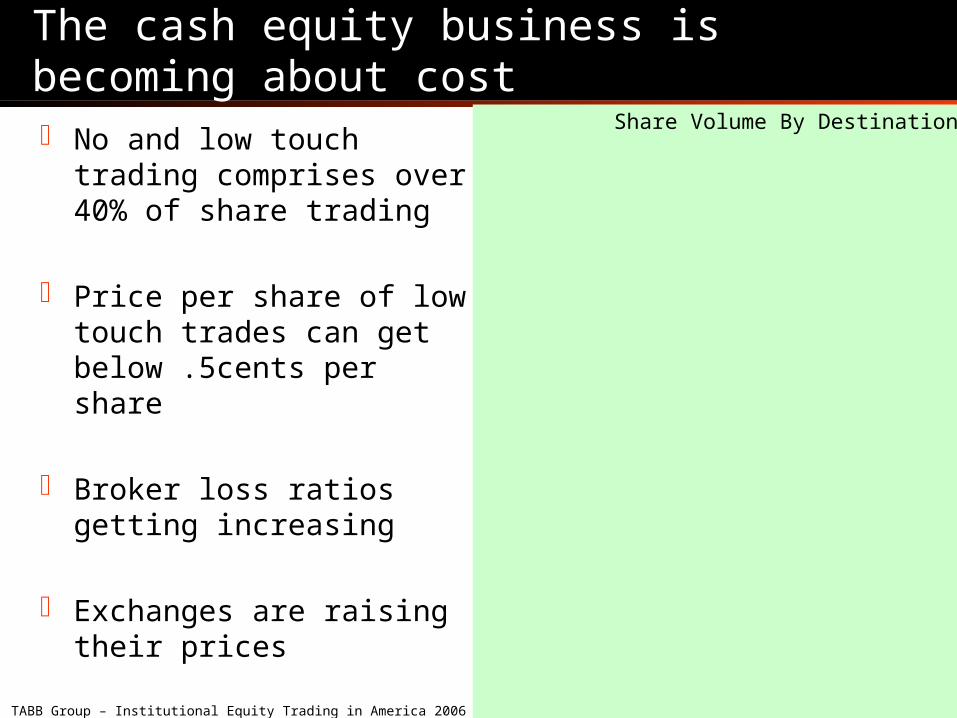
The cash equity business is becoming about cost No and low touch trading
comprises over 40% of share trading
Price per share of low touch trades can get below .5cents per share
Broker loss ratios getting increasing
Exchanges are raising their prices
Share Volume By Destination
Source: TABB Group – Institutional Equity Trading in America 2006
41
Commission pressure over past year has been significant (especially in electronic channels)
Average per share costs (pennies) % Decrease ’05 to ‘06
-4.0%
-21.0%
-10.0%
Source: TABB Group “Institutional Equity Trading 2006 – Preliminary
-28.0%
-38.0%
42
Thinning broker ranks
Because of economics and regulation Brokers can’t make significant money in cash equities
Lose ratios up More volume going through low touch
Research model is broken SEC pushing best execution
Buy-side firms are conflicted between SEC Best execution obligations Fiduciaries looking for commission recapture Portfolio managers looking to pay research bills
Changing dynamics Largest brokers will manage executions Medium brokers will be challenged Smaller brokers will become research houses paid by larger brokers
43
Buy-side clearing – just smoke or is there heat?
Accounts/Portfolios
400,000
Trading desk
100,000
100,000
100,000
100,000
BrokerExecutions 10
10
10
10
Allocations
40Custodian
Accounts/Portfolios
400,000
Trading desk
100,000
100,000
100,000
100,000
BrokerExecutions
10
10
10
10
Allocations
Aggregation 10
Custodian
10
44
Conclusions
Flat yields and lack of US Investment returns forcing funds to change investment strategies and mechanisms New markets, products, strategies and technologies
As clients change, exchanges are changing as well
Dealers don’t want to be locked in so they are investing
This is fragmenting the market, making it more difficult to trade & settle