Electronic copy available at: http://ssrn.com/abstract=1557010 1 Bank Diversification, Risk and Profitability in an Emerging Economy with Regulatory Asset Structure Constraints: Evidence from the Philippines Céline Meslier, Ruth Tacneng* and Amine Tarazi Université de Limoges, LAPE, 5 rue Félix Eboué, BP 3127, 87031 Limoges Cedex, France Abstract This paper addresses the issue of bank revenue diversification for an emerging country with a specific regulation to encourage lending to small and medium enterprises, which constrains the structure of bank assets. Using data with a detailed breakdown for a sample of Philippine universal and commercial banks, we find that increased involvement in non- interest activities is associated with higher profitability without affecting the volatility of bank returns. For a specific type of Philippine banks, universal banks, increased diversification in non-interest activities tends to lower risk. A closer investigation shows that the positive effect on profitability is mainly driven by the expansion of trading activities and more specifically by government securities that banks can purchase instead of directly granting loans to small and medium enterprises. Moreover, our findings indicate that these activities tend to reduce risk. Conversely, a higher involvement in underwriting activities in universal banks is associated with higher risk. Our results are robust to various factors, model specifications, and alternative diversification measures. Our findings highlight that regulation aiming to promote lending to small and medium enterprises that banks can circumvent by acquiring specific government securities, might have lowered their risk exposure. JEL Classification: G21, G28 Keywords: Emerging economies; Bank Revenue Diversification; Bank Risk and Profitability * Corresponding author. Tel: +33 555 149214; Fax: +33 555 149211. Email addresses: [email protected](C.Meslier), [email protected](R. Tacneng) and [email protected](A. Tarazi)
Transcript
Electronic copy available at: http://ssrn.com/abstract=1557010
1
Bank Diversification, Risk and Profitability in an Emerging Economy with Regulatory
Asset Structure Constraints: Evidence from the Philippines
Céline Meslier, Ruth Tacneng* and Amine Tarazi
Université de Limoges, LAPE, 5 rue Félix Eboué, BP 3127, 87031 Limoges Cedex, France
Abstract
This paper addresses the issue of bank revenue diversification for an emerging country
with a specific regulation to encourage lending to small and medium enterprises, which
constrains the structure of bank assets. Using data with a detailed breakdown for a sample of
Philippine universal and commercial banks, we find that increased involvement in non-
interest activities is associated with higher profitability without affecting the volatility of bank
returns. For a specific type of Philippine banks, universal banks, increased diversification in
non-interest activities tends to lower risk. A closer investigation shows that the positive effect
on profitability is mainly driven by the expansion of trading activities and more specifically
by government securities that banks can purchase instead of directly granting loans to small
and medium enterprises. Moreover, our findings indicate that these activities tend to reduce
risk. Conversely, a higher involvement in underwriting activities in universal banks is
associated with higher risk. Our results are robust to various factors, model specifications, and
alternative diversification measures. Our findings highlight that regulation aiming to promote
lending to small and medium enterprises that banks can circumvent by acquiring specific
government securities, might have lowered their risk exposure.
JEL Classification: G21, G28
Keywords: Emerging economies; Bank Revenue Diversification; Bank Risk and Profitability
Electronic copy available at: http://ssrn.com/abstract=1557010
2
1 Introduction
Over the last three decades, the financial industry in developed as well as in
developing countries has experienced major changes. Deregulation and increased competition
has led banks to expand their activities and to develop new lines of businesses beside their
traditional interest activities. Banks have diversified their income sources by performing new
activities, such as underwriting and trading securities, brokerage and investment banking and
other activities, which generate non-interest income. The implications of such changes on
bank performance, i.e. profitability and risk, have been broadly addressed in the literature but
no consensus has been reached at this stage. Most studies find that non-interest activities are
often associated with profitability gains but also higher risk because of their unstable nature.
By investigating the US banking industry, Stiroh (2004a and b), Stiroh (2006) and Stiroh and
Rumble (2006) find that a higher share of noninterest income positively affects the volatility
of bank returns inducing higher risk. Consistent with US studies, Lepetit et al. (2008a) show
that banks that are more reliant on non-interest activities exhibit higher default risk than banks
which mainly supply loans. This positive link mainly holds for small banks and is essentially
driven by commission and fee activities. Specifically, a higher share of trading activities is not
associated in their study with higher risk and for small banks it implies, in some cases, lower
asset and default risks. Mercieca et al. (2007) find that small European banks do not benefit
from diversification. Higher non-interest income shares are associated with lower profitability
and increased risk implying lower risk-adjusted profits. Furthermore, they find trading
activities to be both risky and unprofitable. Conversely, analyzing Italian banks, Chiorazzo et
al. (2008) find that income diversification improves the risk/return trade-off. Such
diversification gains are stronger for large banks.
Whereas the case of developed countries (US and Europe) is well documented in the
empirical literature, very few papers focus on emerging countries. In a cross-country study
conducted for a sample of listed banks from 11 emerging countries, Wolfe and Sanya (2011)
find that diversification between interest and non-interest activities as well as within both
types of activities increases risk-adjusted profitability and reduces bank insolvency risk.
Berger et al. (2010) examine the case of the Chinese banking industry and find evidence of a
diversification discount1, which is stronger for domestic banks than for foreign banks,
suggesting that different ownership structures induce different effects of diversification on
11
Their diversification discount indicators are profit premiums and cost discounts. They are measured as the difference between the
predicted profits (respectively the predicted cost) between the observed diversified bank and a hypothetical quasi-focused bank.
3
bank valuation. Focusing on the Mexican banking system, Maudos and Solis (2009) highlight
the existence of a negative relationship between banks' interest margin and non-interest
income. Their findings are consistent with the results obtained for European banks by Lepetit
et al. (2008b) indicating possible cross-subsidization of non-interest activities with traditional
intermediation activities, banks using loans as a loss leader.
The objective of this paper is to contribute to the scarce literature dedicated to the
impact of diversification on bank profitability and risk in the case of emerging and developing
countries. As financial markets are less mature in such countries than in developed countries,
banks play a crucial role in the financing of the private sector and specifically for small and
medium enterprises (SMEs). As discussed in the Financial Access 2010 Report provided by
the IFC (2010), access to finance by SMEs is one of the main policy issues for developing
countries and specific regulations encouraging banks to lend to priority sectors, including
SMEs, are implemented in some emerging countries like Afghanistan, India, the Philippines
and Pakistan. By imposing constraints on bank lending behavior, such regulations may
influence diversification strategies and could potentially shape the relationship between
diversification and bank performance (risk/profitability). Another important issue for
emerging and developing countries is the role of corporate ownership and governance in
affecting bank behavior. As reported by De Nicolo and Loukoianova (2007), two main trends
in bank ownership structure in emerging countries can be highlighted over the 1993-2004
period. While foreign ownership substantially increased, state-ownership remained stable and
still tends to increase in some group of countries. Several papers have investigated the effect
of a higher foreign presence in local banking markets. Foreign bank entry is generally found
to positively impact competition and, in some cases, improve the efficiency of the local
banking system (Claessens, Demirguc-Kunt, and Huizinga, (2001), Lensink and Hermes
(2003)). However, studies regarding credit availability provide mixed results. While for some
authors, foreign bank entry reduces credit constraints (Clarke et al. (2006)), others such as
Detragiache et al. (2008) and Gormley (2010) find that foreign bank entry does not
necessarily improve access to finance for local firms. Meanwhile, in terms of government
ownership of banks, an abundant theoretical literature stresses its negative effect in terms of
efficiency and risk (Shleifer (1998), Shleifer and Vishny (1998)).
In order to assess the bank diversification/profitability and risk nexus in emerging
countries, we focus on the case of the Philippines. We investigate the effect of diversification
between interest and non-interest activities as well as within non-interest activities using a
detailed breakdown of non-interest income of Philippine banks. Size as well as ownership
4
issues are taken into account as the Philippine banking system has experienced foreign bank
entry and is also characterized by the presence of some state-owned banks. Focusing on a
single country enables us to analyze the effect of diversification within a uniform
environment and to examine the diversification/performance relationship with regards to a
specific aspect of Philippine banking regulation. Indeed, Philippine banks are required to
grant at least six percent and two percent of their total loan portfolio to small and medium
enterprises, respectively. However, banks can comply with this rule by purchasing
government notes, securities and negotiable instruments offered by the Small Business
Guarantee and Finance Corporation (SBGFC)2. Therefore, a bank's decision to hold
government securities is not only driven by concerns for optimal diversification but also to
comply with bank regulation. To our knowledge, this is the first study on an emerging
economy that looks into this regulatory aspect3. This question is of particular interest for
emerging countries where small business lending is a crucial issue. Our study does not aim to
provide a direct assessment of the effect of such regulations for SMEs financing on bank
diversification behavior as data on individual bank loan portfolio disaggregated according to
the size of borrowing firms are not available. Nevertheless, it provides insights on the
potential impact of such regulations on the potential benefits or drawbacks of bank
diversification in terms of profitability and risk.
We conduct our empirical investigation over the 1999-2005 period using a sample of
39 universal and commercial banks in the Philippines with a very detailed breakdown of
annual data on income structure provided by the Central Bank of the Philippines. This allows
us to deeply analyze bank diversification behavior by examining the effect on profitability
and risk not only of the main components of non-interest income (fee-based, trading and other
non-interest income) but also by considering a detailed categorization of such components.
Estimations are conducted over different subsamples of banks categorized according to bank
size, differences in the involvement in non-interest activities, differences in bank asset
structure and ownership types. We also examine the effect of diversification for a specific
category of banks in the Philippines, Universal banks. In addition to the powers of a
commercial bank, Universal banks in the Philippines have investment house functions, which
include engagement in the underwriting of securities of other corporations4. In this regard, we
examine whether there are pronounced differences in the effects of diversification for such
2 Republic Act No. 6977, Section 13. Mandatory Allocation of Credit Resources of Small and Medium Enterprises.
3 Wolfe and Sanya (2011) find that a higher banking freedom and better investor protection are associated with higher profitability.
However, they do not explicitly explore the effect of such regulations on the risk implications of increased bank diversification. 4Republic Act 8791; Presidential Decree No. 129.
5
banks. In addition, we look closely on how income generated from activities that are related
to the additional function of universal banks affect their risk and profitability.
Our findings show that increased reliance on non-interest activities has a positive
influence on the profitability of Philippine banks and that this effect is stronger for banks with
a lower initial level of diversification. Moreover, in contrast with the results obtained in most
US and European studies, diversification does not affect the volatility of bank returns and, in
some cases, implies a reduction in default risk. We also find that diversification benefits more
the smaller banks and foreign banks. The positive effect on profitability is mainly driven by
higher reliance on trading income and more specifically government securities‟ trading.
However, a closer look shows that such a result only holds for banks, which presumably
purchase government securities to comply with the mandatory credit allocation to SMEs
instead of directly lending to them. Finally, the investigation conducted on the sub-sample of
universal banks shows that a higher involvement in investment house activities is associated
with higher risk.
The remainder of the paper is organized as follows. Section 2 discusses the data and
variables used in our study and presents recent trends in the income structure of the Philippine
banking industry. Section 3 describes the hypotheses tested, the method and the econometric
specifications. Section 4 provides the results of our estimations while section 5 reports
robustness checks and discusses further issues. Section 6 summarizes the findings and
concludes the paper.
2. Data and Variables, Descriptive Statistics and Trends in the Philippine Banking
Industry
2.1 Data Collection and Sample Selection
The Philippine banking industry has introduced universal banking in 1980 and has
become increasingly diversified over the last two decades in terms of its revenue-generating
activities. Growing competition over the period in the Philippine banking market has provided
incentives for commercial banks to diversify their activities and to increase the share of non-
interest activities (Gochoco-Bautista (1999)). Banks have been providing a broader array of
financial services, which include not only the extension of loans but also underwriting and
distributing securities, sale of investments, online banking and commission and fee activities5.
5 Over the past twenty years, noninterest income has grown over 700% (200% more than the growth rate in interest income).
6
In the Philippines, banks are classified in six main categories6: universal banks, commercial
banks, thrift and savings banks, rural banks, cooperative banks and Islamic banks. In 2005,
universal and commercial banks alone comprise 89.29%, 89.47% and 90%7 of the total assets,
deposit liabilities and loans and investments outstanding, respectively of the entire Philippine
banking system. Universal banks have the authority to exercise, in addition to the functions
authorized for a commercial bank8, the powers of an investment house
9. These figures show
that universal and commercial banks are the primary lenders to both households and
institutions in the country. Their behavior generally shapes that of the banking system and
impacts the economy. The sample used in this study includes 39 universal and commercial
banks. We construct our sample using two criteria: (1) banks must have at least data for three
years and, (2) the gross income components must be non-negative. The first criterion is set in
order to confine the panel regressions on banks with sufficient number of observations.
Meanwhile, the second criterion ensures that the diversification measures, particularly the
indices and income shares are bounded from 0 to 1. We also apply several measures to check
the presence of outliers and influential observations10
. We also exclude banks that merged
and/or were acquired during the period. We hence end up with an unbalanced panel consisting
of 39 banks and 218 observations.
Our sample of banks represents 86.81%11
of the Philippine banking system and 96.3%
of the universal and commercial banking system in terms of total assets. 12
The whole sample consists of 23 domestic and 16 foreign banks13
, and 16 listed and
23 non-listed entities. In terms of asset size, we identify 8 large banks (Average Asset > 140
billion pesos), 13 medium-sized (30 billion pesos < Average Asset < 120 billion pesos) and
6 The General Banking Law of 2000 (Republic Act No. 8791). 7 Author‟s computations from the Banking Statistics published in the Bangko Sentral ng Pilipinas website. 8 Article II- Operations of Commercial Banks (Republic Act No.8791). A commercial bank shall have, in addition to the general powers
incident to corporations, all such powers as may be necessary to carry on the business of commercial banking, such as accepting drafts and
issuing letters of credit; discounting and negotiating pormissory notes, drafts, bills of exchange, and other evidence of debt; accepting or creating demand deposits; receiving other types of deposits and deposit substitutes; buying and selling foreing exchange and gold or silver
bullion; acquiring marketable bonds and other debt securities; and extending credit, subject to such rules as the Monetary Board may
promulgate. 9 From the Omnibus Rules and Regulations for Investment Houses and Universal banks registered as underwriters of securities, an
investment house is defined as any enterprise which primarily engages, whether regularly or on an isolated basis, in underwriting securities of another person or enterprise, including securities of the Government or its instrumentalities. 10 Aside from graphically looking at box plots and scatter plots to identify outliers, we confirm these outliers by computing the DFBETA and
leverage measures after the estimations. The DFBETA measures the distance that a regression coefficient would shift when an observation is
included or excluded from the regression, scaled by the estimated standard error of the coefficient (Baum, 2006). 11 Mean over the period of the study 12 In 1999, there are a total of 46 universal and commercial banks, and in 2005, 41 universal and commercial banks. 13 Banks are classified as foreign if: 1) they are subsidiaries of foreign banks, or 2) branches of foreign banks. This classification is mainly
drawn from the Monetary Board‟s authorized mode of entry (Sec. 2, Republic Act NO. 7721) of foreign banks to operate in the Philippine
banking system. Sec. 2. Modes of Entry – The Monetary Board may authorize foreign banks to operate in the Philippine banking system
through any of the following modes of entry: (i) by acquiring, purchasing or owning up to sixty percent (60%) of the voting stock of an existing bank; (ii) by investing in up to sixty percent (60%) of the voting stock of a new banking subsidiary incorporated under the laws of
the Philippines; or (iii) by establishing branches with full banking authority: provided, that a foreign bank may avail itself of only one(1)
domestic bank of new banking subsidiary. (Republic Act NO. 7721, An Act Liberalizing the Entry and Scope of Operations of Foreign Banks in the Philippines and for other purposes).
7
18 small ones (Average Asset < 30 billion pesos). Bank classifications in terms of size are
defined from an examination of the distribution of banks both in terms of their average assets
over the period of the study (1999-2005) and bank asset distribution by their yearly amounts.
We note that most of the smaller banks in the sample are foreign-owned, branches or
subsidiaries of foreign banks and that the largest banks are dominantly domestic banks.
Among the 8 large banks, 2 are government banks. Excluding the state banks, our sample of
domestic banks is composed of 12 universal banks and 9 commercial banks. The sample
description is summarized in Table 1.
[Insert Table 1]
Balance sheet and net income information are obtained from the Data Center of the
Bangko Sentral ng Pilipinas and its website on an annual basis14
. Moreover, among this
sample, 20 banks also provide quarterly data. We note that most of them are domestic banks
(18 out of 20); 6 are large, 10 are medium-sized and 4 are small. Meanwhile, 15 are listed and
5 non listed, of which 10 among the listed banks are universal banks. These 20 banks
represent 64% of the total banking system and 71% of the total universal and commercial
banking system in terms of total assets. These data are obtained from the Securities and
Exchange Commission.
For the whole sample of banks, the Central Bank of the Philippines also provides us a
detailed breakdown of operating income and its components. This enables us to carry out an
in depth study on noninterest income, its main components – fee-based, trading and other
noninterest income, and their respective disaggregation. Fee-based and trading activities
include respectively bank commissions, service charges/fees and other commissions and
income from trading government securities, private equity/debt; financial futures, forwards
and swaps; profit from the sale of investments; and profit from foreign exchange.
For the listed banks of our sample, daily market data for stock prices are obtained
from Datastream International.
2.2 Main trends in portfolio structure and income structure in the Philippine banking
system
14 www.bsp.gov.ph
8
Tables 2A and 2B highlight significant differences of income structure according to
bank size (large, medium and small), bank type (universal and commercial banks) and
ownership type (foreign and domestic).
[Insert Tables 2A and 2B]
Over the 1999-2005 sample period, the share of non-interest income in total operating
income is, on average, equal to 35.92%. Most of the non-interest income is drawn from
trading activities (45.30%) compared to fee-based activities (38%). Trading in government
securities and foreign exchange profit are the largest source of trading income (30.60% and
51.50%), while service charges dominate the fee-based income sources (61.40%). We can
observe different profiles of diversification and non-interest income structure according to the
size and ownership structure of the bank. Larger banks present a higher level of non-interest
income in total operating income (38.16 % for large banks and 39% for medium-sized banks)
than small banks (32.22%). However, the difference between large and medium-sized banks
becomes more pronounced when we exclude state banks. On average, the larger is the bank,
the higher is its non-interest income share. On the other hand, the degree of involvement in
non-interest activities is similar in domestic banks and foreign banks which operate in the
Philippines. Trading income represents the main source of non-interest income for large
banks (41.30%), medium-sized banks (47.20%) and small banks (46%). Fee-based activities
have a slightly higher share compared to trading activities when state banks are excluded from
the sample of large banks. Within trading activities, foreign exchange profit and trading of
government securities are the two main sources of income for all types of banks. However,
whereas foreign exchange profit represents the main component for large and small banks
(38.50% and 67.60%), trading of government securities is the main source of trading activities
for medium-sized banks (43.10%). For foreign banks, fee-based activities represent the main
source of non-interest income (47.70%), followed by trading activities (40.80%). For these
banks, foreign exchange profit is the main source of revenue in trading activities (74.70%).
On the contrary, domestic banks are more involved in trading activities (47.80%), of which
government securities trading is the largest component (41.90%). Marked differences are also
observed between universal and commercial banks. Universal banks have higher shares of
non-interest income compared to commercial banks (39.38% and 34.62%). In addition,
commercial banks have higher shares on both fee-based and trading income but universal
banks present a higher involvement in other non-interest activities.
9
Philippine banks exhibit higher levels of involvement in non-interest activities than
those reported in Wolfe and Sanya (2011) for their set of emerging countries and similar
levels of involvement in non-interest income activities in comparison with those reported in
US and European studies. Whereas, differences in accounting standards do not allow us to
compare the different sources of non-interest income among countries, the relatively high
involvement in trading activities for Philippine banks has to be stressed. The existence of a
specific regulatory framework which constrains Philippine banks‟ asset structure raises the
question of the influence of such a regulation on bank diversification behavior and its
consequences on profitability and risk.
2.3 Definition of variables
2.3.1 Diversification measures
In this study, three sets of diversification indicators are computed and alternatively
used to assess the effect of the increased diversification of Philippine banks on their
profitability and risk.
A first set of indicators used in this study consists of ratios which represent the share
of non-interest income in total operating income, as well as the shares of each component of
non-interest income in total operating income. The variable NII is equal to the percentage
share of non-interest income to total operating income, where non-interest income15
is the
sum of fee-based income, trading income and other noninterest income. We use the gross
values because there is no categorical expense attributed to these activities alone in the
income statement provided in our data. In addition, the reported non-interest expense is
independent of the non-interest income. The variable NII is then computed as follows:
NII = Non-interest Income/Total Operating Income (1)
where Non-interest Income = Fee-based Income + Trading Income + Other Non-interest
Income, and Total Operating Income = Non-interest Income + Interest Income – Interest
Expense
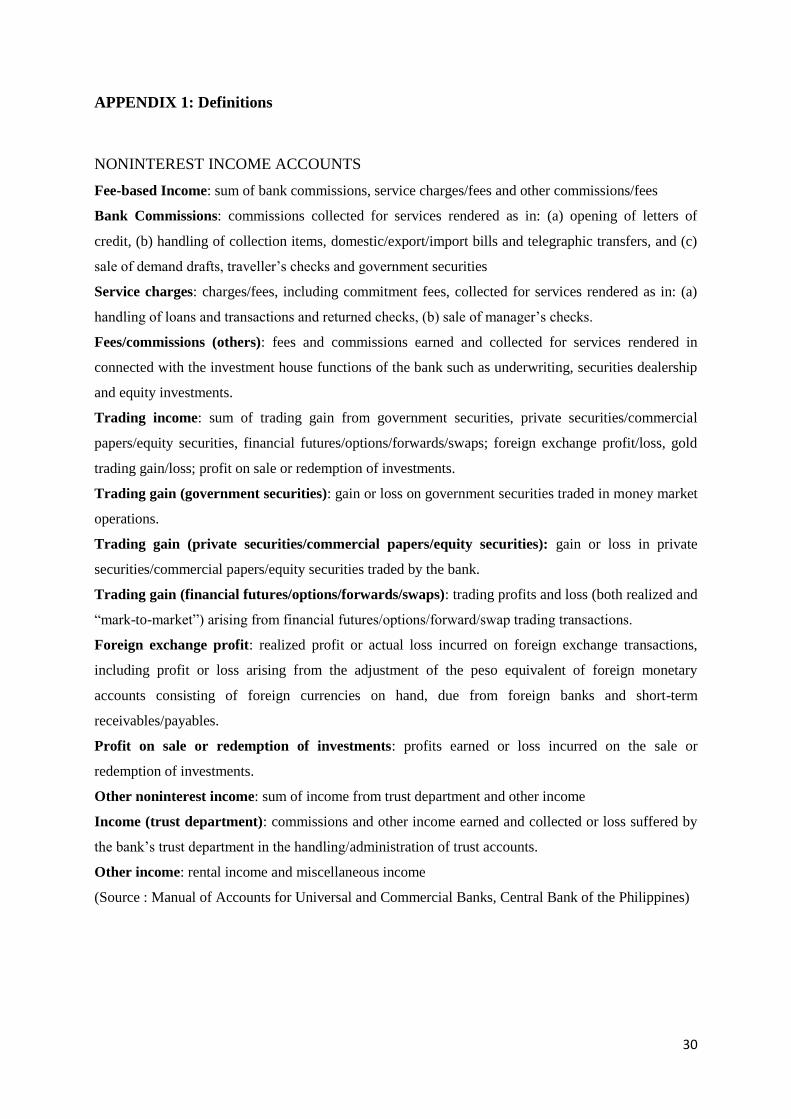
15
The definition of the non-interest income accounts are shown in the Appendix 1.
10
We also disaggregate NII into three components – FEE, TRAD and Other. These
variables are computed as follows:
FEE = Fee-based income/Total Operating Income (2)
TRAD = Trading income/Total Operating Income (3)
Other = Other income/Total Operating Income (4)
Where Fee-based income16
= Bank commissions + service charges/fees + other
fees/commissions and Trading income = Trading gains/(losses) (from government securities,
private debt/equity securities, and financial futures, options) + Foreign exchange
profits/(losses)+Gold trading gains/(losses) + Profit/(loss) on sale of redemption of
investments.
For the components of non-interest income, we draw the definition of our variables
from the Bangko Sentral ng Pilipinas‟ glossary of terms (BSP website17
). Our definition of
total operating income is consistent with the studies of Stiroh (2004b), Stiroh and Rumble
(2006) and Chiorazzo et al. (2008).
A second set of indicators used in this paper, FOCUSk, consists of Herfindahl indexes
which indicate the degree of bank focus/specialization in its revenue generating activities. As
in Chiorazzo et al. (2008), Stiroh and Rumble (2006) and Wolfe and Sanya (2011), the indices
measure how focused or specialized a bank is on its income generating activities. We
compute them as follows:
Let j
i,tX be the nominal exposure of bank i at time t to activity j where j = 1,....,n. j
i,tx
denotes the corresponding relative exposure, i.e.
j
i,tj
i,tj
i,t
1
Xx
Xn
j
(5)
16
The definition of the different components of non-interest income are drawn from the Bangko Sentral ng Pilipinas‟ glossary of terms,
which can be found in the BSP website, www.bsp.gov.ph/banking/glossary.asp
11
2
j j
i,t i,t
1
FOCUSk xn
j
(6)
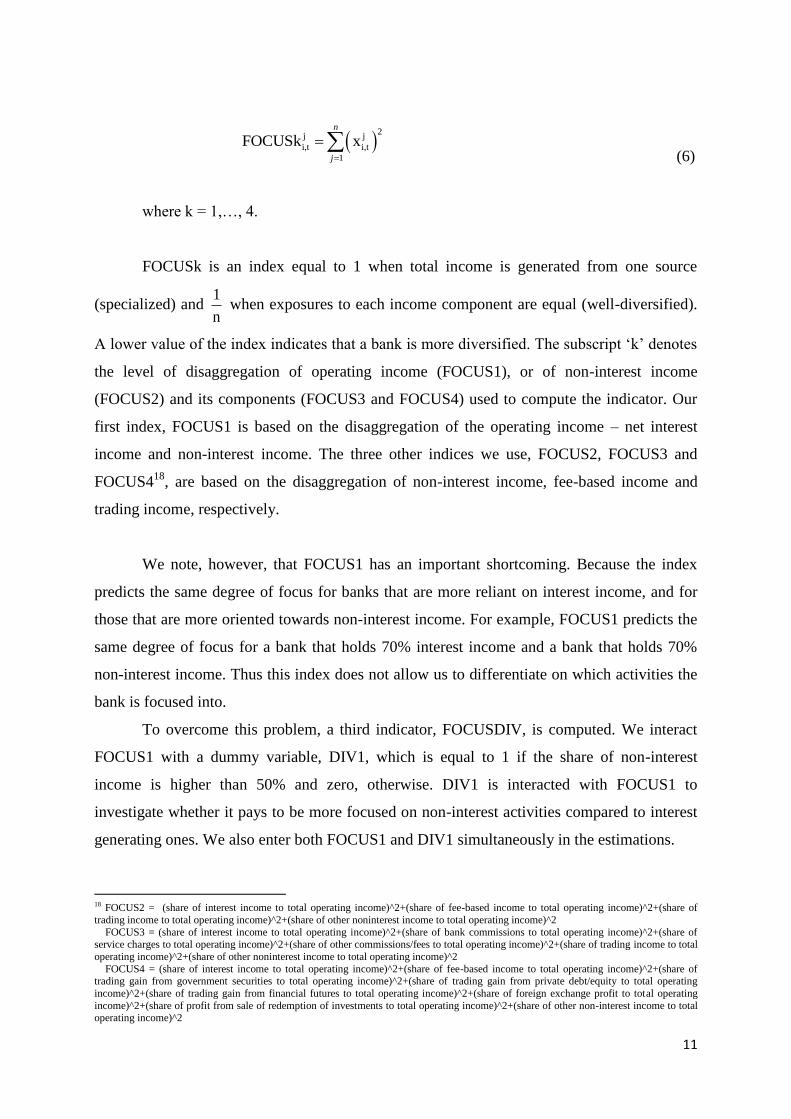
where k = 1,…, 4.
FOCUSk is an index equal to 1 when total income is generated from one source
(specialized) and 1
n when exposures to each income component are equal (well-diversified).
A lower value of the index indicates that a bank is more diversified. The subscript „k‟ denotes
the level of disaggregation of operating income (FOCUS1), or of non-interest income
(FOCUS2) and its components (FOCUS3 and FOCUS4) used to compute the indicator. Our
first index, FOCUS1 is based on the disaggregation of the operating income – net interest
income and non-interest income. The three other indices we use, FOCUS2, FOCUS3 and
FOCUS418
, are based on the disaggregation of non-interest income, fee-based income and
trading income, respectively.
We note, however, that FOCUS1 has an important shortcoming. Because the index
predicts the same degree of focus for banks that are more reliant on interest income, and for
those that are more oriented towards non-interest income. For example, FOCUS1 predicts the
same degree of focus for a bank that holds 70% interest income and a bank that holds 70%
non-interest income. Thus this index does not allow us to differentiate on which activities the
bank is focused into.
To overcome this problem, a third indicator, FOCUSDIV, is computed. We interact
FOCUS1 with a dummy variable, DIV1, which is equal to 1 if the share of non-interest
income is higher than 50% and zero, otherwise. DIV1 is interacted with FOCUS1 to
investigate whether it pays to be more focused on non-interest activities compared to interest
generating ones. We also enter both FOCUS1 and DIV1 simultaneously in the estimations.
18 FOCUS2 = (share of interest income to total operating income)^2+(share of fee-based income to total operating income)^2+(share of
trading income to total operating income)^2+(share of other noninterest income to total operating income)^2
FOCUS3 = (share of interest income to total operating income)^2+(share of bank commissions to total operating income)^2+(share of
service charges to total operating income)^2+(share of other commissions/fees to total operating income)^2+(share of trading income to total
operating income)^2+(share of other noninterest income to total operating income)^2
FOCUS4 = (share of interest income to total operating income)^2+(share of fee-based income to total operating income)^2+(share of trading gain from government securities to total operating income)^2+(share of trading gain from private debt/equity to total operating
income)^2+(share of trading gain from financial futures to total operating income)^2+(share of foreign exchange profit to total operating
income)^2+(share of profit from sale of redemption of investments to total operating income)^2+(share of other non-interest income to total operating income)^2
12
2.3.2 Bank Profitability and Performance Measures
To measure the profitability of a bank, we use bank income statement ratios – the
return on average assets (ROA) and the return on average equity (ROE):
it
NetIncomeAfterTaxROA =
AverageAsset
(7)
it
NetIncomeAfterTaxROE =
AverageEquity
(8)
We also construct two types of risk-adjusted profitability measures according to data
availability. First, from the sample of 20 banks for which quarterly data are available, we
calculate the risk-adjusted return measures as the ratio of the average ROA (respectively
ROE) to its standard deviation by using rolling windows of eight quarters19
:
it
it
it
ROAADJROA =
ζROA (9)
it
it
it
ROEADJROE =
ζROE (10)
Second, following Chiorrazo et al. (2008), we also compute risk-adjusted profitability
measures, defined as the ratio of annual ROA (respectively ROE) to the standard deviation of
each bank over the period of study, 1999-2005.
itit
i
ROASHROA =
ζROA
(11)
itit
i
ROESHROE =
ζROE (12)
2.3.3 Bank Risk Measures
Different types of risk taking and default risk measures are computed according to
data availability.
For the sub-sample of 20 banks for which quarterly data are available, two standard
measures of risk based on quarterly accounting data are used in our study. We consider the
volatility of returns, which is measured by (i) the standard deviation of the return on average
assets (SDROA) and (ii) the standard deviation of the return on average equity (SDROE),
(SDROA and SDROE) as proxies for risk taking.
19
The rolling windows cover for year t, the last two quarters of year t-1, the four quarters of year t and the first two quarters of year t+1.
13
For the 16 listed banks in our sample, we also compute risk and insolvency measures
using market data obtained from DataStream International. There are a total of 16 listed banks
in our sample; however, sufficient data are only available for 15 banks. We compute risk-
taking measures such as i) the market model beta (Beta)20
coefficient estimated through a
GARCH model measuring systematic risk, ii) total risk (TotRisk), which is the standard
deviation of weekly returns21
and iii) specific risk (RiskSpec)22
, which is the standard
deviation of the market model residual. We also compute a default risk measure using a
market-data-based Z-score (MZ)23
. This measure represents the number of standard deviations
below the mean by which profits would have to fall to deplete equity capital (Boyd et al
(1993).
3. Hypotheses Tested and Methodology
The objective of this study is to examine how diversification between interest and
non-interest activities as well as within non-interest activities may affect bank profitability
and risk. We also aim to assess whether a specific banking regulation on Philippine bank
portfolios is likely to shape the diversification behavior of Philippine commercial banks. We
conduct a detailed analysis by examining differences in the effect of diversification according
to bank size, the initial level of diversification and ownership type.
For some authors (Stiroh (2004a), Lepetit et al. (2008) and Mercieca et al. (2007)), the
shift towards non-interest activities for small banks tends to worsen their risk/return trade-off
and/or increase their riskiness. Mercieca et al. (2007) explain this result by a lack of expertise
of small banks in these new lines of businesses. However, according to Chiorrazo et al.
(2008), small banks with very low share of non-interest income may benefit from increased
diversification in such activities. The influence of ownership structure is stressed by Berger et
al. (2010). According to the authors, the diversification discount highlighted for Chinese
banks could be attributed to inefficient incentive schemes and/or to the lack of expertise of
local top managers who are appointed by the government. Moreover, their results indicate that
for banks with foreign presence, the diversification discount is smaller. The mitigating effect
20 We estimate the single index market model over the period [t-100, t] to calculate the value of the beta at date t. 21 Daily stock prices are used to calculate weekly stock returns. The standard deviation of weekly stock returns at date t is computed over the
period [t-100, t]. 22 The single index market model is computed for each trading day over the period [t-100, t]. We use the standard deviation of residuals to
estimate specific risk at date t.
23 R+1
MZ = ζ
where R is the mean of the weekly returns Rt for a given year and ζ is the standard deviation of weekly returns.
14
of foreign ownership is attributed to better managerial expertise and increased monitoring of
bank activities. Focusing on the effect of foreign entry in the Philippine banking industry over
the 1990-1998 period, Unite and Sullivan (2003) show that foreign entry was associated with
an improvement of operating efficiency, a reduction in interest rate spreads and profits,
meaning an increased competition. However, the authors also highlight a deterioration of
bank loan portfolio quality reflected by an increase in loan loss provisions.
The set of regressions we estimate can be summarized by the following general
specification:
it it 1 it 2 it it itY = α + β FOCUSk + β NonInterestIncome + δZ + ε
(13)
where Yit is either a measure of profitability, risk-adjusted profitability or risk ; FOCUSkit is
the measure of diversification ; NonInterestIncomeit is either the share of non-interest income,
its components or their disaggregation; Zit are control variables and αit is a constant.
We use the following control variables – Assets, Growth, Equity, Loans in all our
models.
Assets, is the mean of the natural logarithm of bank assets adjusted to the GDP
deflator. This variable, following Chiorazzo et al. (2008), Behr et al. (2007), Stiroh and
Rumble (2006), and Stiroh (2004a, 2004b) captures the effects of bank size to returns and
risk. Larger-sized banks are able to invest in more advanced technologies and generally, have
better risk management. They are also able to expand into other business lines. We therefore
expect a positive sign on the relationship between assets and profits and negative between
asset and risk.
Growth, is the growth rate of total assets. As in Stiroh (2004b) and Chiorazzo et al.
(2008), we use this variable as a proxy for bank manager‟s preference for risk taking. Banks
with lower risk aversion grow more rapidly and thus, have different operating strategies.
Moreover, it may also be interpreted as control for growth-by-acquisition.
Equity, is the leverage ratio computed as the ratio of total capital to total assets. Banks
that hold a lower level of equity in their asset-liability portfolio tend to be riskier. A higher
level of capital then translates to the bank manager‟s risk aversion. This control variable is
also used by several bank diversification studies (Chiorazzo et al., 2008, Stiroh, 2004b).
15
Loans, is the ratio of total loans to total assets. Consistent with Chiorazzo et al. (2008),
Stiroh and Rumble (2006) and DeYoung and Roland (2001), this variable captures the
performance of bank‟s lending strategies relative to its other earning assets.
We run two-way fixed-effects panel regressions to estimate our models. In performing
these estimations, we check for the appropriateness of our estimation method using the
Hausman test to check whether a fixed effects model is more appropriate than a random
effects model. In addition, we use a Huber/White estimator of variance that is robust to some
types of misspecifications along with the fixed effects model.
Since the alternative dependent variables we use, particularly profitability, show the
tendency to persist in time24
, reflecting impediments to competition, informational
asymmetry, and change in business strategies, we consider that their previous values could
partially determine their current values (Berger et al., 2000). We therefore also estimate our
equations using a dynamic model using the methodology proposed by Arellano and Bover
(1995) and Blundell and Bond (1998). In this approach, the system of equations is estimated
in both first-differences and levels. The two step GMM estimator is used to provide a more
robust inference from the results. However, we also use the one-step estimator25
. Since we are
considering a small sample, the two step standard errors are computed to conform to
Windmeijer‟s (2005) finite-sample correction. We also take into account the possibility that
the explanatory variables might not be strictly exogenous, which is presumably the case of the
non-interest income variables. Following Maudos and Solis (2009), to address this
endogeneity problem, the lagged levels and lagged differences of the explanatory variables
are used as instruments. To determine the consistency of the estimators and verify the validity
of the instruments, we use a Sargan test of over identifying restrictions. Meanwhile, we also
check for the appropriateness of using the Blundell dynamic panel data estimation technique
using the statistic proposed by Arellano and Bond (1991) to test the absence of second-order
serial correlation of the first difference residuals.
Each hypothesis is tested using fixed effects and dynamic panel data estimation on
two alternative specifications, one which includes the variable FOCUSk and another which
does not.
Based on the general specification provided by equation (13), we test the three
following hypotheses: 24 In the banking literature, few studies consider profits to be persistent (Levonian, 1993; Roland, 1997; Eichengreen and Gibson, 2001;
Goddard et al., 2004 ) 25
Results using one-step estimators are not reported but are available from the authors on request.
16
Hypothesis 1: An increase in the share of non-interest income in total operating income is
expected to impact bank profitability and risk. The effect on risk-adjusted profitability will
depend on which effect, risk or profitability, dominates.
Model 1:
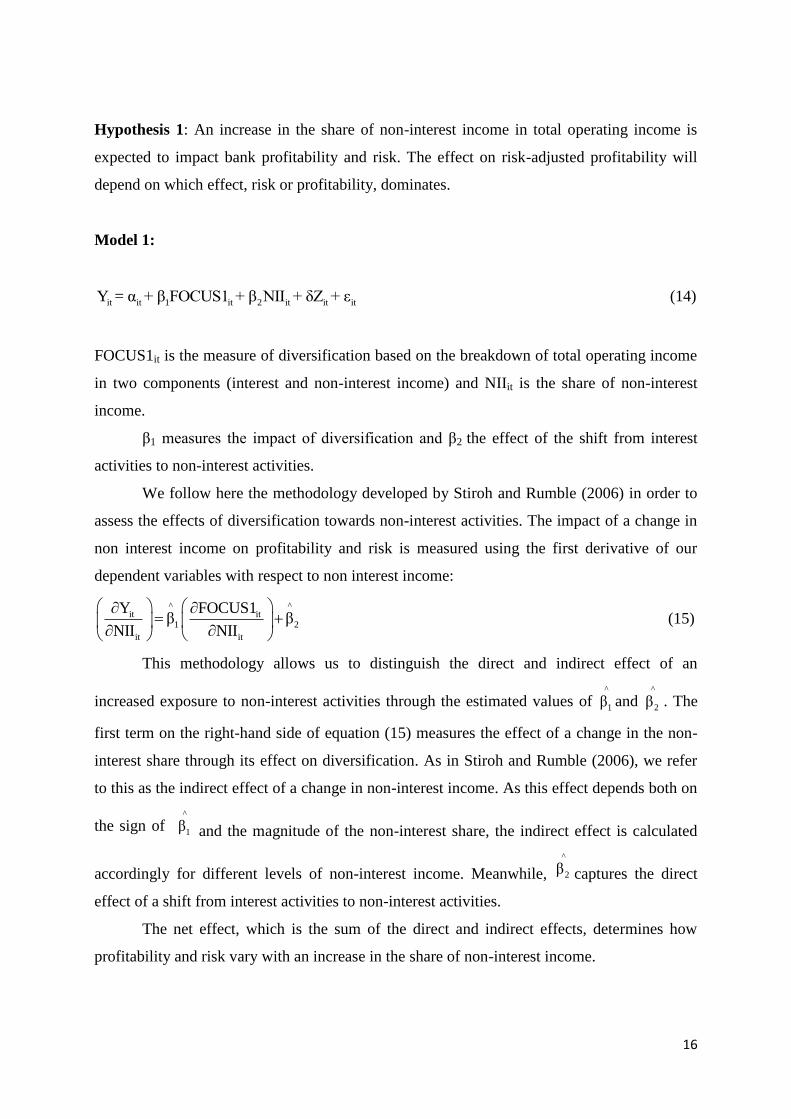
it it 1 it 2 it it itY = α + β FOCUS1 + β NII + δZ + ε (14)
FOCUS1it is the measure of diversification based on the breakdown of total operating income
in two components (interest and non-interest income) and NIIit is the share of non-interest
income.
β1 measures the impact of diversification and β2 the effect of the shift from interest
activities to non-interest activities.
We follow here the methodology developed by Stiroh and Rumble (2006) in order to
assess the effects of diversification towards non-interest activities. The impact of a change in
non interest income on profitability and risk is measured using the first derivative of our
dependent variables with respect to non interest income:
^ ^it it
1 2
it it
Y FOCUS1β β
NII NII
(15)
This methodology allows us to distinguish the direct and indirect effect of an
increased exposure to non-interest activities through the estimated values of ^
1β and ^
2β . The
first term on the right-hand side of equation (15) measures the effect of a change in the non-
interest share through its effect on diversification. As in Stiroh and Rumble (2006), we refer
to this as the indirect effect of a change in non-interest income. As this effect depends both on
the sign of ^
1β and the magnitude of the non-interest share, the indirect effect is calculated
accordingly for different levels of non-interest income. Meanwhile,
^
2β captures the direct
effect of a shift from interest activities to non-interest activities.
The net effect, which is the sum of the direct and indirect effects, determines how
profitability and risk vary with an increase in the share of non-interest income.
17
The dependence however between ^
1β and ^
2β raises econometric issues since NII and
FOCUS1 are collinear. Although both estimates may be unbiased, their variance and
covariance are overestimated (Chiorazzo et al. 2008). Wald tests need to be conducted to
check the joint statistical significance of ^
1β and ^
2β in the various estimations. Moreover, we
also estimate the equation by using only NII to check for robustness.
In order to assess the effect of differences in size, the initial level of diversification in
terms of NII and ownership type, three different specifications of Hypothesis 1 are tested:
Hypothesis 1a: Diversification has a stronger/weaker impact on profitability and risk for
small banks compared to larger banks.
In testing Hypothesis 1a, we estimate Model 1 on sub-samples of large, medium and small-
sized banks and alternatively introduce an interaction term NII*ASSET, which is the product
of the diversification variable and the log of total assets.
Hypothesis 1b: Diversification has a stronger/weaker impact on bank profitability and risk
for banks that are already more diversified in terms of non-interest activities.
In order to assess how the direct and indirect effects differ for different levels of our variables,
we estimate Model 1 at different values of the average non-interest income share (10th, 25th,
50th, 75th and 90th percentiles) and bank size. We also separately interact NII with dummy
variables P25 and P75, which indicate the percentile levels of banks relative to the whole
sample. P25 is equal to 1 if a bank is below the 25th percentile in terms of the average value
of NII, and zero otherwise ; P75 is equal to 1 if a bank is above the 75th percentile of average
NII, and zero otherwise.
Hypothesis 1c: Diversification has a stronger/weaker impact on profitability and risk
according to bank ownership type
In testing Hypothesis 1c, we estimate Model 1 on two sub-samples, one which includes
domestic banks and the other on foreign banks.
18
To go further in the analysis of the effect of the shift towards non-interest activities,
we examine the effect of the different components of non-interest income - fee-based, trading
and other income and their respective disaggregation. This enables us to assess whether or not
different product mixes within non-interest activities have similar effects on profitability and
risk. More specifically, we address two main questions.
We first examine whether correlations between interest income growth and the growth
of the different components of non-interest income might affect the impact of diversification
on banks‟ profitability and risk. As pointed by Stiroh (2004b), the existence of a positive
correlation between interest and non-interest income could be due to cross-selling behavior
and might reduce diversification benefits. The absence of a significant correlation between
growth rates would imply that a bank is engaging inefficient diversification. This could
increase profitability. However, it may also increase risk because of the bank‟s lack of
expertise in modern banking activities. Some papers argue that banks benefit from an increase
in diversification as long as income components are imperfectly correlated (Busch and Kick,
2009). Stiroh (2004a) finds that as the growth rates of net interest and net non-interest income
become increasingly correlated the benefits from diversification decrease. Lepetit et al. (2008)
find that higher reliance on non-interest activities is associated with higher risk but that higher
risk is generated by commission and fee activities rather than trading activities.
Second, we address a specific issue related to the Philippine banking regulation. As
stipulated in the RA 697726
, otherwise known as the Magna Carta for Small Enterprises, all
lending institutions, such as banks are mandated to set aside at least six percent (6%) and at
least two percent (2%) of their total loan portfolio to small and medium enterprises (SMEs),
respectively. This requirement could influence bank asset allocation and in effect their
diversification strategies, as banks can comply with this regulation by acquiring instead
government securities offered by the Small Business Guarantee and Finance Corporation27
.
As highlighted in the literature (Berger and Udell, 2006), small business lending tends to rely
more on relationship lending where banks have to gather soft information. Large banks are
then less likely to be involved in relationship lending and tend to lend more to large firms.
Moreover, foreign banks which do not have the specific knowledge of local domestic markets
26 Republic Act No. 6977 (later amended by Republic Act No. 8929)– An act to promote, develop and assist small and medium scale
enterprises through the creation if a Small and Medium Enterprise Development (SMED) Coucil, and the rationalization of government
assistance, programs and agencies concerned with the development of Small and Medium Enterprises, and for other purposes. It was later amended by Republic Act No. 9501 in 2008 to increase the percentage set aside for small enterprises from six percent (6%) to eight percent
(8%). 27 This organization is now known as the Small Business Corporation.
19
could be disadvantaged in collecting soft information. For these reasons, large banks and
foreign banks in the Philippines could have stronger incentives to comply with the
aforementioned regulation by buying government securities instead of directly granting loans
to small firms. As the detailed breakdown of bank loan portfolio according to firm size is
neither available at the individual level nor for the banking industry in the Philippines as a
whole, we base our investigation on the share of government securities held by banks in their
portfolio. We combine the information provided by two ratios28
: the ratio of government
securities to total assets and the ratio of government securities to total loans. As bank
government securities holding could be motivated either by bank diversification strategy or to
comply with regulation, information provided from the ratio of government securities to total
assets cannot be considered as a pure indicator of whether or not banks comply with the
aforementioned regulation by holding government securities. However, we presume that
banks which exhibit a relatively low share of government securities in terms of total assets do
not need to hold government securities for regulatory purposes because they provide
sufficient amounts of loans to small and medium-sized firms. Conversely, a relatively high
share of government securities in total assets could indicate that banks are purchasing
government securities to limit their lending to small and medium-sized firms. Considering the
ratio of government securities to total loans, we conjecture that banks with such a ratio greater
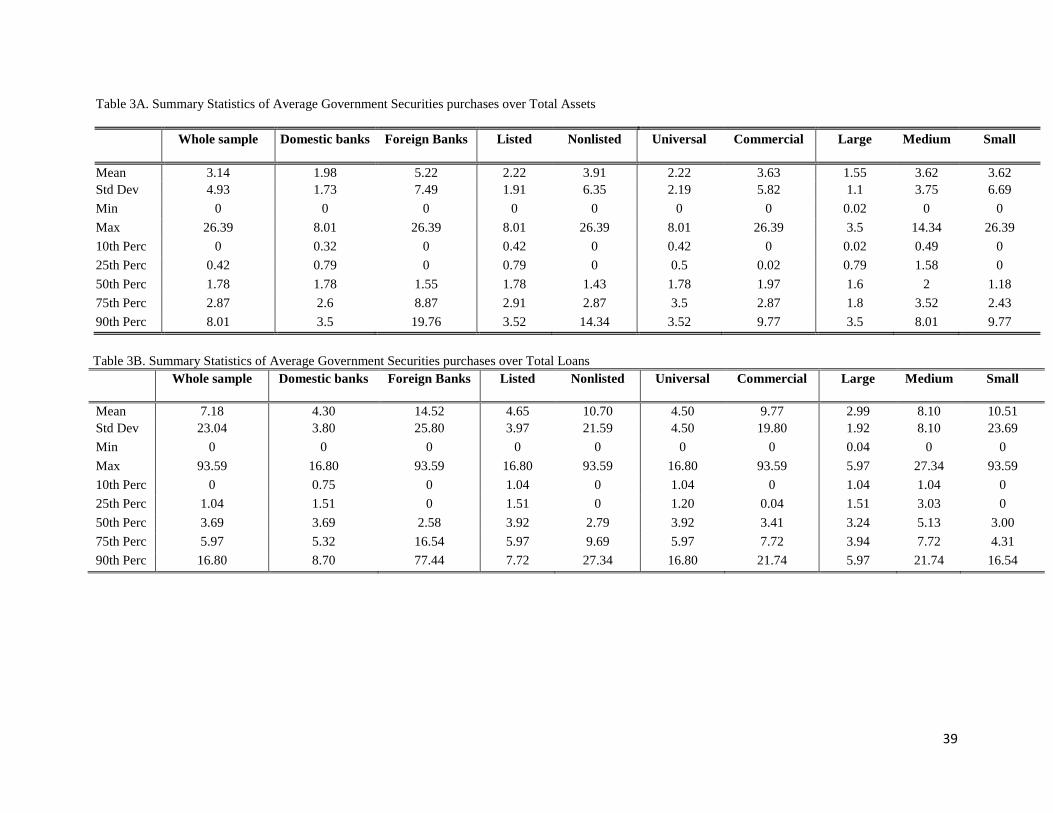
than 8% purchase government securities in lieu of lending to SMEs. As highlighted in Table
3A and 3B, government securities‟ holding strongly differs according to ownership type and
bank size. Foreign banks exhibit a larger share of government securities in total assets than
domestic banks (5.22% for foreign banks in comparison with 1.98% for domestic banks). On
the other hand, large banks present a smaller share of government securities in total assets
(1.55%) compared with smaller banks (3.62% for both medium-sized and small banks).
Majority of the considered small banks, however, are foreign banks. In our investigation, we
consider the lower (25th
) and upper (90th
) percentiles in order to distinguish banks which hold
respectively relatively small and large amounts of government securities in % of total assets.
Banks that belong to the 25th
percentile hold government securities over total loans on the
average, equal to 0.1%, which comprises banks that barely hold government securities. On the
other hand, banks belonging to the 90th
percentile hold on the average, 35.02% of government
securities over total loans, which is way above the 8% required alternative compliance of
combined allocation for both small and medium enterprises. We construct three dummy
28 We use the ratio of government securities to total assets and the ratio of government securities to total loans averaged over the time period
for each bank.
20
variables, two which are based on the ratio of government securities to total assets,
COMP_LEND and COMP_GOVSEC and one which is based on the ratio of government
securities to total loans, COMP_GOVSEC2. COMP_LEND takes the value of 1 if the ratio of
government securities to total assets is lower than the 25th
percentile and the value of 0,
otherwise. This variable corresponds to banks, which do not need to hold government
securities to comply with the obligation of lending to SMEs. COMP_GOVSEC is equal to 1 if
the ratio of government securities to total assets is higher than the 90th
percentile and
otherwise, 0. This variable represents banks that limit their lending to SMEs, hence the need
to purchase government securities. COMP_GOVSEC2 is a dummy variable that is equal to 1
if the ratio of government securities over total loans is greater than 8%, and 0, otherwise. This
variable characterizes banks that do probably not lend enough to SMEs and in lieu, hold
government securities. Banks with a ratio of government securities over total loans less than
8%, on the other hand, are those that lend to SMEs.
Hypothesis 2: Different product mixes within non-interest activities will differently affect
profitability and risk. Specifically the holding of government securities to comply with
regulation on lending to small and medium-sized firms will alter the relationship between
diversification and profitability/risk.
This hypothesis will be first tested by using a three-level breakdown of noninterest
activities (Model 2a and Model 2a‟).
Model 2a:
it it 1 it 2 it 3 it 4 it it itY = α + β FOCUS2 + β FEE + β TRAD + β Other + Z + ε (16)
FOCUS2it is the measure of diversification based on the breakdown of non-interest income in
three components (fee-based, trading and other incomes); FEEit, TRADit and Otherit are the
shares of fee-based income, trading income and other noninterest income, respectively, in
total operating income.
21
Model 2a’:
it it 1 it 2 it 3 it 4 it 2 it 3 it 4 it it itY = α + β FOCUS2 + β FEE + β TRAD + β Other + FEECompliance + TRADCompliance + OtherCompliance + Z + ε
(17)
Where Compliance is either COMP_LEND, COMP_GOVSEC or COMP_GOVSEC2.
FEECompliance, TRADCompliance and OtherCompliance are interaction terms between the
diversification measures and our proxies to distinguish banks that comply with regulation by
holding government securities from those that are purchasing such securities simply to freely
diversify their portfolios. These interaction terms capture the influence of regulation on the
impact of diversification on profitability and risk-adjusted profitability.
Availability of a more detailed breakdown within fee-based and trading activities
allows us to go further and to assess, within each category, whether some sources play an
important role in the link between diversification and bank risk/profitability (Model 2b and
2b‟)29
.
Model 2b:
it it 1 it 21 it 22 it 23 it 3 it 4 it it itY = α + β FOCUS3 + β BC + β SC + β OC + β TRAD + β Other + Z + ε (18)
Model 2b’:
it it 1 2 it 31 it 32 it 33 it 34 it 35 it 4 it it itY α β FOCUS4 β FEE β GS β PD β FF β PI β FP β Other Z εit (19)
FOCUS3it and FOCUS4it are measures of diversification within respectively detailed fee-
based and trading incomes; BCit, SCit and OCit are the three components of fee-based
activities and represent the shares of respectively bank commissions, service charges and
other commissions in total operating income. GSit, PDit, FFit, PIit and FPit are the five
components of trading activities and represent the shares of respectively government
29 We do not estimate model 2a‟ with a more detailed breakdown because it lowers significantly the degrees of freedom of the estimated
(losses), profit from investment and foreign exchange profits in total operating income.
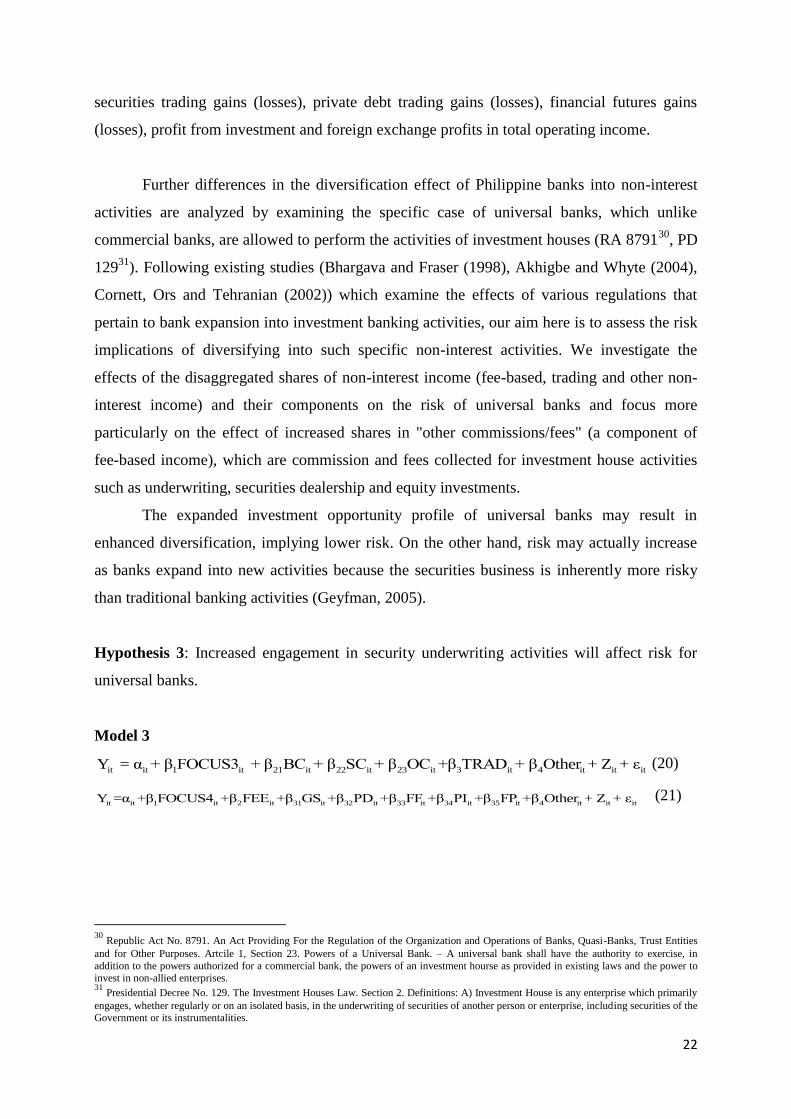
Further differences in the diversification effect of Philippine banks into non-interest
activities are analyzed by examining the specific case of universal banks, which unlike
commercial banks, are allowed to perform the activities of investment houses (RA 879130
, PD
12931
). Following existing studies (Bhargava and Fraser (1998), Akhigbe and Whyte (2004),
Cornett, Ors and Tehranian (2002)) which examine the effects of various regulations that
pertain to bank expansion into investment banking activities, our aim here is to assess the risk
implications of diversifying into such specific non-interest activities. We investigate the
effects of the disaggregated shares of non-interest income (fee-based, trading and other non-
interest income) and their components on the risk of universal banks and focus more
particularly on the effect of increased shares in "other commissions/fees" (a component of
fee-based income), which are commission and fees collected for investment house activities
such as underwriting, securities dealership and equity investments.
The expanded investment opportunity profile of universal banks may result in
enhanced diversification, implying lower risk. On the other hand, risk may actually increase
as banks expand into new activities because the securities business is inherently more risky
than traditional banking activities (Geyfman, 2005).
Hypothesis 3: Increased engagement in security underwriting activities will affect risk for
universal banks.
Model 3
it it 1 it 21 it 22 it 23 it 3 it 4 it it itY = α + β FOCUS3 + β BC + β SC + β OC +β TRAD + β Other + Z + ε (20)
it it 1 it 2 it 31 it 32 it 33 it 34 it 35 it 4 it it itY =α +β FOCUS4 +β FEE +β GS +β PD +β FF +β PI +β FP +β Other + Z + ε (21)
30
Republic Act No. 8791. An Act Providing For the Regulation of the Organization and Operations of Banks, Quasi-Banks, Trust Entities
and for Other Purposes. Artcile 1, Section 23. Powers of a Universal Bank. – A universal bank shall have the authority to exercise, in
addition to the powers authorized for a commercial bank, the powers of an investment hourse as provided in existing laws and the power to invest in non-allied enterprises. 31 Presidential Decree No. 129. The Investment Houses Law. Section 2. Definitions: A) Investment House is any enterprise which primarily
engages, whether regularly or on an isolated basis, in the underwriting of securities of another person or enterprise, including securities of the Government or its instrumentalities.
23
4. Estimation Results
4.1 Non-interest activities affect both bank profitability and risk
The first hypothesis aims to analyze the link between diversification and profitability
and risk. The findings, reported in Table 4A, indicate that increased reliance on non-interest
activities has a positive effect on profitability (columns 1, 5, 9, 11, 13 and 15)32
. Moreover,
we find a negative and significant effect of the variable FOCUS133
using dynamic panel data
estimation (columns 9 to 12), indicating a positive effect of increased diversification on
profitability. On average, increased diversification in non-interest activities improves the
profitability of Philippine banks. We also show that an increase in the share of non-interest
income does not affect the volatility of bank returns (columns 4 and 8). However, results
regarding risk-adjusted profitability are mixed. We obtain a positive and significant effect of
an increased reliance on non-interest activities on risk adjusted return, only when using the
indicator suggested in Chiorazzo et al. (2008), (columns 3, 7, 10, 12, 14, and 16). Estimates of
the direct, indirect and net effect of an increased exposure to non-interest activities evaluated
at the 10th, 25th, 50th, 75th and 90th percentiles show that the net effect on profitability and
risk adjusted return is positive and in most cases significant (Table 4B). Moreover, the size of
the effect decreases with the level of non-interest income; the potential benefits on
profitability are stronger for banks which have a lower level of non-interest income.
We also investigate the effect of diversification on risk over a restricted sample of
listed banks using market-based measures of risk. Our results (Table 5) indicate that
diversification into non-interest activities does not affect risk taking and results in a lower
level of default risk (higher level of the Z-score used as a proxy of the probability of default).
However, when restricting the sub-sample of listed banks to listed universal banks, we find
for all market-based measures that an increased reliance on non interest activities tends to
decrease bank risk taking and default risk.
Overall, our findings suggest that an increased diversification in non-interest activities
increases profitability but does not necessarily lead to more volatile returns. These results are
not in line with those of US banking studies that find a positive relationship between increases
in shares of non-interest income and returns' volatility (Stiroh and Rumble, 2006, Stiroh,
32
Tables provided in the paper present the results obtained using ROA, SHROA, ADJROA and SDROA. Estimations are also conducted
using ROE, as performance variables. As results obtained are in most cases similar, they are not provided here but are available upon
request. 33Estimations conducted with FOCUSDIV variable show similar results than those presented in Table 4. We show that banks which present a
level of diversification greater than 50% have a greater profitability and risk adjusted return. We do not report the table of results but they are
available upon request.
24
2004b and De Young and Roland, 2001). However, as in Chiorazzo et al. (2008) and Wolfe
and Sanya (2011), we find a positive relationship between diversification and risk-adjusted
performance.
When investigating differences in bank size (H1a), we find that increased reliance on
non-interest activities has a positive impact on profitability and risk adjusted return only for
smaller banks (Table 6A)34
. However, the net effect is significant only for small banks which
have an intermediate or high level of diversification (Table 6B). For the group of large banks
which excludes the government banks, diversification positively affects risk-adjusted return.
Moreover, the net effect is significant at low and intermediate level of diversification (below
50th) and its size decreases with the level of diversification in non-interest activities. As
smaller banks have lower average shares of non-interest income (32.22% for small banks in
comparison with 39% for medium-sized banks and 38.12% for large banks), these results are
consistent with those presented in Table 8. Analyzing the impact of differences in the level of
involvement in non-interest activities (H1b), we show that diversification into non-interest
generating activities increases profitability but only for banks which have lower levels of
diversification.
Although some studies highlight a potential negative effect of diversification on small
bank performance (Mercieca et al., 2007), our findings are consistent with other studies
(Chiorazzo et al., 2008, Stiroh, 2004a), which find that there are some opportunities for
smaller banks to diversify. Moreover, the decreasing impact of diversification when bank size
and level of diversification increase is in line with the existing literature which stresses limits
from diversification gains as a bank gets larger. Since larger banks are generally more
diversified, their gains from further diversification are limited as possible saturation occurs
upon reaching an optimum level and size (Demsetz and Strahan, 1997; Stiroh and Rumble,
2006; Chiorazzo et al., 2008).
Some differences according to ownership characteristics can also be highlighted
(H1c). The results are presented in Tables 9A and 9B. They show a positive and significant
effect of the variable NII on profitability and a net positive effect of increased exposure in
non-interest activities on risk adjusted return. In both cases, the effect is stronger for foreign
banks.
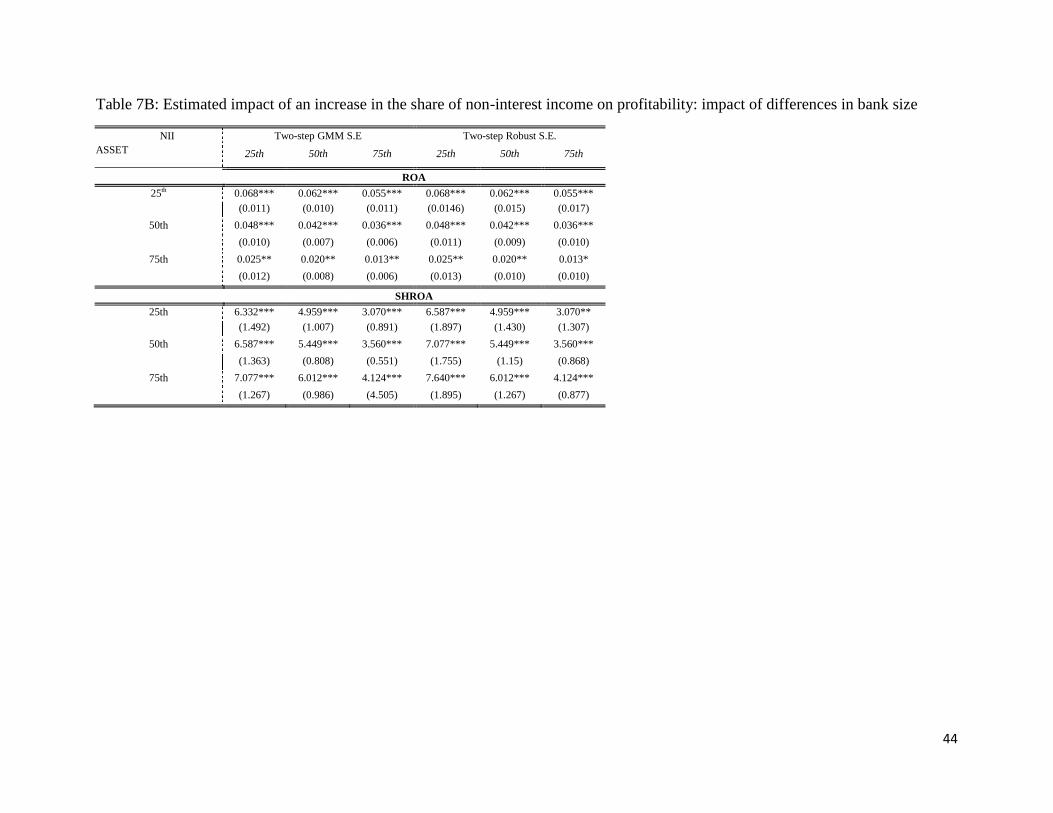
34 Using the interaction term, NII*Asset, we find similar results (Table 7A and 7B), which suggest that increased exposure in non-interest income benefits more small banks that have asset sizes which are below the 25th percentile in terms of increased profitability.
25
4.2 The effects of the disaggregated non-interest income components on profitability and
risk
To go further and examine which sources of non-interest income drive the effect of
diversification on profitability and risk, we analyze the impact of the three components of
non-interest income – fee-based, trading and other income and of their disaggregation on our
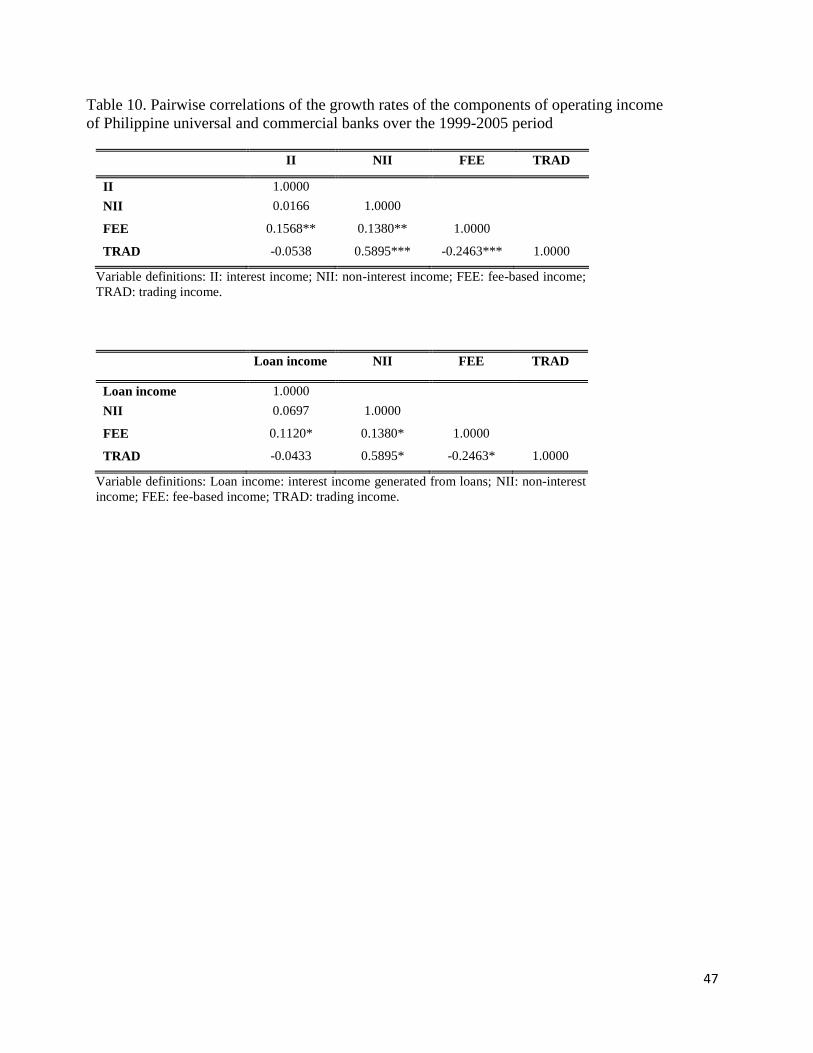
profitability and risk measures. We first examine the pairwise correlations of the growth rates
of operating income, its components (interest income and non-interest income) and the non-
interest income components (fee-based income, trading income and others non-interest
income). We find that interest income growth is correlated with fee-based income growth at a
5% level of significance possibly due to cross-selling or that fee-based activities complement
the traditional intermediation role of the bank (Table 10). We would have expected
profitability to increase as a consequence of increased engagement in fee-based activities due
to lower costs that are to be incurred when engaging in these activity types. However, we note
that the proportion of loans in total assets has decreased over the period of our study along
with the related revenue streams generated from this asset component that includes fee-based
income. Income from fee-based activities35
relies basically on bank commissions and service
charges that are linked to the amount of loans drafted by the banks. Meanwhile, we do not
find any significant correlation between interest income growth rate and trading income and
other non-interest income growth.
The results of Model 2a are presented in Table 11. We find a negative and significant
influence of an increased share of fee-based income on profitability using dynamic panel data
estimation (columns 9 and 13) and, in most cases, no significant effect on risk adjusted return
and risk. From the results on the pairwise correlations, we thus expect an enhancement of
bank performance attributed to the engagement in trading activities. We find trading income
to have a positive and significant effect in explaining bank profitability (columns 5, 9, 13 and
15) and risk adjusted return (columns 2, 6, 10, 14 and 16). Moreover, we do not find a
significant effect of an increased share of trading income on the volatility of returns.
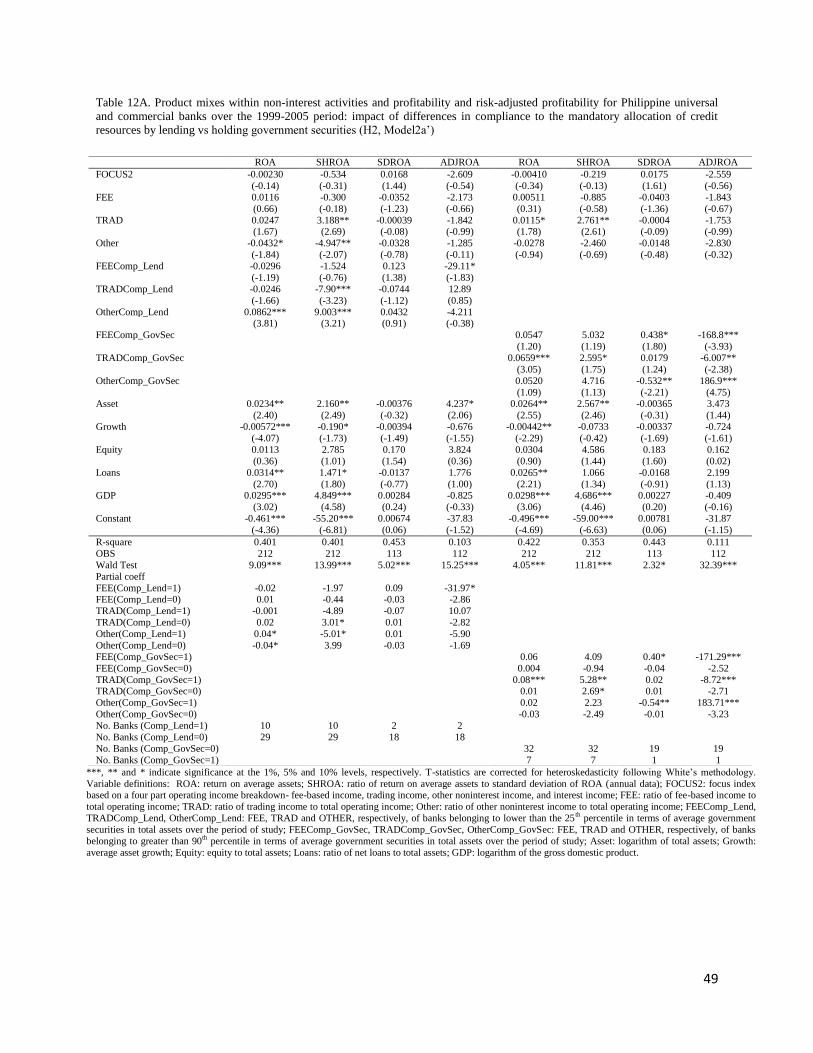
Estimations conducted on Model 2a‟ show that the positive effect of trading income on
profitability is significant only for banks with a relatively high share of government securities
(Table 12A, 12B) or the banks that hold and purchase government securities non-optimally to
comply with the regulation that mandates banks to lend to SMEs.
35 We note however that other commissions/fees, a component of fee-based come are not necessarily functions of bank loans and of the interest generating activities of the banks.
26
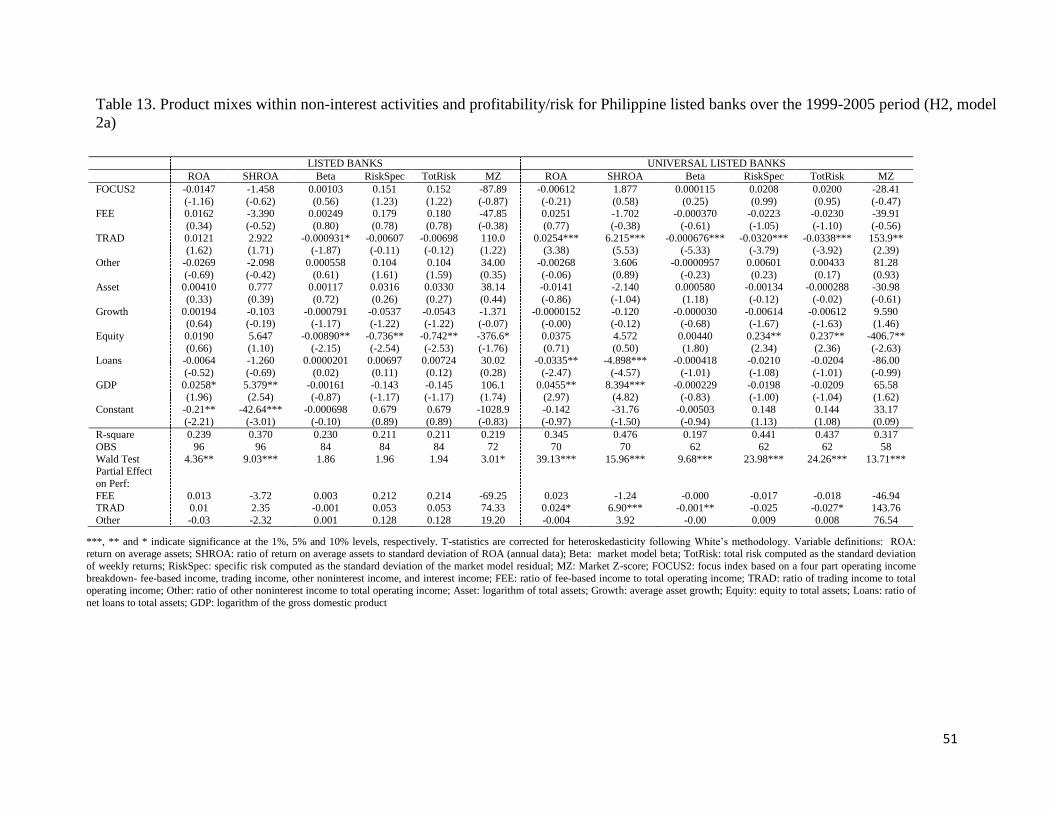
When conducting our investigation on the restricted sub-sample of listed banks (Table
13), we do not find a significant effect when considering the whole sample of listed banks.
However, we show that increased reliance on trading activities reduces risk for universal
listed banks.
These findings are not in line with studies on US banks (i.e. Stiroh, 2004b) which
report higher risk for banks more reliant on trading activities. However, for European banks,
Lepetit et al. (2008) do not find evidence of a positive relationship between trading activities
and risk and, in the case of small banks, they show that a higher share of trading activities is
associated with lower asset and default risk.
Econometric investigations conducted on the detailed breakdown of fee-based and
trading activities (Model 2b and 2b‟) provide a clearer insight of how different product mixes
within non-interest activities affect profitability and risk. Two main results are highlighted.
First, in the case of fee-based activities, we find that an increased share of “other commissions
and fees” to total operating income is associated with increased profitability, while increased
reliance on bank commissions negatively affect risk-adjusted returns (Table 14A). The second
result relates to trading activities (Table 14B). We find that the positive effect of an increase
in the share of trading income on profitability is mainly driven by government securities
trading and financial futures activities. The interpretation of diversification must be given
utmost care as the decision to purchase government notes, securities and negotiable securities
can be a means by banks to comply with the requirement on banks to set aside at least six
percent and two percent of their total loan portfolio for small and medium enterprises,
respectively. Thus, if the link between diversification and profitability and risk is driven by
gains from trading government securities, it may purely be attributable to compliance and not
to optimal diversification.
4.3 Does diversification into underwriting activities alter profitability and risk?
Finally, we focus on the diversification behavior of universal banks and more
specifically on the effect of the involvement of universal banks in investment house activities
which cannot be performed by commercial banks (H3). This dimension can be captured by
the component of fees generated by operations such as underwriting, securities dealership and
equity investments. We report the results in Tables 15 and 16. We find that higher shares of
"other commissions and fees," i.e. generated by investment banking operations, are associated
with higher risk, while higher shares of income from trading government securities have the
opposite effect. Risk is also reduced for banks with higher portions of trading gains from
27
private debt and equities securities as well as profit from sale of investments. On the whole,
we find that increased engagement in non-interest activities is associated with lower risk but
this result is essentially driven by trading activities and more specifically, by trading
government securities. Higher involvement of universal banks in underwriting activities and
securities dealership actually increases risk.
5. Robustness Checks36
Several robustness checks are performed to examine whether different definitions of
our variables will leave the main results unchanged. First, we compute alternative measures of
the variable FOCUSDIV. FOCUSDIV is equal to the interaction between FOCUS1 and a
dummy variable, DIV1, which is equal to 1 if the share of non-interest income is higher than
50% and zero, otherwise. We examine different thresholds of DIV1, 30%, 40% and 60% and
find that at a threshold of non-interest income less than 40%, focus does not translate into
increased bank profitability. Moreover, with thresholds greater than 40%, we find that focus
increases bank profitability. Our results are very robust to the 60% and 70% thresholds which
confirm that focusing in activities that generate non-interest income increases the profitability
of Philippine banks.
Second, we use a more limited definition of trading income, which includes only the
gains/losses from trading activities (government securities, private/equity securities, financial
futures options/forwards/swaps). When this definition is used, we find "other non-interest
income" to be positively related to profitability and risk, markedly in medium-sized banks.
This can be explained by the addition of foreign exchange profit, gold trading gain/loss and
the profit on sale or redemption of investments in our definition of "other non-interest
income", which basically drives up bank profitability. The results however regarding trading
income remain unchanged.
Third, we use another definition to categorize large banks, taking the top ten banks
with the largest average assets over the period of our study. We thereby only consider 11
medium-sized banks. The results on the variables of interest remain unchanged. In addition,
we observe that for large banks our non-interest income focus measure (FOCUSDIV) is no
longer significant, which further strengthens our conjecture that deeper focus in non-interest
activities does not improve performance for large banks.
36 For the sake of brevity, we do not report all the results discussed under the section of robustness check. However, the results are available from the authors on request.
28
Lastly, we also examine if there are significant behavioral differences between listed
and non-listed banks. We do not find significant differences over these two subsamples.
6. Conclusion
The aim of this paper is to analyze the impact of revenue diversification on risk and
profitability in the Philippine banking industry and to investigate the influence of a specific
bank regulation which compels bank to allocate a minimum portion of their loans to small and
medium enterprises or hold government securities instead. On the whole, we find that while
increased engagement in noninterest activities tends to be more profitable, there is not much
evidence regarding the volatility of bank returns. Moreover, in some cases, we find a positive
link between diversification and risk-adjusted returns which is not consistent with the results
obtained in the literature for US banks. A closer investigation reveals that fee-based income
growth is significantly correlated with interest income growth, and that trading activities are
generally dominated by trading in government securities, which are inherently less risky than
other income sources. By disaggregating the share of non-interest income, we find trading
income, particularly the gains from trading government securities to be the primary force
behind the positive relationship between profitability and diversification. The positive effect,
however, of trading activities on profitability holds only for banks that have a relatively high
share of government securities in total assets or banks that comply to the mandatory allocation
of credit resources to SMEs by alternatively purchasing government securities.
We also test whether bank size matters in gaining benefits from diversification. Our
findings indicate that small banks gain more from increased diversification as benefits for
large banks tend to be saturated after reaching an optimal size. Furthermore, we find that
diversification into non-interest generating activities increases profitability but only for banks
which have lower levels of diversification as banks with higher levels of diversification have
already exhausted the benefits of further diversification. In addition, our results indicate that
for universal banks a higher involvement in fee-based activities, particularly in commission
activities that generate income related to underwriting and securities dealership, increases
bank risk. Moreover, we find evidence that trading in government securities contributes to
lower risk, driving the negative relationship between risk and the share of non-interest
activities in total activities.
As a whole, we find that isolating the analysis of diversification only on focus indices
and non-interest income shares can mislead result interpretations. The level of income is as
29
important as its sources as some are inherently riskier and are more profitable, and some are
governed by regulations and laws. The implementation of a regulation to promote lending to
small and medium enterprises might have reached an unexpected goal preventing banks from
being more exposed to risk induced by the development of non-interest activities in the
banking sector.
30
APPENDIX 1: Definitions
NONINTEREST INCOME ACCOUNTS
Fee-based Income: sum of bank commissions, service charges/fees and other commissions/fees
Bank Commissions: commissions collected for services rendered as in: (a) opening of letters of
credit, (b) handling of collection items, domestic/export/import bills and telegraphic transfers, and (c)
sale of demand drafts, traveller‟s checks and government securities
Service charges: charges/fees, including commitment fees, collected for services rendered as in: (a)
handling of loans and transactions and returned checks, (b) sale of manager‟s checks.
Fees/commissions (others): fees and commissions earned and collected for services rendered in
connected with the investment house functions of the bank such as underwriting, securities dealership
and equity investments.
Trading income: sum of trading gain from government securities, private securities/commercial
trading gain/loss; profit on sale or redemption of investments.
Trading gain (government securities): gain or loss on government securities traded in money market
operations.
Trading gain (private securities/commercial papers/equity securities): gain or loss in private
securities/commercial papers/equity securities traded by the bank.
Trading gain (financial futures/options/forwards/swaps): trading profits and loss (both realized and
“mark-to-market”) arising from financial futures/options/forward/swap trading transactions.
Foreign exchange profit: realized profit or actual loss incurred on foreign exchange transactions,
including profit or loss arising from the adjustment of the peso equivalent of foreign monetary
accounts consisting of foreign currencies on hand, due from foreign banks and short-term
receivables/payables.
Profit on sale or redemption of investments: profits earned or loss incurred on the sale or
redemption of investments.
Other noninterest income: sum of income from trust department and other income
Income (trust department): commissions and other income earned and collected or loss suffered by
the bank‟s trust department in the handling/administration of trust accounts.
Other income: rental income and miscellaneous income
(Source : Manual of Accounts for Universal and Commercial Banks, Central Bank of the Philippines)
31
APPENDIX 2
Table 1. Sample description, universal and commercial banks in the Philippines, 1999-2005
Category Description Total SIZE (in billion pesos) 39 Large Average Asset >140 8 Large excluding state banks 6 Medium 30<Average Asset <140 13 Small Average Asset<30 18 LISTED VS UNLISTED Listed 16 Unlisted 23 DOMESTIC VS FOREIGN Domestic 23 Foreign 18 UNIVERSAL VS COMMERCIAL Universal 14 Universal excluding state banks 12 Commercial 9
32
References
Akhigbe, A., Whyte, A.M., 2004. The Gramm-Leach-Bliley Act of 1999: Risk Implications
for the financial services industry. The Journal of Financial Research, 27(3): 435-446.
Arellano, M., Bond, R.M., 1991. Some test of specification for panel data: Monte Carlo
evidence and application to employment equations. Review of Economic Studies, 58 (2), 277-
297.
Arellano, M., Bover, O., 1995. Another look at the instrumental-variable estimation of error-
components models. Journal of Econometrics, 68(1): 29-51
Baum, C., 2006. An Introduction to Modern Econometrics using Stata. TX: Stata Press
Publication.
Behr, A., Kamp, A., Memmel, C., Pfingsten, A., 2007. Diversification and the banks‟ risk-
return-characteristics- evidence from loan portfolio of German banks. Deutsche Bundesbank,
Discussion Paper, Series 2: Banking and Financial Studies.
Berger, A. N., Hasan, I., Zhou, M., 2010. The effects of focus versus diversification on bank
performance: Evidence from Chinese banks. Journal of Banking and Finance, 34: 1417-1435.
Berger, A., Udell, G.F., 2006. A More Complete Conceptual Framework for Financing of
Small and Medium Enterprises. Journal of Banking and Finance.
Berger, A.N., Bonime, S,.D., Covitz, D.M., Hancock, D., 2000. Why are bank profits so
persistent? The roles of product market competition, informational opacity, and
regional/macroeconomic shocks. Journal of Banking and Finance, 24:1203-1235
Bhargava, R., Fraser, D., 1998. On the wealth and risk effects of commercial bank expansion
into securities underwriting: An analysis of Section 20 subsidiaries. Journal of Banking and
Finance, 22: 447-465.
Blundell, R.W., Bond, S.R., 1998. Initial conditions and moment restrictions in dynamic
panel data models. Journal of Econometrics, 87: 115-143
33
Boyd, J. H., Graham, S.L., Hewitt, R.S., 1993. "Bank holding company mergers with
nonbank financial firms: effects on the risk of failure" Journal of Banking and Finance, 17 (1):
43-63.
Busch, R., Kick, T., 2009. Income diversification in the German banking industry. Discussion
Paper Series 2: Banking and Financial Studies No. 9.
Chiorazzo, V., Milani, C., Salvini, F., 2008. Income Diversification and Bank Performance:
Evidence from Italian Banks. Journal of Financial Services Research, 33: 181-203.
Claessens, S., Demirgüç-Kunt, A., Huizinga, H., 2001. How Does Foreign Entry Affect
Domestic Banking Markets?. Journal of Banking and Finance, 25(5): 891-911.
Clarke, G., R. Cull, Martinez-Peria M. S., 2006. Foreign bank participation and access to
credit across firms in developing countries. Journal of Comparative Economics, 34: 774-795.
Cornett, M., Ors, E., Tehranian, H., 2002. Bank performance around the introduction of a
Section 20 subsidiary. The Journal of Finance, 57(1): 501-523.
De Nicolo, G., Loukoianova, E., 2007. Bank Ownership, Market Structure and Risk, IMF
Working Paper, 07/215.
Demsetz, R.S., Strahan, P.E., 1997. Diversification, size and risk at bank holding companies.
Journal of Money, Credit and Banking, 29(3): 300-313.
Detragiache, E., Tressel T., Gupta P., 2008. Foreign Banks in Poor Countries: Theory and
Evidence, Journal of Finance, 5, 2123-2160
DeYoung, R., Roland, K.P., 2001. Product mix and earnings volatility at commercial banks:
evidence from a degree of leverage model. Journal of Financial Intermediation, 10(1):54-84
Eichengreen, B., Gibson, H.D., 2001. Greek banking at the dawn of the new millennium.
CERP Discussion Paper 2791, London.
Financial Access 2010 Report. Consultative Group to Assist the Poor/The World Bank Group.
34
Geyfman, V., 2005. Banks in the Securities Business: Market-Based Risk Implications of
Section 20 Subsidiaries. Working Paper No. 05-17.
Gochoco-Bautista, M., 1999. The Past Performance of the Philippine Banking Sector and
Challenges in the Postcrisis Period, Rising to the Challenge in Asia: A Study of Financial
Markets, Philippines, Asian Development Bank, 10, 29-77.
Goddard, J., Molyneux, P., Wilson, J.O.S, 2004. The profitability of European banks: a cross-
sectional and dynamic panel analysis. Manchester School 72(3), 363-381.
Gormley, T. A., 2010. The impact of foreign bank entry in emerging markets: Evidence from
India, Journal of Financial Intermediation, 19, 26-51
Lensink, R., Hermes, N., 2003. The Short-term Effects of Foreign Bank Entry on Domestic
Bank Behaviour: Does Economic Development Matter?. Journal of Banking and Finance, 27.
Lepetit, L., Nys, E., Rous, P., Tarazi, A., 2008a. Bank income structure and risk: An
Empirical Analysis of European Banks. Journal of Banking and Finance, 32: 1452-1467.
Lepetit, L., Nys, E., Rous, P., Tarazi, A., 2008b. The expansion of services in European
banking : implications for loan pricing and interest margins. Journal of Banking and Finance,
32 (11): 2325-2335.
Maudos, J., Solis, L., 2009. The determinants of net interest income in the Mexican banking
system: an integrated model. Journal of Banking and Finance, 33: 1920-1931.
Mercieca, S., Schaeck K., Wolfe S., 2007. Small European banks: Benefits from
Diversification? Journal of Banking and Finance, 31, 1975-1998
Roland, K., 1997. Profit persistence in large US bank holding companies: An empirical
investigation. OCC Working Paper.
Shleifer A., 1998. State versus private ownership, Journal of Economic Perspectives, 12, 133-
150
35
Shleifer A.,Vishny R.W., 1998. The grabbing hand: government pathologies and their cures,
Harvard University Press, MA
Stiroh, K.J., 2004a. Do community banks benefit from diversification? Journal of Financial
Service Research, 25 (2-3): 135-160
Stiroh, K.J., 2004b. Diversification in banking: is noninterest income the answer? Journal of
Money, Credit and Banking, 36(5): 853-882.
Stiroh, K.J., 2006. New Evidence on the Determinants of Bank Risk Journal of Financial
Service Research, 30: 237-263
Stiroh, K.J., Rumble, A. 2006. The dark side of diversification: the case of U.S. financial
holding companies. Journal of Banking and Finance, 30(8): 2131-2161
Unite, A., Sullivan, M., 2003. The Effect of Foreign Entry and Ownership Structure on the
Philippine Domestic Banking Market. Journal of Banking and Finance, 27: 2323-2345.
Windmeijer, F., 2005. A finite sample correction for the variance of linear efficient two-step
GMM estimators. Journal of Econometrics. 126 (1): 25-51
Wolfe, S., Sanya, S., 2011 Can banks in Emerging countries benefit from revenue
diversification?, Journal of Financial Services Research, forthcoming
Wooldridge, J., 2001. Introductory Economics: A Modern Approach, 3rd
edition.
36
Table 2A: Descriptive statistics for Philippine universal and commercial banks over the 1999-2005 period
Whole sample Large Banks Large Banks excluding government banks Medium-sized Banks Small Banks
Variable definitions (All variables are expressed in percentage except for total assets, which is expressed in billion pesos) Loans: ratio of net loans to total assets; Equity: ratio of equity to total assets; Deposits: ratio of total deposits to total assets; NII: ratio of noninterest income to total net operating income; FEE: ratio of fee-based income to total net operating income; BC: ratio of bank commissions and fees to total net operating
income; SC: ratio of service charges to total net operating income; OC: ratio of other commissions and fees to total net operating income; TRAD: ratio of trading income to total net operating income; GS: ratio of income
from trading government securities to total net operating income; PD: ratio of income from trading private debt/equity to total net operating income; FF: ratio of income from trading financial futures and other derivatives
to total net operating income; PI: ratio of profit from sale of investments to total net operating income; FP: ratio of foreign exchange profit to total net operating income; Other: ratio of other noninterest income to total net
operating income; ROA: return on average asset; ROE: return on average equity.
37
Table 2A (continued). Descriptive statistics for Philippine universal and commercial banks over the 1999-2005 period
Variables definitions (All variables are expressed in percentage except for total assets, which is expressed in billion pesos) Loans: ratio of net loans to total assets; Equity: ratio of equity to total assets; Deposits: ratio of
total deposits to total assets; NII: ratio of noninterest income to total net operating income; FEE: ratio of fee-based income to total net operating income; BC: ratio of bank commissions and fees to total net operating income; SC: ratio of service charges to total net operating income; OC: ratio of other commissions and fees to total net operating income; TRAD: ratio of trading income to total net operating income; GS: ratio of income
from trading government securities to total net operating income; PD: ratio of income from trading private debt/equity to total net operating income; FF: ratio of income from trading financial futures and other derivatives
to total net operating income; PI: ratio of profit from sale of investments to total net operating income; FP: ratio of foreign exchange profit to total net operating income; Other: ratio of other noninterest income to total net
operating income; ROA: return on average asset; ROE: return on average equity.
38
Table 2B: Non-interest income components for Philippine universal and commercial banks over the 1999-2005 period (in %)
Whole sample Domestic banks Foreign banks Large banks Medium-sized banks Small banks Universal banks Commercial banks
Other 16.70 19.50 11.50 23 16.30 13.20 20.60 14.50
Variables definitions: Fee-based activities: ratio of fee-based income to non-interest income; Bank commission: ratio of bank commissions and fees to fee-based income ; Service charges: ratio of service charges to fee-based income; Other commissions: ratio of other commissions and fees to fee-based income; Trading activities: ratio of trading income to non-interest income; Government securities: ratio of income from trading
government securities to trading income; Private debt/equity: ratio of income from trading private debt/equity to trading income; Financial futures: ratio of income from trading financial futures and other derivatives to
trading income; Profit from sale of inv: ratio of profit from sale of investments to trading income; Other: ratio of other non-interest activities to non-interest income.
39
Table 3A. Summary Statistics of Average Government Securities purchases over Total Assets
Whole sample Domestic banks Foreign Banks Listed Nonlisted Universal Commercial Large Medium Small
.Table 4A. Income diversification and profitability/risk for Philippine universal and commercial banks over the 1999-2005 period (H1)
***, ** and * indicate significance at the 1%, 5% and 10% levels, respectively. T-statistics are corrected for heteroskedasticity following White‟s methodology for the fixed effects panel regression. Variable definitions: ROA: return on average assets; SDROA: standard deviation of ROA (quarterly data); ADJROA: ratio of mean of return on average assets to standard deviation of ROA (quarterly data); SHROA: ratio of
return on average assets to standard deviation of ROA (annual data); FOCUS1= focus index based on a two part operating income breakdown- noninterest income and interest income; NII: ratio of noninterest
income to total operating income; Asset: logarithm of total assets; Growth: average asset growth; Equity: ratio of equity to total assets; Loans: ratio of net loans to total assets; GDP: logarithm of the gross domestic product.
Table 4B Estimated impact of a change in share of non-interest income on profitability
FIXED EFFECTS PANEL REGRESSION DYNAMIC PANEL DATA ESTIMATION
Table 5. Income diversification and profitability/risk for Philippine listed banks over the 1999-2005 period (H1)
***, ** and * indicate significance at the 1%, 5% and 10% levels, respectively. T-statistics are corrected for heteroskedasticity following White‟s methodology. Variable definitions: ROA= return on average assets; SHROA: ratio of return on average assets to standard deviation of ROA (annual data); Beta: market model beta; TotRisk: total risk computed as the standard
deviation of weekly returns; RiskSpec: specific risk or the standard deviation of the market model residual; MZ: Market Z-score; FOCUS1: focus index based on a two part operating income
breakdown- noninterest income and interest income; NII: ratio of noninterest income to total operating income; Asset: logarithm of total assets; Growth: average asset growth; Equity: ratio of equity to total assets; Loans: ratio of net loans to total assets; GDP: logarithm of the gross domestic product.
Table 6A Income diversification and profitability/risk for Philippine universal and commercial banks over the 1999-2005 period:
impact of differences in bank size (H1a)
***, ** and * indicate significance at the 1%, 5% and 10% levels, respectively. T-statistics are corrected for heteroskedasticity following White‟s methodology for the fixed effects panel regression.
Variable definitions: ROA: return on average assets; SDROA: standard deviation of ROA (quarterly data); ADJROA: ratio of mean of return on average assets to standard deviation of ROA (quarterly
data); SHROA: ratio of return on average assets to standard deviation of ROA (annual data); FOCUS1: focus index based on a two part operating income breakdown- noninterest income and interest
income; NII: ratio of noninterest income to total operating income; Asset: logarithm of total assets; Growth: average asset growth; Equity: ratio of equity to total assets; Loans: ratio of net loans to total
assets; GDP: logarithm of the gross domestic product.
Table 6B Estimated impact of an increase in the share of non-interest income on profitability: impact of differences in bank size
LARGE BANKS LARGE BANKS (excluding government banks) MEDIUM BANKS SMALL BANKS
***, ** and * indicate significance at the 1%, 5% and 10% levels, respectively. T-statistics are corrected for heteroskedasticity following White‟s methodology for the fixed effects panel regression.
Variable definitions: ROA: return on average assets; SHROA: ratio of return on average assets to standard deviation of ROA (annual data); FOCUS1: focus index based on a two part operating income breakdown- noninterest income and interest income; NII: ratio of noninterest income to total operating income; Asset: logarithm of total assets; Growth: average asset growth; Equity: ratio of equity to
total assets; Loans: ratio of net loans to total assets; GDP: logarithm of the gross domestic product.
44
Table 7B: Estimated impact of an increase in the share of non-interest income on profitability: impact of differences in bank size
TABLE 8. Income diversification and profitability for Philippine universal and commercial banks over the 1995-2005 period: impact
of differences in the level of involvement in non-interest activities (H1b)
***, ** and * indicate significance at the 1%, 5% and 10% levels, respectively. T-statistics are corrected for heteroskedasticity following White‟s methodology for the fixed effects panel regression. Variable
definitions: ROA: return on average assets; SHROA: ratio of return on average assets to standard deviation of ROA (annual data); FOCUS1: focus index based on a two part operating income breakdown- noninterest income and interest income; NII: ratio of noninterest income to total operating income; NIIP25: share of noninterest income of the banks belonging to the lower 25th percentile in terms of average noninterest income,
and 0, otherwise; NIIP75: share of noninterest income of the banks belonging to the upper 75 th percentile in terms of average noninterest income, and 0, otherwise; Asset: logarithm of total assets; Growth: average
asset growth; Equity: ratio of equity to total assets; Loans: ratio of net loans to total assets; GDP: logarithm of the gross domestic product.
Fixed Effects Panel Regression Dynamic Panel Data Estimation
Table 9A. Income diversification and profitability of Philippine universal and commercial banks
over the 1999-2005 period: impact of differences in bank ownership type (H1c)
***, ** and * indicate significance at the 1%, 5% and 10% levels, respectively. T-statistics are corrected for heteroskedasticity following White‟s methodology for the fixed effects panel regression. Variable definitions: ROA: return on average assets; SHROA: ratio of return on average assets to
standard deviation of ROA (annual data); FOCUS1: focus index based on a two part operating income breakdown- noninterest income and interest income; NII: ratio of noninterest income to total operating income; Asset: logarithm of total assets; Growth: average asset growth; Equity: ratio of
equity to total assets; Loans: ratio of net loans to total assets; GDP: logarithm of the gross domestic product.
Table 9B: Estimated impact of an increased share in noninterest income: impact of differences
in bank ownership type
DOMESTIC FOREIGN
NII Percentiles SHROA ROA SHROA Indirect Net Indirect Net Indirect Net
10th 0.198 1.784 -0.086 -0.004 -5.688 -0.138
(2.063) (2.218) (0.091) (0.053) (5.45) (3.78)
25th 0.149 1.734 -0.069 0.013 -4.558 0.993
(1.543) (1.728) (0.073) (0.036) (4.367) (2.797)
50th 0.095 1.68 -0.046 0.036* -3.066 2.484
(0.988) (1.230) (0.049) (0.017) (2.938) (1.693)
75th 0.041 1.626* -0.017 0.065** -1.099 4.452**
(0.426) (0.809) (0.018) (0.028) (1.053) (1.604)
90th -0.055 1.53* 0.010 0.091 0.639 6.189**
(0.571) (0.826) (0.010) (0.053) (0.612) (2.868)
DOMESTIC BANKS FOREIGN BANKS
ROA SHROA ROA SHROA ROA SHROA ROA SHROA
FOCUS1 -0.00149 -0.151 0.0751 4.971
(-0.14) (-0.10) (0.94) (1.04)
NII 0.00627 1.585** 0.00648 1.606** 0.0818* 5.550** 0.0510*** 3.511***
Table 11. Product mixes within non-interest activities and profitability/risk for Philippine universal and commercial banks over the 1999-
2005 period (H2, model 2a)
***, ** and * indicate significance at the 1%, 5% and 10% levels, respectively. T-statistics are corrected for heteroskedasticity following White‟s methodology for the fixed effects panel regression. Variable definitions: ROA: return on average assets; SDROA: standard deviation of ROA (quarterly data); ADJROA: ratio of mean of return on average assets to standard deviation of ROA (quarterly data); SHROA: ratio of return on
average assets to standard deviation of ROA (annual data); FOCUS2: focus index based on a four-part operating income breakdown- fee based income, trading income and other noninterest income; FEE: ratio of fee-
based income to total operating income; TRAD: ratio of trading income to total operating income; Other: ratio of other noninterest income to total operating income; Asset: logarithm of total assets; Growth: average asset growth; Equity: ratio of equity to total assets; Loans: ratio of net loans to total assets; GDP: logarithm of the gross domestic product.
FIXED EFFECTS PANEL REGRESSION DYNAMIC PANEL DATA ESTIMATION
Table 12A. Product mixes within non-interest activities and profitability and risk-adjusted profitability for Philippine universal
and commercial banks over the 1999-2005 period: impact of differences in compliance to the mandatory allocation of credit
resources by lending vs holding government securities (H2, Model2a‟)
***, ** and * indicate significance at the 1%, 5% and 10% levels, respectively. T-statistics are corrected for heteroskedasticity following White‟s methodology.
Variable definitions: ROA: return on average assets; SHROA: ratio of return on average assets to standard deviation of ROA (annual data); FOCUS2: focus index based on a four part operating income breakdown- fee-based income, trading income, other noninterest income, and interest income; FEE: ratio of fee-based income to
total operating income; TRAD: ratio of trading income to total operating income; Other: ratio of other noninterest income to total operating income; FEEComp_Lend,
TRADComp_Lend, OtherComp_Lend: FEE, TRAD and OTHER, respectively, of banks belonging to lower than the 25th
percentile in terms of average government
securities in total assets over the period of study; FEEComp_GovSec, TRADComp_GovSec, OtherComp_GovSec: FEE, TRAD and OTHER, respectively, of banks
belonging to greater than 90th
percentile in terms of average government securities in total assets over the period of study; Asset: logarithm of total assets; Growth:
average asset growth; Equity: equity to total assets; Loans: ratio of net loans to total assets; GDP: logarithm of the gross domestic product.
Table 12B. Product mixes within non-interest activities and profitability and risk-adjusted profitability for Philippine universal and
commercial banks over the 1999-2005 period: impact of differences in compliance to mandatory allocation of credit resources by
lending vs. holding government securities (H2, Model2a‟)
***, ** and * indicate significance at the 1%, 5% and 10% levels, respectively. T-statistics are corrected for heteroskedasticity following White‟s
methodology. Variable definitions: ROA: return on average assets; SHROA: ratio of return on average assets to standard deviation of ROA (annual data); FOCUS2: focus index based on a four part operating income breakdown- fee-based income, trading income, other noninterest income, and interest income;
FEE: ratio of fee-based income to total operating income; TRAD: ratio of trading income to total operating income; Other: ratio of other noninterest income
to total operating income; FEEComp_GovSec2, TRADComp_GovSec2, OtherComp_GovSec2: FEE, TRAD and OTHER, respectively, of banks that have
average government securities in total loans over the period of study greater than 8%; Asset: logarithm of total assets; Growth: average asset growth; Equity:
equity to total assets; Loans: ratio of net loans to total assets; GDP: logarithm of the gross domestic product.
GDP 0.0285*** 4.587*** 0.00227 -0.409 (3.02) (4.41) (0.20) (-0.16)
Constant -0.500*** -58.92*** 0.00781 -31.87
(-4.76) (-6.53) (0.06) (-1.15)
R-square 0.403 0.348 0.443 0.111 OBS
Wald test
Partial coeff
FEE (Comp_GovSec2==0)
TRAD (Comp_GovSec==0)
Other (Comp_GovSec2==0)
FEE (Comp_GovSec2==1)
TRAD (Comp_GovSec2==1)
Other (Comp_GovSec2==1)
No. Banks (GSL<8%)
No. Banks (GSL>8%)
212
3.09**
0.01
0.01
-0.02 0.05
0.07***
0.01 31
8
212
6.61***
-0.96
2.96*
-2.11 2.96
4.33**
1.20 31
8
113
2.32*
-0.04
0.01
-0.01 0.40*
0.02
-0.54 19
1
112
32.39***
-2.52
-2.71
-3.23 -171.29***
-8.72***
183.71*** 19
1
51
Table 13. Product mixes within non-interest activities and profitability/risk for Philippine listed banks over the 1999-2005 period (H2, model
2a)
***, ** and * indicate significance at the 1%, 5% and 10% levels, respectively. T-statistics are corrected for heteroskedasticity following White‟s methodology. Variable definitions: ROA: return on average assets; SHROA: ratio of return on average assets to standard deviation of ROA (annual data); Beta: market model beta; TotRisk: total risk computed as the standard deviation
of weekly returns; RiskSpec: specific risk computed as the standard deviation of the market model residual; MZ: Market Z-score; FOCUS2: focus index based on a four part operating income
breakdown- fee-based income, trading income, other noninterest income, and interest income; FEE: ratio of fee-based income to total operating income; TRAD: ratio of trading income to total operating income; Other: ratio of other noninterest income to total operating income; Asset: logarithm of total assets; Growth: average asset growth; Equity: equity to total assets; Loans: ratio of
net loans to total assets; GDP: logarithm of the gross domestic product
***, ** and * indicate significance at the 1%, 5% and 10% levels, respectively. T-statistics are corrected for heteroskedasticity following White‟s methodology. Variable definitions: ROA: return on average assets; SDROA: standard deviation of ROA (quarterly data); ADJROA: ratio of mean
of return on average assets to standard deviation of ROA (quarterly data); SHROA: ratio of return on average assets to standard deviation of ROA
(annual data); FOCUS3: focus index based on a six part operating income breakdown- income from bank commissions/fees, service charges, other commissions and fees, trading income, other noninterest income, and interest income; BC: ratio of bank commissions and fees to total operating
income; SC: ratio of service charges to total operating income; OC: ratio of other commissions and fees to total operating income; Other: ratio of
other noninterest income to total operating income; Asset: logarithm of total assets; Growth: average asset growth; Equity: ratio of equity to total
assets; Loans: ratio of net loans to total assets; GDP: logarithm of the gross domestic product.
53
Table 14B. Product mixes within trading income activities and profitability/risk for Philippine
universal and commercial banks over the 1999-2005 period (H2, model 2b‟)
***, ** and * indicate significance at the 1%, 5% and 10% levels, respectively. T-statistics are corrected for heteroskedasticity following White‟s
methodology. Variable definitions: ROA: return on average assets; SDROA: standard deviation of ROA (quarterly data); ADJROA: ratio of
mean of return on average assets to standard deviation of ROA (quarterly data); SHROA: ratio of return on average assets to standard deviation of ROA (annual data); FOCUS4: focus index based on a eight part operating income breakdown- fee-based income, income from trading
government securities, income from trading private debt/equity securities; income from trading financial futures and other derivatives, profit from
sale of investments, foreign exchange profit, other noninterest income, and net interest income; GS: ratio of income from trading government
securities to total operating income; PD: ratio of income from trading private debt/equity securities to total operating income; FF: ratio of
income from trading financial futures and other financial derivatives to total operating income; PI: ratio of profit from sale of investments to total operating income; FP: ratio of foreign exchange profit/loss to total operating income; Otherratio of other noninterest income to total operating
income; Asset: logarithm of total assets; Growth: average asset growth; Equity: ratio of equity to total assets; Loans: ratio of net loans to total
assets; GDP: logarithm of the gross domestic product.
54
Table 15. Product mixes within fee-based activities and risk for Philippine universal banks over the 1999-2005
period (H3) Beta Beta TotRisk TotRisk RiskSpec RiskSpec MZ MZ
FOCUS3 -0.000143 0.0339 0.0336 -203.2*
(-0.12) (1.39) (1.31) (-1.88)
BC -0.000422 -0.000332 -0.0610 -0.0824 -0.0593 -0.0804 343.2 474.2
***, ** and * indicate significance at the 1%, 5% and 10% levels, respectively. T-statistics are corrected for heteroskedasticity following White‟s methodology. Variable definitions: Beta: market model beta; TotRisk = total risk computed as the standard deviation of weekly returns ;
RiskSpec: specific risk or the standard deviation of the market model residual; MZ: Market Z-score; FOCUS3: focus index based on a six part
operating income breakdown- income from bank commissions/fees, service charges, other commissions and fees, trading income, other noninterest income, and interest income; BC: ratio of bank commissions and fees to total operating income; SC: ratio of service charges to total
operating income; OC: ratio of other commissions/fees to total operating income; TRAD: ratio of trading income to total operating income;
Other: ratio of other noninterest income to total operating income; Asset : logarithm of total assets; Growth: average asset growth; Equity: ratio of equity to total assets; Loans: ratio of net loans to total assets; GDP : logarithm of the gross domestic product.
55
TABLE 16. Product mixes within trading income activities and risk for Philippine universal banks
***, ** and * indicate significance at the 1%, 5% and 10% levels, respectively. T-statistics are corrected for heteroskedasticity following
White‟s methodology. Variable definitions: Beta: market model beta; TotRisk = total risk computed as the standard deviation of weekly
returns ; RiskSpec: specific risk or the standard deviation of the market model residual; MZ: Market Z-score; FOCUS4: focus index based on a eight part operating income breakdown- fee-based income, income from trading government securities, income from trading private
debt/equity securities; income from trading financial futures and other derivatives, profit from sale of investments, foreign exchange profit,
other noninterest income, and net interest income; GS: ratio of income from trading government securities to total operating income; PD: ratio of income from trading private debt/equity securities to total operating income; FF: ratio of income from trading financial futures and other
financial derivatives to total operating income; PI: ratio of profit from sale of investments to total operating income ; FP: ratio of foreign
exchange profit/loss to total operating income ; Other: ratio of other noninterest income to total operating income; Asset: logarithm of total
assets; Growth: average asset growth; Equity: ratio of equity to total assets; Loans: ratio of net loans to total assets; GDP : logarithm of the