BROOKINGS-ROCKEFELLER | PROJECT ON STATE AND METROPOLITAN INNOVATION | September 2012 1 BROOKINGS-ROCKEFELLER Project on State and Metropolitan Innovation Banking on Infrastructure: Enhancing State Revolving Funds for Transportation Robert Puentes and Jennifer Thompson 1 “The structure of revolving funds for transportation allows states to tweak the model to meet their unique infrastructure needs.” Summary In recent years, states and the federal government experimented with a set of innovative finance mechanisms, credit programs, and revolving loan funds to stretch public and private dollars and support the kind of infrastructure investments necessary to build the Next Economy. For trans- portation projects, much of this support comes in the form of below market revolving loans and loan guarantees from state infrastructure banks (SIBs.) Since established in the 1990s they have provided billions in financing for more than 1,000 projects mostly focused on the 100 largest metropolitan areas. However, this activity is highly concentrated in just a few states as many SIBs are underutilized or inactive. This research shows that SIBs can be valuable tools for delivering infrastructure projects and can generate more investment per dollar than traditional federal and state grant programs. This report recommends that U.S. states should: n Align federal and state roles and responsibilities to streamline project delivery and ensure loan capacity is fully utilized n Ensure the long-term sustainability of revolving infrastructure funds by leveraging capital- ization and reach a broader range of sponsors and projects n Develop partnerships with local public and private actors so projects have high economic, environmental, or social effects. I. Introduction A merican history is rife with bold investments in infrastructure that spurred industrial growth, fueled innovation, and provided jobs. Despite this track record, U.S. infrastructure has waxed and waned over the last decade. The current national debate on public spending and investment offers little hope that significant new sources of federal or state funding will be pumped into American infrastructure from traditional revenue sources like fuel taxes. Instead, attention has turned to a set of innovative finance tools, federal credit programs, and such non-federal mechanisms as ballot initiatives, the municipal debt market, and public-private partnerships. State revolving funds (SRFs) present an increasingly important mechanism for financing and fund- ing infrastructure projects such as state infrastructure banks. Despite decades of use, however, these SRFs are not well understood. Better practices and policies could improve the use of revolving funds— especially for infrastructure—and better position them in a world dominated by general-purpose grant programs.
Transcript
BROOKINGS-ROCKEFELLER | PROJECT ON STATE AND METROPOLITAN INNOVATION | September 2012 1
BROOKINGS-ROCKEFELLER
Project on State and Metropolitan Innovation
Banking on Infrastructure: Enhancing State Revolving Funds for Transportation Robert Puentes and Jennifer Thompson1
“ The structure of
revolving funds
for transportation
allows states
to tweak the
model to meet
their unique
infrastructure
needs.”
Summary
In recent years, states and the federal government experimented with a set of innovative finance mechanisms, credit programs, and revolving loan funds to stretch public and private dollars and support the kind of infrastructure investments necessary to build the Next Economy. For trans-portation projects, much of this support comes in the form of below market revolving loans and loan guarantees from state infrastructure banks (SIBs.) Since established in the 1990s they have provided billions in financing for more than 1,000 projects mostly focused on the 100 largest metropolitan areas. However, this activity is highly concentrated in just a few states as many SIBs are underutilized or inactive. This research shows that SIBs can be valuable tools for delivering infrastructure projects and can generate more investment per dollar than traditional federal and state grant programs.
This report recommends that U.S. states should:n Align federal and state roles and responsibilities to streamline project delivery and ensure
loan capacity is fully utilizedn Ensure the long-term sustainability of revolving infrastructure funds by leveraging capital-
ization and reach a broader range of sponsors and projectsn Develop partnerships with local public and private actors so projects have high economic,
environmental, or social effects.
I. Introduction
American history is rife with bold investments in infrastructure that spurred industrial growth, fueled innovation, and provided jobs. Despite this track record, U.S. infrastructure has waxed and waned over the last decade.
The current national debate on public spending and investment offers little hope that significant new sources of federal or state funding will be pumped into American infrastructure from traditional revenue sources like fuel taxes. Instead, attention has turned to a set of innovative finance tools, federal credit programs, and such non-federal mechanisms as ballot initiatives, the municipal debt market, and public-private partnerships.
State revolving funds (SRFs) present an increasingly important mechanism for financing and fund-ing infrastructure projects such as state infrastructure banks. Despite decades of use, however, these SRFs are not well understood. Better practices and policies could improve the use of revolving funds—especially for infrastructure—and better position them in a world dominated by general-purpose grant programs.
BROOKINGS-ROCKEFELLER | PROJECT ON STATE AND METROPOLITAN INNOVATION | September 20122
This policy brief examines the history and background of these funds across infrastructure modes. We analyzed spending patterns to determine what kinds of projects are financed, which states are most active and innovative, and where projects are located. The revolving funds provide a useful func-tion in some states while being underutilized in others. Although the long-term viability of revolving funds is hard to determine, we suggest policy, practice, and partnership changes that could enhance their impact and effectiveness.
II. Background
Public sector resources for infrastructure are strained, especially for transportation. Revenue from traditional sources such as the fuel tax are dwindling, and the political appetite to raise the rate, or even index it to inflation, is not strong in most states or at the federal level.2 With their major source of revenue diminished and municipal bond markets more risk averse due
the economic downturn, states and localities are scrambling to find financing to fill the gap.Over the last two decades, the federal government created many innovative finance programs
to help state stretch their transportation dollars. Loan programs such as the Transportation Infrastructure Finance and Innovation Act (TIFIA), the Railroad Rehabilitation and Improvement Financing (RRIF) Program, Grant Anticipation Revenue Vehicle (GARVEE) Bonds, and others provide flexibility to finance projects and attract a range of public and private investors.
Financing is also provided through state infrastructure banks (SIB), subsets of state revolving funds, which are publicly regulated loan funds capitalized from a variety of grant sources to assist projects across a range of infrastructure modes.
(State infrastructure banks are occasionally cited as redundant to proposals for the establishment of a national infrastructure bank. As explained later, these institutions are similar in name only and actu-ally fulfill different, albeit complementary, functions in the realm of infrastructure finance and project development.)
Revenues used to capitalize the funds come from a variety of sources and include local tax options, apportionment from federal, state or local budgets, or some other form of debt or equity investment. These funds act like a bank, in that they do not own the infrastructure asset, but act as a lender or guarantor to the project sponsor.3 While they are not for-profit institutions in the traditional banking context, SRFs rely on principal repayments, bonds, interest and fees to re-capitalize and replenish the fund as a perpetual source of debt financing. Financing options through SRFs most commonly take the form of direct loans at low-interest rates, but can also include bond issuances, credit and loan guaran-tees, and in some cases grants.
Combining the private functions of a bank with a public agency allows sectors and borrowers that have historically not been major recipients of private investment the opportunity to receive financ-ing. Their return on investment can apply to future projects. Some sectors and borrowers (like local municipalities or small project sponsors) may not be as attractive for private sector development since the revenue stream and profit opportunities are much smaller.
SRFs across infrastructure modes can attract private investment, as the majority of these funds allow private entities to apply for financing if they are building a public infrastructure project or working with a public sponsor. Private investors benefit from low-interest rates offered through revolv-ing funds.4
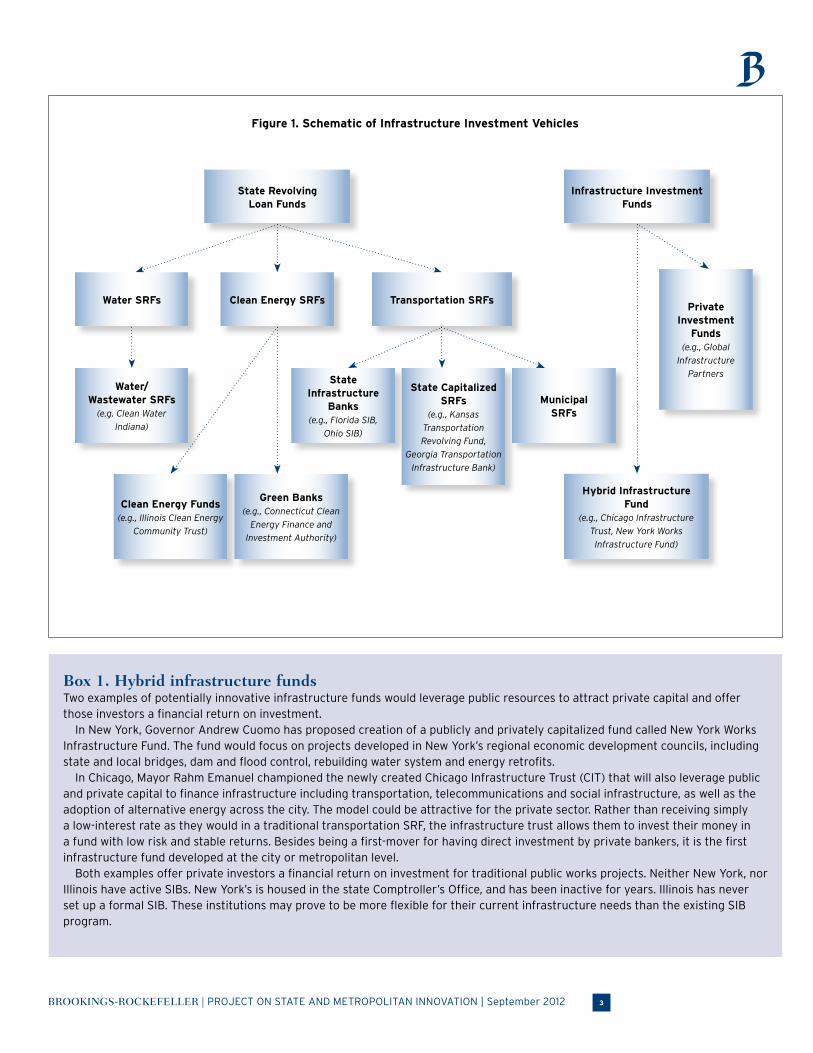
Figure 1 illustrates the range of infrastructure SRFs and investment funds. The main differing point is that initial starting capital for a SRF is often a government grant and does not need to be repaid. In other words, there is no expected return on investment to investors. Hybrid funds are part of an emerging category that aim to use a combination of public and private dollars to leverage infrastruc-ture growth at the municipal or state level (Box 1.)
BROOKINGS-ROCKEFELLER | PROJECT ON STATE AND METROPOLITAN INNOVATION | September 2012 3
Figure 1. Schematic of Infrastructure Investment Vehicles
Box 1. Hybrid infrastructure fundsTwo examples of potentially innovative infrastructure funds would leverage public resources to attract private capital and offer those investors a financial return on investment.
In New York, Governor Andrew Cuomo has proposed creation of a publicly and privately capitalized fund called New York Works Infrastructure Fund. The fund would focus on projects developed in New York’s regional economic development councils, including state and local bridges, dam and flood control, rebuilding water system and energy retrofits.
In Chicago, Mayor Rahm Emanuel championed the newly created Chicago Infrastructure Trust (CIT) that will also leverage public and private capital to finance infrastructure including transportation, telecommunications and social infrastructure, as well as the adoption of alternative energy across the city. The model could be attractive for the private sector. Rather than receiving simply a low-interest rate as they would in a traditional transportation SRF, the infrastructure trust allows them to invest their money in a fund with low risk and stable returns. Besides being a first-mover for having direct investment by private bankers, it is the first infrastructure fund developed at the city or metropolitan level.
Both examples offer private investors a financial return on investment for traditional public works projects. Neither New York, nor Illinois have active SIBs. New York’s is housed in the state Comptroller’s Office, and has been inactive for years. Illinois has never set up a formal SIB. These institutions may prove to be more flexible for their current infrastructure needs than the existing SIB program.
State Revolving Loan Funds
Infrastructure Investment Funds
Clean Energy SRFs Transportation SRFsPrivate
Investment Funds
(e.g., Global
Infrastructure
Partners
Water SRFs
Water/Wastewater SRFs
(e.g. Clean Water
Indiana)
Clean Energy Funds(e.g., Illinois Clean Energy
Community Trust)
Green Banks(e.g., Connecticut Clean
Energy Finance and
Investment Authority)
Hybrid Infrastructure Fund
(e.g., Chicago Infrastructure
Trust, New York Works
Infrastructure Fund)
State Infrastructure
Banks(e.g., Florida SIB,
Ohio SIB)
State Capitalized SRFs
(e.g., Kansas
Transportation
Revolving Fund,
Georgia Transportation
Infrastructure Bank)
Municipal SRFs
BROOKINGS-ROCKEFELLER | PROJECT ON STATE AND METROPOLITAN INNOVATION | September 20124
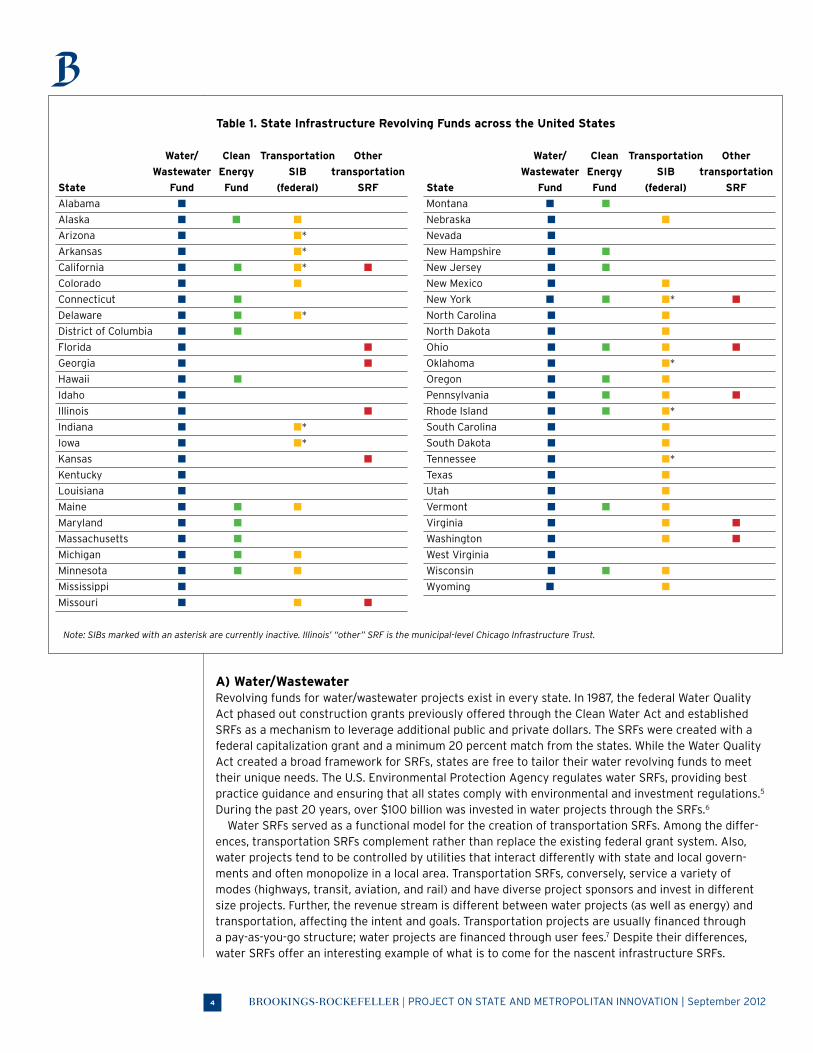
A) Water/Wastewater Revolving funds for water/wastewater projects exist in every state. In 1987, the federal Water Quality Act phased out construction grants previously offered through the Clean Water Act and established SRFs as a mechanism to leverage additional public and private dollars. The SRFs were created with a federal capitalization grant and a minimum 20 percent match from the states. While the Water Quality Act created a broad framework for SRFs, states are free to tailor their water revolving funds to meet their unique needs. The U.S. Environmental Protection Agency regulates water SRFs, providing best practice guidance and ensuring that all states comply with environmental and investment regulations.5 During the past 20 years, over $100 billion was invested in water projects through the SRFs.6
Water SRFs served as a functional model for the creation of transportation SRFs. Among the differ-ences, transportation SRFs complement rather than replace the existing federal grant system. Also, water projects tend to be controlled by utilities that interact differently with state and local govern-ments and often monopolize in a local area. Transportation SRFs, conversely, service a variety of modes (highways, transit, aviation, and rail) and have diverse project sponsors and invest in different size projects. Further, the revenue stream is different between water projects (as well as energy) and transportation, affecting the intent and goals. Transportation projects are usually financed through a pay-as-you-go structure; water projects are financed through user fees.7 Despite their differences, water SRFs offer an interesting example of what is to come for the nascent infrastructure SRFs.
Table 1. State Infrastructure Revolving Funds across the United States
Note: SIBs marked with an asterisk are currently inactive. Illinois’ “other” SRF is the municipal-level Chicago Infrastructure Trust.
Water/ Clean Transportation Other
Wastewater Energy SIB transportation
State Fund Fund (federal) SRF
Alabama n
Alaska n n n
Arizona n n*
Arkansas n n*
California n n n* n
Colorado n n
Connecticut n n
Delaware n n n*
District of Columbia n n
Florida n n
Georgia n n
Hawaii n n
Idaho n
Illinois n n
Indiana n n*
Iowa n n*
Kansas n n
Kentucky n
Louisiana n
Maine n n n
Maryland n n
Massachusetts n n
Michigan n n n
Minnesota n n n
Mississippi n
Missouri n n n
Water/ Clean Transportation Other
Wastewater Energy SIB transportation
State Fund Fund (federal) SRF
Montana n n
Nebraska n n
Nevada n
New Hampshire n n
New Jersey n n
New Mexico n n
New York n n n* n
North Carolina n n
North Dakota n n
Ohio n n n n
Oklahoma n n*
Oregon n n n
Pennsylvania n n n n
Rhode Island n n n*
South Carolina n n
South Dakota n n
Tennessee n n*
Texas n n
Utah n n
Vermont n n n
Virginia n n n
Washington n n n
West Virginia n
Wisconsin n n n
Wyoming n n
BROOKINGS-ROCKEFELLER | PROJECT ON STATE AND METROPOLITAN INNOVATION | September 2012 5
B) Clean Energy Over the past decade, clean energy funds in 22 states have invested over $2.7 billion state dollars in renewable energy markets and leveraged an addition $9.7 billion in federal and private capital. They have funded over 72,000 projects from solar installations on residential and commercial properties to wind farms and biomass generation plants.8
Clean energy funds operate out of a range of state agencies. Some are established within state energy departments, while others operate out of public utility commissions, or as independent, non-profit organizations. They emerged from the oil supply shocks in the 1970s, when utilities were looking for increased efficiency and shifted a substantial portion of energy production from oil to electricity generation. The structure of funds evolved as regulatory commissions have instituted requirements for long-term supply and demand-side planning for energy use. Most are capitalized through a “public benefit fund or system benefits charge” found on consumers’ electric bills.9
An emergent institution for financing clean energy capital projects are green banks, which seek to combine and leverage scarce public clean energy funds with private investment and to provide low-cost financing to innovative and crucial clean technologies. Green banks would carry on the work done by clean energy funds, and by leveraging private investment, be able to scale up these technologies and invest in a greater number of projects.
A complementary Brookings policy brief delves into different models for green banks, focusing on the creation of the Clean Energy Finance and Investment Authority (CEFIA) in Connecticut.10 CEFIA, created in June 2011, combines several clean energy funds in the state, allowing them to be leveraged and private actors to invest with a promised financial return on investment. The green bank models seek to push clean energy investment beyond a one-time grant award to a revolving loan fund that will bolster the clean energy industry in the future.11
A possible future green bank model is one that combines, through a partnership agreement, public and private funds expressly dedicated to clean energy investment. Another would combine the green bank with traditional bank lending to infrastructure projects such as those found in transportation. As CEFIA starts to invest, it will provide a model for other states looking to leverage public and private dollars for crucial clean energy financing.
C) Transportation Transportation SRFs followed the model of existing state-level financial institutions—water SRFs and state bond banks. Serving as an intermediary between communities and credit markets, state bond banks provide low-cost financing for capital projects. The initial goal of bond banks was to pool the debt of smaller communities to make larger, more cost-effective debt issues.12 As infrastructure fund-ing and state budgets faced pressure in the 1980s, many states proposed SRFs as a way to secure a permanent pool of capital for transportation investment. However, the original bond bank model was too limited for infrastructure SRFs. Larger cities could access the credit market easier on their own, and since the varied needs of many small communities were met through bond banks, the projects tended to be small (in terms of capital) and not targeted to a particular infrastructure mode.13
The evolution to transportation-targeted SRFs began with institutions like the Florida Toll Facilities Revolving Trust Fund, created in 1986 to help finance revenue-generating projects sponsored by local governments and the Florida Turnpike Enterprise.14 States like New Jersey and Massachusetts had infrastructure bank-like proposals in the legislature in the 1980s that would support infrastructure (water, transportation, and social infrastructure projects) through a revolving loan fund, but they were never formally established.15 In 1994, California did establish its Infrastructure and Economic Development Bank (I-Bank) to offer financing to local governments. These institutions, along with water SRFs, provided an important framework for the most widely known transportation SRFs—state infrastructure banks.16
BROOKINGS-ROCKEFELLER | PROJECT ON STATE AND METROPOLITAN INNOVATION | September 20126
III. State Infrastructure Bank History
The federal government established SIBs as a pilot in the 1995 National Highway System Des-ignation Act (NHS), allowing states to use a portion of their federal transportation allocation as “seed money” for an initial capitalization. State funds were to match the federal funding.17 The ten states selected to participate in the initial pilot were: Arizona, Florida, Ohio, Okla-
homa, Oregon, South Carolina, Texas, and Virginia. After California and Missouri were subsequently selected, all had started their SIBs by July 1997.18
The SIB program provided states the first opportunity to use federal apportionment dollars out-side of the direct grant process, allowing them to leverage additional funds by securing low-cost debt financing. The ability to leverage SIB funding, either through capital markets, or by attracting addi-tional public or private investment, increased the universe of projects and range of investment sources states could use to meet their infrastructure needs.
The 1995 law stipulated that SIBs must maintain separate accounts for contributions by the federal highway and transit funds. Several other provisions stipulated how state money could be added to the SIB and in what type of projects the SIB could invest. States could contribute up to 10 percent of the funds apportioned for FY 1996, and again in FY1997, from their highway and transit accounts. The funds could be used to provide assistance with the construction of federal-aid highways as outlined in Title 23 of the U.S. Code, and transit capital projects under Title 49. Each state had to contribute at least 25 percent of the amount of each capitalization grant made to the SIB.19
A $150 million appropriation in 1997 further capitalized the SIBs and expanded the pilot to 23 states.20 The additional funds became an attractive opportunity for states to set up SIBs without using any of their original apportionment.21 This wave of applicants also included the establishment of two “multistate” SIBs: one for Nebraska-North Dakota-South Dakota-Wyoming, and one for Arkansas-Tennessee. The latter was to have accounts for both states as well as one for joint projects. However, it appears that disagreements about which projects to finance resulted in no activity from either collaboration.22
The 1998 Transportation Equity Act for the 21st Century (TEA-21) established new funding sources and provisions for four SIBs—California, Florida, Missouri, and Rhode Island—but only Florida and Missouri signed cooperative agreements using the funds. The rest remained under the 1995 and 1997 SIB legislation structures. TEA-21 changed previous legislative provisions by excluding the 10 percent cap on the percentage of federal apportionment allocated for SIB capitalization. It also allowed high-way and transit funds to be deposited into the same account, rather than requiring SIBs to maintain them separately.23
But one of the most important changes was the addition of a new clause outlining the applicability of federal regulations for repaid funds to the SIB. The new law considered all repayments subject to federal requirements (under Titles 23 and 49) as well as all projects assisted by the banks.24 In other words, for SIBs capitalized under TEA-21, once the initial federal capitalization had revolved one time, federal regulations for subsequent projects continued to apply (e.g., federal rules and requirements for contracts, environmental assessments, and project eligibility.) Supporters of the Davis-Bacon Act, which requires contractors to provide prevailing working wages in each state for all federal public works projects, fought to have federal law applied to all repaid funds to ensure that this provision was upheld for all public works projects funded through SIBs.25
Under 2005’s Safe, Accountable, Flexible, Efficient Transportation Equity Act: A Legacy for Users (SAFETEA-LU), all states and territories were eligible to enter into cooperative agreements to establish SIBs, but none have done so. This may be because of the favorable credit environment that existed when SAFETEA-LU was passed, allowing state government and public agencies to borrow at very low rates in the municipal bond markets. Or it may be that the application of federal rules for post TEA-21 SIBs created unfavorable conditions for states to recapitalize or set up a SIB.26
Recent proposals have called for the recapitalization for SIBs. One was the U.S. House of Representatives’ proposal for the 2012 transportation reauthorization. The bill called for an additional $750 million apportionment each year through 2016 for SIBs.27 Another bill proposed the creation of Transportation and Regional Infrastructure Project (TRIP) tax credit bonds that SIBs would administer, giving them control over project selection.28 The eventual surface transportation authorization signed
BROOKINGS-ROCKEFELLER | PROJECT ON STATE AND METROPOLITAN INNOVATION | September 2012 7
into law in July 2012—Moving Ahead for Progress in the 21st Century (MAP-21)—made no changes made to the SIB program.
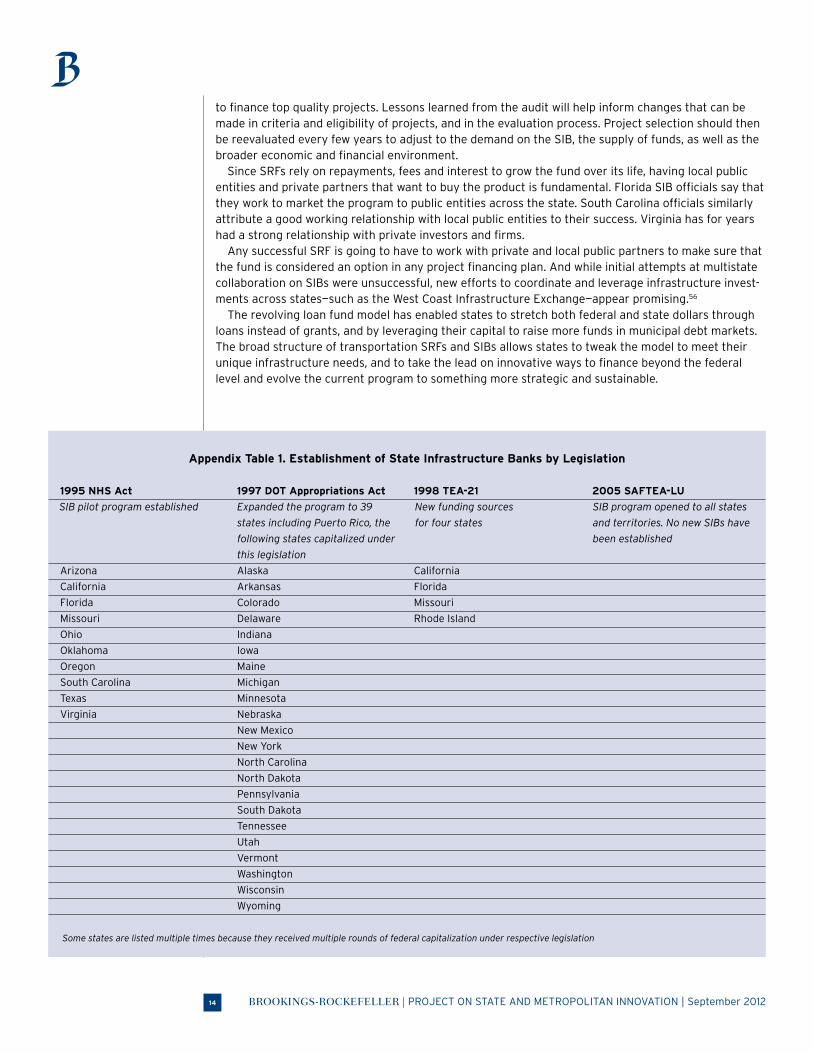
Federally capitalized SIBs technically exist in 33 states though 10 are currently inactive. For example, Oklahoma participated in the 1995 program and established a SIB but it was never capitalized because the state does not have “a use for it” primarily because it already enjoys favorable interest rates (Appendix Table 1).29
IV. Features of Transportation State Revolving Funds
Most products offered through transportation state revolving funds—including state infra-structure banks—are direct loans at low interest since local public agencies can already borrow in capital markets at seemingly competitive rates. Similarly, because the major-ity of sponsors are public agencies that already receive grant money for projects, the
advantage is in lending at low rates to build and maintain a client base among local public actors.The low-interest rates create a catch-22 for SRFs. To attract customers, SRFs offer competitive
financing. But to maintain levels of capitalization and run in perpetuity, SRFs have to balance their rates against inflation. In a 1992 paper on revolving fund finance, Randall Holcombe predicted that this policy dilemma would be the downfall of most SRFs. He explained that after running a simulation of a wastewater SRF, where the base case is a 5 percent inflation rate and 5 percent interest rate, a SRF with an interest rate of 3 percent will have half the real value after 40 years than the base case. If the SRF offers no-interest loans, its value is half the base case after a decade.30
Others argued that as long as interest rates remain above zero, loan streams would continue to support future projects. Jay Ryu illustrated this point by simulating future loan capacity of a SRF with rates set at 1, 3, and 5 percent. While the SRF loaning at 1 percent was able to continue to operate, its loan capacity remained flat as time passed. The loan capacity stayed higher for longer in proportion to higher interest rates.31 Depending on the short- and long-term infrastructure financing goals of the state and local agencies, a lifespan of 10 or 20 years may be satisfactory for a SRF if another source of financing is cultivated.
Some transportation SRFs have leveraged their pool of capital to raise additional funds. A leveraged SIB typically issues bonds and uses its initial capitalization as collateral on the bond. An unleveraged SIB uses its capitalization to provide products (loans, guarantees, etc.) directly to project sponsors. Depending on the volume of applications and loan amounts needed, leveraging the initial capitalization is an option for infusing more resources to finance many projects or those at a higher cost. However, leveraging can put SRFs in a precarious situation if the capitalization is being leveraged at a market rate that is higher than the interest rate offered by the SRF. This requires careful management to appropriately time the leverages to match repayment schedules.32
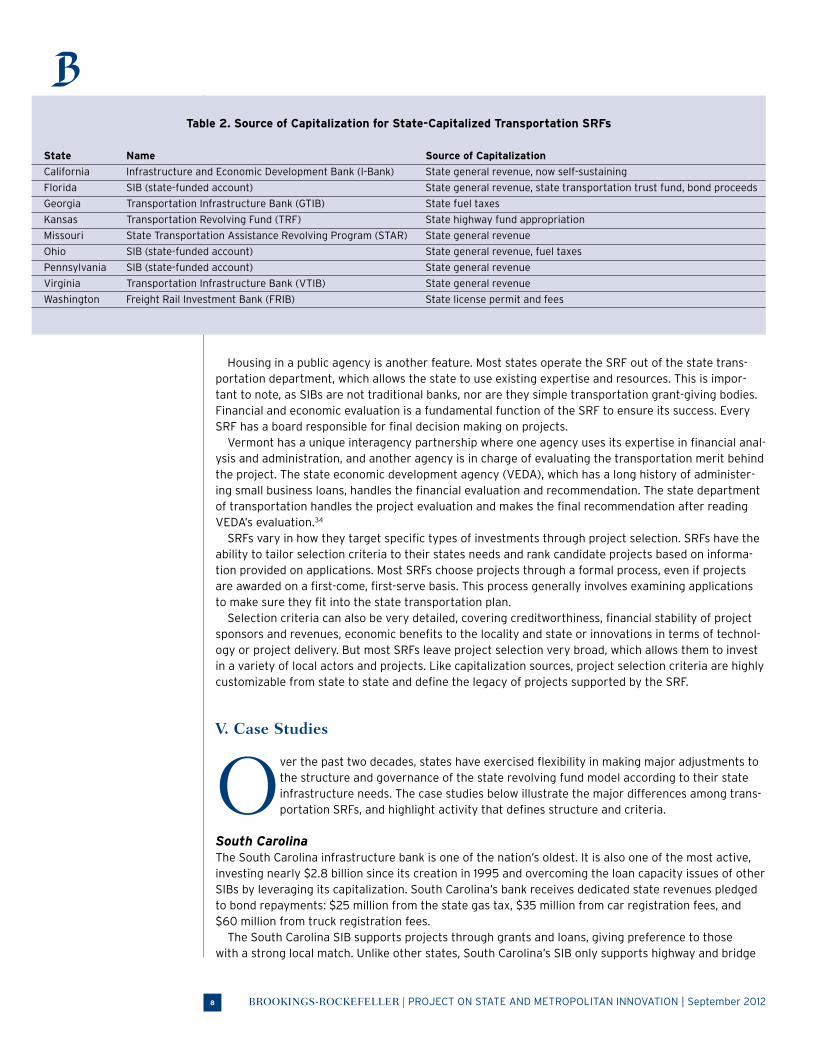
As discussed, SIBs are unique because they were initially capitalized through federal apportionment and cooperative agreements with the Transportation department. Other transportation SRFs were capitalized through state-sourced revenue, including budget appropriations, bonds, and tax revenue. Some states—like Florida and Missouri—have chosen to add a state-capitalized account to their SIB, allowing them to finance infrastructure projects that are important to the state, but might fall outside the purview of the Title 23 and 49 federally eligible projects. Other states, like Kansas and Georgia, have elected to opt out of the federal SIB program, and have only state-capitalized SRFs.33 Among states that have state-capitalized SRFs, the capitalization comes from a variety of sources including budget appropriations, bonds, and tax revenue (Table 2).
BROOKINGS-ROCKEFELLER | PROJECT ON STATE AND METROPOLITAN INNOVATION | September 20128
Housing in a public agency is another feature. Most states operate the SRF out of the state trans-portation department, which allows the state to use existing expertise and resources. This is impor-tant to note, as SIBs are not traditional banks, nor are they simple transportation grant-giving bodies. Financial and economic evaluation is a fundamental function of the SRF to ensure its success. Every SRF has a board responsible for final decision making on projects.
Vermont has a unique interagency partnership where one agency uses its expertise in financial anal-ysis and administration, and another agency is in charge of evaluating the transportation merit behind the project. The state economic development agency (VEDA), which has a long history of administer-ing small business loans, handles the financial evaluation and recommendation. The state department of transportation handles the project evaluation and makes the final recommendation after reading VEDA’s evaluation.34
SRFs vary in how they target specific types of investments through project selection. SRFs have the ability to tailor selection criteria to their states needs and rank candidate projects based on informa-tion provided on applications. Most SRFs choose projects through a formal process, even if projects are awarded on a first-come, first-serve basis. This process generally involves examining applications to make sure they fit into the state transportation plan.
Selection criteria can also be very detailed, covering creditworthiness, financial stability of project sponsors and revenues, economic benefits to the locality and state or innovations in terms of technol-ogy or project delivery. But most SRFs leave project selection very broad, which allows them to invest in a variety of local actors and projects. Like capitalization sources, project selection criteria are highly customizable from state to state and define the legacy of projects supported by the SRF.
V. Case Studies
Over the past two decades, states have exercised flexibility in making major adjustments to the structure and governance of the state revolving fund model according to their state infrastructure needs. The case studies below illustrate the major differences among trans-portation SRFs, and highlight activity that defines structure and criteria.
South CarolinaThe South Carolina infrastructure bank is one of the nation’s oldest. It is also one of the most active, investing nearly $2.8 billion since its creation in 1995 and overcoming the loan capacity issues of other SIBs by leveraging its capitalization. South Carolina’s bank receives dedicated state revenues pledged to bond repayments: $25 million from the state gas tax, $35 million from car registration fees, and $60 million from truck registration fees.
The South Carolina SIB supports projects through grants and loans, giving preference to those with a strong local match. Unlike other states, South Carolina’s SIB only supports highway and bridge
Table 2. Source of Capitalization for State-Capitalized Transportation SRFs
State Name Source of Capitalization
California Infrastructure and Economic Development Bank (I-Bank) State general revenue, now self-sustaining
Florida SIB (state-funded account) State general revenue, state transportation trust fund, bond proceeds
Georgia Transportation Infrastructure Bank (GTIB) State fuel taxes
Kansas Transportation Revolving Fund (TRF) State highway fund appropriation
Missouri State Transportation Assistance Revolving Program (STAR) State general revenue
Ohio SIB (state-funded account) State general revenue, fuel taxes
Pennsylvania SIB (state-funded account) State general revenue
Virginia Transportation Infrastructure Bank (VTIB) State general revenue
Washington Freight Rail Investment Bank (FRIB) State license permit and fees
BROOKINGS-ROCKEFELLER | PROJECT ON STATE AND METROPOLITAN INNOVATION | September 2012 9
projects that exceed $100 million in cost. (It will support transit projects of any size but has not yet done so.) While the overall number of agreements is relatively low, several include multiple smaller projects – such as the installation of safety guardrails on roads statewide. The SIB was also critical in supporting the statewide “27 in 7” plan to accelerate the delivery of 200 transportation projects from 27 years to only 7. The department of transportation had divided the state into two regions and partnered with two private firms, giving the accelerated effort the advantage of low-interest rates and avoided inflation costs.35
CaliforniaCalifornia’s federally capitalized SIB, also part of the original 1995 pilot program, has supported only two road projects. The current capitalization of $4 million is extremely low for a state that has recently built 11 public-private partnerships valued over $7 billion.36 According to SIB officials, there has been no demand for the program due to the limitation of the loan capacity.37 They do not anticipate any future demand for the program.
The California Infrastructure and Economic Development Bank, known as the I-Bank, has an extremely broad mandate for lending. Created in 1994 with a capitalization of $50 million appropri-ated from the state’s general fund, the I-Bank received another appropriation two years later of $425 million.38 In 2001 and 2002, nearly $300 million was swept back into the General Fund due to changing economic conditions, leaving the I-Bank with a net appropriation of just over $181 million. The I-Bank has five separate programs that provide direct loans and bonds to a variety of borrowers: from public agencies and special districts through the Infrastructure State Revolving Fund and Public Agency Revenue Bond Program, to manufacturers in the Industrial Development Bond Program, to corpora-tions and non profits in the Exempt Facility and 501 (c)(3) bond programs.39
The I-Bank is entirely self-funding and its executive director, Stan Hazelroth, attributes part of its success to having a standardized list of criteria through which it chooses projects.40 It can finance proj-ects in sixteen infrastructure categories, ranging from water and renewable energy to telecommunica-tions and transportation to schools. The Infrastructure State Revolving Fund Program provides direct low-cost loans for public infrastructure and has lent to ninety-nine projects since its creation, with investment valued over $443 million. Acting as an issuer, the I-Bank has a “portfolio” of over $32 bil-lion in loans made or bonds issued by either the I-Bank or entities created by the I-Bank. It issued over $1.5 billion in Toll Bridge Seismic Retrofit Bonds as part of the Public Agency Revenue Bond Program.41
FloridaFlorida (along with Ohio, Pennsylvania, and Missouri) has both a federal- and state-capitalized account that operate out of the same SIB institution. (While the state-capitalized account is not technically a SIB since the state does not have to report to the U.S. DOT, the same officials operate the institution and determine which projects are financed.) Florida, with the second most active SIB measured by value of agreements, loans almost $1.2 billion through 75 agreements. Sixty-eight percent of that activ-ity comes through the state-capitalized account. As evidenced by the volume of financing, the program is very popular within the state, where officials actively work to inform local partners of the SIB financ-ing as an option for their projects.
Although the federal account has not been capitalized since 2004, Florida’s state account receives a healthy $10 million annually from state fuel and excise taxes.42 Officials leveraged the capitalization twice by using it to issue bonds that increased the pool of funds available to lend. Eligible projects are limited to those that are part of the state highway system or provide intermodal connectivity for the increased accessibility and mobility of people, cargo, and freight.
Florida’s guidelines for choosing projects include those with higher present value of repayments, projects that have the most secure sources of funding and safeguards to repay SIB loans. It also considers projects that foster public-private partnerships and use new technologies, those that help maintain or protect the environment, and projects which include transportation benefits for improving intermodalism.43
BROOKINGS-ROCKEFELLER | PROJECT ON STATE AND METROPOLITAN INNOVATION | September 201210
VirginiaSimilar to California, Virginia initiates large-scale infrastructure projects though the SIB only funded two highway projects since its creation in 1997. The low loan capacity—only $20 million—is a key reason for the scant activity. Conversely, the Virginia Transportation Infrastructure Bank (VTIB), created in 2011, has already provided $312 million in financing for three projects. The initial idea was to use rev-enues from the lease of state-owned liquor stores when exploring ideas for capitalization of the fund. Instead, the VTIB received other transportation dollars appropriated by the state legislature.44
The motivation behind VTIB was to operate as a state-level TIFIA fund, a highly popular and over-subscribed federal credit assistance program that provides secured (direct) loans, loan guarantees, and standby lines of credit to a wide range of public and private entities. The allure of TIFIA financing comes from its low and fixed interest rate that is equivalent to the Treasury rate, and from the fact that TIFIA loans are often subordinate to other senior obligations. TIFIA has helped states like Virginia and Texas leverage private and capital markets debt because of its favorable financial terms. While the VTIB is a very new institution, its first set of loan agreements shows promise for other projects in the state.
Kansas and GeorgiaKansas and Georgia are the only states in the United States that operate state-only capitalized trans-portation SRFs.
The Kansas Transportation Revolving Fund (TRF), created in 1999 as part of the state’s ten-year Comprehensive Transportation Program, has financed 75 projects with over $92 million in agree-ments.45 Only road and bridge projects are eligible and both public and private sponsors (e.g., con-struction or development firms) can apply for financing though a private firm must be partnered with a public agency to participate in the program.
The TRF offers direct loans (with an average interest rate of 3.7 percent), credit guarantees, and bonds and evaluates applications based on four explicit criteria: sponsor is eligible, project is consis-tent with the state highway system, the creditworthiness of the applicant, and the term of the loan is equal or less than the design life of the project.46 In 2009, a moratorium was placed on all TRF activity until new sources of revenue could be determined. In 2010, when new state transportation legislation was enacted, an additional $25 million was appropriated to the TRF from general revenue.
The Georgia Transportation Infrastructure Bank (GTIB), created in 2009 with funds raised from existing state motor fuel taxes, gave nine grants to community improvement districts (CIDs) in metropolitan Atlanta for road projects during its first two years.47 Candidate projects are evaluated by a technical committee that includes representatives from public transportation and financial part-ners across the state before the board of the State Road and Tollway Authority considers the technical committee’s recommendation and makes the final decision to award applicants. For projects applying for loans, the Georgia Environmental Finance Authority completes an extra financial analysis of the project.48
Due to under-subscription, some transportation SRFs award projects on a first-come, first-serve basis although their mandate may outline strict selection criteria. In this case, as long as applicants are creditworthy and projects meet eligibility requirements (Title 23 and 49), projects are awarded financing irrespective of the economic or innovative characteristics. Still other SIBs, like South Dakota and Vermont, have found that their financing is going to help small municipalities recover quickly from natural disasters. The SIB loan acts as bridge funding until the municipality receives federal grant money, which is used to pay back the federal share of the SIB loan.49 This fall, the Wisconsin DOT will allocate $14 million from the state’s highway rehabilitation fund to the SIB program. The money will support no-finance loans to help local governments repair local roads damaged by trucks clearing timber damaged in storms last summer.50
BROOKINGS-ROCKEFELLER | PROJECT ON STATE AND METROPOLITAN INNOVATION | September 2012 11
VI. Analysis of SRF and SIB Activity
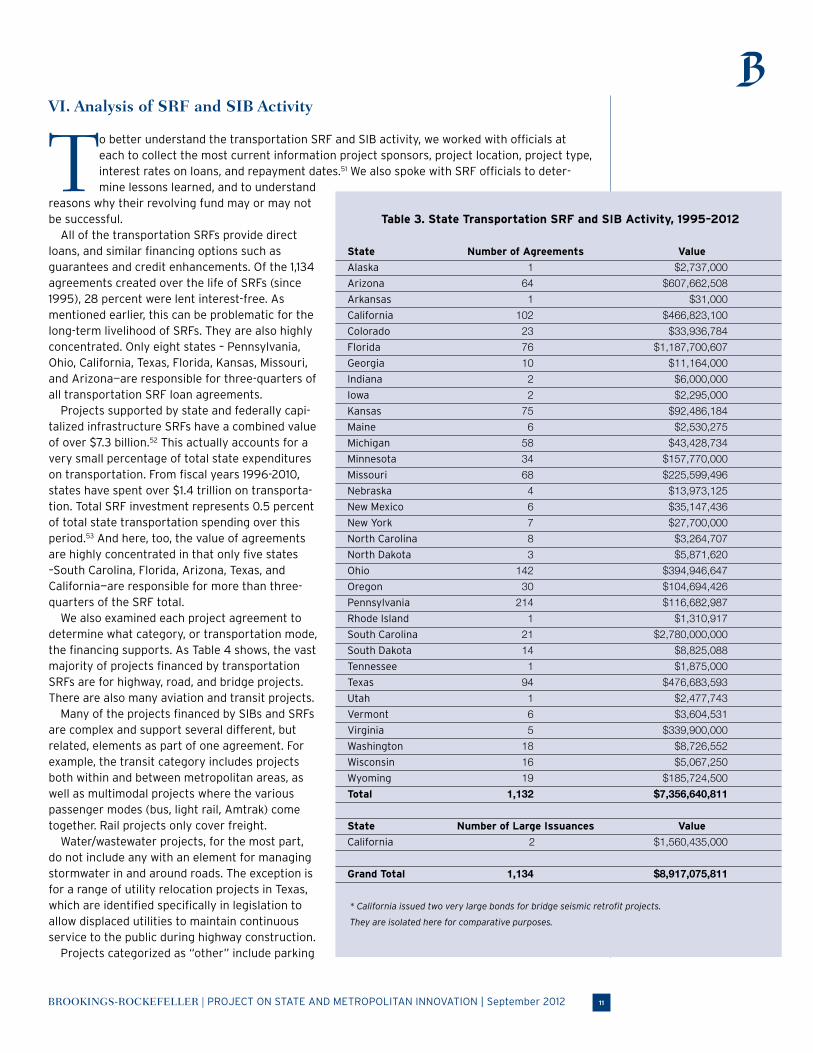
To better understand the transportation SRF and SIB activity, we worked with officials at each to collect the most current information project sponsors, project location, project type, interest rates on loans, and repayment dates.51 We also spoke with SRF officials to deter-mine lessons learned, and to understand
reasons why their revolving fund may or may not be successful.
All of the transportation SRFs provide direct loans, and similar financing options such as guarantees and credit enhancements. Of the 1,134 agreements created over the life of SRFs (since 1995), 28 percent were lent interest-free. As mentioned earlier, this can be problematic for the long-term livelihood of SRFs. They are also highly concentrated. Only eight states – Pennsylvania, Ohio, California, Texas, Florida, Kansas, Missouri, and Arizona—are responsible for three-quarters of all transportation SRF loan agreements.
Projects supported by state and federally capi-talized infrastructure SRFs have a combined value of over $7.3 billion.52 This actually accounts for a very small percentage of total state expenditures on transportation. From fiscal years 1996-2010, states have spent over $1.4 trillion on transporta-tion. Total SRF investment represents 0.5 percent of total state transportation spending over this period.53 And here, too, the value of agreements are highly concentrated in that only five states –South Carolina, Florida, Arizona, Texas, and California—are responsible for more than three-quarters of the SRF total.
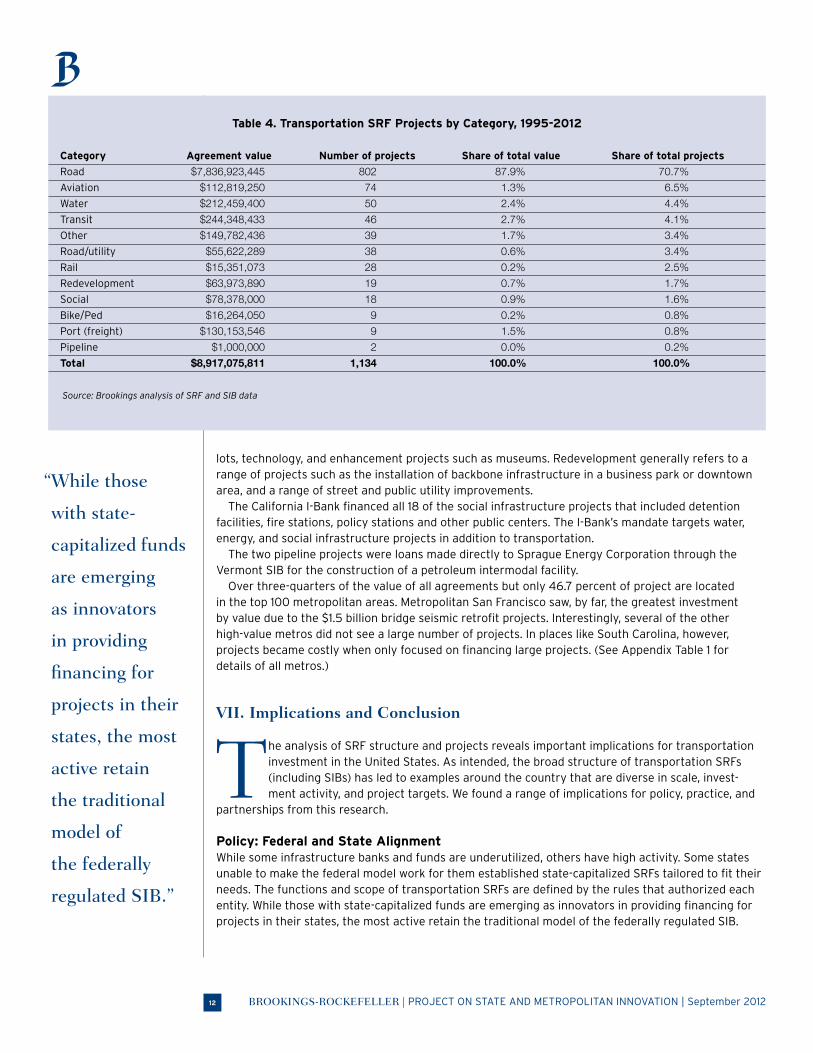
We also examined each project agreement to determine what category, or transportation mode, the financing supports. As Table 4 shows, the vast majority of projects financed by transportation SRFs are for highway, road, and bridge projects. There are also many aviation and transit projects.
Many of the projects financed by SIBs and SRFs are complex and support several different, but related, elements as part of one agreement. For example, the transit category includes projects both within and between metropolitan areas, as well as multimodal projects where the various passenger modes (bus, light rail, Amtrak) come together. Rail projects only cover freight.
Water/wastewater projects, for the most part, do not include any with an element for managing stormwater in and around roads. The exception is for a range of utility relocation projects in Texas, which are identified specifically in legislation to allow displaced utilities to maintain continuous service to the public during highway construction.
Projects categorized as “other” include parking
Table 3. State Transportation SRF and SIB Activity, 1995–2012
* California issued two very large bonds for bridge seismic retrofit projects.
They are isolated here for comparative purposes.
BROOKINGS-ROCKEFELLER | PROJECT ON STATE AND METROPOLITAN INNOVATION | September 201212
lots, technology, and enhancement projects such as museums. Redevelopment generally refers to a range of projects such as the installation of backbone infrastructure in a business park or downtown area, and a range of street and public utility improvements.
The California I-Bank financed all 18 of the social infrastructure projects that included detention facilities, fire stations, policy stations and other public centers. The I-Bank’s mandate targets water, energy, and social infrastructure projects in addition to transportation.
The two pipeline projects were loans made directly to Sprague Energy Corporation through the Vermont SIB for the construction of a petroleum intermodal facility.
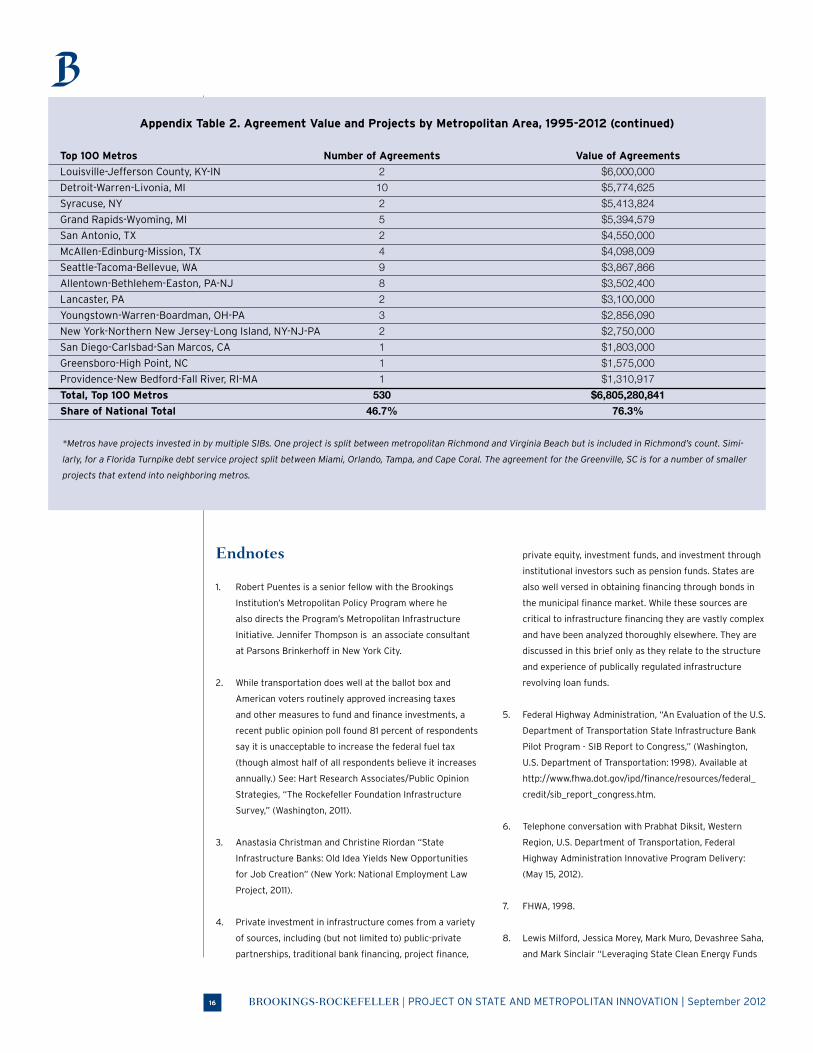
Over three-quarters of the value of all agreements but only 46.7 percent of project are located in the top 100 metropolitan areas. Metropolitan San Francisco saw, by far, the greatest investment by value due to the $1.5 billion bridge seismic retrofit projects. Interestingly, several of the other high-value metros did not see a large number of projects. In places like South Carolina, however, projects became costly when only focused on financing large projects. (See Appendix Table 1 for details of all metros.)
VII. Implications and Conclusion
The analysis of SRF structure and projects reveals important implications for transportation investment in the United States. As intended, the broad structure of transportation SRFs (including SIBs) has led to examples around the country that are diverse in scale, invest-ment activity, and project targets. We found a range of implications for policy, practice, and
partnerships from this research.
Policy: Federal and State Alignment While some infrastructure banks and funds are underutilized, others have high activity. Some states unable to make the federal model work for them established state-capitalized SRFs tailored to fit their needs. The functions and scope of transportation SRFs are defined by the rules that authorized each entity. While those with state-capitalized funds are emerging as innovators in providing financing for projects in their states, the most active retain the traditional model of the federally regulated SIB.
Table 4. Transportation SRF Projects by Category, 1995-2012
Category Agreement value Number of projects Share of total value Share of total projects
BROOKINGS-ROCKEFELLER | PROJECT ON STATE AND METROPOLITAN INNOVATION | September 2012 13
The federal government should work with SIBs and SRFs, where applicable, to identify possible sources of delay as well as ways to accelerate project delivery.
We found that many SIB officials cite compliance with federal regulations as slowing down the investment process either because of environmental and contractual requirements or due to the lack of flexibility in projects that are not Title 23 or 49 eligible. For states with smaller projects, this may be prohibitively costly compared to the advantage of using the low-cost SIB financing.
While transportation SRFs and SIBs may support nationally significant projects, this is far from an explicit goal or focus. Indeed, we found that the vast majority of projects financed by SIBs are very local in scope. There is still a clear need to establish a national infrastructure bank (NIB) to finance multi-jurisdictional projects of national significance. Projects financed by the NIB would not just be from the transportation sector, but across range of infrastructure modes, like water and energy where a ratepayer system is established.54
The creation of the NIB would also provide technical assistance and expertise to states and metro-politan areas that lack the internal capacity to deal with complex project delivery and structuring a mix of financial sources. This would show the private sector that the federal government is committed to private investment as a crucial part of infrastructure financing. In these ways, the NIB and a SIB are complementary, not redundant.
Practice: Leveraging CapitalizationLeveraging allows SRFs to increase their loan capacity and reach a broader range of sponsors and projects. This tool has been integral to South Carolina’s activity, as well as in Florida. The use and flex-ibility of state funds is not always helpful; if they are not firewalled, funds can be reallocated and SRFs will lose their source of funding. This happened in California a decade ago and is happening in Arizona now. The Arizona Highway Expansion and Extension Loan Program (HELP) which was active pre-2008 is no longer functioning. Due to the state’s fiscal crisis, appropriations that were allocated for the SIB were recently repurposed to the state’s general fund.55
The structure and financial mechanism of the SRF should be explored to see how effectively their evolved functions serve their states’ infrastructure needs.
Another capitalization issue concerns balancing the long-term sustainability of the SRF with the provision of low-interest and/or below market rate loans for public agencies. Since the majority of borrowers are public agencies that may be able to borrow in capital markets at low-interest rates, SRFs are under pressure to loan at very low and sometimes at no-interest rates. One of the principal features of SRFs is that they exist in perpetuity, recapitalizing through repayments, interest and fees. So states like South Carolina and Florida that are continuously infusing their SIBs with unreimbursed capital grants may begin to look like a hybrid between a SRF and the federal grant program. This may not be the original intent for some SRFs.
Partnerships: Local Actors and ProjectsA critical task for SRFs is developing partnerships with local actors and choosing projects for invest-ment. With a scarce amount of dollars to invest in infrastructure, having effective project selection is the most important step for ensuring that dollars provide a return on investment for the locality and state. SRFs that work closely with local partners to make sure the projects financed through SRF have high economic, environmental, or social effects will use these financing mechanisms to not only fill the infrastructure financing gap but develop their economy.
While most SRFs have some criteria for ranking projects, some find that they provide loans on a first-come, first-serve basis due to the paucity of applicants. Some have deviated from the original intent of the SIB to help provide bridge financing for local agencies waiting for federal grants.
For SIBs to become an innovative financing tool, they should focus their resources on projects that prove to have multiplicative economic benefits on the locality and region in which it is located.
Ensuring more rigorous project selection may take adopting market discipline to measure return on investment (beyond financial) of past investments, and to see if the current project selection process is delivering desired results. A detailed audit of past investments to determine how projects are currently faring would help SIB officials understand how project selection criteria could be used
BROOKINGS-ROCKEFELLER | PROJECT ON STATE AND METROPOLITAN INNOVATION | September 201214
to finance top quality projects. Lessons learned from the audit will help inform changes that can be made in criteria and eligibility of projects, and in the evaluation process. Project selection should then be reevaluated every few years to adjust to the demand on the SIB, the supply of funds, as well as the broader economic and financial environment.
Since SRFs rely on repayments, fees and interest to grow the fund over its life, having local public entities and private partners that want to buy the product is fundamental. Florida SIB officials say that they work to market the program to public entities across the state. South Carolina officials similarly attribute a good working relationship with local public entities to their success. Virginia has for years had a strong relationship with private investors and firms.
Any successful SRF is going to have to work with private and local public partners to make sure that the fund is considered an option in any project financing plan. And while initial attempts at multistate collaboration on SIBs were unsuccessful, new efforts to coordinate and leverage infrastructure invest-ments across states—such as the West Coast Infrastructure Exchange—appear promising.56
The revolving loan fund model has enabled states to stretch both federal and state dollars through loans instead of grants, and by leveraging their capital to raise more funds in municipal debt markets. The broad structure of transportation SRFs and SIBs allows states to tweak the model to meet their unique infrastructure needs, and to take the lead on innovative ways to finance beyond the federal level and evolve the current program to something more strategic and sustainable.
Appendix Table 1. Establishment of State Infrastructure Banks by Legislation
6. Telephone conversation with Prabhat Diksit, Western
Region, U.S. Department of Transportation, Federal
Highway Administration Innovative Program Delivery:
(May 15, 2012).
7. FHWA, 1998.
8. Lewis Milford, Jessica Morey, Mark Muro, Devashree Saha,
and Mark Sinclair “Leveraging State Clean Energy Funds
Louisville-Jefferson County, KY-IN 2 $6,000,000Detroit-Warren-Livonia, MI 10 $5,774,625Syracuse, NY 2 $5,413,824Grand Rapids-Wyoming, MI 5 $5,394,579San Antonio, TX 2 $4,550,000McAllen-Edinburg-Mission, TX 4 $4,098,009Seattle-Tacoma-Bellevue, WA 9 $3,867,866Allentown-Bethlehem-Easton, PA-NJ 8 $3,502,400Lancaster, PA 2 $3,100,000Youngstown-Warren-Boardman, OH-PA 3 $2,856,090New York-Northern New Jersey-Long Island, NY-NJ-PA 2 $2,750,000San Diego-Carlsbad-San Marcos, CA 1 $1,803,000Greensboro-High Point, NC 1 $1,575,000Providence-New Bedford-Fall River, RI-MA 1 $1,310,917Total, Top 100 Metros 530 $6,805,280,841Share of National Total 46.7% 76.3%
*Metros have projects invested in by multiple SIBs. One project is split between metropolitan Richmond and Virginia Beach but is included in Richmond’s count. Simi-
larly, for a Florida Turnpike debt service project split between Miami, Orlando, Tampa, and Cape Coral. The agreement for the Greenville, SC is for a number of smaller
projects that extend into neighboring metros.
Appendix Table 2. Agreement Value and Projects by Metropolitan Area, 1995-2012 (continued)
Top 100 Metros Number of Agreements Value of Agreements
BROOKINGS-ROCKEFELLER | PROJECT ON STATE AND METROPOLITAN INNOVATION | September 2012 17
for Economic Development” (Washington: Brookings,
2012).
9. Milford, Morey, Muro, Saha, and Sinclair, 2012.
10. Ken Berlin, Reed Hundt, Mark Muro, and Devashree Saha
“State Clean Energy Finance Banks: New Investment
Facilities for Clean Energy Deployment” (Washington:
Brookings, 2012).
11. Berlin, Hundt, Muro, and Saha, 2012.
12. Nancy P. Humphrey and Diane Rausa Maurice,
”Infrastructure Bond Bank Initiatives: Policy Implications
and Credit Concerns.” Public Budgeting & Finance: (38–56,
1986).
13. For example, Maine’s municipal bond bank, one of the
nation’s most active, issued approximately $28 million in
annual debt. Humphrey and Maurice, 1986.
14. The Florida Turnpike Enterprise is part of the Florida
Department of Transportation.
15. Humphrey and Maurice, 1986.
16. FHWA, 1998.
17. Federal Highway Administration, “State Infrastructure
Banks,” Washington, U.S. Department of Transportation:
2002. Available at http://www.fhwa.dot.gov/ipd/finance/
44. Telephone conversation with John Lawson, Virginia
Department of Transportation, 2012.
45. These figures for the Kansas TRF, as reflected in the
aggregate tables and charts in this policy brief, are only
through 2009. As of August 2012, the TRF approved over
100 projects with more than $135 million in agreements.
46. Office of Financial and Investment Management,
“Transportation Revolving Loan Fund Program Guide,”
(Kansas Department of Transportation, 2010). Available
at http://www.ksdot.org/burfiscal/TRF/TRFProgramGuide.
pdf.
47. Recently, one loan was approved for a CID that previously
worked with the GTIB.
48. The Finance Authority handles evaluation and administers
the state’s water SRFs.
49. Phone conversations with Steve Greenfield, Vermont
Economic Development Agency, March 27, 2012; and
Chris Ott, South Dakota Department of Transportation,
February 8, 2012.
50. Email correspondence with Dennis Leong, Wisconsin
Department of Transportation Division of Transportation
Investment Management, August 13, 2012.
51. The term “dedicated” means SRFs that were created
for the sole purpose of funding transportation and
related infrastructure projects. This includes federal and
state-capitalized SIBs, as well as state-capitalized SRFs
with broader infrastructure mandates like the California
I-Bank. Not included in this analysis is infrastructure
projects funded through economic development agencies
such as the New York Economic Development Agency and
the Alaska Industrial Development and Export Authority.
They do play an interesting role in infrastructure finance
and development and should be explored further. In the
case of the California I-Bank, we only considered projects
from the Infrastructure State Revolving Fund Program
and three bridge and port infrastructure projects financed
through the Public Agency Revenue Bond Program.
52. Projects might not necessarily refer to an individual proj-
ect, but to an agreement. For example, in South Carolina,
one loan to a local department of transportation might
allocate financing for one to thirty smaller projects.
53. Brookings analysis of National Association of State
Budget Officers, “State Expenditure Report” for fiscal
years 1996 to 2010.
BROOKINGS-ROCKEFELLER | PROJECT ON STATE AND METROPOLITAN INNOVATION | September 2012 19
Acknowledgements For their contributions to this paper, we wish to thank the state infrastructure bank coordinators and contacts in each state that provided the valuable data reflected in this report. We espe-cially thank Deborah Brown-Davis, Prabhat Diksit, Stan Hazelroth, Aaron Klein, Joung Lee, Joel Tokimitsu, Doug Vaughn, and Jennifer G. Weeks, who provided excellent comments on earlier drafts of this report. Susan Kellam and David Jackson provided helpful edits. The Metropolitan Policy Program at Brookings would like to thank the Rockefeller Foundation for their support of this work. It would also like to thank the Rockefeller Foundation and the Surdna Foundation for their support of the Program’s Metropolitan Infrastructure Initiative.
The Brookings Institution is a private non-profit organization. Its mission is to conduct high quality, independent research and, based on that research, to provide innovative, practical recommendations for policymakers and the public. The conclusions and recommendations of any Brookings publication are solely those of its author(s), and do not reflect the views of the Institution, its management, or its other scholars. Brookings recognizes that the value it provides to any supporter is in its absolute commitment to quality, independence and impact. Activities supported by its donors reflect this commitment and the analysis and recommendations are not determined by any donation.
54. While the recently expanded federal TIFIA loan program
is welcome and helpful (and has been described as an
“infrastructure bank-lite”) it is limited only to surface
transportation projects.
55. Arizona HELP Financial Statement, Fiscal Years 2010-2011.
56. Eric Siemers, “State Explores Private Equity.” Portland
Business Journal, January 27, 2012.
About the Metropolitan Infrastructure Initiative Launched in 2008, the goal of the Metropolitan Infra-structure Initiative is to develop timely, independent analysis, frame key debates, and offer policy recommen-dations to help leaders in the United States and abroad address key infrastructure challenges. This and other publications, speeches, presentations, and commentary on transportation and infrastructure are available at: www.brookings.edu/metro/InfrastructureInitiative.asp. For More InformationRobert PuentesSenior Fellow and Director,Metropolitan Infrastructure InitiativeMetropolitan Policy ProgramBrookings [email protected] For General InformationMetropolitan Policy Program at Brookings202.797.6139www.brookings.edu/metro In the Series• State Clean Energy Finance Banks: New Investment
Facilities for Clean Energy Deployment• Leveraging State Clean Energy Funds for Economic
Development• Beyond Bachelor’s: The Case for Charter Colleges of
Early Childhood Education• Community Colleges and Regional Recovery: Strategies
for State Action• Recapturing Land for Economic and Fiscal Growth Related Publications• Moving Forward on Public Private Partnerships: U.S. and
International Experience With PPP Units • Access for Value: Financing Transportation Through Land
Value Capture• Missed Opportunity: Transit and Jobs in Metropolitan
America• Moving Past Gridlock: A Proposal for a Two-Year
Transportation Law• State Transportation Reform: Cut to Invest in
Transportation to Deliver the Next Economy
About the Brookings-Rockefeller Project on State and Metropolitan Innovation This is part of a series of papers being produced by the Brookings-Rockefeller Project on State and Metropolitan Innovation. States and metropolitan areas will be the hubs of policy innovation in the United States, and the places that lay the groundwork for the next economy. The project will present fiscally responsible ideas state leaders can use to create an economy that is driven by exports, powered by low carbon, fueled by innovation, rich with opportunity and led by metropolitan areas. About the Metropolitan Policy Program at the Brookings Institution Created in 1996, the Brookings Institution’s Metropolitan Policy Program provides decision makers with cutting-edge research and policy ideas for improving the health and prosperity of cities and metropolitan areas including their component cities, suburbs, and rural areas. To learn more visit: www.brookings.edu/metro. About The Rockefeller Foundation The Rockefeller Foundation fosters innovative solutions to many of the world’s most pressing challenges, affirming its mission, since 1913, to “promote the well-being” of humanity. Today, the Foundation works to ensure that more people can tap into the benefits of globalization while strengthening resilience to its risks. For more information, please visit www.rockefellerfoundation.org.