March 2005 Investment Banking The WACC User's Guide Justin Pettit Executive Director Head of Strategic Advisory 1-212-821-6315 [email protected]Azad Badakhsh Analyst Strategic Advisory Group 1-212-821-2135 [email protected]Marc Klein Analyst Strategic Advisory Group 1-212-821-5189 [email protected]The estimation of corporate capital costs is complicated by many practical issues that create numerous degrees of freedom and lead to wide-ranging results. We provide pragmatic solutions including: A global market risk premium (MRP) of about 5%, based on historical data, market expectations, and a review of the literature Several methods to derive reliable beta estimates including direct regressions, portfolio regressions, and constructed betas A "normalized" nominal riskless rate of about 5%, based on forward looking market data A value of tax shield framework that implies lower value and higher WACCs for more leveraged or volatile situations The WACC of a convertible bond, based on its economic decomposition of debt and equity A framework for global capital costs to supplement the risk analysis and qualitative considerations involved in global investing where risks are subject to rapid change … other international risks and costs should be incorporated into the cash flows and sensitivity analysis Based in part on previously published research of one of the authors, Justin Pettit, "Corporate Capital Costs: A Practitioners Guide," Journal of Applied Corporate Finance. Vol 12 Number 1 (Spring 1999) and Justin Pettit, Mack Ferguson and Robert Gluck, "A Method for Estimating Global Corporate Capital Costs: The Case of Bestfoods" The Journal of Applied Corporate Finance. Vol 12 Number 3 (Fall 1999)
Transcript
March 2005
Investment Banking
The WACC User's Guide
Justin Pettit Executive Director Head of Strategic Advisory 1-212-821-6315 [email protected]
Azad Badakhsh Analyst Strategic Advisory Group 1-212-821-2135 [email protected]
Marc Klein Analyst Strategic Advisory Group 1-212-821-5189 [email protected]
The estimation of corporate capital costs is complicated by many practical issues that create numerous degrees of freedom and lead to wide-ranging results. We provide pragmatic solutions including:
A global market risk premium (MRP) of about 5%, based on historical data, market expectations, and a review of the literature
Several methods to derive reliable beta estimates including direct regressions, portfolio regressions, and constructed betas
A "normalized" nominal riskless rate of about 5%, based on forward looking market data
A value of tax shield framework that implies lower value and higher WACCs for more leveraged or volatile situations
The WACC of a convertible bond, based on its economic decomposition of debt and equity
A framework for global capital costs to supplement the risk analysis and qualitative considerations involved in global investing where risks are subject to rapid change … other international risks and costs should be incorporated into the cash flows and sensitivity analysis
Based in part on previously published research of one of the authors, Justin Pettit, "Corporate Capital Costs: A Practitioners Guide," Journal of Applied Corporate Finance. Vol 12 Number 1 (Spring 1999) and Justin Pettit, Mack Ferguson and Robert Gluck, "A Method for Estimating Global Corporate Capital Costs: The Case of Bestfoods" The Journal of Applied Corporate Finance. Vol 12 Number 3 (Fall 1999)
THE WACC USER'S GUIDE
Contents
OVERVIEW 1 WHAT DO INVESTORS REALLY EXPECT? 2 TOWARD A BETTER BETA 6 THE "RISKLESS" RATE 8 COST OF DEBT 9 CAPITAL COSTS & THE GLOBAL PORTFOLIO 11 APPENDIX A – COST OF CAPITAL BY INDUSTRY AND SUB-INDUSTRY 18 APPENDIX B – COST OF CAPITAL BY COUNTRY 19 BIBLIOGRAPHY 20 LIST OF TABLES 21 LIST OF FIGURES 21 STRATEGIC ADVISORY GROUP PUBLICATIONS 21
THE WACC USER'S GUIDE
1
OVERVIEW The weighted average cost of capital (WACC) is a critical input for evaluating investment decisions - it is typically the discount rate for net present value (NPV) calculations.1 And it serves as the benchmark for operating performance, relative to the opportunity cost of capital employed, to create value.2
We focus on issues that arise when calculating the cost of capital. While there have been challenges to the Capital Asset Pricing Model (CAPM), it remains the most practical approach to determine a cost of equity. In fact, many perceived limitations arise from challenges in applying the model. We draw on our research and experience to provide suggestions to deal with two of the primary difficulties in applying CAPM: (1) estimating the market risk premium (MRP) for equities; and (2) measuring the systematic risk, or “beta,” of a company.
We estimate the MRP at about 5%, based on both historical data and forward looking market data. We provide tools for deriving more reliable estimates of beta, especially helpful for business units and unlisted companies, but also illiquid stocks with unreliable betas. Direct regression is the most commonly used approach but we also employ alternative methodologies such as constructed betas, portfolio betas, segment regression betas and multi-variable regression betas. We also "normalize" the riskless rate with a forward view of the capital markets. Table 1 illustrates our WACC estimates for several sectors.
Table 1 – Cost of Capital By Industry
Power Real
Estate Consumer Energy Telecom Industrials Media Financials
SOURCE: UBS Investment Bank, Public Filings, Compustat Bloomberg (March ’05)
Our approach to global corporate capital costs quantifies and captures both sovereign risk and inflation risk. However, we do recommend that cash flows be adjusted for the costs and unsystematic risks of global investing, coupled with a more rigorous risk analysis. Given the many opportunities for profitable growth abroad, more reliable estimates of global capital costs can help ensure that companies will choose to undertake investments that show promise to add value.
1 WACC is a market weighted average, at target leverage, of the cost of after tax debt and equity. Financing
events per se may not reflect changes in financial policy and may not be permanent changes to the capital structure. Temporary fluctuations in the mix should not affect WACC. We estimate the cost of equity = Rf + beta x MRP, Rf is the riskless return, Market Risk Premium (MRP) is the expected return premium for bearing equity market risk over the riskless rate, and beta is the systematic risk of the business relative to the market.
2 Pettit, Justin, and Alisdairi, M.K., “How to Find Your Economic Profits,” UBS Investment Bank, January 2004. 3 The WACC for financial institutions is (generally) simply the cost of equity, as most debt is “funding debt” (not
financing debt) and should be expensed (not capitalized) where the cost of funds is a “cost of goods sold.”
A critical input for evaluating both investments and operating performance
Perceived CAPM limitations arise from application challenges
Global corporate capital costs capture both sovereign and inflation risk
THE WACC USER'S GUIDE
2
WHAT DO INVESTORS REALLY EXPECT? The return premium afforded by stocks over long government bonds (i.e. market risk premium) is generally believed to be anywhere from 3% to 8%. The widely cited Ibbotson and Sinquefeld study (generally 7-8%), is based on the U.S. arithmetic mean from 1926. It's not that 1926 was an important year in econometric history - this is just when the market tapes started to be archived.
If the study started either one year earlier, or one year later, the risk premium would change by a full percentage point. Other U.S. studies (employing manual data retrieval) do go back much further (to when the market was largely railroad stocks) and provide estimates closer to the low end of the range.4 Some studies rely on more recent history and this again leads to the lower end of the range.
Provided the data represent a “random walk” and there are no discernible trends up or down, more observations will lead to greater predictive accuracy. However, structural economic changes over the past century make the early data much less relevant for estimating expected returns today. Macroeconomic factors have conspired such that, in our opinion, a shorter history is more appropriate.
Based on both the arithmetic average of annualized monthly return premiums, and forward looking multiples, stock market investors now expect about a 5% premium for bearing the market risk of equities. The risk of holding equities has generally declined while at the same time the risk of investing in government bonds has increased - reducing the premium between these two security classes.5
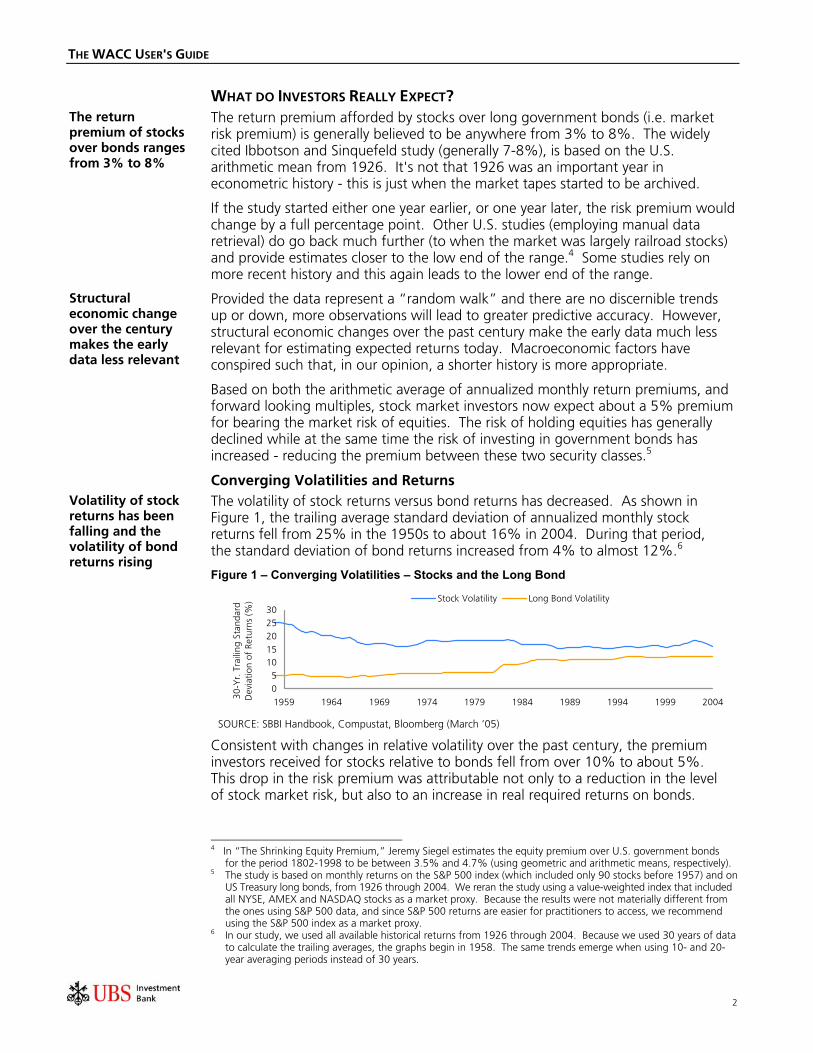
Converging Volatilities and Returns The volatility of stock returns versus bond returns has decreased. As shown in Figure 1, the trailing average standard deviation of annualized monthly stock returns fell from 25% in the 1950s to about 16% in 2004. During that period, the standard deviation of bond returns increased from 4% to almost 12%.6
Figure 1 – Converging Volatilities – Stocks and the Long Bond
Consistent with changes in relative volatility over the past century, the premium investors received for stocks relative to bonds fell from over 10% to about 5%. This drop in the risk premium was attributable not only to a reduction in the level of stock market risk, but also to an increase in real required returns on bonds.
4 In “The Shrinking Equity Premium,” Jeremy Siegel estimates the equity premium over U.S. government bonds
for the period 1802-1998 to be between 3.5% and 4.7% (using geometric and arithmetic means, respectively). 5 The study is based on monthly returns on the S&P 500 index (which included only 90 stocks before 1957) and on
US Treasury long bonds, from 1926 through 2004. We reran the study using a value-weighted index that included all NYSE, AMEX and NASDAQ stocks as a market proxy. Because the results were not materially different from the ones using S&P 500 data, and since S&P 500 returns are easier for practitioners to access, we recommend using the S&P 500 index as a market proxy.
6 In our study, we used all available historical returns from 1926 through 2004. Because we used 30 years of data to calculate the trailing averages, the graphs begin in 1958. The same trends emerge when using 10- and 20-year averaging periods instead of 30 years.
The return premium of stocks over bonds ranges from 3% to 8%
Structural economic change over the century makes the early data less relevant
Volatility of stock returns has been falling and the volatility of bond returns rising
THE WACC USER'S GUIDE
3
What Has Changed?
Several factors contribute to support the notion that earlier history may be less relevant to the ex post derivation of expected equity returns. We have documented the impact in our charts and speak to the possible causes below:
Regulation & Public Policy. Prudent monetary policies of the Federal Reserve and its foreign counterparts, as well as the general liberalization of regulatory policies, appear to have reduced the volatility of business cycles. 7 Liberalization of developing economies, establishment of trading blocks, and the increase of international trade have all contributed to global economic growth and stability, despite tremendous political change and upheaval.
Growth & Globalization. Growth in worldwide market capitalization affords more liquidity, less net volatility, and less net risk. The growth of emerging markets helps to buffer the down cycles of developed economies. Emerging markets also help drive developed economies to invest further in human and technical capital. Emerging market volatility is often, in turn, buttressed by the developed markets. Although claims of a borderless global economy are overstated, there is a reduced sensitivity to the economics of any single nation, which reduces systematic risk.
Market Sophistication. Despite claims to the contrary, the proliferation of risk management products (interest rate, f/x, commodity, and equity) has increased the liquidity of risk, allowing it to be isolated, traded, syndicated and managed. Most individuals invest in the market through funds and institutions leading to an increased sophistication and change in the nature of our equity markets.
Information & Technology. Despite recent accounting scandals, disclosure is more immediate and comprehensive, reducing uncertainty and required returns. Notwithstanding Regulation FD, segment data, reporting requirements, and analyst coverage are all more extensive and of higher quality today than 50 years ago. And technology has reduced the price and raised the quality of information processing.
Labor Mobility. The nature of employment has changed. Tremendous growth in the service sector allows service and manufacturing cycles to be somewhat offsetting. Service economies also have less fixed costs and are thus less susceptible to pricing pressures in times of over-capacity. The trend toward mobile, marketable knowledge workers helps reduce fixed costs and improve resource allocation.
Agency Costs. Large institutional investors today are much more active in influencing companies to maximize shareholder value, which reduces the risk of common stock. This force is supported by the success of LBOs and the widespread adoption of value-based management. The importance of agency costs and ownership concentration in improving corporate performance are well documented.
7 In “The End of the Business Cycle” (Foreign Affairs, Volume 76 Number 4 (July/August 1997), Steven Weber of
University of California at Berkeley makes a strong case for fundamental structural economic and capital market changes making observations of events in US history less representative of responses in the future.
Prudent monetary policies have reduced business cycle volatility
How Much History? Consistent with changes over the past century, the premium investors received for stocks relative to bonds (Figure 2) fell from over 10% to about 5%. With such a clear trend in the data toward lower equity premiums it would be a mistake to go too far back in time when estimating the market risk premium.
Figure 2– Declining Market Risk Premium
-505
10152025
1958 1964 1970 1975 1981 1987 1993 1998 2004
Trai
ling
MR
P O
ver
Lon
g B
on
ds
(%)
10 Year Rolling Average 20 Year Rolling Average 30 Year Rolling Average
The estimate of the market risk premium (Figure 3) depends on how much history is used. Indeed, one could almost justify any premium. The far left observation on the graph uses only returns for 2004 (-5%). Moving right adds more history. The estimate at the extreme right uses all 78 years of available history (+7%).
Figure 3 – Market Risk Premium Depends on How Much History
Structural changes in the economy and markets may suggest that more recent data provide a better basis for predicting the future. Provided you choose a period that goes back at least as far as the early 1980s, it is clear that the market risk premium has drifted down. The question that one must answer is: How far down, and can we expect it to cycle back up? We have chosen to use the second part of the past century (instead of ¾), a sufficiently long period to achieve statistical reliability, while avoiding the potentially less relevant early market returns. Consequently, we estimate the market risk premium over the long bond to be about 5%.
A Global Risk Premium? Several recent international studies have provided similar results - yielding estimates of the market risk premium in the vicinity of 5%.8 Most market studies from other countries also tend to draw on shorter histories - their earlier data is often unavailable, unreliable, or irrelevant due to significant changes in exchange controls and monetary policy. Foreign market derivations of market risk premiums are often undermined by unreliable historical information, irrelevant history and liquidity issues, making the analysis and its conclusions suspect both for many major and
8 The market risk premium was estimated to be proximate to 5% in various studies. Ibbotson, Roger G., and
Chen, Peng, “Long-Run Stock Returns: Participating in the Real Economy.” Financial Analysts Journal, 59, 88-98. Also see Mayfield, E. Scott, “Estimating the Market Risk Premium.” Journal of Financial Economics, Volume 73, Issue 3, September 2004.
The premium investors received for stocks relative to bonds fell from over 10% to 5%
International studies provide similar results
THE WACC USER'S GUIDE
5
emerging markets. And yet, current and future differences in taxes, treatment of dividends, etc. may make a global market risk premium somewhat premature.
Yet under the forces of globalism and capital market convergence, many experts now suggest that increasingly the US market may serve as the best proxy for a future global market risk premium.9 The U.S. has the largest economy and the most liquid capital markets. Consequently, the 5% risk premium seems appropriate for other markets, after adjusting for differences in tax rates, etc.
Market-Implied Risk Premium In Figure 4, we benchmark our historically derived market risk premium against the implied market risk premium of today's market capitalization and earnings, under different assumptions for future earnings growth and reinvestment.10 While the assumption of constant growth is problematic for an individual company, it is more appropriate for an analysis of the broader market.
Based on today's market capitalization, depending on assumed future growth rates and dividend yields, the dividend discount model implies a cost of equity of about 10% and a market risk premium of about 5%, using a riskless rate of 4-5%. Estimates of long-term sustainable nominal growth rates now range from 5-7%, consistent with expected inflation of 2-3% and real GDP growth of 3-4%.
Sustainable growth rates may also be gauged with the retention growth model, which derives growth rates from expected returns on equity (ROE) and plowback ratios (1- payout ratio).11 From this approach, we estimated nominal growth rate around 6-7% (Figure 5) and a cost of equity for the market of 9-10%. Again, this approach supports a market risk premium on the order of 5%.
Figure 5 – Sustainable Growth Estimates Return on Equity
9 An excellent discussion of globalism and its impact on integrated and integrating capital markets leading both to
falling risk premiums and risk premium convergence is presented by Rene Stulz, “Globalization, Corporate Finance, and the Cost of Capital,” Journal of Applied Corporate Finance, Vol. 12 No. 3 (Fall 1999).
10 The dividend discount model (Gordon growth model) assumes growth rates remain constant over time. While this may be problematic on a microeconomic basis, it is more useful on a broader market basis. Solving for cost of equity, the Gordon growth model can be expressed as Ke=[(Div0/P0)*(1+g)]+g, where Div0 represents the annual market dividend payments (approximately $185mm at 2/7/2005); P0 is equal to the total market capitalization of the index ($11.1bn at 2/7/2005); and g is equal to the estimated dividend growth rate.
11 Retention growth assumes historical returns on book equity (i.e., net income/book equity) as a proxy for future growth rates based on an earnings retention ratio (i.e., 1- dividend payout). This method is an ex-ante approach to calculating expectations of future growth rates as follows: (Return on Equity) * (Retention Ratio). Damodaran, Aswath, Investment Valuation, John Wiley & Sons, Inc., 1993.
The US market may serve as the best proxy for a global market risk premium
Today's market implies a cost of equity of 10% and MRP of 5%
We estimate nominal growth at 6-7% and a cost of equity of 9-10%
THE WACC USER'S GUIDE
6
TOWARD A BETTER BETA The determination of a robust proxy for systematic risk (beta) is often a problematic area in the calculation of the cost of equity - not only for business units and private companies but also for illiquid stocks or public companies with very little meaningful historical data. Beta is typically the regression coefficient that describes the slope of a line of “best fit” through a history of dividend-adjusted stock and market returns (Figure 6). While reasonable and statistically meaningful betas can be difficult to determine, let’s not throw out the baby with the bathwater—we provide some alternative methods to apply CAPM with a reliable measure of systematic risk.
1. Direct Regression Most typically calculated using the most recent 60 monthly returns, other sampling periods and frequencies can be more appropriate. For example, for sectors affected by the "tech bubble" or "9/11" a three year sampling of weekly data may be more appropriate. How much history is relevant to your company or industry? Beyond a qualitative assessment for fundamental changes in risk, check the data.12
If no discernible trend is evident and the data represent a random walk, longer periods can be employed to provide more data and improve reliability. If a trend is evident or sufficient history is not available, more data can be derived from the shorter history with weekly or even daily returns to provide enough data for a
meaningful regression. Analyze the residuals of a regression by plotting or sorting–what is not explained by the regression. Re-regressing the interquartile or interdecile range of data should provide a similar slope (i.e. beta) but can give a much better “fit” (i.e. a more statistically significant coefficient of determination). However, if the slope changes, it raises questions around which slope is correct
2. Industry Betas Many stocks or markets are less liquid or have too little history, potentially leading to spurious results if the beta is determined overly mechanically. A simple solution in such cases, as well as for private companies and business units, is to determine a proxy for systematic risk by calculating an industry beta. The underlying assumption is that the systematic risk is similar for all businesses in that industry. However, these approaches can be sensitive to the selection of peers.
a) Simple Mean or Median of Unlevered Beta: A simple mean or median of pure-play comparable unlevered betas (i.e. asset betas) may serve as a representative proxy for the company unlevered beta.13 The unlevered beta is then relevered based on a target capital structure.
12 Potential questions might probe the interpretation and sensibility of the regression coefficients, summary statistics,
and residuals. Sorting the residuals will help you to flag and understand suspect data, as well as to guide your choices regarding the amount of history and length of the return periods to be used.
13 The asset beta, or unlevered beta, is adjusted to exclude financial risk from the market beta: Unlevered Beta = D/EV * Debt Beta (1-tax rate) + (1 - D/EV) * Levered Beta. Debt Beta may be estimated from credit spreads or
Estimating beta is problematic for unlisted or illiquid stocks
Typically derived from 60 months, other sampling periods and frequencies can be more appropriate Figure 6 – Beta Regression Illustration
-10
-5
0
5
10
-10 -5 0 5 10
Market Returns (%)
Indu
stry
Ret
urns
(%
)
SOURCE: UBS Investment Bank Illustration
Sort the residuals on size and plot by time. Re-regress the interquartile or interdecile range
THE WACC USER'S GUIDE
7
b) Portfolio Beta: Where leverage ratios are similar across an entire industry, a portfolio beta may serve as a proxy for a company beta. The portfolio beta is derived from a single regression of cross-sectional returns for all company-market return points. Include as much data as possible to minimize bias from any point.
3. Secondary Regression by Segment In cases of highly vertically integrated industries (financial services, resource industries), where there are often only a few pure-play peer companies, a secondary regression by segment can be employed to determine a pure-play beta. This is especially helpful for estimating segment, or line-of-business, costs of capital within integrated industries. The dependent variable is each company’s unlevered beta while the independent variables are the percentage exposures to different business segment (e.g. by revenue, assets, or operating income). For example, Table 2 illustrates the development of an unlevered lumber beta of 0.50, versus the higher 0.66 for paper products, within the integrated forest products industry.14
Table 2 – Segment Beta Regression Illustration
Company Beta Debt
(%) Asset Beta
Lumber (%)
Paper (%)
Other (%)
International Paper 0.99 40 0.70 49 44 7 : : : : : : : Temple-Inland 1.26 51 0.77 12 57 31 Boise Cascade 1.99 54 0.69 17 36 47 Industry 0.50 0.66 nm SOURCE: UBS Investment Bank Illustration
4. Constructed Beta A constructed beta is especially helpful for illiquid stocks where the beta is artificially depressed by a low correlation to the market due to extremely low stock liquidity. Betas can be constructed as the product of an industry-portfolio correlation coefficient and a company-specific relative volatility coefficient:
Volatility of market returns may be measured directly from market data, as can a correlation coefficient for the industry (Figure 7). If the business is not traded, relative volatility may be estimated from the standard deviation of changes in capitalized NOPAT, or EBIT, as a proxy for return volatility.
Figure 7 – Constructed Beta Illustration
Correlation = 69%
-10
-5
0
5
10
-10 -5 0 5 10
Market Returns (%)
Indu
stry
Ret
urns
(%)
Returns Volatility
Market Vol = 21%
Company Vol = 40%
Constructed Beta =69% x 0.40 / 0.21 = 1.31
SOURCE: UBS Investment Bank Illustration
direct regression of market data. The beta for a conglomerate is a weighted average of division betas, based on each division’s contribution to the firm’s intrinsic value (capitalized operating cash flow may serve as a proxy).
14 While the t-statistics were all highly significant, the “other” beta is clearly not meaningful due to the wide mix of other segments within which diversified forest products companies operate.
A single regression of cross-sectional returns for all company-market return points
A secondary regression for estimating segment, or line-of-business capital costs in integrated industries
A construct for where beta is artificially depressed by low market correlation due to low stock liquidity
THE WACC USER'S GUIDE
8
If operating results, which are generally available on monthly basis, exhibit seasonality we recommend regressing the percentage change in capitalized NOPAT or EBIT over the same period last year against respective annual market returns.
5. Multi-Variable Regression Beta We employ a novel approach for “hybrid” businesses that share the characteristics of multiple sectors. For example, a privately owned industrial biotechnology company shares specialty chemicals, pharmaceuticals and biotechnology characteristics. Our multivariable regression incorporates valuable, company-specific data found to be related to different degrees of systematic risk (Table 3).
Our regression predicts an asset beta of 1.49 based on the company’s key drivers (size, growth, R&D, margins, and capital turns) relative to those of publicly traded pharmaceutical, biotechnology, and specialty chemicals companies.15
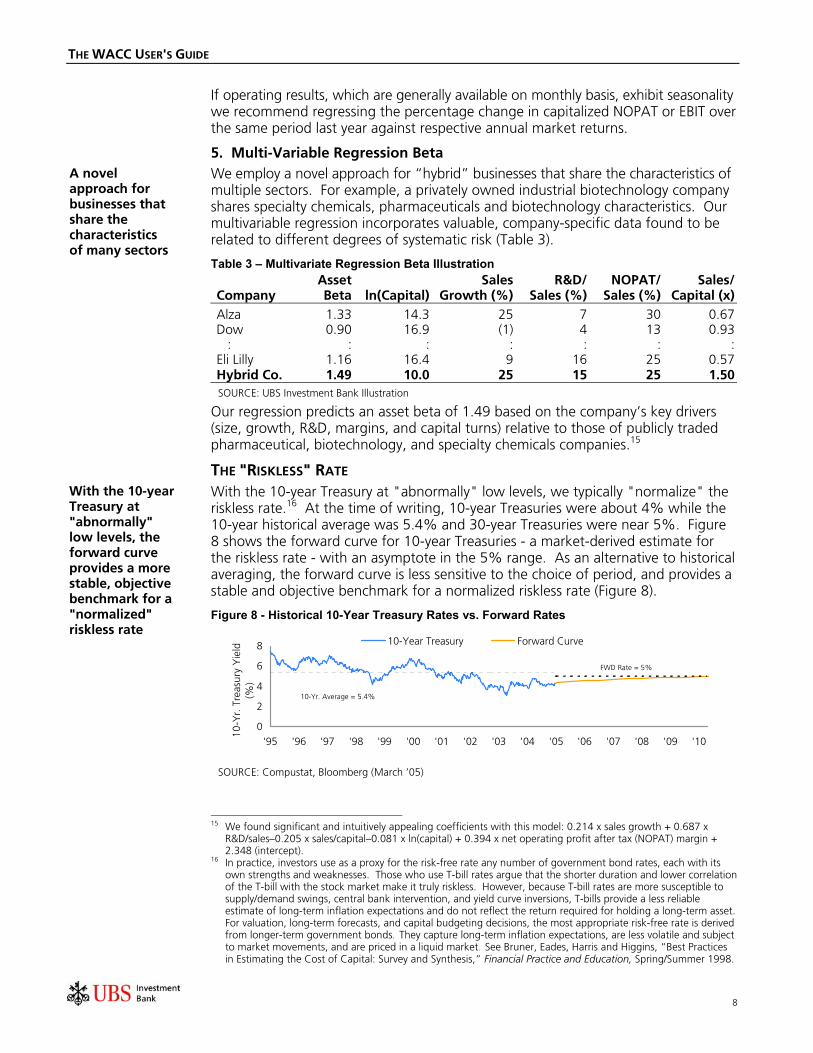
THE "RISKLESS" RATE With the 10-year Treasury at "abnormally" low levels, we typically "normalize" the riskless rate.16 At the time of writing, 10-year Treasuries were about 4% while the 10-year historical average was 5.4% and 30-year Treasuries were near 5%. Figure 8 shows the forward curve for 10-year Treasuries - a market-derived estimate for the riskless rate - with an asymptote in the 5% range. As an alternative to historical averaging, the forward curve is less sensitive to the choice of period, and provides a stable and objective benchmark for a normalized riskless rate (Figure 8).
Figure 8 - Historical 10-Year Treasury Rates vs. Forward Rates
15 We found significant and intuitively appealing coefficients with this model: 0.214 x sales growth + 0.687 x
R&D/sales–0.205 x sales/capital–0.081 x ln(capital) + 0.394 x net operating profit after tax (NOPAT) margin + 2.348 (intercept).
16 In practice, investors use as a proxy for the risk-free rate any number of government bond rates, each with its own strengths and weaknesses. Those who use T-bill rates argue that the shorter duration and lower correlation of the T-bill with the stock market make it truly riskless. However, because T-bill rates are more susceptible to supply/demand swings, central bank intervention, and yield curve inversions, T-bills provide a less reliable estimate of long-term inflation expectations and do not reflect the return required for holding a long-term asset. For valuation, long-term forecasts, and capital budgeting decisions, the most appropriate risk-free rate is derived from longer-term government bonds. They capture long-term inflation expectations, are less volatile and subject to market movements, and are priced in a liquid market. See Bruner, Eades, Harris and Higgins, “Best Practices in Estimating the Cost of Capital: Survey and Synthesis,” Financial Practice and Education, Spring/Summer 1998.
A novel approach for businesses that share the characteristics of many sectors
With the 10-year Treasury at "abnormally" low levels, the forward curve provides a more stable, objective benchmark for a "normalized" riskless rate
THE WACC USER'S GUIDE
9
COST OF DEBT WACC is calculated using the marginal cost of corporate debt – i.e. the yield the company would incur for borrowing an additional dollar. Credit quality and corporate bond ratings are the primary determinants of the cost of debt, and are influenced by factors such as size, industry, leverage, cash flow and coverage, profitability, and numerous qualitative factors (Figure 9).17
Interest expense is not an accurate reflection of a corporation’s true cost of debt. The average coupon currently paid by a corporation is the result of yields and credit rating at the times of issuance, and may not reflect the market environment or corporate credit quality. Nor is it a marginal cost.
Figure 9 – The Costs of Debt
5.34.33.73.32.92.41.51.31.21.10.90.80.70.6
4.24.24.24.24.24.24.24.24.24.24.24.24.24.2
9.58.5
7.97.57.16.6
5.75.55.45.35.15.04.94.8
-
2
4
6
8
10
AA
A
AA
A+
A A-
BB
B+
BB
B
BB
B-
BB
+
BB
BB
-
B+
B B-
Cos
t of
Deb
t (%
)
Average 10-Year Spread 10-Year Treasury Rate Current Spreads
SOURCE: Bloomberg (March ’05)
Finally, the WACC calculation is based on an after tax cost of debt. However, higher degrees of financial leverage and cash flow volatility will lead to lower expected values for each dollar of tax shield. There will be less profits to shield, a loss in time value from loss carry forwards, and an increased risk of financial distress.
Table 4 – Expected Value Tax Shield Estimation Annual Volatility of Stock Returns (%)
We approximate this effect by analyzing the risk-laden corporate debt as risk-free debt less a put option on the assets of the firm, with a strike price equal to the face value of the debt.18 Based on option valuation framework, the probability of being able to utilize the interest tax shield decays under increased leverage, volatility, and duration.19 Table 4 estimates this impact over a range of leverage and volatilities.
17 Please refer to Pettit, Justin, Orlov, Serguei and Kalsekar, Ashwin, “The New World of Credit Ratings,” UBS
Investment Bank, September 2004. 18 At the debt's maturity equity-holders can "put" the firm assets to debt-holders in exchange for the face value of
debt (in bankruptcy the debt is effectively forgiven when debt-holders take possession of the assets). However, if the Company's assets' value declines below the face value of its debt, the bondholders suffer a loss.
19 From the Put-Call parity we derive the probability that a firm will not be able to make a payment on its debt obligations and thus will not realize a tax shield (G). S–Call (S) = PV (Strike Price @ Rf) – Put (S), where S is the
We also "normalize" credit spreads for financial policy purposes
Higher financial leverage and cash flow volatility lowers the expected value of tax shield
THE WACC USER'S GUIDE
10
Hybrid Instruments Convertibles can offer issuers significant tax advantages while minimizing cash servicing costs via amortization of the warrant value. WACC estimations are complicated by the introduction of hybrids into the capital structure. This is most easily resolved through an effective bifurcation of the instrument's value into debt and equity to reflect the true target debt-equity mix (Table 5). However, for ratings agency purposes, cash-pay converts are typically treated as debt until conversion. This is true regardless of how "in-the-money" they become. Some hybrids, such as mandatory convertibles, do receive some equity credit for ratings purposes.20
Table 5 – Anatomy of a Convertible Illustration NC First Put 5
Share Price 30.00
Exercise Price Premium (%)21 33.3 Option Term in Years 19 5 Risk-Free Rate (%) 22 3.9 Equity Volatility (%) 19 35 Warrant Value ($) 23 5.0 Number of Warrants/Bonds 25.0
Equity Portion
Warrant Portion Value ($) 23 124
Book Value ($) 19 1,000 Coupon (%) 1.50 Discount Rate (%) 22 4.3
Debt Portion
Straight Value ($) 23 876
Source: UBS Investment Bank Illustration In Table 6 we illustrate the effective WACC of a convertible security as a weighted average of cost of the debt and equity portions. The cost of the debt is the grossed up yield (coupon + accretion). The cost of the equity is the cost of warrant equity.19
Table 6 - Weighted Average Cost of a Convertible NC First Put 5
Convertible Yield (%) 1.50 Debt Portion of Total Value (%) 88 Grossed up Yield (%)24 1.7 Probability of Conversion 59 Tax Rate (%) 30 Expected Tax Benefit (%) 0.5 After Tax Cost of Debt (%) 1.2
Cost of Debt
Debt Portion of Total Value (%) 88
WACC Weighted Average Cost of Convertible 3.4
SOURCE: UBS Investment Bank Illustration
assets of the firm, Call (S) is the value of Equity, PV (Strike Price @ Rf) is the value of riskless debt (Df), PV (Strike Price @ Rf) – Put (S) is the value of risky Debt (Dr). Hence, Assets – Equity = Risky Debt. Dr/Df = (PV (Strike Price @ Rf) – Put (S))/PV (Strike Price. @ Rf) = 1–Put (S)/PV (Strike Price @ Rf) = G. Key inputs in the option valuation are time to maturity and volatility of returns of the underlying asset, in this case the Enterprise Value. We calculate the later number as the volatility of a market value-weighted portfolio of equity and debt.
20 Refer to Moody’s Rating Methodology Handbook, April 2003; S&P’s Corporate Ratings Critera, 2003; Fitch’s Corporate Ratings Methodology, June 2003.
21 Exercise Price Premium= (Strike Price/Share Price) – 1 22 Risk-Free Rate = Treasury rate with a tenor matching the option term in years; Discount Rate (%) = Average
“BBB-“ 10-year corporate bond yields 23 Warrant Value estimated using Black Scholes option pricing formula; Straight Debt Portion of Total Value = 1-
Warrant Value/ Value of the Convertible Bond; Warrant Beta = Equity Beta*Warrant Beta*Warrant Delta*Share Price/Warrant Premium (Financial Theory and Corporate Policy, 3rd Ed, T.E. Copeland, FJ. Weston, pp 473-478).
24 Grossed up Yield = Convertible Yield/Debt Portion of Total Value
Convertibles offer significant tax advantages while minimizing cash servicing costs via amortization of the warrant value
The effective WACC of a convertible is a weighted average cost of debt and equity portions
THE WACC USER'S GUIDE
11
CAPITAL COSTS & THE GLOBAL PORTFOLIO Under the pressure of weak earnings and depressed valuations, companies now face unprecedented demand for profitable, long-term growth. Corporate expansion through foreign direct investment offers investors valuable growth opportunities.
Corporations pursuing global growth accomplish something their investors appear unwilling or unable to do themselves.25, 26 Despite the development and integration of world financial markets, investors continue to behave as if there are substantial costs to foreign portfolio investment. Global growth remains an essential part of the strategy of most large companies today.
However, today's corporate financial management practices are decidedly at odds with the strategic benefits of foreign direct investment. Indeed, there may be no other area where corporate practice diverges so far from finance theory. Many still cling to standard practices and ad hoc rules of thumb where excessive hurdle rates for overseas operations and investments often impede value-enhancing growth.
However, although the investment returns in emerging economies are often more volatile than the returns on domestic operations, emerging market investments do not contribute as significantly as one might expect to the risk of a multinational corporation’s (MNC) portfolio.27 One of the key issues behind the wide range of approaches, in practice, is the extent to which capital markets are now integrated.
A Segmented Markets Perspective A local country perspective, assumes that country managers operate and invest within the isolation of their own respective local markets. This perspective treats each country operation as a stand-alone investment and uses a "local" version of CAPM with local equity risk indices, local market risk premiums, debt costs and country risk premiums. While this approach reflects managers' intuition that international markets exhibit higher risk—it ignores the more global view of shareholders and the beneficial effects of a diverse MNC portfolio, and often leads to numerous practical challenges in obtaining reliable and intuitive results. From a corporate financial policy perspective, this approach also introduces considerable complexity, communications challenges, and administrative burden.
An Integrated Markets Perspective An integrated markets perspective views investments as components of a global portfolio. This approach calls for uniformly allocating the corporate portfolio's net sovereign risk, inflation risk, and diversification effects to each and every country-business unit or investment - one source of capital, and one cost of capital, for all.
Each element of the corporate portfolio fully bears the risks and benefits of the portfolio, irrespective of its contribution to the systematic risk of the corporate portfolio. While this works well for the consolidated cost of capital, for country-operations and investments we propose a hybrid perspective that captures the marginal impact to the systematic risk of the corporate portfolio.
25 Ian Cooper and Evi Kaplanis, "Home Bias in Equity Portfolios and the Cost of Capital for Multinational Firms,"
Journal of Applied Corporate Finance, Volume 8 Number 3 (Fall 1995). 26 Global diversification is a strategy to cope with economic exposures that market integration and risk
management were supposed to eliminate, but did not. Dennis E. Logue, "When Theory Fails: Globalization as a Response to the (Hostile) Market for Foreign Exchange," Journal of Applied Corporate Finance, Volume 8 Number 3 (Fall 1995).
27 The global CAPM and application to Nestle is outlined by Rene M. Stulz, "Globalization of Capital Markets and the Cost of Capital: The Case of Nestle," Journal of Applied Corporate Finance, Volume 8 Number 3 (Fall 1995).
Financial management practices are at odds with the strategic benefits of foreign direct investment
THE WACC USER'S GUIDE
12
Our Case for a Hybrid Perspective Although world financial markets are now much more integrated than they were twenty years ago, several factors continue to contribute to a significant degree of market segmentation. Perhaps most important, investors in all nations are still most comfortable investing in companies in their home markets, leading to the well-documented "home bias" in investor portfolios. But there are also legal, tax, accounting and regulatory barriers at work.
As a result of these impediments to well-functioning markets, many of the world's capital markets – particularly emerging markets—have continued to exhibit signs of illiquidity – or, depending on your interpretation, market inefficiencies – that are associated with market segmentation. But, far from discouraging foreign direct investment by corporations, these barriers, in fact, make the benefits of foreign direct investment even greater than if markets were completely integrated.
In a world that remains at least partly segmented, foreign direct investment is still capable of providing the firm's shareholders with investment opportunities and diversification benefits they cannot obtain on their own. Moreover, as global economies and financial markets continue the process of integration, this diversification benefit of foreign direct investment will gradually disappear; but other benefits – notably the reduction in risks (sovereign and inflation) that come with global integration – will take its place.
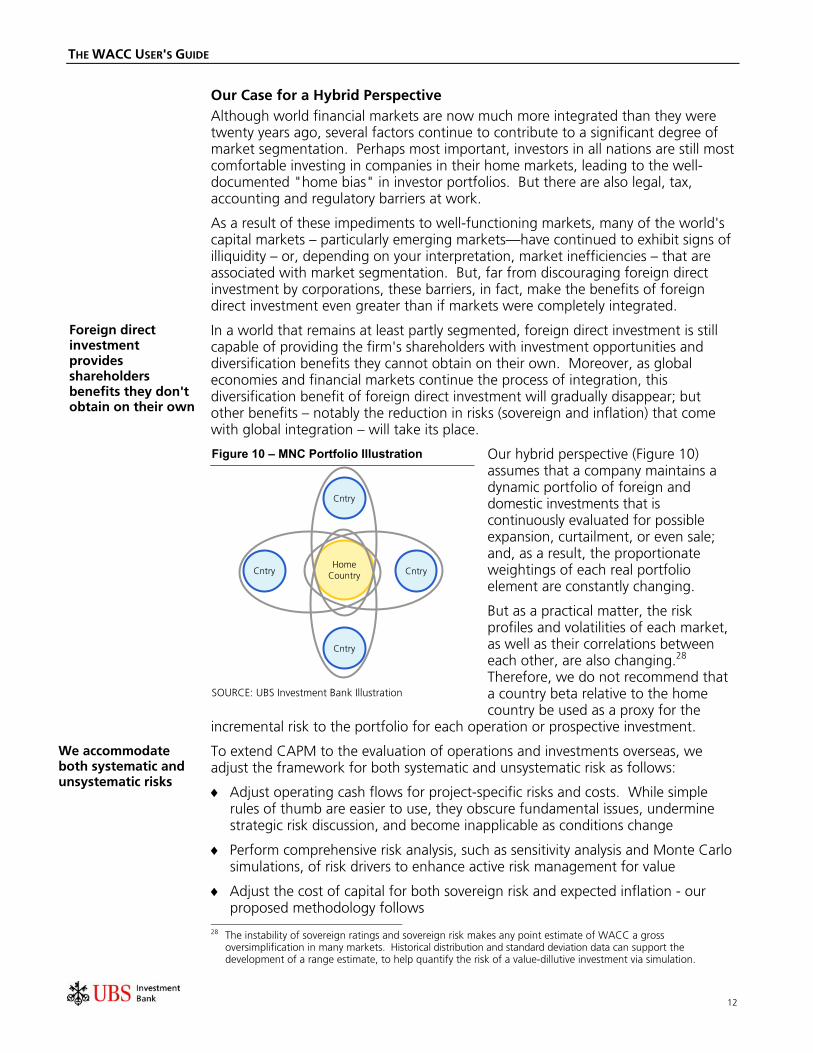
Our hybrid perspective (Figure 10) assumes that a company maintains a dynamic portfolio of foreign and domestic investments that is continuously evaluated for possible expansion, curtailment, or even sale; and, as a result, the proportionate weightings of each real portfolio element are constantly changing.
But as a practical matter, the risk profiles and volatilities of each market, as well as their correlations between each other, are also changing.28 Therefore, we do not recommend that a country beta relative to the home country be used as a proxy for the
incremental risk to the portfolio for each operation or prospective investment.
To extend CAPM to the evaluation of operations and investments overseas, we adjust the framework for both systematic and unsystematic risk as follows:
♦ Adjust operating cash flows for project-specific risks and costs. While simple rules of thumb are easier to use, they obscure fundamental issues, undermine strategic risk discussion, and become inapplicable as conditions change
♦ Perform comprehensive risk analysis, such as sensitivity analysis and Monte Carlo simulations, of risk drivers to enhance active risk management for value
♦ Adjust the cost of capital for both sovereign risk and expected inflation - our proposed methodology follows
28 The instability of sovereign ratings and sovereign risk makes any point estimate of WACC a gross
oversimplification in many markets. Historical distribution and standard deviation data can support the development of a range estimate, to help quantify the risk of a value-dillutive investment via simulation.
Foreign direct investment provides shareholders benefits they don't obtain on their own
Figure 10 – MNC Portfolio Illustration
Cntry
Cntry
Cntry
HomeCountryCntry
SOURCE: UBS Investment Bank Illustration
We accommodate both systematic and unsystematic risks
THE WACC USER'S GUIDE
13
Risks & Returns of Global Investing Beyond profitable growth, there are strategic benefits to global investing. Today’s global companies are often more attractive than their domestic peers who missed their chances to “go global,” in part, because of inflated international hurdle rates.
Consider the case of Japanese foreign direct investment in the US in the '80s. These "transplants" enjoyed relief with low cost manufacturing resulting from an unexpected strengthening of the yen against the dollar. Had production remained in Japan, supply to the large US market would have been very uncompetitive.
But the returns of global investment cannot be realized without significant risk – global investing entails risks and costs incremental to those domestic investing. We distinguish clearly between unsystematic and systematic risks, and propose approaches to the treatment of each (Figure 11).29
Figure 11 – Cost of Capital Reflects Systematic Risks
♦ International Costs
♦ Project Risks
Typically thesecosts or risks areNOTcompounding
Therefore make aNON-Compounding
Adjustmentfor these risks through
NOPAT
Non-Systematic Risk whichincludes:
Systematic Riskwhich includes:
International Riskis divided into Two
Categories of Risk
♦ Sovereign Risks
♦ Currency Risks
♦ Diversification Benefit
Typically thesecosts or risksAREcompounding
Therefore make aCompounding
Adjustmentfor these risks through
COST OF CAPITAL SOURCE: UBS Investment Bank Illustration
Unsystematic Risks & Costs Foreign direct investment brings new and significant incremental costs (foreign legal and tax, currency repatriation and hedging, insurance and other transaction costs) that reduce the intrinsic value of the investment or operation. There are also numerous risks (heightened project uncertainty such as market success, labor strife or other operational challenges) specific to the investment or operation. These are best evaluated in cash flow scenario, sensitivity and simulation analysis. But despite the heroic coaching of finance professors around the world, our experience has shown that these costs and risks are still frequently omitted from the cash flow projections of international investment decisions. Furthermore, they are often “below the line” in the evaluation of any international operations.
Project uncertainty, and the recognition that many international costs are neglected, is the oft-unspoken rationale to inflate the hurdle rates for these investments. But managers typically have the best information about the potential impact of these risks on the expected stream of operating cash flows. Managers do not have any way to quantify the effect (if there is any) on shareholders' required rate of return - and these risks are diversifiable by investors or companies with global portfolios.
29 Systematic risk, or market risk, stems from economy-wide perils that affect all businesses – by definition this would
include the currency and sovereign risks of the economy itself. What matters to the well-diversified corporation, and ultimately the well-diversified investor, is any incremental contribution to risk, Modern Corporate Finance, Alan C. Shapiro (1990) pp. 239-268.
These costs and uncertainties are often ignored
THE WACC USER'S GUIDE
14
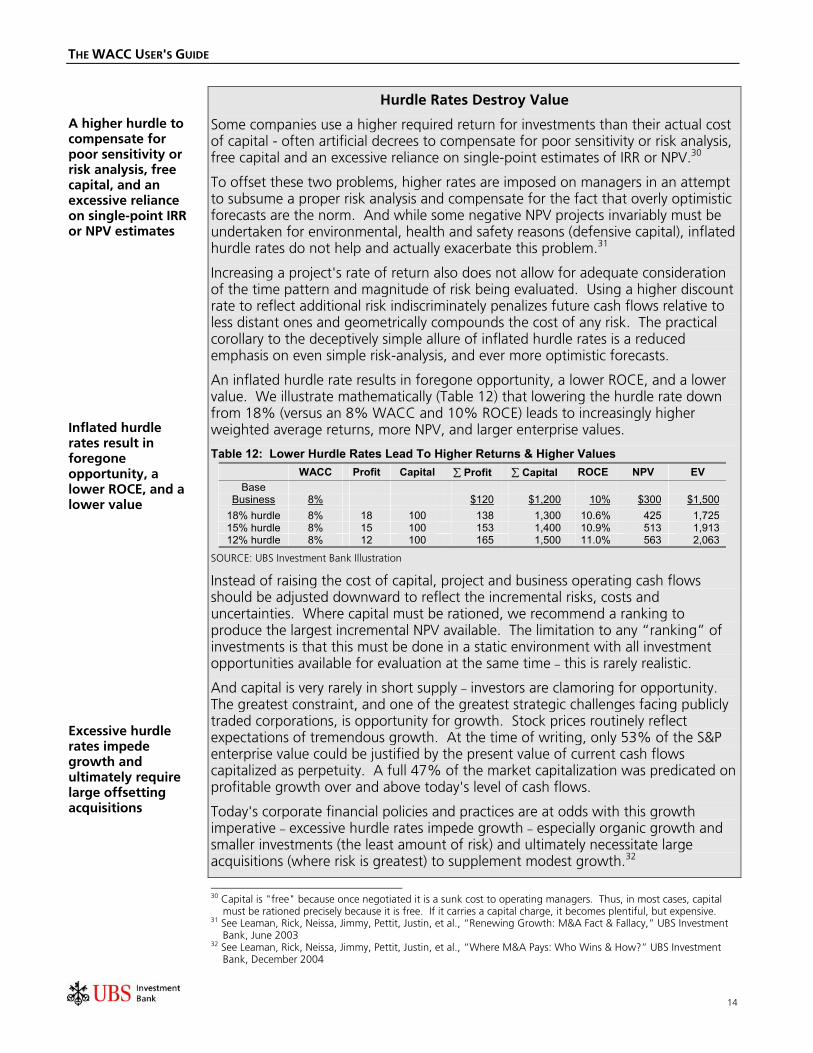
Hurdle Rates Destroy Value
Some companies use a higher required return for investments than their actual cost of capital - often artificial decrees to compensate for poor sensitivity or risk analysis, free capital and an excessive reliance on single-point estimates of IRR or NPV.30
To offset these two problems, higher rates are imposed on managers in an attempt to subsume a proper risk analysis and compensate for the fact that overly optimistic forecasts are the norm. And while some negative NPV projects invariably must be undertaken for environmental, health and safety reasons (defensive capital), inflated hurdle rates do not help and actually exacerbate this problem.31
Increasing a project's rate of return also does not allow for adequate consideration of the time pattern and magnitude of risk being evaluated. Using a higher discount rate to reflect additional risk indiscriminately penalizes future cash flows relative to less distant ones and geometrically compounds the cost of any risk. The practical corollary to the deceptively simple allure of inflated hurdle rates is a reduced emphasis on even simple risk-analysis, and ever more optimistic forecasts.
An inflated hurdle rate results in foregone opportunity, a lower ROCE, and a lower value. We illustrate mathematically (Table 12) that lowering the hurdle rate down from 18% (versus an 8% WACC and 10% ROCE) leads to increasingly higher weighted average returns, more NPV, and larger enterprise values.
Table 12: Lower Hurdle Rates Lead To Higher Returns & Higher Values WACC Profit Capital ∑ Profit ∑ Capital ROCE NPV EV
Instead of raising the cost of capital, project and business operating cash flows should be adjusted downward to reflect the incremental risks, costs and uncertainties. Where capital must be rationed, we recommend a ranking to produce the largest incremental NPV available. The limitation to any “ranking” of investments is that this must be done in a static environment with all investment opportunities available for evaluation at the same time – this is rarely realistic.
And capital is very rarely in short supply – investors are clamoring for opportunity. The greatest constraint, and one of the greatest strategic challenges facing publicly traded corporations, is opportunity for growth. Stock prices routinely reflect expectations of tremendous growth. At the time of writing, only 53% of the S&P enterprise value could be justified by the present value of current cash flows capitalized as perpetuity. A full 47% of the market capitalization was predicated on profitable growth over and above today's level of cash flows.
Today's corporate financial policies and practices are at odds with this growth imperative – excessive hurdle rates impede growth – especially organic growth and smaller investments (the least amount of risk) and ultimately necessitate large acquisitions (where risk is greatest) to supplement modest growth.32
30 Capital is "free" because once negotiated it is a sunk cost to operating managers. Thus, in most cases, capital
must be rationed precisely because it is free. If it carries a capital charge, it becomes plentiful, but expensive. 31 See Leaman, Rick, Neissa, Jimmy, Pettit, Justin, et al., “Renewing Growth: M&A Fact & Fallacy,” UBS Investment
Bank, June 2003 32 See Leaman, Rick, Neissa, Jimmy, Pettit, Justin, et al., “Where M&A Pays: Who Wins & How?” UBS Investment
Bank, December 2004
A higher hurdle to compensate for poor sensitivity or risk analysis, free capital, and an excessive reliance on single-point IRR or NPV estimates
Inflated hurdle rates result in foregone opportunity, a lower ROCE, and a lower value
Excessive hurdle rates impede growth and ultimately require large offsetting acquisitions
THE WACC USER'S GUIDE
15
Systematic Risks We identify the systematic risks to discrete foreign direct investments that can be quantified and treated within the cost of capital framework to manage better the MNC portfolio. However, these risks do not need to be incorporated with arbitrary and excessive risk premiums; rather, they can be addressed more rigorously in a fairly straightforward manner.
1. Business & Financial Risks The inherent business and financial risk need not change for foreign direct investments because a company's core business and target capital structure does not typically depend on any particular international operations – we would typically expect these to be applicable worldwide. For example, in industries where operating profit tends to be more volatile and correlated to the market (e.g. semiconductor industry), business risk is high. These risks, measured by the company beta, are already captured in the corporate cost of capital.
2. Expected Inflation The rate at which prices are expected to increase, inflation risk, measures the relative strength of a currency in relation to domestic expected inflation and are typically reflected in forward foreign exchange rates. In effect, it represents the risk arising from expected currency devaluation (longer term) due to differentials in long run inflation expectations (assumes interest rate parity holds over the longer run). These risks implied by the relative risk-free rates between countries or from inflation-linked government bonds, are incorporated into both the cost of debt and cost of capital calculations. This risk should be clearly distinguished from the short run cases where parity breaks down – unexpected currency devaluation is a possibility subsumed by sovereign risk.
3. Sovereign Risk Sovereign risk is most commonly associated with the risk that a foreign government will default on its loans or fail to honor other business commitments due to change in government or policy. However, sovereign risk is a broad category of risks unique to a country's political and economic environments that also include the impact of currency controls, changes in tax or local content laws, quotas and tariffs, and the sudden imposition of labor or environmental regulation:
♦ Unexpected Devaluation/Inflation: Sharp movements in the relative valuations of currencies, as in Mexico in 1994, and in Russia and much of Asia in 1998, go beyond the weakness implied by expected inflation differentials and are frequently the result of unrealistic currency pegs. Sudden runaway inflation has been "employed" to help satisfy debt obligations (e.g. Bolivia in the 1980s).
♦ Policy Risk: A host government, due to leadership or policy changes, may renege on contracts, agreements or approvals, prevent currency conversion, or impede repatriation. Other examples include sudden large changes in tax laws, local content laws, quotas and tariffs, and environmental restrictions. For example, witness the unexpected difficulties faced by both MNC loggers and miners in the Pacific Northwest in the 1990s as a result of environmental lobbying.
♦ Expropriation: Host government policy may reduce or eliminate ownership of, control over, or rights to, an investment by an overseas firm. This has happened in Russia, Cuba, South America, Israel, and many other countries.
♦ War/Civil Disturbance: This includes acts of sabotage or terrorism, damage to tangible assets, or interference with the ability of the enterprise to operate. This has been particularly acute in sub-Saharan Africa and the Middle East.
Future cash flows and FX should match inflation expectations in the discount rate
Sovereign risk is a broad category of risks unique to the eco-political environment
THE WACC USER'S GUIDE
16
Sovereign risks add a premium to the required rate of return for foreign direct investment. One way of estimating the possible size of this premium is to look at the "insurance premiums" charged by organizations such as the Overseas Private Investment Corporation (OPIC) and the Multilateral Investment Guarantee Agency (MIGA), which guarantee foreign investments against some of the risks cited above.
Other market-based methods may be more reliable. We generally employ multiple sources of information to "triangulate" sovereign risk premiums: USD denominated (Global Euro and stripped Brady) sovereign debt yields, and where bond yields are unavailable or appear unreliable, we use the premiums implied by a basket of similarly rated (S&P country ratings) countries.33 We begin by estimating a domestic cost of capital and then add sovereign and expected inflation risk premiums.34
Table 7 – Sovereign Risk
Country USD Rating
Sovereign Risk (bps)
Canada AAA 20 Belgium AA+ 50 Portugal AA 10 Italy AA- 40 Hong Kong A+ 50 Chile A 70 Israel A- 100 Poland BBB+ 60 South Africa BBB 190 Bulgaria BBB- 90 India BB+ 120 Peru BB 310 Turkey BB- 280 Indonesia B+ 280
0
50
100
150
200
250
300
350
400
AA
A
AA A
BB
B
BB B
Sovereign RatingSo
vere
ign
Pre
miu
m (b
ps)
SOURCE: S&P Global Ratings Handbook, Bloomberg; CreditDelta (March ’05)
Our sovereign risk premiums (Table 7) reflect the “country risk” relative to an AAA credit such as the US. Developed countries possess very low risk premiums; Canada and Italy have sovereign risk premiums of 20 and 40 bps respectively. Developing sovereign risk premiums range from 70 bps for Chile to 3,190 bps for Argentina.35
For example, Chile USD sovereign debt yields 4.9%, and incorporates an incremental required rate of return to compensate US (or globally diversified) investors for bearing Chilean sovereign risk. To determine what portion of that 4.9% represents Chilean sovereign risk, we effectively subtract the US sovereign yield from the local country sovereign yield (excluding the effect of compounding) to determine the 70 bps sovereign risk premium. And this appears consistent with the country USD rating.
But any point estimate of sovereign risk may represent false precision. Sovereign risk premiums vary widely even within country ratings, and are subject to sudden change. Figure 12 illustrates the uncertainty of a sovereign risk premium with a Monte Carlo simulation based on historical sovereign yield data.
33 For the countries that make long-term borrowings predominantly in USD and not in the local currency, we may
use Eurobond yields or the stripped yield of their International/Brady bonds as a basis for USD-based risk free rates. The stripped yield is the yield on the non-collateralized portion of the bond. For developed countries (and those others who are able and tend to borrow long-term in the local currency) we may estimate USD based sovereign yields based on S&P sovereign credit rating of such countries and corporate credit spread matrix.
34 This process is technically a somewhat iterative process, as the "domestic" cost of capital should not reflect the net incremental risk of the global assets that are already reflected in the company beta. We skip this step where the impact is not deemed to be material at the corporate level.
35 See Appendix B: Cost of Capital by Country
Multiple sources of information to "triangulate" sovereign risk
Point estimates of sovereign risk represent false precision - they vary widely within ratings and are prone to sudden change
THE WACC USER'S GUIDE
17
Figure 12– Sovereign Risk Premium Simulation
2.5th Percentile (4.5%)
Average (5.2%)97.5th Percentile (6.4%)
0
1
2
3
4
5
3 4 5 6 7 8 9 10Sovereign Premium (%)
Pro
bab
ility
(%)
SOURCE: Credit Delta, UBS Investment Bank Illustration. We assume a lognormal distribution for sovereign risk with mean 5.2% and standard deviation 1.2% based on weekly yields of LC denominated sovereign debt.
Global Corporate Capital Costs A helpful way of looking at the cost of capital for foreign countries is in terms of the marginal impact of the two systematic risk components—sovereign and currency risk. Calculating foreign WACC in USD involves adding a sovereign risk premium to the domestic WACC. To calculate foreign WACC in local currency, we also add the expected inflation premium.36
For example, in the case of Chile (sovereign risk premium 70 bps, inflation risk premium 10 bps), a company with a domestic WACC of 8% will have a foreign WACC in USD of roughly 8.7% and a WACC in local currency of about 8.8%.
Table 8 – Global Costs of Capital Country Sovereign
Risk (bps) Inflation Risk
(bps) Local WACC in LC (%)37
Local WACC in USD (%)38
Canada 20 20 8.4 8.2 Belgium 50 -80 7.7 8.5 Portugal 10 -40 7.7 8.1 Italy 40 -40 8.0 8.4 Hong Kong 50 -120 7.3 8.5 Chile 70 10 8.8 8.7 Israel 100 -10 8.9 9.0 Poland 60 40 9.0 8.6 South Africa 190 190 11.8 9.9 Bulgaria 90 110 10.0 8.9 India 120 170 10.9 9.2 Peru 310 50 11.6 11.1 Turkey 280 830 19.1 10.8 Indonesia 280 350 14.3 10.8
SOURCE: S&P Global Ratings Handbook, Bloomberg, UBS Investment Bank Estimates (March ’05)
The local cost of capital in local currency provides local managers with a reference frame when forecasts are based on local currency with local inflation expectations embedded. But, for purposes of evaluating a contemplated investment in Brazil (or, say, a major expansion of its current operations), a local cost of capital in USD (with no significant revenue inflation) provides a better basis.
The cost of capital is an estimation that should be applied with care to avoid any allusions of false precision. And despite its many degrees of freedom, financial planning time and resources are better allocated to other areas. Ultimately, it is the business case, quality of cash flow forecasts, sensitivity analysis, and strategic risk management that will have the greatest impact on value creation.
36 We estimated currency risk from inflation-linked sovereign bonds, or from the difference between using
expected changes in CPI index, LC sovereign bond yields and the implied LC issuer yields based on S&P Country Rating as well as yield differentials between local currency and USD denominated sovereign yields.
37 Local WACC in USD = Global WACC + Sovereign Risk Premium 38 Local WACC in LC = Local WACC in USD + Inflation Risk Premium
Ultimately, the business case, quality of cash flow forecasts, sensitivity analysis, and strategic risk management will have the greatest impact on value
THE WACC USER'S GUIDE
18
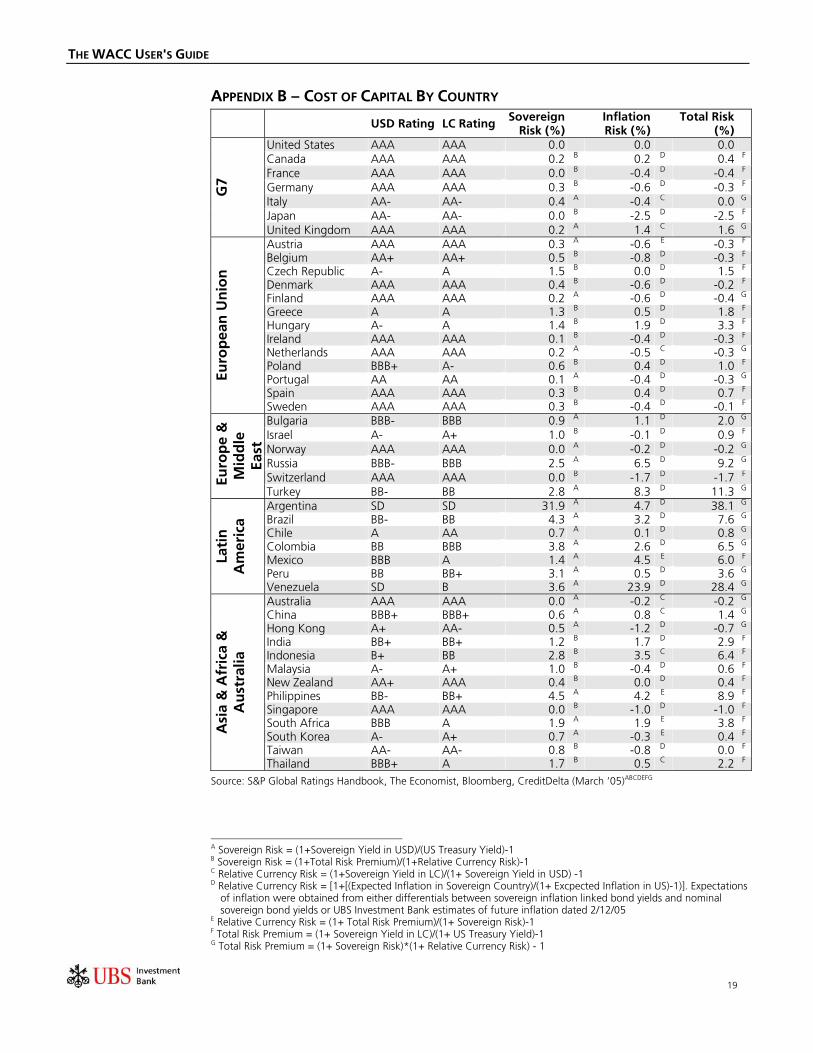
APPENDIX A – COST OF CAPITAL BY INDUSTRY AND SUB-INDUSTRY 39
United States AAA AAA 0.0 0.0 0.0 Canada AAA AAA 0.2 B 0.2 D 0.4 F
France AAA AAA 0.0 B -0.4 D -0.4 F
Germany AAA AAA 0.3 B -0.6 D -0.3 F
Italy AA- AA- 0.4 A -0.4 C 0.0 G
Japan AA- AA- 0.0 B -2.5 D -2.5 F
G7
United Kingdom AAA AAA 0.2 A 1.4 C 1.6 G
Austria AAA AAA 0.3 A -0.6 E -0.3 F
Belgium AA+ AA+ 0.5 B -0.8 D -0.3 F
Czech Republic A- A 1.5 B 0.0 D 1.5 F
Denmark AAA AAA 0.4 B -0.6 D -0.2 F
Finland AAA AAA 0.2 A -0.6 D -0.4 G
Greece A A 1.3 B 0.5 D 1.8 F
Hungary A- A 1.4 B 1.9 D 3.3 F
Ireland AAA AAA 0.1 B -0.4 D -0.3 F
Netherlands AAA AAA 0.2 A -0.5 C -0.3 G
Poland BBB+ A- 0.6 B 0.4 D 1.0 F
Portugal AA AA 0.1 A -0.4 D -0.3 G
Spain AAA AAA 0.3 B 0.4 D 0.7 F
Euro
pea
n U
nio
n
Sweden AAA AAA 0.3 B -0.4 D -0.1 F
Bulgaria BBB- BBB 0.9 A 1.1 D 2.0 G
Israel A- A+ 1.0 B -0.1 D 0.9 F
Norway AAA AAA 0.0 A -0.2 D -0.2 G
Russia BBB- BBB 2.5 A 6.5 D 9.2 G
Switzerland AAA AAA 0.0 B -1.7 D -1.7 F
Eu
rop
e &
M
idd
le
East
Turkey BB- BB 2.8 A 8.3 D 11.3 G
Argentina SD SD 31.9 A 4.7 D 38.1 G
Brazil BB- BB 4.3 A 3.2 D 7.6 G
Chile A AA 0.7 A 0.1 D 0.8 G
Colombia BB BBB 3.8 A 2.6 D 6.5 G
Mexico BBB A 1.4 A 4.5 E 6.0 F
Peru BB BB+ 3.1 A 0.5 D 3.6 G
Lati
n
Am
eric
a
Venezuela SD B 3.6 A 23.9 D 28.4 G
Australia AAA AAA 0.0 A -0.2 C -0.2 G
China BBB+ BBB+ 0.6 A 0.8 C 1.4 G
Hong Kong A+ AA- 0.5 A -1.2 D -0.7 G
India BB+ BB+ 1.2 B 1.7 D 2.9 F
Indonesia B+ BB 2.8 B 3.5 C 6.4 F
Malaysia A- A+ 1.0 B -0.4 D 0.6 F
New Zealand AA+ AAA 0.4 B 0.0 D 0.4 F
Philippines BB- BB+ 4.5 A 4.2 E 8.9 F
Singapore AAA AAA 0.0 B -1.0 D -1.0 F
South Africa BBB A 1.9 A 1.9 E 3.8 F
South Korea A- A+ 0.7 A -0.3 E 0.4 F
Taiwan AA- AA- 0.8 B -0.8 D 0.0 F
Asi
a &
Afr
ica
&
Au
stra
lia
Thailand BBB+ A 1.7 B 0.5 C 2.2 F
Source: S&P Global Ratings Handbook, The Economist, Bloomberg, CreditDelta (March ’05)ABCDEFG
A Sovereign Risk = (1+Sovereign Yield in USD)/(US Treasury Yield)-1 B Sovereign Risk = (1+Total Risk Premium)/(1+Relative Currency Risk)-1 C Relative Currency Risk = (1+Sovereign Yield in LC)/(1+ Sovereign Yield in USD) -1 D Relative Currency Risk = [1+[(Expected Inflation in Sovereign Country)/(1+ Excpected Inflation in US)-1)]. Expectations
of inflation were obtained from either differentials between sovereign inflation linked bond yields and nominal sovereign bond yields or UBS Investment Bank estimates of future inflation dated 2/12/05
E Relative Currency Risk = (1+ Total Risk Premium)/(1+ Sovereign Risk)-1 F Total Risk Premium = (1+ Sovereign Yield in LC)/(1+ US Treasury Yield)-1 G Total Risk Premium = (1+ Sovereign Risk)*(1+ Relative Currency Risk) - 1
THE WACC USER'S GUIDE
20
BIBLIOGRAPHY Bruner, Eades, Harris and Higgins. “Best Practices in Estimating the Cost of Capital: Survey and Synthesis.” Financial Practice and Education. Spring/Summer 1998
Copeland, T.E. and J. Weston. Financial Theory and Corporate Policy. 3rd Edition
Cooper, Ian and Evi Kaplanis. "Home Bias in Equity Portfolios and the Cost of Capital for Multinational Firms.” Journal of Applied Corporate Finance, Volume 8 Number 3. Fall 1995
Damodaran, Aswath, Investment Valuation. John Wiley & Sons, Inc., 1996.
Ibbotson, Roger G., and Peng Chen. “Long-Run Stock Returns: Participating in the Real Economy.” Financial Analysts Journal, 59, 88-98.
Logue, Dennis E. "When Theory Fails: Globalization as a Response to the (Hostile) Market for Foreign Exchange." Journal of Applied Corporate Finance, Volume 8 Number 3. Fall 1995
Mayfield, E. Scott. “Estimating the Market Risk Premium.” Journal of Financial Economics. Volume 73, Issue 3, September 2004
Pettit, Justin. “Corporate Capital Costs: A Practitioners Guide.” Journal of Applied Corporate Finance, Volume 12 Number 1. Spring 1999
Pettit, Justin, Mack Ferguson and Robert Gluck. “A Method for Estimating Global Corporate Capital Costs: The Case of Bestfoods.” The Journal of Applied Corporate Finance, Volume 12 Number 3. Fall 1999
Shapiro, Alan C. Modern Corporate Finance. 1990
Siegel, Jeremy J. “The Shrinking Equity Premium.” Journal of Portfolio Management, Fall 1999, 26, 1.
Stulz, Rene. "Globalization, Corporate Finance, and the Cost of Capital.” Journal of Applied Corporate Finance, Vol. 12 No. 3. Fall 1999
Stulz, Rene M. "Globalization of Capital Markets and the Cost of Capital: The Case of Nestle." Journal of Applied Corporate Finance, Volume 8 Number 3. Fall 1995
Weber, Steven. “The End of the Business Cycle.” Foreign Affairs, Volume 76 Number 4. July/August 1997
THE WACC USER'S GUIDE
21
LIST OF TABLES TABLE 1 – COST OF CAPITAL BY INDUSTRY 1 TABLE 2 – SEGMENT BETA REGRESSION ILLUSTRATION 7 TABLE 3 – MULTIVARIATE REGRESSION BETA ILLUSTRATION 8 TABLE 4 – EXPECTED VALUE TAX SHIELD ESTIMATION 9 TABLE 5 – ANATOMY OF A CONVERTIBLE ILLUSTRATION 10 TABLE 6 - WEIGHTED AVERAGE COST OF A CONVERTIBLE 10 TABLE 7 – SOVEREIGN RISK 16 TABLE 8 – GLOBAL COSTS OF CAPITAL 17
LIST OF FIGURES FIGURE 1 – CONVERGING VOLATILITIES – STOCKS AND THE LONG BOND 2 FIGURE 2– DECLINING MARKET RISK PREMIUM 4 FIGURE 3 – MARKET RISK PREMIUM DEPENDS ON HOW MUCH HISTORY 4 FIGURE 4– MARKET-IMPLIED RISK PREMIUM ESTIMATES 5 FIGURE 5 – SUSTAINABLE GROWTH ESTIMATES 5 FIGURE 6 – BETA REGRESSION ILLUSTRATION 6 FIGURE 7 – CONSTRUCTED BETA ILLUSTRATION 7 FIGURE 8 - HISTORICAL 10-YEAR TREASURY RATES VS. FORWARD RATES 8 FIGURE 9 – THE COSTS OF DEBT 9 FIGURE 10 – MNC PORTFOLIO ILLUSTRATION 12 FIGURE 11 – COST OF CAPITAL REFLECTS SYSTEMATIC RISKS 13 FIGURE 12– SOVEREIGN RISK PREMIUM SIMULATION 17
STRATEGIC ADVISORY GROUP PUBLICATIONS The WACC User's Guide, March 2005 Rethinking Capital Strategy, February 2005 Strategic Decapitalisation: Does Excess Cash Matter? February 2005 Where M&A Pays: Who Wins & How? December 2004
The New World of Credit Ratings, September 2004 Positioning for Growth: Carve-Outs & Spin-Offs, April 2004 How to Find Your Economic Profits, January 2004 FX Strategy Revisited, October 2003 Renewing Growth: M&A Fact & Fallacy, June 2003
The Shareholder Distributions Handbook, May 2003 Financial Strategy for a Deflationary Era, March 2003
THE WACC USER'S GUIDE
UBS AG 299 Park Avenue New York, NY 10171-0026 Tel: +1-212-821-3000 www.ubs.com
UBS Securities LLC is a subsidiary of UBS AG
UBS Investment Bank is a business group of UBS AG
This material has been prepared by UBS AG, or an affiliate thereof ("UBS"). In certain countries UBS AG is referred to as UBS SA. This material is an investment banking communication and should not be viewed as research.
This material is for distribution only under such circumstances as may be permitted by applicable law. It has no regard to the specific investment objectives, financial situation or particular needs of any recipient. It is published solely for informational purposes and is not to be construed as a solicitation or an offer to buy or sell any securities or related financial instruments. No representation or warranty, either express or implied, is provided in relation to the accuracy, completeness or reliability of the information contained herein, nor is it intended to be a complete statement or summary of the securities, markets or developments referred to in the materials. It should not be regarded by recipients as a substitute for the exercise of their own judgment. Any opinions expressed in this material are subject to change without notice and may differ or be contrary to opinions expressed by other business areas or groups of UBS as a result of using different assumptions and criteria. UBS is under no obligation to update or keep current the information contained herein. UBS, its directors, officers and employees' or clients may have or have had interests or long or short positions in the securities or other financial instruments referred to herein and may at any time make purchases and/or sales in them as principal or agent. UBS may act or have acted as market maker in the securities or other financial instruments discussed in this material. Furthermore, UBS may have or have had a relationship with or may provide or has provided investment banking, capital markets and/or other financial services to the relevant companies. Neither UBS nor any of its affiliates, nor any of UBS' or any of its affiliates, directors, employees or agents accepts any liability for any loss or damage arising out of the use of all or any part of this material.
Options, derivative products and futures are not suitable for all investors, and trading in these instruments is considered risky. Past performance is not necessarily indicative of future results. Foreign currency rates of exchange may adversely affect the value, price or income of any security or related instrument mentioned in this presentation. Prior to entering into a transaction you should consult with your own legal, regulatory, tax, financial and accounting advisers to the extent you deem necessary to make your own investment, hedging and trading decisions. Any transaction between you and UBS will be subject to the detailed provisions of the term sheet, confirmation or electronic matching systems relating to that transaction. Clients wishing to effect transactions should contact their local sales representative. Additional information will be made available upon request.
United Kingdom and rest of Europe: Except as otherwise specified herein, this material is communicated by UBS Limited, a subsidiary of UBS AG, to persons who are market counterparties or intermediate customers (as detailed in the FSA Rules) and is only available to such persons. The information contained herein does not apply to, and should not be relied upon by, private customers. Switzerland: These materials are distributed in Switzerland by UBS AG to persons who are institutional investors only. Italy: Should persons receiving this materials in Italy require additional information or wish to effect transactions in the relevant securities, they should contact Giubergia UBS SIM SpA, an associate of UBS SA, in Milan. United States: These materials are distributed by UBS Securities LLC or UBS Financial Services Inc., subsidiaries of UBS AG, or solely to US institutional investors by UBS AG or a subsidiary or affiliate thereof that is not registered as a US broker-dealer (a "non-US affiliate"). Transactions resulting from materials distributed by a non-US affiliate must be effected through UBS Securities LLC or UBS Financial Services Inc. Canada: These materials are being distributed in Canada by UBS Securities Canada Inc., a subsidiary of UBS AG and a member of the principal Canadian stock exchanges & CIPF. Hong Kong: The materials relating to equities, corporate finance and other securities business, and related research, are being distributed in Hong Kong by UBS Securities Asia Limited. The material relating to foreign exchange, fixed income products and other banking business, and related research, are being distributed in Hong Kong by UBS AG, Hong Kong Branch. Singapore: These materials are distributed in Singapore by UBS Securities Singapore Pte. Ltd or UBS AG, Singapore Branch. Japan: The materials relating to equities, fixed income products, corporate finance and other securities business, and related research, are distributed in Japan by UBS Securities Japan Ltd. The materials relating to foreign exchange and other banking business, and related research, are distributed in Japan by UBS AG, Tokyo Branch. Australia: These materials are distributed in Australia by UBS Capital Markets Australia Ltd and UBS Securities Australia Ltd, licensed securities dealers. New Zealand: These materials are distributed in New Zealand by UBS New Zealand Ltd.
2005 UBS. All rights reserved. UBS specifically prohibits the redistribution of this material and accepts no liability whatsoever for the actions of third parties in this respect.