45
Socio- Economic Development Strategies: India and China Thorvaldur Gylfason Thorvaldur Gylfason
| Date post: | 29-May-2018 |
| Category: |
Documents |
| Upload: | mithunbanerjee2009 |
| View: | 216 times |
| Download: | 0 times |

8/8/2019 Barbados Presentation 5
http://slidepdf.com/reader/full/barbados-presentation-5 1/45
Socio-
EconomicDevelopmentStrategies:India andChina
Thorvaldur Gylfason Thorvaldur Gylfason

8/8/2019 Barbados Presentation 5
http://slidepdf.com/reader/full/barbados-presentation-5 2/45
Compare the developmentstrategies and trajectories of thetwo economic giants of AsiaOne obvious difference
India is a democracyChina, though, is not
Many other differences, andsimilarities that include
Low foreign debtsLong coastlinesLarge overseas communities
Two giantsTwo giants
W h a t ’s t h e s t ory? W h a t ’s t h e s t o ry?

8/8/2019 Barbados Presentation 5
http://slidepdf.com/reader/full/barbados-presentation-5 3/45
India and China: GDP per
capita 1820-1950 ( constant 1990US dollars)
0
100
200
300
400
500
600
700
800
1820 1913 1950
China
India
China wasChina wasricher thanricher thanIndia 200India 200years ago,years ago,butbutIndia didIndia didbetter thanbetter thanChinaChinathereafterthereafter

8/8/2019 Barbados Presentation 5
http://slidepdf.com/reader/full/barbados-presentation-5 4/45
India and China: GDP per
capita 1820-1950 ( constant 1990US dollars)
0
100
200
300
400
500
600
700
800
1820 1913 1950
China
India
SinceSince1950,1950,however,however,China hasChina hasgrowngrownmoremorerapidlyrapidlythan India,than India,albeit lessalbeit less
evenlyevenlyWh ?Wh ?

8/8/2019 Barbados Presentation 5
http://slidepdf.com/reader/full/barbados-presentation-5 5/45
India and China: GDP per capita
1975-2003 ( ppp, 2000 internationaldollars )
Ch in a 7 .7 %Ch in a 7 .7 %
A frica A frica -0 .5 %-0 .5 %
0
500
1000
1500
2000
2500
3000
3500
4000
4500
5000
1 9 7 5
1 9 7 8
1 9 8 1
1 9 8 4
1 9 8 7
1 9 9 0
1 9 9 3
1 9 9 6
1 9 9 9
2 0 0 2
China
India
Sub-Saharan Africa
In d ia In d ia 3 .2 %3 .2 %

8/8/2019 Barbados Presentation 5
http://slidepdf.com/reader/full/barbados-presentation-5 6/45
India and China: GDP per capita
1960-2003 ( 2000 international dollars )Ch in a 5 .7 %Ch in a 5 .7 %
A frica 0 .5 %A frica 0 .5 %In d ia 2 .5 %In d ia 2 .5 %
0
200
400
600
800
1000
1200
1 9 6 0
1 9 6 4
1 9 6 8
1 9 7 2
1 9 7 6
1 9 8 0
1 9 8 4
1 9 8 8
1 9 9 2
1 9 9 6
2 0 0 0
China
India
Sub-Saharan Africa

8/8/2019 Barbados Presentation 5
http://slidepdf.com/reader/full/barbados-presentation-5 7/45
India and China: Life expectancy
at birth 1960-2004
0
10
20
30
40
50
60
70
80
1 9 6 0
1 9 6 4
1 9 6 8
1 9 7 2
1 9 7 6
1 9 8 0
1 9 8 4
1 9 8 8
1 9 9 2
1 9 9 6
2 0 0 0
China
India
Sub-Saharan Africa
PersistentPersistentrise in liferise in life
expectancyexpectancyas well as inas well as inotherotherhumanhumandevelopmedevelopmentntindicatorsindicatorsin bothin bothChina andChina and

8/8/2019 Barbados Presentation 5
http://slidepdf.com/reader/full/barbados-presentation-5 8/45
What it takes totogrowgrowI. Saving and investmentPhysical capital
I. Education, health careHuman capitalI. Macroeconomic stabilityFinancial capital
I. Exports and importsForeign capital
I. DemocracySocial capital
I. DiversificationAway from natural capital
U ndis p u ted
Co n t ro ve rsia

8/8/2019 Barbados Presentation 5
http://slidepdf.com/reader/full/barbados-presentation-5 9/45
Three main sourcesThree main sources
of of economic growtheconomic growth
I n v e O p e E d
G r o+ ++
denotes a positive effect in the direction shown+

8/8/2019 Barbados Presentation 5
http://slidepdf.com/reader/full/barbados-presentation-5 10/45
Three further sourcesThree further sources
of of economic growtheconomic growth
I n v e O p e E d
G r o+ ++
Democracy Diversification
+ +
Le t ’s n ow look a t t h e s e
fa c t o rs on e b y on e
Econom ic vs . p o li t ica l d ive rs i f ica t ion
Stability+

8/8/2019 Barbados Presentation 5
http://slidepdf.com/reader/full/barbados-presentation-5 11/45
Investment 1960-20040
5
10
15
20
25
30
35
40
45
50
1 9 6 0
1 9 6 4
1 9 6 8
1 9 7 2
1 9 7 6
1 9 8 0
1 9 8 4
1 9 8 8
1 9 9 2
1 9 9 6
2 0 0 0
China
India
Sub-Saharan Africa
In China,moreinvestment
and morerapideconomicgrowth, but …
% of GDP

8/8/2019 Barbados Presentation 5
http://slidepdf.com/reader/full/barbados-presentation-5 12/45
Investment 1960-20040
5
10
15
20
25
30
35
40
45
50
1 9 6 0
1 9 6 4
1 9 6 8
1 9 7 2
1 9 7 6
1 9 8 0
1 9 8 4
1 9 8 8
1 9 9 2
1 9 9 6
2 0 0 0
China
India
Sub-Saharan Africa
In China, ittakes almostalmosttwice astwice as
muchmuchinvestmentinvestment togrow roughlytwice as fastas IndiaChinesebanks havemorenonperforming loans than
% of GDP

8/8/2019 Barbados Presentation 5
http://slidepdf.com/reader/full/barbados-presentation-5 13/45
Investment 1960-20040
5
10
15
20
25
30
35
40
45
50
1 9 6 0
1 9 6 4
1 9 6 8
1 9 7 2
1 9 7 6
1 9 8 0
1 9 8 4
1 9 8 8
1 9 9 2
1 9 9 6
2 0 0 0
China
India
Sub-Saharan Africa
In China, ittakes 4141daysdays to
obtain thelicensesnecessary tostart abusinessIn India, ittakes 8989daysdays
% of GDP

8/8/2019 Barbados Presentation 5
http://slidepdf.com/reader/full/barbados-presentation-5 14/45
Gross foreign direct
investment 1960-2004 Chinaattracts farmore foreign
capital thanIndia,especiallythrough jointventures
0
1
2
3
4
5
6
7
8
9
1 9 6 0
1 9 6 4
1 9 6 8
1 9 7 2
1 9 7 6
1 9 8 0
1 9 8 4
1 9 8 8
1 9 9 2
1 9 9 6
2 0 0 0
China
India
Sub-Saharan Africa
% of GDP

8/8/2019 Barbados Presentation 5
http://slidepdf.com/reader/full/barbados-presentation-5 15/45
Gross foreign direct
investment 1960-2004 China appearsto have lessendemic
corruptioncorruption :27% of managers inChina viewcorruption asa majorconstraintcomparedwith 37% in
India
0
1
2
3
4
5
6
7
8
9
1 9 6 0
1 9 6 4
1 9 6 8
1 9 7 2
1 9 7 6
1 9 8 0
1 9 8 4
1 9 8 8
1 9 9 2
1 9 9 6
2 0 0 0
China
India
Sub-Saharan Africa
% of GDP

8/8/2019 Barbados Presentation 5
http://slidepdf.com/reader/full/barbados-presentation-5 16/45
Gross foreign direct
investment 1960-2004 China appearsto have lessendemic
corruptioncorruption : TransparencyInternationalin Berlin givesChina 3.4 forcorruption andIndia 2.8 on ascale from 1to 10
0
1
2
3
4
5
6
7
8
9
1 9 6 0
1 9 6 4
1 9 6 8
1 9 7 2
1 9 7 6
1 9 8 0
1 9 8 4
1 9 8 8
1 9 9 2
1 9 9 6
2 0 0 0
China
India
Sub-Saharan Africa
% of GDP

8/8/2019 Barbados Presentation 5
http://slidepdf.com/reader/full/barbados-presentation-5 17/45
Inflation and
financial depth 1960-2004 China’sinflation 1961-2003 was 3.2%
per year onaveragecompared withIndia’s 7.6%China’sliquidity grewfasterLiquiditylubricates the
wheels of
% of GDP0
20
40
60
80
100
120
140
160
180
200
1 9 6 0
1 9 6 4
1 9 6 8
1 9 7 2
1 9 7 6
1 9 8 0
1 9 8 4
1 9 8 8
1 9 9 2
1 9 9 6
2 0 0 0
China
India
Sub-Saharan Africa
% of GDP
8/8/2019 Barbados Presentation 5
http://slidepdf.com/reader/full/barbados-presentation-5 18/45
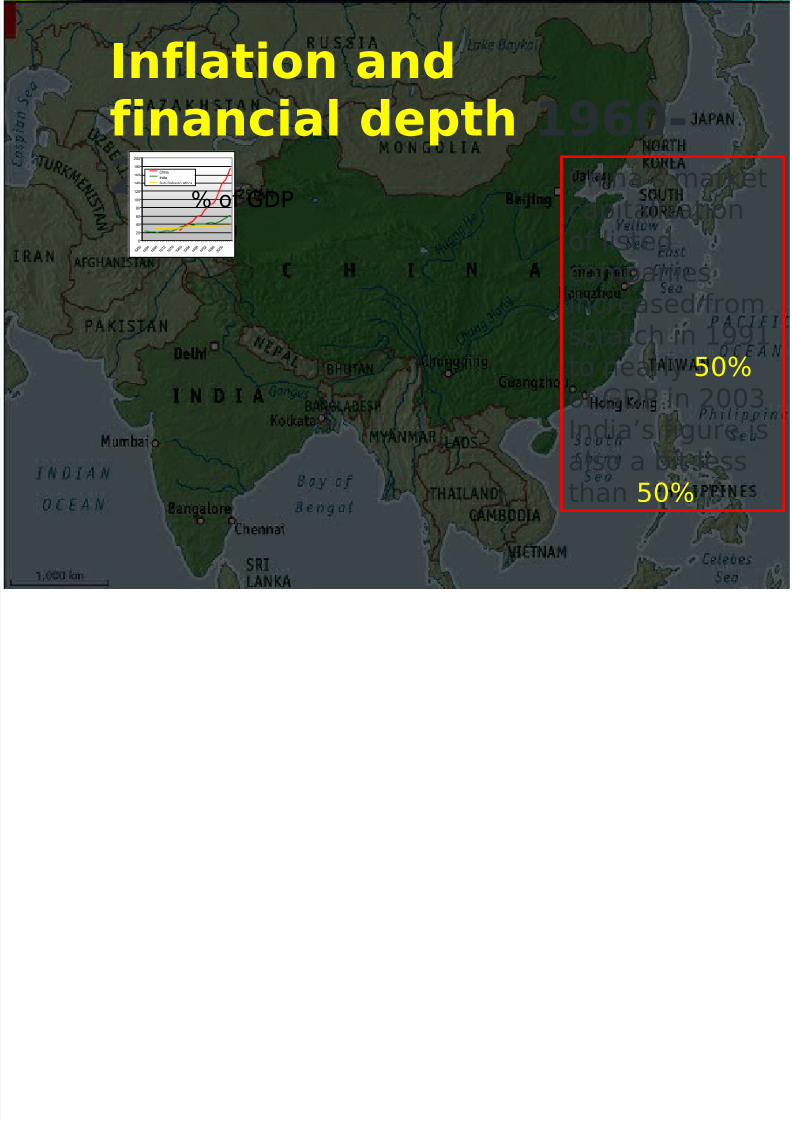
Inflation and
financial depth 1960-2004 China’s marketcapitalizationof listed
companiesincreased fromscratch in 1991to nearly 50%of GDP in 2003India’s figure isalso a bit lessthan 50%
% of GDP0
20
40
60
80
100
120
140
160
180
200
1 9 6 0
1 9 6 4
1 9 6 8
1 9 7 2
1 9 7 6
1 9 8 0
1 9 8 4
1 9 8 8
1 9 9 2
1 9 9 6
2 0 0 0
China
India
Sub-Saharan Africa
% of GDP

8/8/2019 Barbados Presentation 5
http://slidepdf.com/reader/full/barbados-presentation-5 19/45
Exports 1960-20040
5
10
15
20
25
30
35
40
1 9 6 0
1 9 6 4
1 9 6 8
1 9 7 2
1 9 7 6
1 9 8 0
1 9 8 4
1 9 8 8
1 9 9 2
1 9 9 6
2 0 0 0
China
India
Sub-Saharan Africa % of GDPChina’sexports of goods and
services haveoutpacedthose fromIndiaIn China,taxes ontaxes ontradetrade arenow 9% compared
with 16% in

8/8/2019 Barbados Presentation 5
http://slidepdf.com/reader/full/barbados-presentation-5 20/45
Adult female literacy
1960-2004 China hastaught morefemales than
India how toread andwrite
The youthyouthfemalefemaleliteracyliteracy ratein China is99% compared
with 65% in
0
10
20
30
40
50
60
70
80
90
100
1 9 6 0
1 9 6 4
1 9 6 8
1 9 7 2
1 9 7 6
1 9 8 0
1 9 8 4
1 9 8 8
1 9 9 2
1 9 9 6
2 0 0 0
2 0 0 4
China
India
Sub-Saharan Africa
%

8/8/2019 Barbados Presentation 5
http://slidepdf.com/reader/full/barbados-presentation-5 21/45
Adult female literacy
1960-2004 China sendsChina sendsalmostalmost 70% of herof her
youngsters toyoungsters tosecondarysecondaryschoolschool comparedcomparedwithwith 50% ininIndiaIndia““ An educatedAn educatedchild doeschild doesnot want tonot want to
plant rice”plant rice”
0
10
20
30
40
50
60
70
80
90
100
1 9 6 0
1 9 6 4
1 9 6 8
1 9 7 2
1 9 7 6
1 9 8 0
1 9 8 4
1 9 8 8
1 9 9 2
1 9 9 6
2 0 0 0
2 0 0 4
China
India
Sub-Saharan Africa
%

8/8/2019 Barbados Presentation 5
http://slidepdf.com/reader/full/barbados-presentation-5 22/45
Agriculture 1960-2004 China hasdone morethan India to
transfer laborfrom the landWhere haveall theworkersgone?
0
10
20
30
40
50
60
1 9 6 0
1 9 6 4
1 9 6 8
1 9 7 2
1 9 7 6
1 9 8 0
1 9 8 4
1 9 8 8
1 9 9 2
1 9 9 6
2 0 0 0
2 0 0 4
China
India
Sub-Saharan Africa
% of GDP

8/8/2019 Barbados Presentation 5
http://slidepdf.com/reader/full/barbados-presentation-5 23/45
Manufacturing 1960-2004 Ruralworkers inChina have
flocked intomanufacturing In India,the servicessector hasexpandedrapidlyHardwareHardware vs.vs. softwaresoftware
0
5
10
15
20
25
30
35
40
45
1 9 6 0
1 9 6 4
1 9 6 8
1 9 7 2
1 9 7 6
1 9 8 0
1 9 8 4
1 9 8 8
1 9 9 2
1 9 9 6
2 0 0 0
China
India
Sub-Saharan Africa
% of GDP

8/8/2019 Barbados Presentation 5
http://slidepdf.com/reader/full/barbados-presentation-5 24/45
The results so farThe results so farChinaSaves and invests more than IndiaAttracts more foreign capital
Has less inflationExports more goods and services Teaches more females how to read Transfers her labor more rapidly out of farming into manufacturing and services
Small wonder, then, that China growsmore rapidly than India
Even without democracy!

8/8/2019 Barbados Presentation 5
http://slidepdf.com/reader/full/barbados-presentation-5 25/45
Common legacy of foreign influence ordomination followed by communism orsocialismMarket-friendly reforms started earlier inChina than in India
1978 in China1991 in India
So, China has been reforming her
economy twice as long as India… and more rapidly and radically
China startedearlier

8/8/2019 Barbados Presentation 5
http://slidepdf.com/reader/full/barbados-presentation-5 26/45
Again, one glaring differenceIndia is a democracy
China is notDoes democracy impedeeconomic growth?Is this, perhaps, why Indiahas grown less rapidly thanChina since 1950?
The role of The role of democracydemocracy
Ne x t q u e s t ion

8/8/2019 Barbados Presentation 5
http://slidepdf.com/reader/full/barbados-presentation-5 27/45
Two theoriesTwo theoriesDemocracy is good for growth, and so areinvestment, education, etc.
Reason: democracy fosters efficiency by facilitatingchange of government, and efficiency is good forgrowth
Democracy hurts growth, or worseReason: democracy plays into the hands of pressuregroups that tend to abuse their power at publicexpense

8/8/2019 Barbados Presentation 5
http://slidepdf.com/reader/full/barbados-presentation-5 28/45
Growth and
political liberties 1965-98
CentralAfricanRepublic
Brazil DemocracyDemocracyis good foris good forgrowth:growth: No visibleNo visiblesign thatsign thatdemocracydemocracystands instands inthe way of the way of economiceconomicgrowthgrowth
-8
-6
-4
-2
0
2
4
6
0 2 4 6 8
Index of political liberties 1972-90
G r o w
t h o
f G N P p e r c a p
i t a 1 9 6 5 - 9 8 , a d
j u s t e d
f o r
i n i t i a l i n c o m e
( % p
e r y e a r )
r = -0.62r = -0.62
Botswana
China
Niger
Venezuela
Korea
8 5 cou n t rie s8 5 cou n t rie s
India

8/8/2019 Barbados Presentation 5
http://slidepdf.com/reader/full/barbados-presentation-5 29/45
Growth and political
liberties 1965-98
CentralAfricanRepublic
Brazil
-8
-6
-4
-2
0
2
4
6
0 2 4 6 8
Index of political liberties 1972-90
G r o w
t h o
f G N P p e r c a p
i t a 1 9 6 5 - 9 8 , a d
j u s t e d
f o r
i n i t i a l i n c o m e
( % p
e r y e a r )
r = -0.62r = -0.62
Botswana
Niger
Venezuela
Korea
PoliticalPoliticalliberty isliberty isgood forgood forgrowthgrowthbecausebecauseoppressionoppression
breedsbreedsinefficiencinefficiency,y,and soand so
doesdoes
China
India

8/8/2019 Barbados Presentation 5
http://slidepdf.com/reader/full/barbados-presentation-5 30/45
Growth andGrowth and
democracydemocracy 1960-2000
1 4 4 cou n t rie s1 4 4 cou n t rie s
De m ocra cy De m ocra cy a n d g row t h a n d g row t h s e e m t o g o s e e m t o g o
t og e t h e r t og e t h e r
-8
-6
-4
-2
0
2
4
6
8
-10 -5 0 5 10
Index of democracy 1960-2000
G r o w
t h o
f G D P p e r c a p
i t a 1 9 6 0 - 2 0 0 0 , a d
j u s t e d
f o r
i n i t i a l i n c o m e
( % p
e r y e a r )
r = 0 .4 8r = 0 .4 8
Eq u a t oria lGu in e a
Mala ys ia
Sin g a pore
Mu s t look e ls e wh e re for a n
e xp la n a t ion

8/8/2019 Barbados Presentation 5
http://slidepdf.com/reader/full/barbados-presentation-5 31/45
Education andEducation and
democracydemocracy 1960-2000Eq u a t oria lGu in e a
Mala ys ia
Sin g a pore
Mu s t look e ls e wh e re for a n
e xp la n a t ion
1 2 6 cou n t rie s1 2 6 cou n t rie s
De m ocra cy De m ocra cy a n d a n d e d u ca t ion g o e d u ca t ion g o
h a n d in h a n dh a n d in h a n d
0
20
40
60
80
100
-10 -5 0 5 10
Index of democracy 1960-2000
S e c o n
d a r y - s c h o o
l e n r o
l m e n
t o
f g
i r l s 1 9 7 0 - 8 8
( % )
r = 0 .6 2r = 0 .6 2

8/8/2019 Barbados Presentation 5
http://slidepdf.com/reader/full/barbados-presentation-5 32/45
DemocracyDemocracy 1946-1946-20002000De m ocra cyDe m ocra cy
Olig ocra cyOlig ocra cy
Au t ocra cyAu t ocra cy
1 9 4 6 : 2 0 ou t o f 7 01 9 4 6 : 2 0 ou t o f 7 0
2 0 0 0 : 9 0 ou t o f 1 7 02 0 0 0 : 9 0 ou t o f 1 7 0
Numberofcountries
Numberofcountries

8/8/2019 Barbados Presentation 5
http://slidepdf.com/reader/full/barbados-presentation-5 33/45
Measures to combat corruption
Corruption perceptions index from Transparency International
Measures to enhance equalityGini index
What do the data say?
Other ways to build up social capital

8/8/2019 Barbados Presentation 5
http://slidepdf.com/reader/full/barbados-presentation-5 34/45
Growth andGrowth and
corruptioncorruption 1965-1998
5 5 cou n t rie s5 5 cou n t rie s
Honesty isgood for
growthbecausecorruptioncreatesinefficiency
Sm a ll d i f fe re n ce
r = 0 .4 0r = 0 .4 0
-6
-4
-2
0
2
4
6
0 1 2 3 4 5 6 7 8 9 10
Corruption index 2000
G r o w
t h o
f G N P p e r c a p
i t a 1 9 6 5 - 9 8 , a d
j u s t e d
f o r
i n i t i a l i n c o m e
( % p
e r y e a r )
China
India

8/8/2019 Barbados Presentation 5
http://slidepdf.com/reader/full/barbados-presentation-5 35/45
Growth andGrowth and
inequalityinequality 1965-1998
7 5 cou n t rie s7 5 cou n t rie s
Equality isEquality isgood forgood forgrowthgrowth ::
No visibleNo visiblesign thatsign thatequalityequalitystands in thestands in theway of way of economiceconomicgrowthgrowth
-6
-4
-2
0
2
4
6
0 10 20 30 40 50 60 70
Gini index of inequality, various years
G r o w
t h o
f G N P p e r c a p
i t a 1 9 6 5 - 9 8
, a d j u s t e d
f o r
i n i t i a l i n c o m e
( % p
e r y e a r )
China
India
r = -0 .5 0r = -0 .5 0
Big d i f fe re n ce

8/8/2019 Barbados Presentation 5
http://slidepdf.com/reader/full/barbados-presentation-5 36/45
Growth andGrowth and
inequalityinequality 1965-1998 Gini-Gini-coefficients:coefficients:• India 33India 33• China 45China 45
-6
-4
-2
0
2
4
6
0 10 20 30 40 50 60 70
Gini index of inequality
G r o w
t h o
f G N P p e r c a p
i t a 1 9 6 5 - 9 8 , a d
j u s t e
d
f o r
i n i t i a l i n c o m e
( % p
e r y e a r )
China
India
r = -0 .5 0r = -0 .5 07 5 cou n t rie s7 5 cou n t rie s
Big d i f fe re n ce

8/8/2019 Barbados Presentation 5
http://slidepdf.com/reader/full/barbados-presentation-5 37/45
One more thing:One more thing:
FertilityFertilityChina adopted a one-child policy in 1980Relaxed it subsequently to allow twochildren – if the first was a girl
300 million fewer Chinese today thanotherwise would have been the case This should be good for growth
India did no such thingIndia’s population is forecast to overtakeChina’s by 2025

8/8/2019 Barbados Presentation 5
http://slidepdf.com/reader/full/barbados-presentation-5 38/45
Births per woman
1960-2004 Less rapidpopulationgrowth
means fewerfewermouths tomouths tofeedfeed andandfewer mindsfewer mindsto educate,to educate,allowingallowingbetter carebetter carefor eachfor eachchild, andchild, and
hencehence moremore
0
1
2
3
4
5
6
7
8
1 9 6 0
1 9 6 4
1 9 6 8
1 9 7 2
1 9 7 6
1 9 8 0
1 9 8 4
1 9 8 8
1 9 9 2
1 9 9 6
2 0 0 0
China
India
Sub-Saharan Africa
Number of births

8/8/2019 Barbados Presentation 5
http://slidepdf.com/reader/full/barbados-presentation-5 39/45
Child mortality
1960-2004 More andbetter healthcare and
educationhave helpedreduce childmortality inChina and inIndia, andacross theworldLet’s take a
look
0
20
40
60
80
100
120
140
160
1 9 6 0
1 9 6 4
1 9 6 8
1 9 7 2
1 9 7 6
1 9 8 0
1 9 8 4
1 9 8 8
1 9 9 2
1 9 9 6
2 0 0 0
2 0 0 4
China
India
Sub-Saharan Africa
Per 1,000 live births

8/8/2019 Barbados Presentation 5
http://slidepdf.com/reader/full/barbados-presentation-5 40/45
Fertility and growth
1960-2004 Fewer birthsgo along withhigher growth
Fewer birthsincrease andimprovehuman capitalRankcorrelationbetweenfertility andeducation is
-0,90-0,90
-8
-6
-4
-2
0
2
4
6
0 1 2 3 4 5 6 7 8
Fertility 1965-98 (Life births per woman)
G r o w
t h o
f G N P p e r c a p
i t a 1 9 6 5 - 9 8 , a d
j u s t e d
f o r
i n i t i a l i n c o m e
( % p
e r y e a r )
r = -0.78r = -0.78
8 7 cou n t rie s8 7 cou n t rie s
China
India

8/8/2019 Barbados Presentation 5
http://slidepdf.com/reader/full/barbados-presentation-5 41/45
Fertility rate,
woman)
L i n
0.5
10.5
Mortality rate, under-5 (per 1,000 live births) Lin
3
520
100 200 300 400150 250 350
10
5
2
3
4
6
7
8
9
AfricaAm ericas
Arabcountries
AsiaEurope
Fertility and child mortality

8/8/2019 Barbados Presentation 5
http://slidepdf.com/reader/full/barbados-presentation-5 42/45
PovertyPoverty 199919990
102030405060708090
Share of population living onless than one dollar a day
Share of population living onless than two dollars a day
ChinaIndiaSub-Saharan Africa
Eve n s o , In d ia h a s a
m ore e q u a l d is t rib u t ion
o f in com e , wi t h a Gin i
in d e x o f 3 3 com p a re d wi t h 4 5 in Ch in aEq u a li t y is g ood for
g row t h
% of population

8/8/2019 Barbados Presentation 5
http://slidepdf.com/reader/full/barbados-presentation-5 43/45
Sir Arthur LewisSir Arthur Lewis gotgot
it rightit rightSince the secondSince the secondworld war it hasworld war it has
become quite clearbecome quite clearthat rapid economicthat rapid economicgrowth is availablegrowth is availableto those countriesto those countrieswith adequatewith adequatenatural resourcesnatural resourceswhichwhich make themake theeffort to achieve iteffort to achieve it
W. Arthur LewisW. Arthur Lewis(Accra, 1968)(Accra, 1968)
8/8/2019 Barbados Presentation 5
http://slidepdf.com/reader/full/barbados-presentation-5 44/45
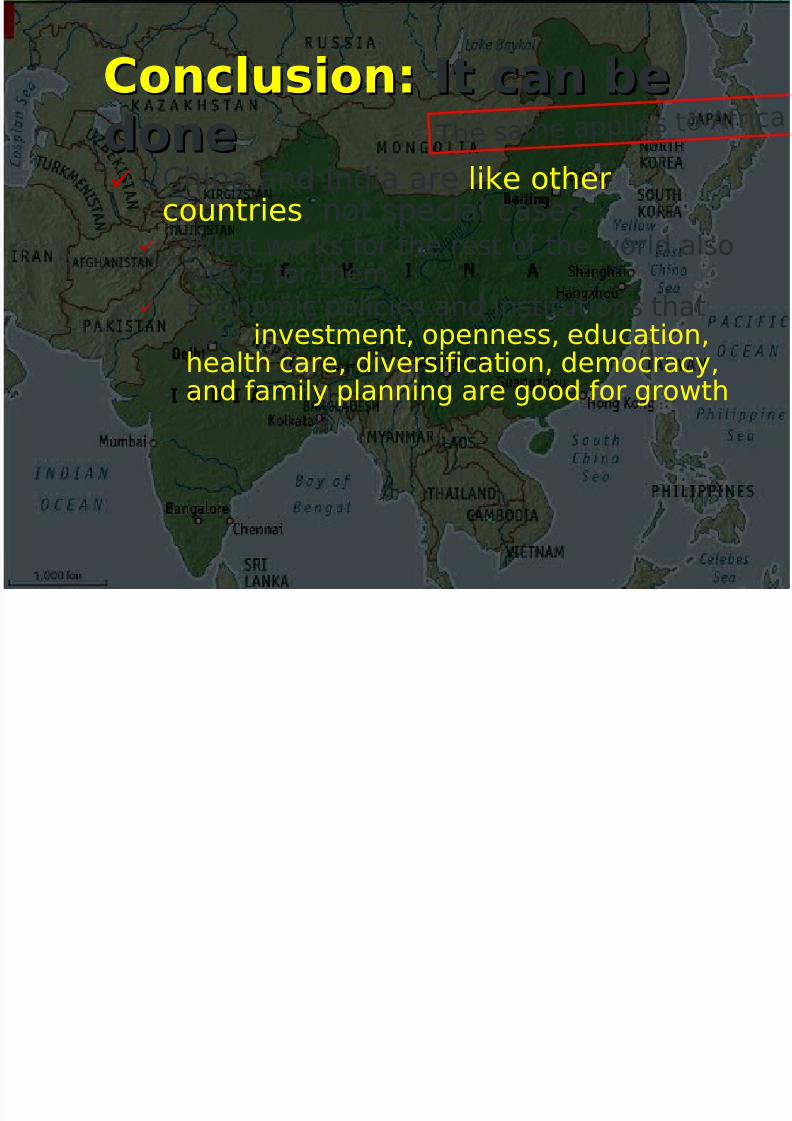
China and India are like othercountries , not special cases
What works for the rest of the world also
works for themEconomic policies and institutions thatspur investment, openness, education,health care, diversification, democracy,and family planning are good for growth
Conclusion:Conclusion: It can beIt can be
donedone Th e s am e a p p lie s t o A frica

8/8/2019 Barbados Presentation 5
http://slidepdf.com/reader/full/barbados-presentation-5 45/45
Conclusion:Conclusion: It can beIt can be
donedoneTo grow or notto grow is inlarge measurea matter of
choice
To grow or notto grow is inlarge measurea matter of choice
Ma n y o f t h e Ma n y o f t h e con s t ra in t s on con s t ra in t s on
g row t h a re g row t h a re m a n -m a d em a n -m a d e , , a n d ca n b e a n d ca n b e
re m ove dre m ove d Th e En d Th e En d
These slides – and more! – can be
viewed on my website:www.hi.is/~gylfason


