Basic Capnometry Application User Guide, copyright Glyn Blackett page 1
1 IntroductionThis guide introduces the Basic Capnometry biofeedback application, part of the Mind-Body Training Tools suite. This set of applications is designed to develop skills in mind-body awareness and self-regulation, particularly in a context of mindfulness and meditation practice.
The guide has two purposes: firstly to give an overview of capnometry biofeedback, and secondly to teach you how to use the software – though it is more of a reference than a tutorial. Other training material is available on the StressResilientMind.co.uk website.
The application is designed to train optimal breathing. A capnometer measures end-tidal carbon dioxide in exhaled air, which is known to correlate with the level of carbon dioxide in blood. The latter is an important physiological parameter, as it controls vasodilation, most prominently in the brain. Over-breathing or hyperventilation causes depletion of blood carbon dioxide and thus restriction of oxygen delivery to brain cells, while conversely capnometry biofeedback is a means of training optimal oxygen delivery to brain cells.
The application monitors a single physiological parameter: partial pressure of carbon dioxide in inhaled air (PP CO2). Think of this as the concentration of CO2. The software calculates the end-tidal CO2, or the peak in the PP CO2 signal over the course of a breath.
In keeping with others in the suite, the Basic Capnometry application was designed to support your aims, not to supplant them. Achieving good ET CO2 scores is not necessarily the most important thing. Biofeedback should enhance or expand your subjective awareness rather than detract from it.
The guide assumes that you have read the Software Installation and Set-up Guide, and therefore know how to start the application.
The applications in the suite work with several devices. For an up to date list of supported hardware, please see the StressResilientMind.co.uk website.
Basic Capnometry Application User Guide, copyright Glyn Blackett page 2
2 Launching the Application
Figure 1 above shows the Capnometry tab of the Platform application. Press the button labelled 1 to launch the application. Make sure you have your BioEra licence key (dongle) inserted into a USB socket. After a few seconds a window will appear on your screen.
2.1 Hardware Set-up
The physical aspects of hardware set-up (how to connect and use your sensors, etc.) are dependent upon the type of amplifier you are using, and are covered in a separate document (Hardware Set-up Guide).
Before you start the application you should select the type of device you're using in the Capnometer source control, found in the device set-up dialog and accessed from the Platform Set-up tab.
One of the device options is 'Simulator'. In simulator mode, you can learn how to use the software without the encumbrance of actually sampling the breath. (The application simply uses recorded data as a source.)
As with other applications, in the top right corner of the application's window you'll see a red lamp (see figure 2) which turns green after you press play. If you do not see this happen, it means that the application has not been able to establish a connection with your device, for some reason. Again, see the hardware guide for further information.
Depending on your device, you may also see buttons which can be used to configure your device – see the hardware guide for more details.
See the Installation and Set-up Guide for further details of device set-up.
Capnometers can take up to several minutes after being started, to warm up fully and give a fully accurate signal. For some devices the trace takes a while to appear, for this reason.
Basic Capnometry Application User Guide, copyright Glyn Blackett page 3
2.1.1 Zeroing The Capnometer
When there is no exhaled air flowing into the capnometer, the signal (PP CO2) should go to zero. You can see this happens in figure 3 below, at least for the first few breaths (later the breathing is so rapid it doesn't have time). Sometimes this doesn't happen, and if you see that the trace hovers a few points above zero, you need to take steps to re-zero your device. In fact it's a good idea to do this every so often anyway, because if the signal drifts the other way, i.e. below zero, you won't see it.
In summary, zeroing a capnometer is in effect re-calibrating its signal.
In the application, depending on your device, there may be a button that allows you to do this from within the software. For example, in figure 2 above you can see a “Zero” button.
At the time of writing this is only implemented for the “Respironics-compatible” device. For it to work properly, the device must be disconnected from the breath for a period of several seconds before clicking. When you click, you should see the trace disappear and the lamp turn red for a period of a few seconds. If this doesn't happen, wait longer.
3 About CapnometryThis section outlines the physiological parameters used in the application.
The measured parameter is the partial pressure of carbon dioxide (PP CO2) in exhaled air. Figure 3 above shows the variation in this signal – it rises to a peak during the exhalation phase of the breath. The height of this peak is key – it is known as the end-tidal partial pressure of CO2 (ET PP CO2) and is known to correlate with the blood level of CO2.
Although we think of carbon dioxide as a waste product, it has important functions in the body. Firstly, it controls the pH (acidity) of blood, which is a critical parameter because it dictates how the blood binds to oxygen and then releases it to tissues. Secondly, blood carbon dioxide influences vasoconstriction and vasodilation, most particularly in the brain where it is the main determinant.
These two factors together mean that partial pressure of carbon dioxide in the blood determines the oxygen delivery to brain cells.
3.1 Hyperventilation
Hyperventilation or over-breathing is a common form of breathing dysregulation. It causes the partial pressure of carbon dioxide in blood to become depressed, resulting ultimately in reduced oxygen delivery to brain cells. Low carbon dioxide is known as hypocapnia. Hyperventilation can be acute of chronic, and has numerous associated symptoms.
Basic Capnometry Application User Guide, copyright Glyn Blackett page 4
Figure 3 – Carbon dioxide signal
Under-breathing, by contrast, is rare, and from a practical point of view is extremely unlikely in the absence of lung disease.
Capnometry is the best way of measuring over-breathing (which is a matter of degree). In over-breathing, ET PP CO2 is low.
3.2 Optimal Breathing
Conversely, in optimal breathing ET PP CO2 is high, thus maximising blood CO2, and oxygen delivery to brain cells. (This assumes that there is no lung disorder making ET CO2 unnaturally high.)
Optimal breathing training aims to maximise ET PP CO2.
3.3 Calculated Parameters
From the PP CO2 trace, the software calculates:
• End-tidal (or peak) PP CO2 – once per breath
• Breathing Rate (in breaths per minute)
These two parameters are shown in the long term display (figure 6), and can be used as the basis of audio feedback (section 4.6).
3.4 Breathing Calibration
To calculate the above parameters, the software needs to accurately and consistently detect the turning points of the breath (beginnings of inhalation and exhalation). This calibration should happen automatically during the first minute or so of the session. It's possible that sudden changes in breathing can cause the software to lose its calibration so that it no longer detects the breath turning points. You can tell this has happened because the breathing rate and ET PP CO2 no longer update for each breath – but it should be a very rare event. In such cases you can recalibrate the breathing by pressing a button, in the bottom left of the application's window, labelled 4 in figure 4 below.
Basic Capnometry Application User Guide, copyright Glyn Blackett page 5
4 User InterfaceFigure 4 below shows the user interface of the Basic Capnometry application.
4.1 Standard Controls (Start / Stop, etc.)
A set of buttons – Play, Stop and Pause – are the same in all the applications in the suite. They should be self-explanatory.
The button marked with a red asterisk is a simple event marker. You can use it to mark adventitious happenings and changes in session conditions (e.g. you turn on or off breath pacing). It is particularly useful for coaches and therapists. Events thus marked are represented in the long term chart (see section 4.4 below) by a vertical white line. They are also recorded in the session data file and are shown in session report charts (as dotted vertical lines) (see section 5).
Note that pressing the escape key during a session has the same effect as pressing the red asterisk with your mouse (i.e. it is an alternative).
Basic Capnometry Application User Guide, copyright Glyn Blackett page 6
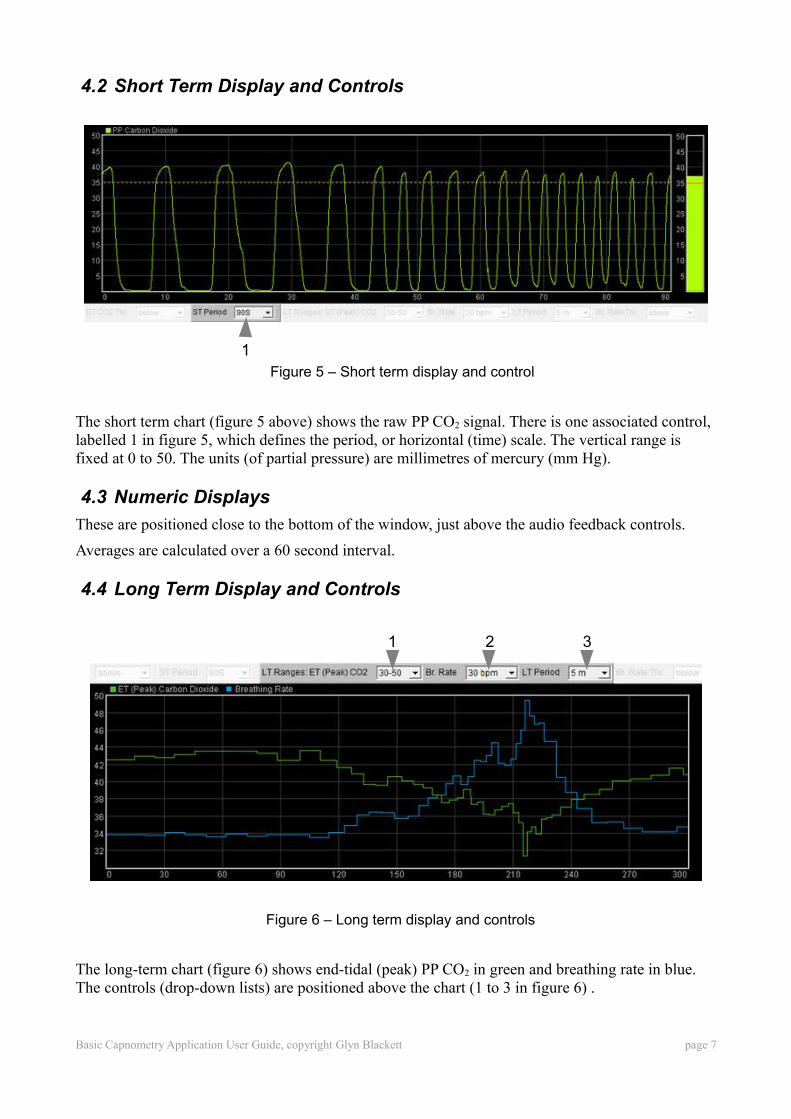
4.2 Short Term Display and Controls
The short term chart (figure 5 above) shows the raw PP CO2 signal. There is one associated control, labelled 1 in figure 5, which defines the period, or horizontal (time) scale. The vertical range is fixed at 0 to 50. The units (of partial pressure) are millimetres of mercury (mm Hg).
4.3 Numeric Displays
These are positioned close to the bottom of the window, just above the audio feedback controls.
Averages are calculated over a 60 second interval.
4.4 Long Term Display and Controls
The long-term chart (figure 6) shows end-tidal (peak) PP CO2 in green and breathing rate in blue. The controls (drop-down lists) are positioned above the chart (1 to 3 in figure 6) .
Basic Capnometry Application User Guide, copyright Glyn Blackett page 7
Figure 6 – Long term display and controls
1 2 3
Figure 5 – Short term display and control
1
ET (Peak) CO2 Controls the vertical range (scale) of the green end-tidal CO2 trace. Click the green square (upper left of chart) to see this range displayed in the chart.
Br. Rate Controls the vertical range of the blue breathing rate trace. Click the blue square (upper left of chart) to see this range displayed in the chart.
LT Period Controls the horizontal (time) range.
4.5 Threshold Display and Controls
Threshold-based feedback is designed to follow a consistent pattern throughout all the applications, and therefore it made sense to describe threshold functionality in a single place, viz. The Guide to Audio and Threshold-based Feedback (a separate document). I recommend you read that before trying to make sense of this section.
(Controls for threshold-based audio feedback are covered in section 4.6 below.)
In the Basic Capnometry application, there are two thresholds, found at left and right sides of the application's main window, labelled 3 and 6 in figure 4 above.
Threshold 1 (left) applies to end-tidal CO2 (and is shown in figure 7) while threshold 2 applies to breathing rate.
Each has the standard four conditions, i.e. “above”, “below”, “outside” and “off”.
As an example of how you might use threshold-based feedback, suppose you wish to maintain a steady breathing rate of around 6 breaths per minute with your ET PP CO2 maintained above 40 mm Hg. First set the breathing rate threshold feedback (right side) to inform you if the breath is either too fast or too slow. To set this up, you would set the condition to 'outside', then drag the threshold levels so that the upper is say around 7 bpm and the lower is say around 5 bpm. Second, set the ET CO2 threshold to warn you if you drop below 40 – set the condition to 'below' and drag the level to 40. You will probably want to turn on audio feedback for the threshold feedback, which is covered in the next section.
4.6 Audio Feedback Controls
Again, audio feedback functionality is consistent between applications and so is described in one place, i.e. The Guide to Audio and Threshold-based Feedback, which you should read before trying to make sense of this section.
Figure 8 below shows the controls available for audio feedback.
Basic Capnometry Application User Guide, copyright Glyn Blackett page 8
1
Figure 7 – Threshold display & controls
4.6.1 Midi
When activated, a musical note is played once per breath whose pitch reflects the chosen feedback parameter.
Drop-down list control (1) in figure 8 above sets the parameter for midi feedback. The options are:
ET CO2; breathing rate; CO2 threshold (ratio); breathing rate threshold (ratio)
4.6.2 Threshold
To recap, a sound is played whenever one of the threshold parameters goes out of range (or comes back within range). Function depends on the settings of the threshold controls covered in section 4.5 above.
Basic Capnometry Application User Guide, copyright Glyn Blackett page 9
5 Session ReportsThe application records data so that you can generate a report for your sessions. The report contains summary data and graphs showing the progression of the feedback parameters over the whole session (excepting the first minute or so, during which time data is not written to allow for warming of the device).
To generate and open a session report, click the button labelled 2 in figure 1. A dialog window opens in which you can select various options (see figure 19).
The software creates the report in html format. It will be opened using your computer's default web browser, e.g. Internet Explorer. (Note that a live internet connection is not needed.) The html file is saved, so you can for example email it to someone. See the Installation and Set-up Guide for details of file storage.
5.1 Report Options
Most of the options should be self-explanatory.
If you change your mind about options on seeing your report, you can regenerate the report by clicking the report button (2 in figure 1), then checking 'Overwrite existing report'.
Options relating to either CO2 data or breathing data are found under separate tabs.
Drop-down list controls allow you to set maximum or minimum values for several of the parameters. Setting these limits is a basic way of excluding “artefacts”, for example if you spoke to someone during the session this is likely to affect the calculations.
5.2 Adding Notes to a Report
You can choose to write some notes for your session report. Checking 'Add notes to report' (top right of the dialog) allows you to do this.
You may wish to add notes after having first seen the report. In this case, simply click the button (2 in figure 1) again, and check the Add notes option. This will regenerate the report with your added notes.
Basic Capnometry Application User Guide, copyright Glyn Blackett page 10
5.3 Sample Session Report
Please note, the formatting of the report has been changed slightly to fit this document.
Training Session Report
Training Application Basic Capnometry
User Name Default User
Session Date 23/03/12 08:24
Basic Capnometry Application User Guide, copyright Glyn Blackett page 11
Breathing Summary Data
Parameter Mean Max Min S.D.
Peak CO2 39.2 mm Hg 43.6 mm Hg 31.3 mm Hg 2.8 mm Hg
Breathing Rate 12.7 bpm 29.2 bpm 5.3 bpm 6.6 bpm
6 Application ReportAn application report summarises all the sessions for the currently selected user, in charts and a table.
To generate and open an application report, click the button labelled 3 in figure 1. A dialog window opens in which you can select various options (see figure 11).
As with session reports, the software creates the application report in html format. It will be opened using your computer's default web browser, e.g. Internet Explorer. (Note that a live internet connection is not needed.) The html file is saved, so you can for example email it to someone. See the Installation and Set-up Guide for details of file storage.
6.1 Report Options
The application report options dialog is an adapted version of the session report options dialog. Many of the options are the same, and should be self-explanatory. See section 5.1 above.
As with all of the application reports in the suite, there is a chart for each of the main parameters tracked in the application – in the case of the Basic Capnometry application that means end-tidal PP CO2 and breathing rate. For each chart you can opt for line graphs for the maximum, minimum and mean. The line graphs have one point per session.
Basic Capnometry Application User Guide, copyright Glyn Blackett page 12


![MONITORAGGIO IN ICU - campus.unibo.itcampus.unibo.it/70192/1/MONITORAGGIO_[Sola_lettura].pdf · Monitoraggio parametri vitali Buccal capnometry to guide management of massive blood](https://static.documents.pub/doc/80x56/5c6591fa09d3f2a86e8ccf05/monitoraggio-in-icu-solaletturapdf-monitoraggio-parametri-vitali-buccal.jpg)


