BioOne sees sustainable scholarly publishing as an inherently collaborative enterprise connecting authors, nonprofit publishers, academic institutions, research libraries, and research funders in the common goal of maximizing access to critical research. Bat Species Richness in Atlantic Forest: What Is the Minimum Sampling Effort? Author(s): Helena Godoy Bergallo, Carlos E. L. Esbérard, Marco Aurelio Ribeiro Mello, Viviane Lins, Renato Mangolin, Glauce G. S. Melo, and Márcia Baptista Source: BIOTROPICA, 35(2):278-288. 2003. Published By: The Association for Tropical Biology & Conservation DOI: http://dx.doi.org/10.1646/02033 URL: http://www.bioone.org/doi/full/10.1646/02033 BioOne (www.bioone.org ) is a nonprofit, online aggregation of core research in the biological, ecological, and environmental sciences. BioOne provides a sustainable online platform for over 170 journals and books published by nonprofit societies, associations, museums, institutions, and presses. Your use of this PDF, the BioOne Web site, and all posted and associated content indicates your acceptance of BioOne’s Terms of Use, available at www.bioone.org/page/terms_of_use . Usage of BioOne content is strictly limited to personal, educational, and non-commercial use. Commercial inquiries or rights and permissions requests should be directed to the individual publisher as copyright holder.
Transcript
BioOne sees sustainable scholarly publishing as an inherently collaborative enterprise connecting authors, nonprofit publishers, academic institutions, researchlibraries, and research funders in the common goal of maximizing access to critical research.
Bat Species Richness in Atlantic Forest: What Is the Minimum Sampling Effort?Author(s): Helena Godoy Bergallo, Carlos E. L. Esbérard, Marco Aurelio Ribeiro Mello, Viviane Lins,Renato Mangolin, Glauce G. S. Melo, and Márcia BaptistaSource: BIOTROPICA, 35(2):278-288. 2003.Published By: The Association for Tropical Biology & ConservationDOI: http://dx.doi.org/10.1646/02033URL: http://www.bioone.org/doi/full/10.1646/02033
BioOne (www.bioone.org) is a nonprofit, online aggregation of core research in the biological, ecological, andenvironmental sciences. BioOne provides a sustainable online platform for over 170 journals and books publishedby nonprofit societies, associations, museums, institutions, and presses.
Your use of this PDF, the BioOne Web site, and all posted and associated content indicates your acceptance ofBioOne’s Terms of Use, available at www.bioone.org/page/terms_of_use.
Usage of BioOne content is strictly limited to personal, educational, and non-commercial use. Commercial inquiriesor rights and permissions requests should be directed to the individual publisher as copyright holder.
Bat Species Richness in Atlantic Forest: What Is the MinimumSampling Effort?1
Helena Godoy Bergallo
Departamento de Ecologia, Universidade do Estado do Rio de Janeiro, Rua Sao Francisco Xavier 524,20559-900, Rio de Janeiro, RJ, Brazil
Carlos E. L. Esberard
Projeto Morcegos Urbanos, Fundacao RIOZOO, Quinta da Boa Vista, 20940-040, Rio de Janeiro, RJ, Brazil
Marco Aurelio Ribeiro Mello
Pos-Graduacao em Ecologia, UNICAMP, CP 6109, 13081-970, Campinas, SP, Brazil
Viviane Lins
Projeto Morcegos Urbanos, Fundacao RIOZOO, Quinta da Boa Vista, 20940-040, Rio de Janeiro, RJ, Brazil
and
Renato Mangolin, Glauce G. S. Melo, and Marcia Baptista
Programa de Pos-Graduacao em Biologia, Universidade do Estado do Rio de Janeiro, Rua Sao FranciscoXavier 524, 20559-900, Rio de Janeiro, RJ, Brazil
ABSTRACTSpecies lists are sources of information for studies of both conservation and macroecology. It is, however, importantto differentiate between relatively complete lists and extremely incomplete ones. The aim of this study was to evaluatehow sampling effort typically used in inventories affects the number of bat species captured in areas of Atlantic Forestin southeastern Brazil. We also evaluated if the number of sampled sites, size of the sampled area, and sampling effort(net hours) affect species richness. We used previously reported data from studies in Rio de Janeiro, Sao Paulo, andMinas Gerais States, and our own data collected during 1989 and 2001. Nonlinear models fit well the data for Riode Janeiro and Minas Gerais States and all states together, but not for Sao Paulo State. Genera richness showed asimilar pattern to that of species richness. The model used to explain the relationship between species richness andsize of the study area, number of sites, and sampling effort sampled was significant. The number of sites sampledexplained a significant part of the variation observed; however, other variables contributed nothing to the model,suggesting that capturing beta diversity is the most important aspect of biodiversity surveys for bats, and that increasingnet hours at a given location is much more inefficient than distributing net hours across locations. We suggest 1000captures as the minimum necessary when sampling with mist nets to capture the majority of phyllostomid species fora given site (alpha diversity). In addition, we suggest that shifting the position of the mist nets between nights willincrease the probability of capturing more species.
RESUMOAs listas de especies sao fontes de informacoes para estudos, tanto de conservacao quanto de macroecologia. Entretanto,e importante diferenciar entre listas relativamente completas daquelas seriamente incompletas. O objetivo deste estudofoi avaliar como o esforco amostral mınimo tipicamente usado em inventarios afeta o numero de especies de morcegoscapturados em areas de Mata Atlantica do sudeste do Brasil. Nos tambem avaliamos se o numero de pontos amostrados,o tamanho da area amostrada e o esforco de captura (hora-rede) afetam a riqueza de especies. Nos usamos dadosdisponıveis de estudos desenvolvidos nos estados do Rio de Janeiro, Sao Paulo e Minas Gerais, e os nossos propriosdados coletados de 1989 a 2001. Modelos nao-lineares se ajustaram para os estados do Rio de Janeiro e Minas Geraise todos os estados juntos, mas nao para o Estado de Sao Paulo. A riqueza de generos mostrou o mesmo padrao dariqueza de especies. O modelo usado para explicar a relacao entre riqueza de especies e tamanho da area de estudo,numero de pontos amostrados e esforco amostral foi significativo. O numero de pontos amostrados explicou umaparte significante da variacao observada. Contudo, as outras variaveis nao contribuıram para o modelo, sugerindo quecapturar a diversidade Beta e o aspecto mais importante de inventarios de biodiversidade para morcegos, e que oaumento de horas-rede numa dada localidade e muito mais ineficiente do que distribuir horas-rede entre localidades.Nos sugerimos 1000 capturas como o mınimo necessario para amostrar, com redes de neblina, a maioria das especiesde filostomıdeos de uma dada area (diversidade Alfa). Adicionalmente, sugerimos que mudando a posicao das redesentre noites aumentara a probabilidade de capturar um maior numero de especies.
1 Received 18 March 2002; revision accepted 3 April 2003.
Minimum Bat Sampling Effort in Atlantic Forest 279
CURRENT EFFORTS IN CONSERVATION ATTEMPT TO
IDENTIFY AREAS with high species richness and highlevels of endemism (Caldecott et al. 1996, Myerset al. 2000). Species lists are sources of basic infor-mation for such efforts (Remsen 1994, Blackburn& Gaston 1998); however, species lists available inthe literature have been obtained by different re-searchers, in different contexts, with distinct aims,and using different techniques (Gaston 1996).These differences can result in biases in describedpatterns of species richness at both local and re-gional scales (Remsen 1994). As a result, it is im-portant to differentiate between relatively completelists and extremely incomplete ones (Silva & Me-dellın 2001).
The mammal fauna of the Atlantic Forest is,proportionally by area, the richest (ca 246 spp.) ofall Brazilian biomes (Fonseca et al. 1999, Costa etal. 2000). The species richness of the bat fauna isalso high (96 spp. or 71% of the species that occurin Brazil), surpassed only by that of the AmazonForest (124 spp.; Marinho-Filho & Sazima 2000).The Atlantic Forest, however, is richer in bat spe-cies than Brazilian Amazonia if one considers thearea of each biome (Fonseca et al. 1999). The levelof bat species endemism is relatively low for bothbiomes (5.2% in Atlantic Forest and 11.1% in Am-azon Forest; Marinho-Filho & Sazima 2000).
Many inventories of bat fauna have been car-ried out in southeastern Brazil, mostly in Sao Pauloand Rio de Janeiro States, where most of the batresearchers in the country reside (Pedro 1998). Inthe Atlantic Forest of southeastern Brazil, at least19 localities have been surveyed (Esberard 1999).These inventories have been conducted in areaswith different degrees of human impact, from ur-ban parks and sites in various successional stages topristine forest sites.
For all of these inventories, bats were sampledusing mist nets. This is the most commonly usedmethod for bat sampling (Kunz & Kurta 1988)and seems to be the most useful for non-insectivorebat taxa (Voss & Emmons 1996), especiallyphyllostomids and other bats that forage in the un-derstory (Kalko 1998). Some studies (Fenton et al.1992, Wilson et al. 1996) have shown that speciesof the family Phyllostomidae, mainly from the sub-family Phyllostominae, are indicators of habitat dis-turbance, since this family is considerably specioseand its species display a high variety of food habits(Fenton et al. 1992, Schulze et al. 2000). Membersof the families Noctilionidae, Emballonuridae, Na-talidae, Thyropteridae, Vespertilionidae, and Mo-lossidae tend to be less frequently sampled. Meth-
ods such as harp traps or acoustical methods (e.g.,Anabat) rarely have been used for inventories insoutheastern Brazil.
The goal of this study was to evaluate howsampling effort typically used in inventories affectsthe number of bat species sampled in Atlantic For-est of southeastern Brazil. Furthermore, in areaswith greater sampling effort, we were able to de-termine if factors such as number of sampled sites,the size of the area, and sampling effort (net hours)affect species richness.
MATERIALS AND METHODS
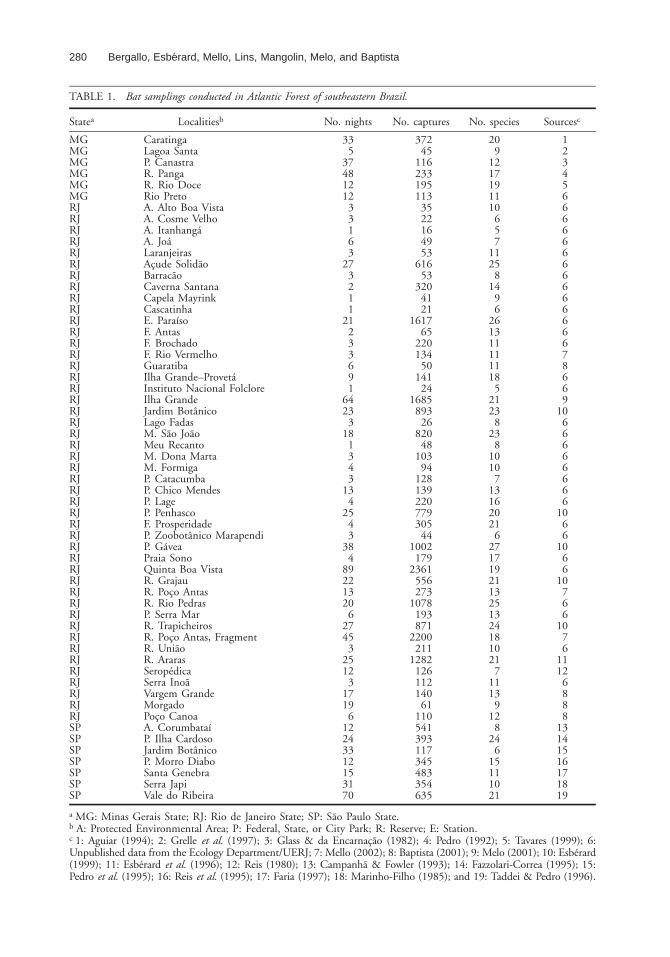
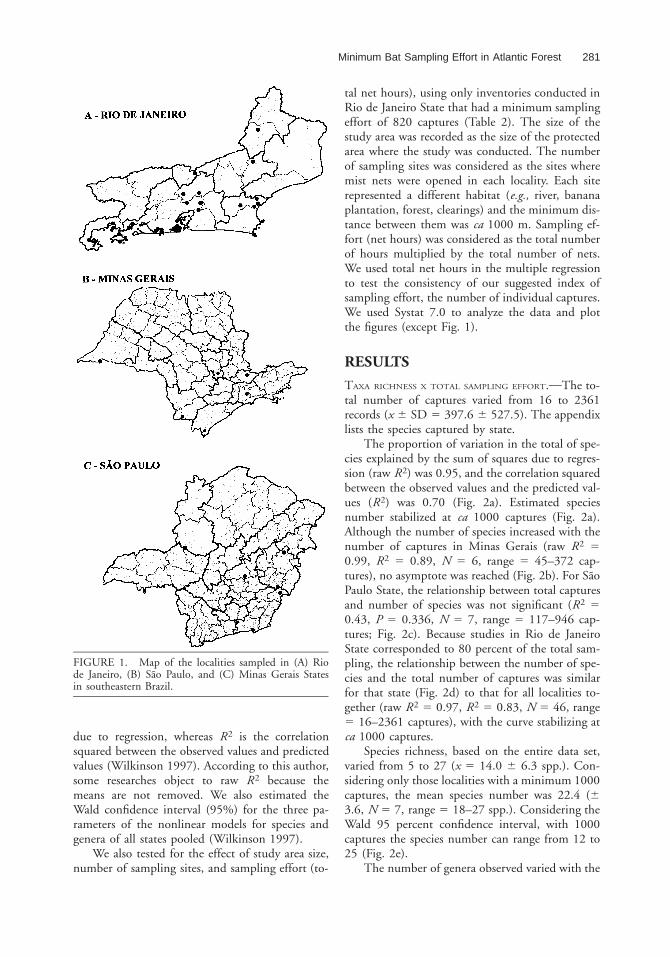
To evaluate if the total number of captures em-ployed in different studies was sufficient to inven-tory the species richness of bats in the sampledlocalities, we used both data from the literature andthose collected by ourselves during 1989 and 2001(Table 1). We selected only studies conducted inthe Atlantic Forest of southeastern Brazil (Rio deJaneiro, Sao Paulo, and Minas Gerais States) thatdescribed the total number of captures. Data for59 localities in the Atlantic Forest of southeasternBrazil were analyzed, including 6 localities in Mi-nas Gerais State, 7 in Sao Paulo State, and 46 inRio de Janeiro State (Fig. 1; global positioning sys-tem locations can be obtained from the authors).The total number of captures refers to the totalnumber of bats recorded. Since many authors didnot mark the captured animals, we included recap-tures in the total number of captures. All studiesused mist nets and bats were either capturedthroughout the entire night or only during part ofit.
Sao Paulo and Rio de Janeiro States have atleast 63 and 65 bat species, respectively (Pedro1998, Bergallo et al. 2000; C. Esberard, pers. obs.).Minas Gerais State does not have an updated listof bat species. The fourth state that integrates theso-called Southeastern Region of Brazil, EspıritoSanto, has so far only one locality sampled for bats(Peracchi & Albuquerque 1993). We could not usethis study because the authors did not describe thetotal sampling effort and the number of captures.
The effect of sampling on species richness wastested with linear and nonlinear models for MinasGerais, Sao Paulo, and Rio de Janeiro States, andfor all states pooled. We repeated the analysis usinggenera as indicators of the effect of sampling inspecies lists. In the nonlinear models, the measuresobtained are raw R2 and R2. The raw R2 is theproportion of the variation in y (species richness inthis study) that is explained by the sum of squares
280 Bergallo, Esberard, Mello, Lins, Mangolin, Melo, and Baptista
TABLE 1. Bat samplings conducted in Atlantic Forest of southeastern Brazil.
Statea Localitiesb No. nights No. captures No. species Sourcesc
MGMGMGMGMGMG
CaratingaLagoa SantaP. CanastraR. PangaR. Rio DoceRio Preto
335
37481212
37245
116233195113
209
12171911
123456
RJRJRJRJRJRJ
A. Alto Boa VistaA. Cosme VelhoA. ItanhangaA. JoaLaranjeirasAcude Solidao
P. LageP. PenhascoF. ProsperidadeP. Zoobotanico MarapendiP. GaveaPraia Sono
425
43
384
22077930544
1002179
162021
62717
610
66
106
RJRJRJRJRJRJ
Quinta Boa VistaR. GrajauR. Poco AntasR. Rio PedrasP. Serra MarR. Trapicheiros
89221320
627
2361556273
1078193871
192113251324
610
766
10RJRJRJRJRJRJ
R. Poco Antas, FragmentR. UniaoR. ArarasSeropedicaSerra InoaVargem Grande
453
2512
317
2200211
1282126112140
181021
71113
76
1112
68
RJRJSPSPSP
MorgadoPoco CanoaA. CorumbataıP. Ilha CardosoJardim Botanico
196
122433
61110541393117
912
824
6
88
131415
SPSPSPSP
P. Morro DiaboSanta GenebraSerra JapiVale do Ribeira
12153170
345483354635
15111021
16171819
a MG: Minas Gerais State; RJ: Rio de Janeiro State; SP: Sao Paulo State.b A: Protected Environmental Area; P: Federal, State, or City Park; R: Reserve; E: Station.c 1: Aguiar (1994); 2: Grelle et al. (1997); 3: Glass & da Encarnacao (1982); 4: Pedro (1992); 5: Tavares (1999); 6:Unpublished data from the Ecology Department/UERJ; 7: Mello (2002); 8: Baptista (2001); 9: Melo (2001); 10: Esberard(1999); 11: Esberard et al. (1996); 12: Reis (1980); 13: Campanha & Fowler (1993); 14: Fazzolari-Correa (1995); 15:Pedro et al. (1995); 16: Reis et al. (1995); 17: Faria (1997); 18: Marinho-Filho (1985); and 19: Taddei & Pedro (1996).
Minimum Bat Sampling Effort in Atlantic Forest 281
FIGURE 1. Map of the localities sampled in (A) Riode Janeiro, (B) Sao Paulo, and (C) Minas Gerais Statesin southeastern Brazil.
due to regression, whereas R2 is the correlationsquared between the observed values and predictedvalues (Wilkinson 1997). According to this author,some researches object to raw R2 because themeans are not removed. We also estimated theWald confidence interval (95%) for the three pa-rameters of the nonlinear models for species andgenera of all states pooled (Wilkinson 1997).
We also tested for the effect of study area size,number of sampling sites, and sampling effort (to-
tal net hours), using only inventories conducted inRio de Janeiro State that had a minimum samplingeffort of 820 captures (Table 2). The size of thestudy area was recorded as the size of the protectedarea where the study was conducted. The numberof sampling sites was considered as the sites wheremist nets were opened in each locality. Each siterepresented a different habitat (e.g., river, bananaplantation, forest, clearings) and the minimum dis-tance between them was ca 1000 m. Sampling ef-fort (net hours) was considered as the total numberof hours multiplied by the total number of nets.We used total net hours in the multiple regressionto test the consistency of our suggested index ofsampling effort, the number of individual captures.We used Systat 7.0 to analyze the data and plotthe figures (except Fig. 1).
RESULTS
TAXA RICHNESS X TOTAL SAMPLING EFFORT. The to-tal number of captures varied from 16 to 2361records (x 6 SD 5 397.6 6 527.5). The appendixlists the species captured by state.
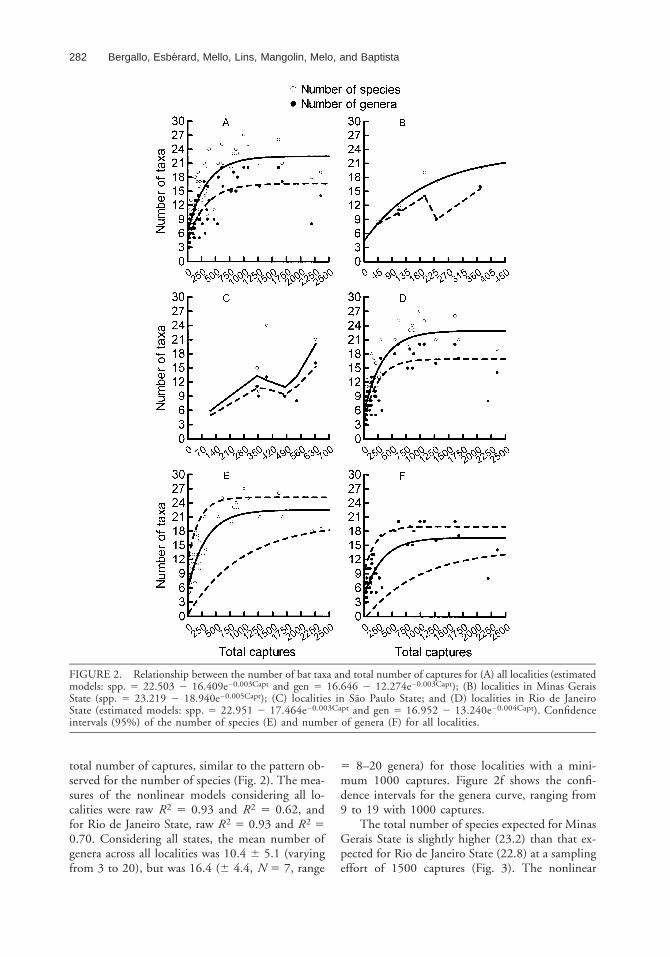
The proportion of variation in the total of spe-cies explained by the sum of squares due to regres-sion (raw R2) was 0.95, and the correlation squaredbetween the observed values and the predicted val-ues (R2) was 0.70 (Fig. 2a). Estimated speciesnumber stabilized at ca 1000 captures (Fig. 2a).Although the number of species increased with thenumber of captures in Minas Gerais (raw R2 50.99, R2 5 0.89, N 5 6, range 5 45–372 cap-tures), no asymptote was reached (Fig. 2b). For SaoPaulo State, the relationship between total capturesand number of species was not significant (R2 50.43, P 5 0.336, N 5 7, range 5 117–946 cap-tures; Fig. 2c). Because studies in Rio de JaneiroState corresponded to 80 percent of the total sam-pling, the relationship between the number of spe-cies and the total number of captures was similarfor that state (Fig. 2d) to that for all localities to-gether (raw R2 5 0.97, R2 5 0.83, N 5 46, range5 16–2361 captures), with the curve stabilizing atca 1000 captures.
Species richness, based on the entire data set,varied from 5 to 27 (x 5 14.0 6 6.3 spp.). Con-sidering only those localities with a minimum 1000captures, the mean species number was 22.4 (63.6, N 5 7, range 5 18–27 spp.). Considering theWald 95 percent confidence interval, with 1000captures the species number can range from 12 to25 (Fig. 2e).
The number of genera observed varied with the
282 Bergallo, Esberard, Mello, Lins, Mangolin, Melo, and Baptista
FIGURE 2. Relationship between the number of bat taxa and total number of captures for (A) all localities (estimatedmodels: spp. 5 22.503 2 16.409e20.003Capt and gen 5 16.646 2 12.274e20.003Capt); (B) localities in Minas GeraisState (spp. 5 23.219 2 18.940e20.005Capt); (C) localities in Sao Paulo State; and (D) localities in Rio de JaneiroState (estimated models: spp. 5 22.951 2 17.464e20.003Capt and gen 5 16.952 2 13.240e20.004Capt). Confidenceintervals (95%) of the number of species (E) and number of genera (F) for all localities.
total number of captures, similar to the pattern ob-served for the number of species (Fig. 2). The mea-sures of the nonlinear models considering all lo-calities were raw R2 5 0.93 and R2 5 0.62, andfor Rio de Janeiro State, raw R2 5 0.93 and R2 50.70. Considering all states, the mean number ofgenera across all localities was 10.4 6 5.1 (varyingfrom 3 to 20), but was 16.4 (6 4.4, N 5 7, range
5 8–20 genera) for those localities with a mini-mum 1000 captures. Figure 2f shows the confi-dence intervals for the genera curve, ranging from9 to 19 with 1000 captures.
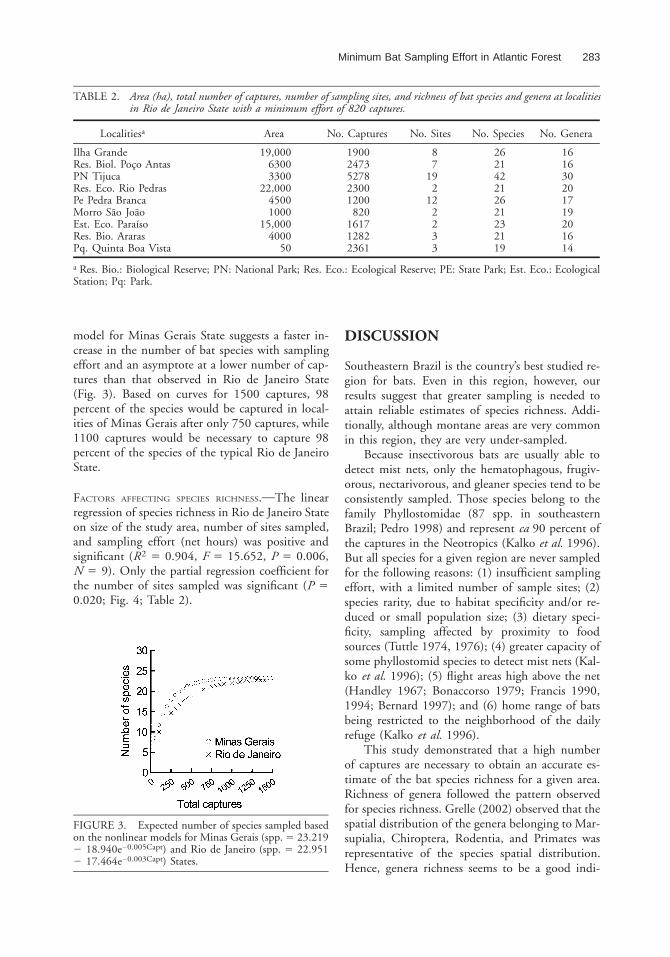
The total number of species expected for MinasGerais State is slightly higher (23.2) than that ex-pected for Rio de Janeiro State (22.8) at a samplingeffort of 1500 captures (Fig. 3). The nonlinear
Minimum Bat Sampling Effort in Atlantic Forest 283
TABLE 2. Area (ha), total number of captures, number of sampling sites, and richness of bat species and genera at localitiesin Rio de Janeiro State with a minimum effort of 820 captures.
Localitiesa Area No. Captures No. Sites No. Species No. Genera
Ilha GrandeRes. Biol. Poco AntasPN TijucaRes. Eco. Rio PedrasPe Pedra BrancaMorro Sao JoaoEst. Eco. ParaısoRes. Bio. ArarasPq. Quinta Boa Vista
19,00063003300
22,00045001000
15,0004000
50
19002473527823001200
820161712822361
87
192
122233
262142212621232119
161630201719201614
a Res. Bio.: Biological Reserve; PN: National Park; Res. Eco.: Ecological Reserve; PE: State Park; Est. Eco.: EcologicalStation; Pq: Park.
FIGURE 3. Expected number of species sampled basedon the nonlinear models for Minas Gerais (spp. 5 23.2192 18.940e20.005Capt) and Rio de Janeiro (spp. 5 22.9512 17.464e20.003Capt) States.
model for Minas Gerais State suggests a faster in-crease in the number of bat species with samplingeffort and an asymptote at a lower number of cap-tures than that observed in Rio de Janeiro State(Fig. 3). Based on curves for 1500 captures, 98percent of the species would be captured in local-ities of Minas Gerais after only 750 captures, while1100 captures would be necessary to capture 98percent of the species of the typical Rio de JaneiroState.
FACTORS AFFECTING SPECIES RICHNESS. The linearregression of species richness in Rio de Janeiro Stateon size of the study area, number of sites sampled,and sampling effort (net hours) was positive andsignificant (R2 5 0.904, F 5 15.652, P 5 0.006,N 5 9). Only the partial regression coefficient forthe number of sites sampled was significant (P 50.020; Fig. 4; Table 2).
DISCUSSION
Southeastern Brazil is the country’s best studied re-gion for bats. Even in this region, however, ourresults suggest that greater sampling is needed toattain reliable estimates of species richness. Addi-tionally, although montane areas are very commonin this region, they are very under-sampled.
Because insectivorous bats are usually able todetect mist nets, only the hematophagous, frugiv-orous, nectarivorous, and gleaner species tend to beconsistently sampled. Those species belong to thefamily Phyllostomidae (87 spp. in southeasternBrazil; Pedro 1998) and represent ca 90 percent ofthe captures in the Neotropics (Kalko et al. 1996).But all species for a given region are never sampledfor the following reasons: (1) insufficient samplingeffort, with a limited number of sample sites; (2)species rarity, due to habitat specificity and/or re-duced or small population size; (3) dietary speci-ficity, sampling affected by proximity to foodsources (Tuttle 1974, 1976); (4) greater capacity ofsome phyllostomid species to detect mist nets (Kal-ko et al. 1996); (5) flight areas high above the net(Handley 1967; Bonaccorso 1979; Francis 1990,1994; Bernard 1997); and (6) home range of batsbeing restricted to the neighborhood of the dailyrefuge (Kalko et al. 1996).
This study demonstrated that a high numberof captures are necessary to obtain an accurate es-timate of the bat species richness for a given area.Richness of genera followed the pattern observedfor species richness. Grelle (2002) observed that thespatial distribution of the genera belonging to Mar-supialia, Chiroptera, Rodentia, and Primates wasrepresentative of the species spatial distribution.Hence, genera richness seems to be a good indi-
284 Bergallo, Esberard, Mello, Lins, Mangolin, Melo, and Baptista
FIGURE 4. Partials of multiple regression analyses be-tween the number of species and (A) area (P 5 0.226),(B) number of sampling sites (P 5 0.020), and, (C) sam-pling effort (net hours); (P 5 0.113).
cator of species richness, since species of the samegenera cannot have a similar capture efficiency.
The minimum sampling effort of 1000 cap-tures appears to be a consistent index to capturethe majority of phyllostomid species in a givenarea. According to Morrison (1978, 1980), moresampling nights can produce a greater number ofspecies than more hours of nocturnal sampling, be-cause a great number of bat species are active main-ly after sunset. Nevertheless, some species may beactive late in the evening; thus, it is important to
do the sampling all night long when possible (Kunz1982).
The number of sites showed a strong relation-ship with the number of species recorded. De-pending on the life history of the bat species, somesites will be better than others. Furthermore, it isknown that bats learn the position of the mist nets,diminishing the capture success during subsequentnights (Kunz & Kurta 1988). In addition, manyspecies of bats restrict their activities to the neigh-borhood of the refuge (Kalko et al. 1996) and thevariation in the sample sites can increase the prob-ability of sampling such species. Capturing be-tween-site variability (beta diversity) seems to bemore important than determining the full speciescomplement that may occasionally fly over one site(alpha diversity).
Even the amount of 1000 captures and shiftingthe net position may not be enough to representthe overall richness of species and genera in a givenarea. More than 170 nights and 7000 captures weremade in Tijuca National Park, and species are stillbeing added to the inventory (C. Esberard, pers.obs.). This is also the case at Poco das Antas Bio-logical Reserve, in which a total of 2596 captureswere recorded (Mello 2002). Continuous and largesample efforts have already been suggested by Kal-ko et al. (1996). After 43 years of sampling withmist nets and more than 50,000 captures on BarroColorado Island, Panama, 61 species have been re-corded, with 5 more species added using acousticmethods.
Studies using different sample methodologiesare necessary to obtain complete inventories of batfaunas, which could show if the richness of phyllos-tomid species and genera reflects the total bat spe-cies richness of the area. If so, the phyllostomidrichness or the richness of species captured in mistnets could be used as an index of the total batspecies richness.
ACKNOWLEDGMENTS
We thank W. E. Magnusson, R. Marquis, C. E. V. Grelle,and D. Vrcibradic for helpful comments on the manu-script. We thank N. Juca, C. A. B. Alvarez, D. P. Costa,T. T. L. Ribeiro, M. C. Enrici, G. Schittini, J. Nasci-mento, M. R. Nogueira, A. Pol, A. S. Chaves, E. M. Luz,and many other friends that assisted us during fieldwork.Permission to collect some bats was granted by the Ins-tituto Brasileiro do Meio Ambiente e Recursos NaturaisRenovaveis–IBAMA. During the development of thisstudy, RM and GGSM received an undergraduate fellow-ship from CNPq; GGSM, MARM, and MB receivedgraduate fellowships from CNPq or FAPERJ; and HGBreceived a research grant from CNPq. This work was sup-
Minimum Bat Sampling Effort in Atlantic Forest 285
ported by grants from FAPERJ (to HGB, process no. E-26/170.902/00), CNPq (to HGB, process no. 462003/00–0), Bat Conservation (to RM), Lincoln Park Zoo
Scott Neotropic Fund (to MARM), PROBIO-PRONA-BIO/MMA (to MARM), and Fundo de ConservacaoAmbiental/SMAC (to CELE).
LITERATURE CITED
AGUIAR, L. M. S. 1994. Comunidades de Chiroptera em tres areas de Mata Atlantica em diferentes estagios desucessao—Estacao Biologica de Caratinga, Minas Gerais. M.Sc. thesis. Universidade Federal de Minas Gerais,Belo Horizonte, MG, Brasil.
BAPTISTA, M. 2001. Aspectos ecologicos dos morcegos (Mammalia, Chiroptera) do Macico da Pedra Branca, Rio deJaneiro, RJ. M.Sc. thesis. Universidade do Estado do Rio de Janeiro, Rio de Janeiro, RJ, Brasil.
BERGALLO, H. G., L. GEISE, C. R. BONVICINO, R. CERQUEIRA, P. S. D’ANDREA, C. E. ESBERARD, F. A. S. FERNANDEZ,C. E. GRELLE, A. PERACCHI, S. SICILIANO, AND S. M. VAZ. 2000. Mamıferos. In H. G. Bergallo, C. F. D.Rocha, M. A. S. Alves, and M. V. Sluys (Eds.). A fauna ameacada de extincao do Estado do Rio de Janeiro,pp. 125–136. EdUERJ, Rio de Janeiro, RJ, Brasil.
BERNARD, E. 1997. Estratificacao vertical de comunidades de morcegos em clareiras abertas em matas de terra-firmena Amazonia Central. M.Sc. thesis. Instituto Nacional de Pesquisas da Amazonia, Manaus, Brasil.
BLACKBURN, T. M., AND K. J. GASTON. 1998. Some methodological issues in macroecology. Am. Nat. 151: 68–83.BONACCORSO, F. J. 1979. Foraging and reproductive ecology in a Panamanian bat community. Bull. Fla. State Mus.
Biol. Sci. 24: 359–408.CALDECOTT, J. O., M. D. JENKINS, T. H. JOHNSON, AND B. GROOMBRIDGE. 1996. Priorities for conserving global species
richness and endemism. Biodiv. Conserv. 5: 699–727.CAMPANHA, R. A., AND H. G. FOWLER. 1993. Roosting assemblages of bats in arenitic caves in remnant fragments of
Atlantic Forest in southeastern Brazil. Biotropica 25: 362–365.COSTA, L. P., Y. L. R. LEITE, G. A. B. FONSECA, AND M. T. FONSECA. 2000. Biogeography of South American forest
mammals: Endemism and diversity in the Atlantic Forest. Biotropica 32: 872–881.ESBERARD, C. E. L. 1999. Diversidade de Chiroptera em Unidades de conservacao do Macico da Tijuca, Municıpio
do Rio de Janeiro, RJ. M.Sc. thesis. Universidade Federal Rural do Rio de Janeiro, Rio de Janeiro, RJ, Brasil.———, A. S. CHAGAS, M. BAPTISTA, AND E. M. LUZ. 1996. Levantamento de Chiroptera na Reserva Biologica de
Araras, Petropolis, Rio de Janeiro-I-riqueza de especies. Rev. Cient. Centro Pesquisas Gonzaga Gama Filho 2:65–87.
FARIA, D. M. 1997. Os morcegos de Santa Genebra. In P. C. Morellato and H. F. Leitao Filho (Eds.). Ecologia ePreservacao de Uma Floresta Tropical Urbana–Reserva de Santa Genebra, pp. 100–106. Editora da UNICAMP,Campinas, SP, Brasil.
FAZZOLARI-CORREA, S. 1995. Aspectos sistematicos, ecologicos e reprodutivos de morcegos na Mata Atlantica. Ph.D.dissertation. Universidade de Sao Paulo, Sao Paulo, SP, Brasil.
FENTON, M. B., L. ACHARYA, D. AUDET, M. B. C. HICKEY, C. MERRIMAN, M. K. OBRIST, D. M. SYME, AND B. ADKINS.1992. Phyllostomid bats (Chiroptera: Phyllostomidae) as indicators of habitat disruption in the Neotropics.Biotropica 24: 440–446.
FONSECA, G. A. B., G. HERMANN, AND Y. L. R. LEITE. 1999. Chapter 20: Macrogeography of Brazilian mammals. InJ. F. Eisenberg and K. H. Redford. (Eds.). Mammals of the Neotropics. Volume 3: Ecuador, Peru, Bolivia,Brazil. University of Chicago Press, Chicago, Illinois.
FRANCIS, C. M. 1990. Trophic structure of bat communities in the understory of lowland dipterocarp rain forest inMalaysa. J. Trop. Ecol. 6: 421–431.
———. 1994. Vertical stratification of fruit bats (Pteropodidae) in lowland dipterocarp rainforest in Malaysa. J. Trop.Ecol. 10: 523–530.
GASTON, K. J. 1996. Species richness: measure and measurement. In K. J. Gaston (Ed.). Biodiversity: a biology ofnumbers and difference, pp. 77–113. Blackwell Science, Oxford, England.
GLASS, B. P., AND C. DA ENCARNACAO. 1982. On the bats of western Minas Gerais, Brasil. Occas. Pap. Mus. Tex. TechUniv. 79: 1–3.
GRELLE, C. E. V. 2002. Is higher taxon analysis an useful surrogate of species richness in studies of Neotropicalmammal diversity? Biol. Conserv. 108: 101–106.
———, M. T. FONSECA, R. T. MOURA, AND L. M. AGUIAR. 1997. Bats from karstic area on Lagoa Santa, MinasGerais, a preliminary survey. Chiropt. Neotrop. 3: 68–70.
HANDLEY, C. O., JR. 1967. Bats of the canopy of an Amazonian forest. In H. Lent (Ed.). Atas do Simposio sobre aBiota Amazonica, vol. 5, pp. 211–221. Conselho Nacional de Pesquisas, Rio de Janeiro, RJ, Brasil.
KALKO, E. K. V. 1998. Organization and diversity of tropical bat communities through space and time. Zoology 101:281–297.
———, C. O. HANDLEY JR., AND D. HANDLEY. 1996. Organization, diversity, and long-term dynamics of a Neotropicalbat community. In M. L. Cody and J. A. Smallwood (Eds.). Long-term studies of vertebrate communities,pp. 503–553. Academic Press, New York, New York.
KUNZ, T. H. 1982. Ecology of bats. Plenum Press, New York, New York.———, AND A. KURTA. 1988. Capture methods and holding device. In T. H. Kunz (Ed.). Ecological and behavioral
methods for the study of bats, pp. 1–29. Smithsonian Institution Press, Washington, DC.
286 Bergallo, Esberard, Mello, Lins, Mangolin, Melo, and Baptista
MARINHO-FILHO, J. M. 1985. Padroes de atividade e utilizacao de recursos alimentares por seis especies de morcegosfilostomıdeos na Serra do Japi. M.Sc. thesis. Universidade de Campinas, Campinas, CP, Brasil.
———, AND I. SAZIMA. 2000. Brazilian bats and conservation biology: a first survey. In T. H. Kunz and P. A. Racey(Eds.). Bats: Phylogeny, morphology, echolocation and conservation biology. Smithsonian Institution Press,Washington, D.C.
MELLO, M. A. R. 2002. Interacoes entre o morcego Carollia perspicillata (Phyllostomidae) e plantas do genero Piper(Piperaceae) em uma area de Mata Atlantica. M.Sc. thesis. Universidade do Estado do Rio de Janeiro, Rio deJaneiro, RJ, Brasil.
MELO, G. G. S. 2001. Padroes ecologicos de uma comunidade de morcegos em area de Mata Atlantica da Ilha Grande,RJ. Bachelor Monograph, Universidade do Estado do Rio de Janeiro, Rio de Janeiro, RJ, Brasil.
MORRISON, D. W. 1978. Lunar phobia in a Neotropical fruit bat Artibeus jamaicensis (Chiroptera: Phyllostomidae).Anim. Behav. 26: 852–855.
———. 1980. Foraging and day-roosting dynamics of canopy fruit bats in Panama. J. Mammal. 61: 20–29.MYERS, N., R. A. MITTERMEIER, C. G. MITTERMEIER, G. A. B. FONSECA, AND J. KENT. 2000. Biodiversity hotspots for
conservation priorities. Nature 403: 853–858.PEDRO, W. A. 1992. Estrutura de uma taxocenose de morcegos da Reserva do Panga (Uberlandia, MG), com enfase
nas relacoes troficas em Phyllostomidae (Mammalia: Chiroptera). M.Sc. thesis. Universidade de Campinas,Campinas, CP, Brasil.
———. 1998. Diversidade de morcegos em habitats florestais fragmentados do Brasil. Ph.D. dissertation. UniversidadeFederal de Sao Carlos, Sao Carlos, SP, Brasil.
———, M. P. GERALDES, G. G. LOPEZ, AND C. J. R. ALHO. 1995. Fragmentacao de habitat e a estrutura de umataxocenose de morcegos em Sao Paulo (Brasil). Chiropt. Neotrop. 1: 4–6.
PERACCHI, A. L., AND S. T. ALBUQUERQUE. 1993. Quiropteros do Municıpio de Linhares, Espırito Santo, Brasil (Mam-malia, Chiroptera). Rev. Bras. Biol. 53: 575–581.
REIS, N. R., A. L. PERACCHI, M. F. MULLER, E. A. BASTOS, AND E. S. SOARES. 1995. Quiropteros do Parque Estadualdo Morro do Diabo, Sao Paulo, Brasil (Mammalia: Chiroptera). Rev. Bras. Biol. 56: 87–92.
REIS, S. F. 1980. Biologia reprodutiva de Artibeus lituratus (Olfers, 1818) (Chiroptera; Phyllostomidae). M.Sc. thesis.Universidade Federal do Rio de Janeiro, Rio de Janeiro, RJ, Brasil.
REMSEN, J. V. 1994. Use and misuse of birdlists in community ecology and conservation. Auk 111: 225–227.SCHULZE, M. D., N. E. SEAVY, AND D. F. WHITACRE. 2000. A comparison of the phyllostomid bat assemblages in
undisturbed Neotropical forest and in forest fragments of a slash-and-burn farming mosaic in Peten, Guate-mala. Biotropica 32: 174–184.
SILVA, H. G., AND R. A. MEDELLIN. 2001. Evaluating completeness of species lists for conservation and macroecology:a case study of Mexican land birds. Conserv. Biol. 15: 1384–1395.
TADDEI, V. A., AND W. PEDRO. 1996. Morcegos (Chiroptera: Mammalia) do Vale do Ribeira, Estado de Sao Paulo:diversidade de especies. In J. E. Santos (Ed.). Anais do VIII Seminario Regional de Ecologia, pp. 911–919.Programa de Pos-Graduacao Ecologia e Recursos Naturais, Universidade Federal de Sao Carlos, Sao Carlos,SP, Brasil.
TAVARES, V. 1999. Morfologia do voo, dieta e composicao de comunidade no Parque do Rio Doce, Sudeste do Brasil.M.Sc. thesis. Universidade Federal de Minas Gerais, Minas Gerais, MG, Brasil.
TUTTLE, M. D. 1974. Unusual drinking behavior of some stenodermatinae bats. Mammalia 38: 141–145.———. 1976. Collecting techniques. Spec. Pub. Mus. Tex. Tech Univ. 10: 71–88.VOSS, R. S., AND L. H. EMMONS. 1996. Mammalian diversity in Neotropical lowland rainforests: a preliminary as-
sessment. Bull. Am. Mus. Nat. Hist. 230: 1–115.WILKINSON, L. 1997. Systat 7.0. Statistics. Prentice Hall, Upper Saddle River, New Jersey.WILSON, D. E., C. F. ASCORRA, AND S. SOLARI. 1996. Bats as indicators of habitat disturbance. In D. E. Wilson and
A. Sandoval (Eds.). Manu: the biodiversity of southeastern Peru, pp. 613–626. Smithsonian Institution Press,Washington, D.C.
Minimum Bat Sampling Effort in Atlantic Forest 287
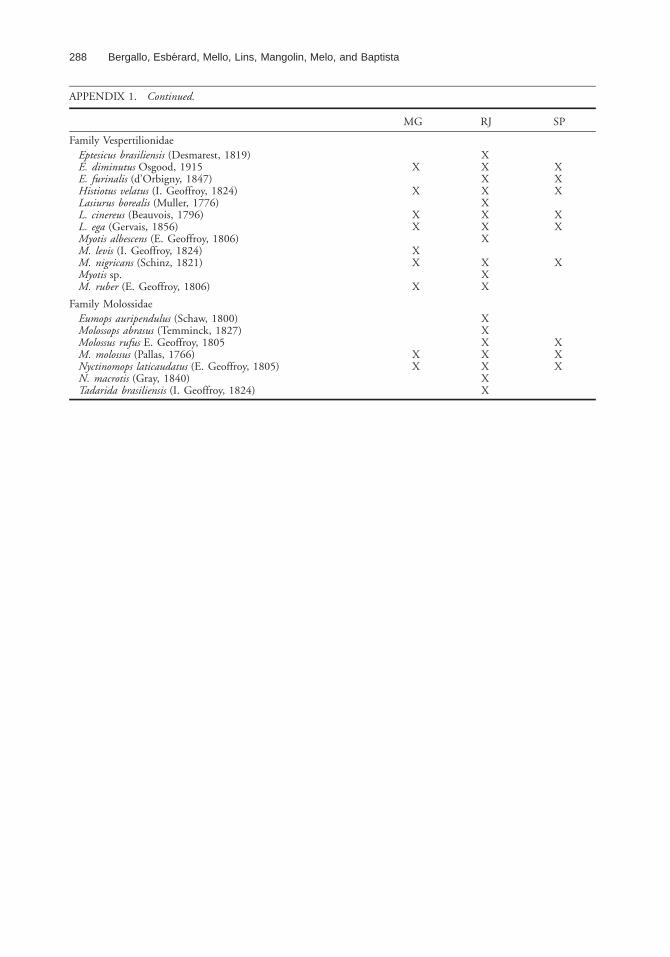
APPENDIX 1. Species of bats recorded in Atlantic Forest areas of southeastern Brazil (MG: Minas Gerais; RJ: Rio deJaneiro; SP: Sao Paulo).
Platyrrhinus lineatus (E. Geoffroy, 1810)P. recifinus (Thomas, 1901)Pygoderma bilabiatum (Wagner, 1843)Sturnira lilium (E. Geoffroy, 1810)S. tildae de la Torre, 1959