T +64 4 499 6830 F +64 4 974 5218 E [email protected]Level 12, 1 Willeston Street Wellington 6011, New Zealand PO Box 5963 Lambton Quay Wellington 6145, New Zealand www.bathurstresources.co.nz 30 October 2015 Market Announcements Australian Securities Exchange Level 4, 20 Bridge Street Sydney NSW 2000 Bathurst Resources Limited Annual Report The Board of Bathurst Resources Limited (ASX: BRL “Bathurst”) is pleased to enclose the Annual Report for 2015. This is now available on the company’s website. Yours sincerely Bathurst Resources Limited Bill Lyne Company Secretary For personal use only
Level 12, 1 Willeston Street Wellington 6011, New Zealand PO Box 5963 Lambton Quay Wellington 6145, New Zealand
www.bathurstresources.co.nz
30 October 2015 Market Announcements Australian Securities Exchange Level 4, 20 Bridge Street Sydney NSW 2000
Bathurst Resources Limited
Annual Report
The Board of Bathurst Resources Limited (ASX: BRL “Bathurst”) is pleased to enclose the Annual Report for 2015. This is now available on the company’s website. Yours sincerely Bathurst Resources Limited
Annual General Meeting of ShareholdersTo be held at 9.00am on Monday 23 November 2015at the offices of Minter Ellison Rudd Watts,125 The Terrace, Wellington 6011.
All dollar amounts referred to in this report are expressed in New Zealand dollars unless otherwise noted.
In my first year as chairman it has been a time of significant change for Bathurst as the company completed the period with virtually a whole new board and a new direction – to pursue a strategy of diversifying risk and to maintain a cash positive business based on our robust domestic operations in the South Island.
We have implemented a series of tough measures in the interest of cost efficiencies that have seen us finish the period with a cash positive quarter – a commendable achievement during a year that witnessed record lows in commodity prices.
I’m also very pleased to report that we have completed another year without a single significant health or environmental incident at any of our sites. Safety is paramount to everything we do at Bathurst, from planning and organisational activities through to every aspect of our operations. We foster a culture in which safety is the responsibility of every individual involved with any aspect of Bathurst’s operations, from board level through to employees and contractors, and anyone else who is engaged in any element of the company’s business.
As we complete the transition from explorer to producer on the Australian Securities Exchange (ASX), we are moving forward with a focus on margins, not coal price, to ensure that we continue to be financially sustainable and ready to accelerate the development of our export coking coal project at a time that complements our overall business strategy, rather than relying on global pricing.
Whilst the company has reported an annual net loss after tax for the year, it is particularly pleasing to see that our key business efficiency initiatives are having a real impact on the bottom line. This is demonstrated by the company reporting a positive cash flow from operations of $1 million in FY15 compared with an operating cash outflow of $16.7 million for the same period last year.
On behalf of the board I would like to thank our management team and staff for their commitment and efforts during what has been a tough but productive year. I would also like to acknowledge those directors who resigned during the period, and to welcome our new directors – Richard Tacon, who has also taken over as chief executive officer, Russell Middleton and Peter Westerhuis. They bring extensive business and leadership experience to the board, and to the company.
Finally I would like to thank our shareholders and many stakeholders for their ongoing support and look forward to a profitable year ahead.
I’m pleased to present this report – my first as chief executive officer for Bathurst.
First, and foremost, we are proud to
have recorded another year with no
significant injuries or environmental
incidents reported. Safe and
sustainable operations are core
Bathurst values and fundamental to
the way we conduct our business.
During the year we undertook
extensive training for our people in risk
management and health and safety
to ensure that we are in compliance
with the new Health and Safety in Employment Act that will come into
force in early 2016.
For Bathurst, this has been a year of
review, with restructures across the
company from board level down, and
the implementation of a strategy aimed
at mitigating risk and driving cost
efficiencies to strengthen our cash
balance. Our strategy is to continue to
reduce operating costs, to increase
production and to focus on achieving
sustainable margins from all our
operations. This is something we can
control to a large extent, as opposed
to focusing on global coal pricing over
which we can have little impact.
We have already seen the results of
this with a cash positive final quarter,
a reduction in mining overheads from
FY14 of 40%, and a reduction in
administration overheads from FY14
of 17%. Production for the year
exceeded forecast at 384,000 tonnes,
and we are projecting a further 17%
increase in production in the
coming year.
During the past 18 months we have
reduced employee numbers, but these
were mainly corporate and project
related roles; we were able to maintain
the workforce at the face so we can
continue to build our domestic
operations. Late last year we took over
the full mining operations at Takitimu
from the existing contractor. This was
a smooth transition whereby we took
on the contractor’s site staff and hired
the necessary plant. We will continue
to review this operation to determine if
there are more efficiencies to be
gained, particularly in plant and
equipment leasing.
We recovered first coal at Escarpment
in September 2014 and, while we
have announced that we won’t be
taking that project into full commercial
development in the immediate future,
we have made significant inroads in
terms of site development so we can
quickly ramp up to steady state mining
when all costs align to provide an
acceptable margin.
At our Canterbury mine, we resumed
operations following a review of the
coal processing operations. We are
on track to produce 60,000 tonnes of coal from Canterbury in FY16.
We reviewed our permit holdings and surrendered those considered non-essential for our immediate growth based on the development requirements identified in our strategic plan. This will see significant savings in compliance costs for the company.
At a corporate level, we reduced our board numbers and delisted from the NZX to achieve further cost efficiencies.
Our focus for the coming year is on lowering costs, implementing further operational efficiencies and increasing margins.
I take this opportunity to thank the Bathurst team for their hard work and support throughout a challenging time and look forward to a safe and profitable year ahead.
RICHARD TACON Chief Executive Officer
5
For
per
sona
l use
onl
y
Review of operations
Bathurst is a New Zealand resources company. Its operations are in the South Island of New Zealand where it is established as a leading coal producer, providing energy for local industrial users and, ultimately, positioning to become an exporter of high quality metallurgical coal for steel production in Japan, India and Asia.
Whilst listed on the Australian Securities Exchange, Bathurst is a New Zealand registered company, employing more than 100 staff across its operations. The company’s head office is in Wellington. Bathurst has no operations outside New Zealand.
Buller Coal ProjectThe Buller coalfield is situated on the west coast of the South Island of New Zealand. It is regarded as one of the country’s most significant fields and is particularly well known for its production of high quality, low ash and high fluidity coking coals, which are highly sought after by international steelmakers.
Bathurst is developing an export coking coal operation from its permits in the Buller coalfield. The key first stage of this project is the Escarpment mine, which is now in operation mining
Whareatea West and CoalbrookdaleThe next focus for development in
South Buller is the Whareatea West
block which is located immediately
adjacent to the Escarpment permit’s
western boundary. Whareatea West is
an Exploration Permit. The main work
completed over the last 12 months
was to assess and model the vast
amount of data collected in the
previous five years. This had led to
a consolidated view of the Denniston
area rather than three discrete
blocks. This work is presently at
a pre-feasibility stage for the final
integrated plan.
Coalbrookdale is fully consented
for underground mining. Development
is not planned however until market
conditions improve.
North BullerThe North Buller permits lie north of
the Stockton Plateau. Preliminary
analysis indicates that the low ash,
higher sulphur coal from this area can
be blended with South Buller coal to
produce a premium product, so they
will remain as the second stage of
development of the export project.
Domestic operations
TakitimuThe Takitimu mine is located at
Nightcaps, north of Invercargill. Mining
operations originally commenced at
Nightcaps in 1881. Sub-bituminous
coal from the open cut operation is
railed to a number of major industrial
customers in the Southland, Otago
and Canterbury areas. The mine
produces around 230,000 tonnes
of sub-bituminous coal per annum.
During the year, the coal resource in
the Takitimu pit was depleted and the
adjoining Coaldale block became the
focus of operations. The Takitimu pit is
now being progressively backfilled and
rehabilitated to pasture land.
Work was undertaken in 2014 to
upgrade the processing facilities on
site. These improvements have allowed
for increased production and reduced
fines’ generation.
Mining operations at Takitimu were
previously conducted by a contractor
however, in September 2014, Bathurst
took over full mining operations on site
and employed all the existing site staff.
The transition was seamless and
enabled the company to implement
better cost control over the mining
operations at its largest site.
New BrightonIn March 2015, the company
completed the acquisition of the
shares in New Brighton Collieries
Limited, holder of the New Brighton
coal exploration permit. This permit is
in close proximity to the Takitimu mine
and is connected by the same rail line.
It is prospective for high grade
sub-bituminous coal and has potential
to add substantially to the life of the
company’s Southland operations.
The acquisition was finalised under
amended terms which saw an ongoing
deferred consideration replacing the
final payment of $13.25 million,
preserving the company’s cash
reserves. The coal from New Brighton
will be sold into new and existing
domestic contracts and may be
considered for export at a later date.
Black Diamond
Subsequent to period, end an offer
was made to purchase the land
immediately northwest of the Coaldale
block – an area known as Black
Diamond. The area is prospective for
high quality sub-bituminous coal and is
the natural extension of Takitimu’s
Coaldale operations.
Mine planning is targeting first coal
recovery from Black Diamond in the
final quarter of 2017, to coincide with
the depletion of the Coaldale block.
Initial environmental consents have
been lodged and an application will
be submitted to extend the Takitimu
mining permit to include Black
Diamond. This acquisition will
further underpin the development
of Bathurst’s domestic coal strategy
in Southland.
Canterbury
The Canterbury mine is an open
cast mine near Coalgate which is
70 kilometres west of Christchurch.
The mine produces thermal coal which
is low in sulphur and ash and in high
demand by the local dairy and food
processing industries. It has a similar
specification to the Takitimu coal.
Bathurst has a contract to supply coal
from the Canterbury mine to a nearby
dairy processing plant.
7
For
per
sona
l use
onl
y
Coal demand in the Canterbury area is
set to grow to over 150,000 tonnes
per annum in the short term with the
expansion of the local food and dairy
processing industries. The proximity
of the mine to these markets offers a
distinct freight advantage to target this
growth potential.
Full mining operations at Canterbury
were suspended in 2014 to allow the
processing operations to be reviewed
and upgraded. New plant was installed
and mining operations resumed in the
March FY15 quarter.
Production from the mine is expected
to grow from around 35,000 tonnes
per annum to 60,000 tonnes in the
coming year and more than 75,000
tonnes by FY17.
Albury
The Albury project, located 40
kilometres west of Timaru, was an
historic underground and open cut
mine worked from the early 1900s
through to the mid-1960’s. The mine
produced low rank sub-bituminous coal for local sales. An initial programme of low impact exploration delivered encouraging results and a bulk sample was taken for trials to assess the suitability of the coal for energy production for local industry. The trials were positive but further exploration and development have been deferred for the current time.
ExplorationExploration was again scaled back during the financial year. A total of 1,003 metres was drilled and excavated with the focus on South Buller and Nightcaps.
Two rigs were operating in the Buller Coal Project areas. At Cascade, 15 holes were drilled in the pit to assist with operational short term mine planning and to obtain samples for coal quality analysis. A further 54 holes were drilled across the South Buller permits for resource definition and waste rock characterisation and to provide marketing samples. A
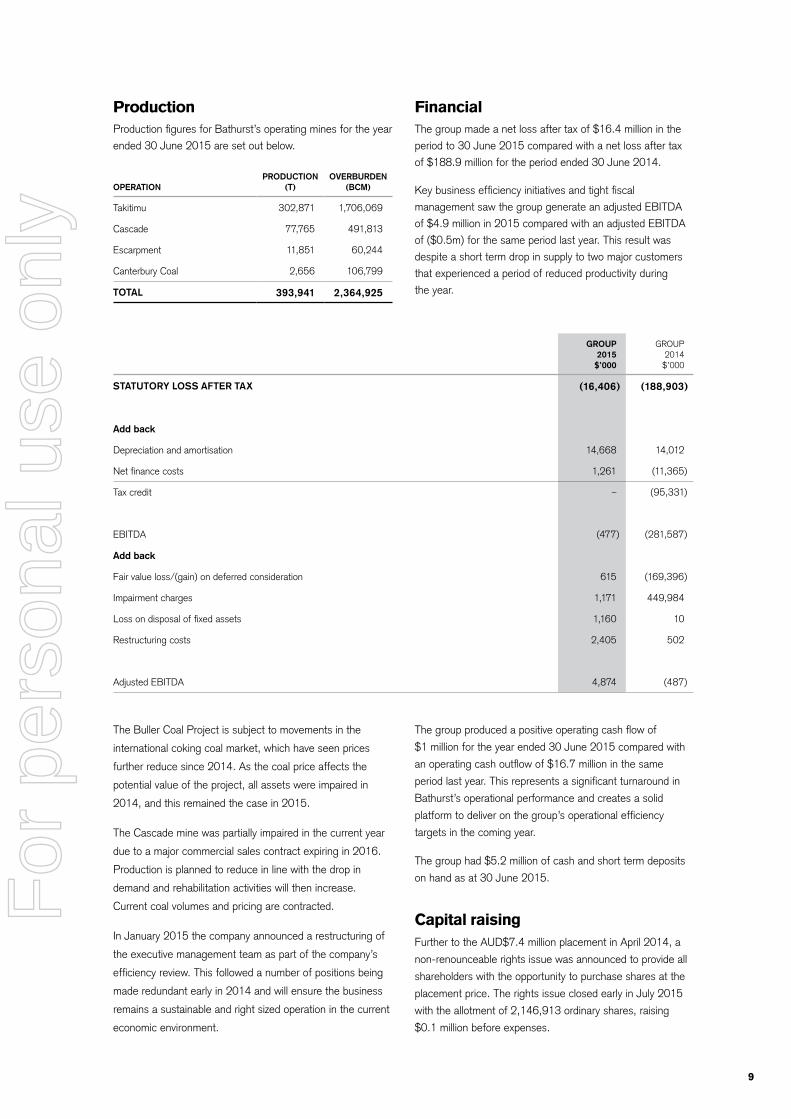
Production Production figures for Bathurst’s operating mines for the year ended 30 June 2015 are set out below.
OPERATIONPRODUCTION
(T)OVERBURDEN
(BCM)
Takitimu 302,871 1,706,069
Cascade 77,765 491,813
Escarpment 11,851 60,244
Canterbury Coal 2,656 106,799
TOTAL 393,941 2,364,925
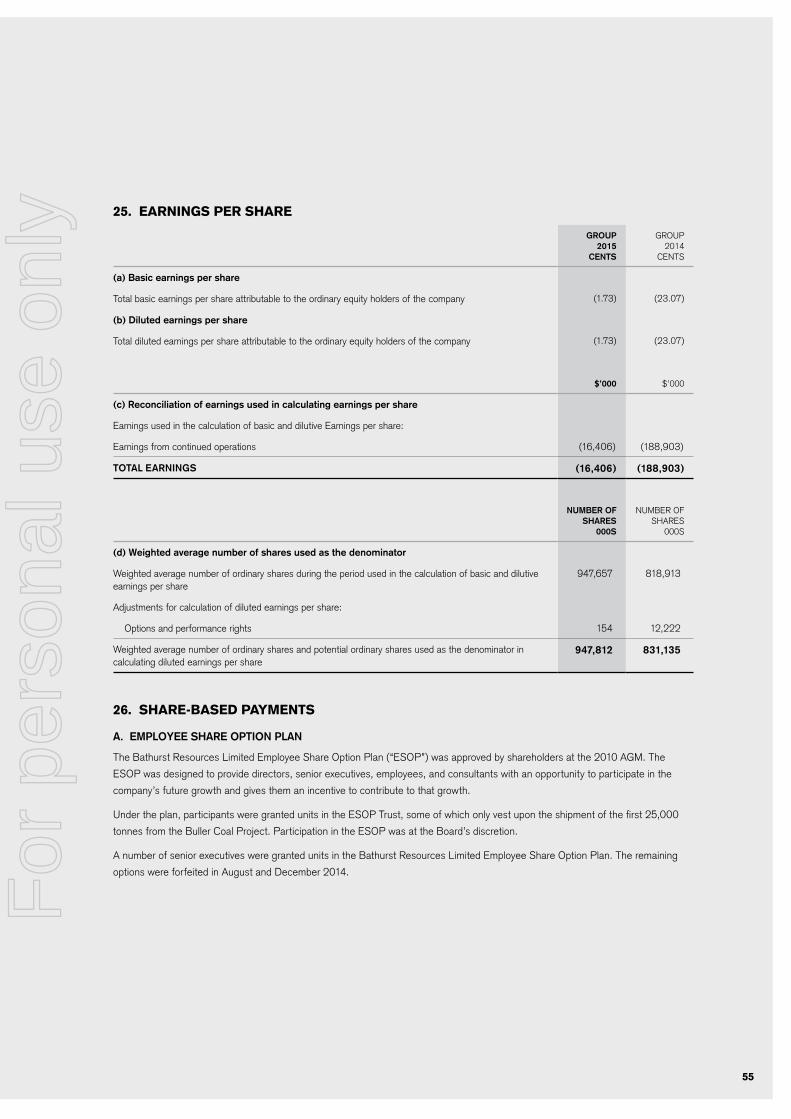
Financial The group made a net loss after tax of $16.4 million in the period to 30 June 2015 compared with a net loss after tax of $188.9 million for the period ended 30 June 2014.
Key business efficiency initiatives and tight fiscal management saw the group generate an adjusted EBITDA of $4.9 million in 2015 compared with an adjusted EBITDA of ($0.5m) for the same period last year. This result was despite a short term drop in supply to two major customers that experienced a period of reduced productivity during the year.
GROUP2015
$’000
GROUP2014
$’000
STATUTORY LOSS AFTER TAX (16,406) (188,903)
Add back
Depreciation and amortisation 14,668 14,012
Net finance costs 1,261 (11,365)
Tax credit – (95,331)
EBITDA (477) (281,587)
Add back
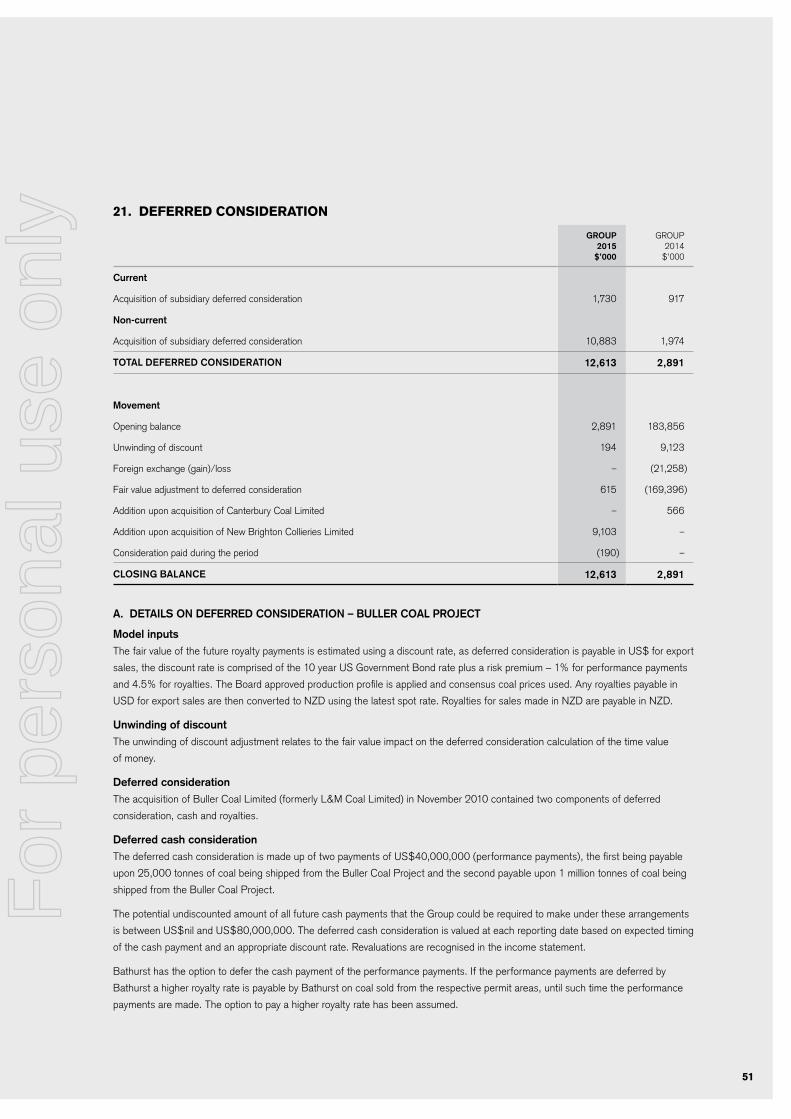
Fair value loss/(gain) on deferred consideration 615 (169,396)
Impairment charges 1,171 449,984
Loss on disposal of fixed assets 1,160 10
Restructuring costs 2,405 502
Adjusted EBITDA 4,874 (487)
The Buller Coal Project is subject to movements in the
international coking coal market, which have seen prices
further reduce since 2014. As the coal price affects the
potential value of the project, all assets were impaired in
2014, and this remained the case in 2015.
The Cascade mine was partially impaired in the current year
due to a major commercial sales contract expiring in 2016.
Production is planned to reduce in line with the drop in
demand and rehabilitation activities will then increase.
Current coal volumes and pricing are contracted.
In January 2015 the company announced a restructuring of
the executive management team as part of the company’s
efficiency review. This followed a number of positions being
made redundant early in 2014 and will ensure the business
remains a sustainable and right sized operation in the current
economic environment.
The group produced a positive operating cash flow of
$1 million for the year ended 30 June 2015 compared with
an operating cash outflow of $16.7 million in the same
period last year. This represents a significant turnaround in
Bathurst’s operational performance and creates a solid
platform to deliver on the group’s operational efficiency
targets in the coming year.
The group had $5.2 million of cash and short term deposits
on hand as at 30 June 2015.
Capital raisingFurther to the AUD$7.4 million placement in April 2014, a
non-renounceable rights issue was announced to provide all
shareholders with the opportunity to purchase shares at the
placement price. The rights issue closed early in July 2015
with the allotment of 2,146,913 ordinary shares, raising
$0.1 million before expenses.
9
For
per
sona
l use
onl
y
Sustainability
Responsible resource use is the principle that drives all of Bathurst’s activities.
This principle applies to the company’s approach to sustainable development and the management of social, environmental and economic performance.
This means that everything the company does is guided by a commitment to shareholders, employees, stakeholders, local communities and, importantly, the environment.
Bathurst’s commitment is backed by a significant investment in resources to ensure social and environmental impacts are managed from design and planning through to production and, eventually, rehabilitation. The company is constantly looking to improve productivity in ways that are better for the environment and safer for our people.
During 2015, the company made significant progress in the review and upgrade of information technology practices to eliminate a reliance on legacy systems and to support sustainable management reporting and effective decision making.
Every year, the public focus on environmental issues deepens, and the decisions people make as custodians of the world’s scarce resources grow increasingly important. At the same time the issues of local employment and regional economic development gain importance. The ultimate aim is to ensure Bathurst’s operations enable society to meet its present needs without compromising the ability of future generations to meet their needs. The company engages with stakeholders on climate change issues through relevant industry associations such as Straterra, the industry body for the New Zealand minerals sector, and New Zealand’s Sustainable Business Council. As members of these organisations Bathurst is able to interact with other companies, various stakeholders and government to develop simple and effective climate change policy and regulation.
Craig PilcherGeneral Manager – Domestic OperationsCraig has extensive engineering experience with both coal and oil fired steam boiler installations and maintenance, as well as refrigeration, marine, plant maintenance and general engineering.
Born in South Canterbury, Craig’s first career was as an A-grade fitter and welder, undertaking regular coal and oil steam boiler installations. After working as plant engineer and construction diver at the Port of Timaru, Craig became owner and director of a South Island coal supply business in 1997, distributing coal for Solid Energy in the area.
The business was bought by Eastern Corporation in 2006, and Craig joined the company as marketing manager and then operations manager, playing a key role in the establishment and growth of the Takitimu and Cascade coal mines.
Craig joined Bathurst in March 2011. He is based in Timaru at Bathurst’s coal handling and distribution centre.
Jason HungerfordGroup Financial ControllerJason joined the Bathurst team in 2013 following the relocation of its head office to Wellington. He began his career as a chartered accountant with KPMG in Wellington prior to spending a number of years in the United Kingdom. Jason has broad sector experience across the resources, FMCG and financial services sectors, having worked in senior finance roles at Anglo American, Cadbury and Kiwibank. Jason brings a commercial outlook to the business underpinned by a strong focus on risk, governance and financial control. He holds a Bachelor of Commerce and Administration with a post graduate Diploma in Professional Accounting. Jason is a member of Chartered Accountants Australia & New Zealand.
13
For
per
sona
l use
onl
y
Fiona BartierGeneral Manager – Health, Safety Environment and CommunityFiona is an environmental and resource scientist who has
worked in management roles for government, in research
and education, for industry groups, and for a range of
mining companies.
Fiona spent seven years working in mining environmental
research at The University of Queensland and the University
of New England, where she visited and worked at more than
40 mine sites across a range of commodities. She then
spent a period of time working for the Minerals Council
of Australia.
Before joining Bathurst, Fiona lived for ten years in mining
communities in the Hunter Valley and western coalfields of
New South Wales, working first as a consultant, and then
within industry. She has management experience in open
cut and underground operations, and brownfield and
greenfield projects.
Fiona holds a Bachelor of Applied Science (Resource
Science). She joined Bathurst in 2012 and is based in the
Wellington office.
Sam AaronsGeneral Manager – Corporate RelationsSam’s background is advertising, marketing and commercial
management. She worked with several major advertising
agencies in Melbourne before spending 14 years as a
divisional general manager for Henry Walker Eltin, a large
civil and mining contracting company (now Leighton
Contractors) based initially in Darwin and then in Brisbane.
During this period she also served with the Royal Australian
Navy Reserves as public relations officer for the Darwin
Port Division.
Sam joined Eastern Resources Group in Brisbane as
manager of corporate relations and business development,
a position she held for eight years. Her role with Eastern
focused on growing the company’s mining operations in
New Zealand, developing existing tenements and sourcing
new projects.
Sam joined the Bathurst team following its acquisition of the
Eastern assets and relocated to Wellington in 2011.
Hamish McLauchlan General Manager – ExplorationHamish is a geologist with more than 20 years’ experience
and a diverse knowledge of exploration, open cast mining,
geological modelling and geotechnical engineering. Hamish
was previously senior geologist at Solid Energy’s Stockton
mine and has also worked extensively as an exploration and
production geologist in the resources sector in New Zealand
and offshore. Hamish holds a Master of Science with
Honours in Engineering Geology and a Bachelor of Science
majoring in Geology. He is also a member of the AusIMM.
Hamish joined Bathurst when the Eastern assets were
acquired on March 2011 and is based in the company’s
Westport office.
Alison BrownGeneral CounselAlison has over 30 years’ legal experience in private
law practices and as in-house counsel for commercial
enterprises. She has specialised in mining, environmental
and climate change law after a solid grounding in commercial
law. She has worked variously for Simpson Grierson, Minter
Ellison Rudd Watts Lawyers and the Ministery of Foreign
Affairs and Trade, taught law professionals, as well as being
general counsel for Solid Energy from 2000 to 2011. Alison
Your directors present their report on the consolidated entity (the group) consisting of Bathurst Resources Limited (Bathurst) and the entities it controlled at the end of, or during, the year ended 30 June 2015.
DirectorsThe following persons were directors of Bathurst Resources
Limited as at 30 June 2015.
Toko Kapea Non-executive Chairman
Richard Tacon Executive Director
Russell Middleton Non-executive Director
Peter Westerhuis Non-executive Director
The following board members resigned during the period:
Malcolm Macpherson resigned on 29 May 2015 as
non-executive chairman, Hamish Bohannan resigned on
24 March 2015 as managing director, Dave Frow resigned
on 13 November 2014 as non-executive chairman and
Rob Lord resigned on 13 November 2014 as non-executive
director. Marshall Maine resigned as joint company secretary
on 13 November 2014 and Graham Anderson resigned as
joint company secretary on 25 May 2015.
Principal activitiesDuring the year the principal continuing activities of the group
consisted of:
• The production of coal in New Zealand, and
• The exploration and development of coal mining assets in
New Zealand.
From left to right: Toko Kapea, Peter Westerhuis, Richard Tacon, Russell Middleton.
15
For
per
sona
l use
onl
y
DividendsNo dividend was paid or declared during the current or prior financial year and the directors do not recommend the payment of a dividend.
Environmental regulationThe Bathurst group’s exploration and mining activities are subject to a range of environmental regulations which govern how the group carries out its business. These regulations are set out below.
Mine development/mining activitiesThe mining activities of the group are regulated by the following:• The resource consents granted by the relevant district
and regional territorial authorities, after following the processes set out in the Resource Management Act 1991.
• Mining permits issued under the Crown Minerals Act 1991 by the Minister of Energy and Resources, required to mine Crown coal.
• Access arrangements, granted under the Crown Minerals Act 1991 with the relevant landowners and occupiers. For Crown-owned land managed by the Department of Conservation, these access arrangements are granted by the Minister of Conservation. For significant projects, there will be a concurrent granting with the Minister of Conservation and the Minister of Energy and Resources.
• Concession agreements under the Conservation Act 1987 for land outside a permit area but owned by the Crown and managed by the Department of Conservation.
• Wildlife authorities, issued under the Wildlife Act 1953 granted by the Minister of Conservation.
Controls around water and air discharges that result from mining operations are governed by the conditions of the resource consents under which the particular mining activity is operating. The mining operations of Bathurst are inspected
on a regular basis and no significant instances of non-compliance have been noted.
To the best of the directors’ knowledge, all approved activities have been undertaken in compliance with the requirements of the Resource Management Act 1991, Crown Minerals Act 1991, Conservation Act 1987 and Wildlife Act 1953.
Exploration activitiesTo carry out exploration, the company needs to hold a relevant exploration permit (where the coal is Crown owned), relevant resource consents to permit exploration and an access arrangement with the relevant landowner. Bathurst holds, to the best of the directors’ knowledge, all relevant resource consents and has entered into all of the appropriate agreements, and has acted in accordance with those resource consents and agreements in regards to engaging in exploration activities.
Hazardous substancesMining activities involve the storage and use of hazardous substances, including fuel. Bathurst must comply with the Hazardous Substances and New Organisms Act 1996 when handling hazardous materials. To the best of the directors’ knowledge, no instances of non-compliance have been noted.
Emissions trading schemeThe New Zealand Emissions Trading Scheme came into effect on 1 July 2010, which essentially makes Bathurst liable for greenhouse gas emissions associated with the coal it mines and sells in New Zealand and for the fugitive emissions of methane associated with that mined coal. Bathurst’s liability is based on the type and quantity of coal tonnes sold, with the cost of such being passed on to Bathurst’s customers. Bathurst’s Emissions Trading Policy can be found on the company’s website.
Bathurst’s Corporate Governance Statement is available on the company’s website: www.bathurstresources.co.nz/who-we-are/corporate-governance.
Information on directors
Mr Toko Kapea BA, LLB Non-executive Chairman
Experience and expertiseMr Kapea is a Wellington based commercial lawyer, consultant and director.
He is a director of Tuia Group Limited and a partner in Tuia Legal. He has worked at Chapman Tripp and in legal roles in-house at Meridian Energy, Bank of New Zealand, St. George Bank NZ and ANZ Bank.
Mr Kapea also sits on the board of Ng-ati Apa Developments Limited (Wanganui-Rangitikei region). Ng-ati Apa has investments in commercial property, forestry land and farms.
He is an independent committee member of the Banjima Direct Benefits Trust in Perth, Western Australia. The role involves developing funding and distribution policies for royalty payments from mining companies for the Banjima people in the Pilbara region.
Mr Kapea has been a director of Parininihi ki Waitotara Incorporation (in Taranaki) and Port Nicholson Fisheries Limited. He was on the Government Review Panel relating to the Te Ture Whenua M-aori Act 1993 (M-aori Land Act) and was also the lead negotiator for Ng-ati Apa ki Rangitikei (North Island) for its direct negotiation Treaty of Waitangi claims with the Crown.
Mr Kapea was appointed to the board of Bathurst as non-executive director in May 2013 and became chairman in May 2015.
Other current directorships of listed companiesNil
Former directorships in last three years of listed companiesNil
Special responsibilitiesChairman of the Remuneration and Nomination committeeMember of the Audit and Risk committee
Interests in shares and options115,000 fully paid ordinary shares in Bathurst Resources Limited
Mr Richard Tacon Executive Director
Experience and expertiseMr Tacon has worked in a large number of roles across the coal mining industry. His first job was at Greymouth’s Liverpool State Mine, owned by the New Zealand Government. He moved to Australia to further his mining career and went on to hold several management roles in coal mines around Australia, working his way from undermanager to general manager. Mr Tacon has held senior leadership roles in the coal sector for the past decade.
Mr Tacon holds first, second and third class coal mining qualifications and studied at the Otago School of Mines. He has spent 15 years as a mines rescue brigadesman, making him familiar with the principles and practice of mine safety. Mr Tacon has also completed the New Zealand Mine Incident Controller training.
Mr Tacon is an ex-secretary for the Mine Managers Association of Australia and sits on the board of the New Zealand Mines Rescue Trust and Minerals West Coast.
After living and working in Australia for 32 years, he returned to New Zealand to take up the position of chief operating
17
For
per
sona
l use
onl
y
officer with Bathurst in 2012. He was appointed to the role of chief executive officer in March 2015 and was appointed to the board as executive director in April 2015.
Other current directorships of listed companiesNil
Former directorships in last three years of listed companiesNil
Special responsibilitiesChief Executive OfficerMember of the Health, Safety, Environment and Community committee
Interests in shares and options476,596 fully paid ordinary shares in Bathurst Resources Limited
Mr Russell Middleton MBA, BBus Non-executive Director
Experience and expertiseMr Middleton has more than 25 years experience in the mining and construction sectors with significant experience in mine project evaluations and the construction of new mines.
Based in Sydney, he was most recently chief financial officer with Hillgrove Resources Limited, an ASX listed resources company focused on developing base and precious metals projects. He was also director and company secretary for the Hillgrove Group’s subsidiary companies.
Starting his career as a public accountant, Mr Middleton has held senior management positions in accounting, commercial and planning roles. He undertook various roles with BHP before joining Shell where he was commercial manager for the construction, development and production of a major underground mine.
Mr Middleton was appointed to the board in April 2015.
Other current directorships of listed companiesNil
Former directorships in last three years of listed companiesNil
Special responsibilitiesChairman of the Audit and Risk committee
Interests in shares and options750,000 fully paid ordinary shares in Bathurst Resources Limited
Peter Westerhuis MBA, BEng Non-executive Director
Experience and expertiseMr Westerhuis is a professional engineer with post graduate business qualifications and more than 30 years of Australian and international experience in the iron ore, gold and coal industries, the past seven years at CEO and MD level. He has successfully developed and managed large mining and processing operations including overseeing the transition from explorer to producer.
Mr Westerhuis has undertaken many complex commercial negotiations for joint ventures, capital funding, contracts, litigation, product marketing and off-take agreements.
He is particularly passionate about health and safety, teamwork, operational effectiveness, business improvement and project delivery.
Mr Westerhuis is currently consulting to resources companies in Africa and South America. More recently he was the group managing director of Guildford Coal, developer of a coking coal business in Mongolia, and the chief executive of the Ensham Joint Venture developing and operating large open cut and underground coal reserves in Queensland.
He has been a director of the Queensland Resources Council and a director of the Australian Coal Association.
Mr Westerhuis was appointed to the board as non-executive director in April 2015.
Other current directorships of listed companiesNil
Former directorships in last three years of listed companiesManaging Director – Guildford Coal LimitedFebruary 2013-October 2013
Special responsibilitiesChairman of the Health, Safety, Environment and Community committee Member of the Remuneration and Nomination committee
Interests in shares and optionsNil
Other current directorships of listed companiesNil
Former directorships in last three years of listed companies Nil
Company secretaryBill Lyne Mr Lyne has a wealth of experience in the role of company secretary of public companies ranging from stock exchange listed to small private companies and ‘not-for-profit’ entities.
He has operated his own business, Australian Company Secretary Service, since 1998, providing professional specialist company secretarial, corporate compliance, governance and administrative services to various clients in diverse businesses across a wide range of industries. He is currently company secretary of ASX-listed Orion Metals Limited and Jumbo Interactive Limited, of which he is also a director.
Mr Lyne holds a Bachelor of Commerce degree in Economics from the University of New South Wales, is a chartered accountant, and a Fellow of the Institute of Chartered Secretaries and Administrators (UK) and Governance Institute of Australia.
Mr Lyne was appointed company secretary in May 2015.
19
For
per
sona
l use
onl
y
Remuneration report
Role of the Remuneration and Nomination committeeThe Remuneration and Nomination committee (‘R&N committee’) is a subcommittee of the Bathurst board. The R&N committee is responsible for making recommendations to the board on remuneration matters such as non-executive director fees, executive remuneration for directors and other executives, and the over arching executive remuneration policy and incentive schemes.
The objective of the R&N committee is to ensure that the company’s remuneration policies and structures are fair and competitive, and aligned with the long term interests of the company. The R&N committee draws on its own experience in remuneration matters and seeks advice from independent remuneration consultants.
The Corporate Governance Statement provides further information on the role of the R&N committee.
Principles used to determine the nature and amount of remuneration
Non-executive directorsThe fees and payments the company makes to its non-executive directors reflect the level of responsibility attributed to board members and the demands that are made on the directors’ time. Non-executive directors’ fees and payments are reviewed annually by the board. The board has also considered the advice of independent remuneration consultants to ensure that non-executive directors’ fees and payments are appropriate and in line with industry standards. The fees paid to the chairman are determined independently of the fees of non-executive directors. The chairman is not present at any discussions relating to the determination of his own remuneration.
Directors’ feesNon-executive directors’ fees are determined within an aggregate directors’ fee pool limit, which is periodically recommended for approval by shareholders. The maximum currently stands at $1,000,000 per annum.
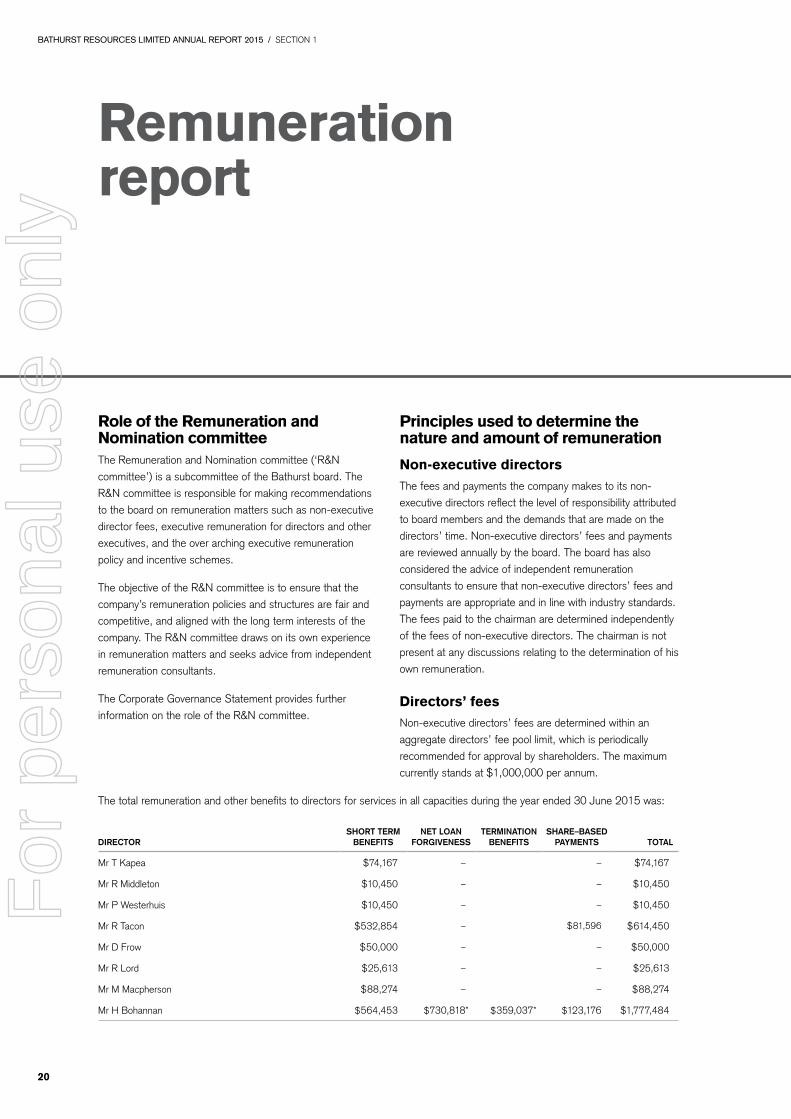
The total remuneration and other benefits to directors for services in all capacities during the year ended 30 June 2015 was:
DIRECTORSHORT TERM
BENEFITSNET LOAN
FORGIVENESSTERMINATION
BENEFITSSHARE–BASED
PAYMENTS TOTAL
Mr T Kapea $74,167 – – $74,167
Mr R Middleton $10,450 – – $10,450
Mr P Westerhuis $10,450 – – $10,450
Mr R Tacon $532,854 – $81,596 $614,450
Mr D Frow $50,000 – – $50,000
Mr R Lord $25,613 – – $25,613
Mr M Macpherson $88,274 – – $88,274
Mr H Bohannan $564,453 $730,818* $359,037* $123,176 $1,777,484
forgiveness or termination benefits. The termination
agreement included the forgiveness of amounts due to the
company, offset by severance entitlements due and accrued
at the time of resignation.
The following board members resigned during the period:
Malcolm Macpherson resigned on 29 May 2015, Hamish
Bohannan resigned on 24 March 2015, Dave Frow resigned
on 13 November 2014 and Rob Lord resigned on
13 November 2014.
Russell Middleton and Peter Westerhuis were appointed non-
executive directors on 29 April 2015.
Richard Tacon was appointed executive director on
1 April 2015.
Directors’ securities interestsThe interests of directors in securities of the company as at
30 June 2015 were:
DIRECTOR ORDINARY SHARESPERFORMANCE
RIGHTS VESTED
Mr T Kapea 115,000 –
Mr R Middleton 750,000 –
Mr P Westerhuis – –
Mr R Tacon 381,064 95,532
Executive remunerationThe objective of the group’s executive reward framework is
to ensure that reward for performance is competitive and
appropriate for the results delivered. The framework aligns
executive reward with the achievement of strategic objectives
and the creation of value for shareholders, and conforms to
industry practice.
The R&N committee ensures that executive pay is
competitive and reasonable, as well as acceptable to
shareholders. The company ensures that an executive’s
remuneration is linked to that executive’s performance to
ensure that the interests of the company and its executives
are aligned. The R&N committee determines executive
remuneration to ensure transparency and to manage
capital effectively.
In consultation with external remuneration consultants,
the company has structured an executive remuneration
framework that is market competitive and complementary
to the reward strategy of the organisation.
The company believes that the policy for determining
executives’ remuneration is aligned with shareholders’
interests because it focuses on sustained growth in
shareholder wealth by pushing growth in share price and
delivering constant returns on assets, as well as focusing
the executive on key non-financial drivers of value. Most
importantly, the company ensures that its remuneration policy
attracts and retains high calibre executives, who in turn add
value to the company and to the shareholders.
The company also believes that its remuneration policy for
executives is aligned to the interests of its executives. The
executive remuneration policy rewards capability and
experience and reflects competitive reward for contribution to
growth in shareholder wealth. The policy is transparent so it
provides a clear structure for earning rewards and provides
recognition for contribution.
The framework provides a mix of fixed and variable pay, and
a blend of short and long term incentives. As executives gain
seniority with the group, the balance of this mix shifts to a
higher proportion of ‘at risk’ rewards.
The executive remuneration and reward framework has
two components:
• Base pay and benefits, including superannuation, and
• Long term incentives
The combination of these comprises an executive’s total
remuneration.
Base pay and benefits
Executives are offered a competitive base pay that comprises
the fixed component and rewards. External remuneration
consultants provide analysis and advice to ensure that base
pay is set to reflect the market for comparable roles. Base
pay for executives is reviewed annually to ensure that the
executives’ remuneration is competitive with the market.
An executive’s remuneration is also reviewed on promotion.
There are no guaranteed base pay increases included in any
executives’ contracts.
Long term incentives
The Bathurst Long Term Incentive Plan (LTIP) was approved
by shareholders at the 2012 Annual General Meeting
and was adopted by the company on reorganisation. The
purpose of the plan is to reinforce a performance focused
culture by providing a long term performance based element
in the total remuneration packages of certain employees (in
the form of performance rights) by aligning and linking the
interests of Bathurst’s leadership team and shareholders,
and to attract and retain executives and key management.
The plan forms part of the company’s remuneration policy and
provides the company with a mechanism for driving long term
performance for shareholders and the retention of executives.
Performance rights granted under the plan carry no dividend
or voting rights. When exercised, each performance right
converts into one fully paid ordinary share.
21
For
per
sona
l use
onl
y
Service agreementsOn appointment to the board, each non-executive director enters into a service agreement with the company in the form of a letter of appointment. The letter summarises the board policies and terms, including compensation, relevant to the office of director.
Remuneration and other terms of employment for the managing director and other key management personnel are also formalised in service agreements.
Employees’ remunerationDuring the year ended 30 June 2015, 20 employees (excluding the chief executive officer) received individual remuneration over $100,000.
RANGE# OF
EMPLOYEES
$100,001 – $110,000 3
$110,001 – $120,000 2
$120,001 – $130,000 3
$130,001 – $140,000 2
$140,001 – $150,000 1
$160,001 – $170,000 3
$170,000 – $180,000 2
$230,001 – $240,000 1
$310,001 – $320,000 2
$470,001 – $480,000 1
Officers’ securities interestsThe interests of the current company officers (excluding the chief executive officer) in securities of the company at 30 June 2015 were:
OFFICERORDINARY
SHARESPERFORMANCE
RIGHTS VESTED
Ms S Aarons 341,578 58,789
DonationsThe company made donations totalling $14,000 to:• Fostering Kids • Foundation for Youth Development • Ohai Nightcaps Lions Club• Ohai Nightcaps Rugby Club • Buller Cycling Club• Autism New Zealand Inc.
Directors’ and officers’ liability insuranceThe company and its subsidiaries have arranged policies of directors’ and officers’ liability insurance, which, together with a deed of indemnity, seek to ensure to the extent permitted by law that directors and officers will incur no monetary loss as a result of actions legitimately taken by them as directors and officers.
This report is made in accordance with a resolution of directors.
Cascade mine has recorded a partial impairment in the year ended 30 June 2015, due to a major commercial sales contract expiring
in 2016 which impacts upon production forecasts. The partial impairment results in the mine assets being held at fair value (fair value
hierarchy level 3).
ASSUMPTIONS
The sales price per tonne used in the valuation models has been based on current contractual arrangements. Production levels have
been based on the Board approved operating plan which, for Cascade, sees production wind down in the last quarter of 2016. As the
majority of all production is matched to contracted sales, the sensitivity of pricing movements for non-contracted volumes is immaterial.
The discount rate is required to reflect the time value of money as well as the asset risk profile. The model assumes a post-tax rate
of 11.19% (2014: 11:07%). The recoverable value has been determined using discounted cash flows under the fair value less costs
to sell methodology.
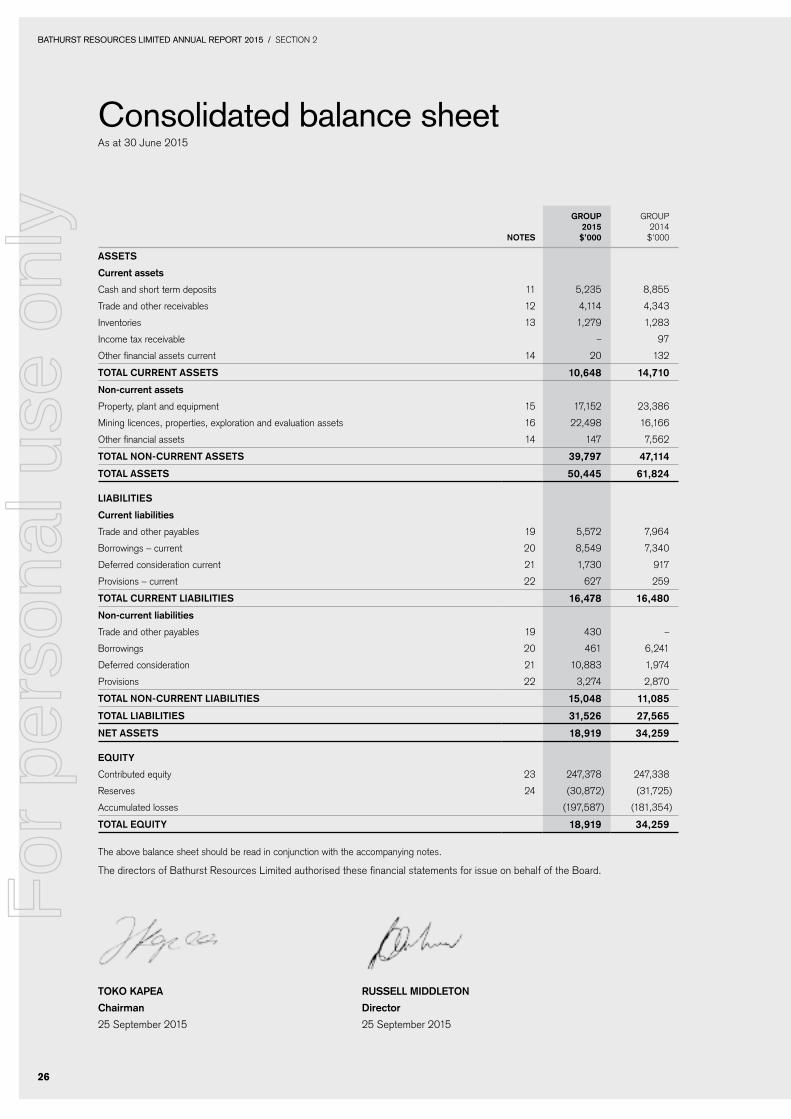
11. CASH AND SHORT TERM DEPOSITS
GROUP2015
$’000
GROUP2014
$’000
Cash at bank and on hand 2,465 5,565
Cash and cash equivalents 2,465 5,565
Short term deposits* 2,770 3,290
TOTAL CASH AND SHORT TERM DEPOSITS 5,235 8,855
* Short term deposits include restricted term deposits held with ANZ and Westpac in relation to security held against performance bonds.
12. TRADE AND OTHER RECEIVABLES
GROUP2015
$’000
GROUP2014
$’000
Trade receivables 4,667 2,816
Less: provision for impairment of receivables (785) –
3,882 2,816
Loans to key management personnel* – 510
Interest receivable 27 356
Prepayments 93 78
Other receivables** 112 583
TOTAL TRADE AND OTHER RECEIVABLES 4,114 4,343
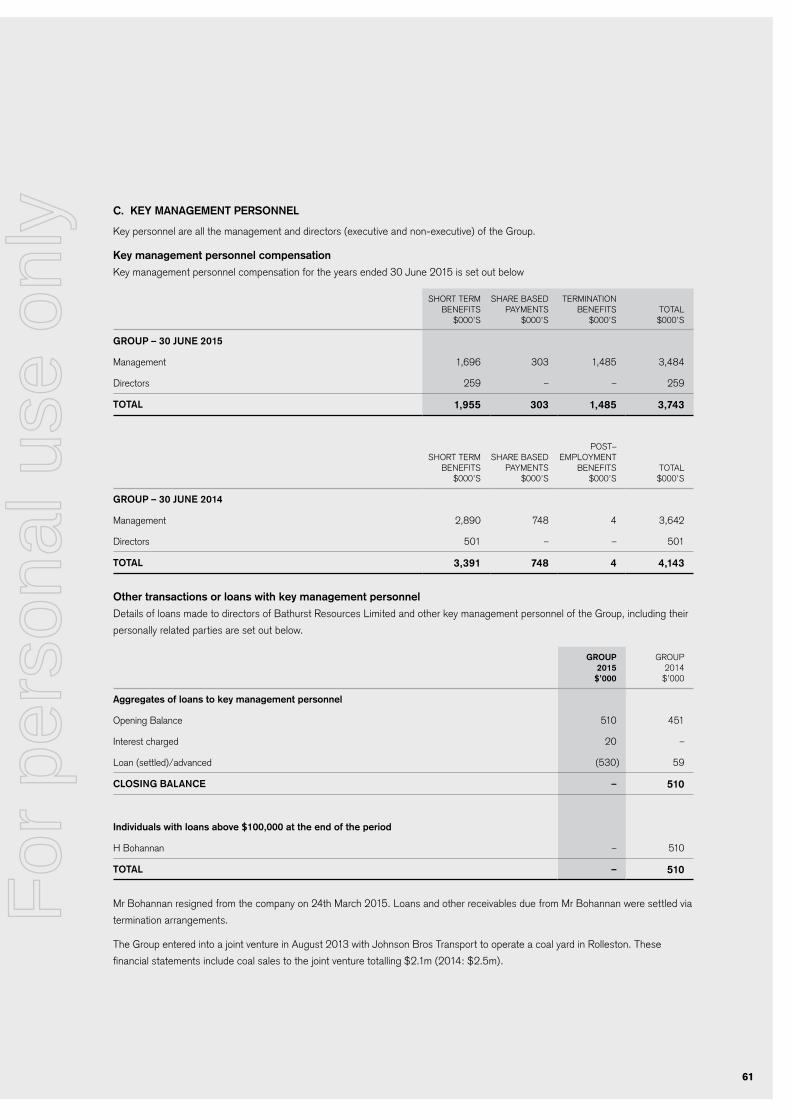
* Further information relating to loans to key management personnel is set out in Note 29.** Other receivables in 2014 included a receivable from Mr Bohannan relating to the exercise of 5,000,000 options in October 2013.
43
For
per
sona
l use
onl
y
Notes to the financial statements continued For the year ended 30 June 2015
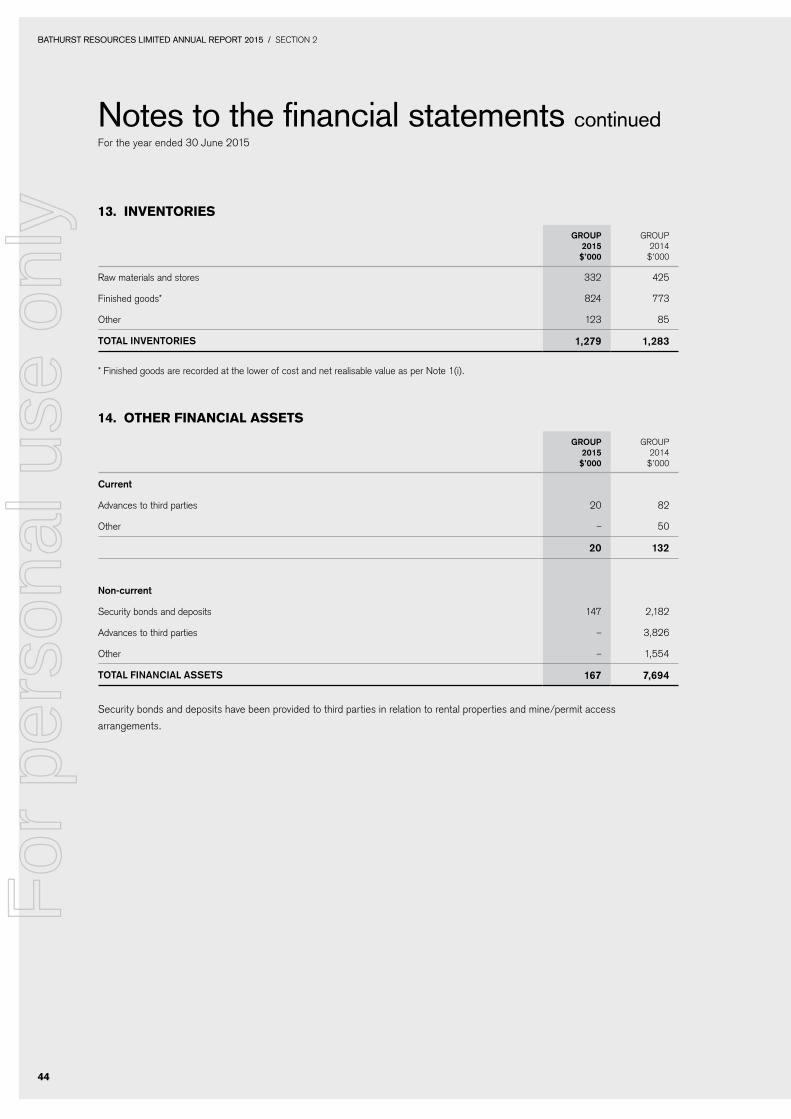
13. INVENTORIES
GROUP2015
$’000
GROUP2014
$’000
Raw materials and stores 332 425
Finished goods* 824 773
Other 123 85
TOTAL INVENTORIES 1,279 1,283
* Finished goods are recorded at the lower of cost and net realisable value as per Note 1(i).
14. OTHER FINANCIAL ASSETS
GROUP2015
$’000
GROUP2014
$’000
Current
Advances to third parties 20 82
Other – 50
20 132
Non-current
Security bonds and deposits 147 2,182
Advances to third parties – 3,826
Other – 1,554
TOTAL FINANCIAL ASSETS 167 7,694
Security bonds and deposits have been provided to third parties in relation to rental properties and mine/permit access
The consolidated financial statements incorporate the assets, liabilities and results of the following subsidiaries.
COUNTRY OF INCORPORATION
CLASS OF SHARES
EQUITY HOLDING
2015 %
EQUITY HOLDING
2014 %
NAME OF ENTITY
BR Coal Pty Limited Australia Ordinary 100 100
Bathurst New Zealand Limited New Zealand Ordinary 100 100
Bathurst Coal Holdings Limited1 New Zealand Ordinary 100 100
Buller Coal Limited New Zealand Ordinary 100 100
Bathurst Coal Limited2 New Zealand Ordinary 100 100
Cascade Coal Limited New Zealand Ordinary – 100
Sommervilles Land Holdings Limited New Zealand Ordinary – 100
Canterbury Coal Limited New Zealand Ordinary – 100
Cascade East Limited New Zealand Ordinary – 100
Takitimu Coal Limited New Zealand Ordinary – 100
Rochfort Coal Limited New Zealand Ordinary – 100
Eastern Coal Supplies Limited New Zealand Ordinary – 100
New Brighton Collieries Limited New Zealand Ordinary 100 –
1 During the period, Bathurst Coal Limited changed its name to Bathurst Coal Holdings Limited2 During the period Eastern Coal Limited changed its name to Bathurst Coal Limited and amalgamated with Cascade Coal limited,
Sommervilles Land Holdings Limited, Canterbury Coal Limited, Cascade East Limited, Takitimu Coal Limited, Rochfort Coal Limited and Eastern Coal Supplies Limited.
All subsidiary companies have a balance date of 30 June, are predominantly involved in the coal industry and have a functional currency
of New Zealand dollars with the exception of BR Coal Pty Ltd. BR Coal Pty Ltd has a functional currency of Australian dollars.
During the period, the company acquired 100% of the ordinary shares in New Brighton Collieries Limited.
47
For
per
sona
l use
onl
y
Notes to the financial statements continued For the year ended 30 June 2015
18. DEFERRED TAX ASSET/(LIABILITIES)
GROUP2015
$’000
GROUP2014
$’000
The balance comprises temporary differences attributable to:
Tax losses 15,791 15,406
Employee benefits 244 200
Provisions 1,311 1,156
Mining licences 16,195 15,545
Exploration and evaluation expenditure 1,614 1,630
Property, plant and equipment 7,442 7,288
TOTAL DEFERRED TAX ASSETS 42,597 41,225
Waste moved in advance (1,654) (3,283)
TOTAL DEFERRED TAX LIABILITIES (1,654) (3,283)
Net deferred tax asset not recognised (40,943) (37,942)
NET DEFERRED TAX ASSET/(LIABILITY) – –
GROUP2015
$’000
GROUP2014
$’000
Movement
Opening balance – (95,331)
Deferred tax benefit – 95,331
NET DEFERRED TAX ASSET/(LIABILITY) – –
The Group has not recognised a net deferred tax asset of $40.9m (2014: $37.9m) on the basis that it is not probable these losses
Change recognised in the mining and property asset 594 194
Change due to passage of time (unwinding of discount) 262 167
Other changes recognised in the income statement (464) (16)
CLOSING BALANCE 3,521 3,129
Rehabilitation provision
Provision is made for the future rehabilitation of areas disturbed in the mining process. Management estimates the provision based
on expected levels of rehabilitation, areas disturbed and an appropriate discount rate.
Restructuring provision
Provision has been made for planned changes to the company’s management structure. A detailed formal plan is in place and an
announcement has been made to those affected.
23. CONTRIBUTED EQUITY
GROUP 2015
NUMBER OF SHARES
000S
GROUP2014
NUMBER OF SHARES
000S
Ordinary fully paid shares 947,828 944,932
947,828 944,932
Movement
Opening balance 944,932 699,248
Issue of shares* 2,146 232,397
Exercise of options and conversion of performance rights** 750 13,287
CLOSING BALANCE 947,828 944,932
* In July 2014 the Company completed a non-renounceable rights issue resulting in the issue of 2,146,913 shares. The rights issue followed a share placement to institutional, sophisticated and professional investors, in April 2014. ** Further information is set out in Note 26.
53
For
per
sona
l use
onl
y
Notes to the financial statements continued For the year ended 30 June 2015
Ordinary shares
Ordinary shares entitle the holder to participate in dividends and the proceeds on winding up of the company in proportion to the
number of shares held. Every ordinary share is entitled to one vote.
24. RESERVES
GROUP2015
$’000
GROUP2014
$’000
Share based payment reserve 2,028 1,233
Foreign exchange translation reserve (140) (198)
Re-organisation reserve (32,760) (32,760)
TOTAL RESERVES (30,872) (31,725)
NATURE AND PURPOSE OF RESERVES
Share based payment reserve
The share based payment reserve is used to recognise the fair value of performance rights issued.
Foreign exchange translation reserve
Exchange differences arising on translation of companies within the Group with a different functional currency to New Zealand
dollars are taken to the foreign currency translation reserve. The reserve is recognised in the income statement when the investment
is disposed of.
Reorganisation reserve
Bathurst Resources Limited was incorporated on 27 March 2013. A scheme of arrangement between Bathurst Resources Limited
and its shareholders resulted in Bathurst Resources (New Zealand) Limited becoming the new ultimate parent company of the Group
on 28th June 2013. In accordance with the Financial Reporting Act 1993, these Group financial statements can only include
subsidiary companies results from the date of reorganisation, and therefore in arriving at a closing consolidated Balance Sheet, a
reorganisation reserve has been created which reflects the previous retained losses of subsidiaries.
The Group leases various plant and equipment expiring within one to four years.
GROUP 2015
$’000
GROUP2014
$’000
Commitments in relation to finance leases are payable as follows:
Within one year 234 310
Later than one year but not later than five years 109 141
Later than five years – –
MINIMUM LEASE PAYMENTS 343 451
Future finance charges (32) (40)
FINANCE LEASE LIABILITY 311 411
The present value of finance lease liabilities is as follows:
Within one year 213 279
Later than one year but not later than five years 98 132
Later than five years – –
MINIMUM LEASE PAYMENTS 311 411
C. EXPLORATION EXPENDITURE COMMITMENTS
In order to maintain the various permits in which the Group is involved the Group has ongoing operational expenditure as part of its
normal operations. The actual costs will be dependent on a number of factors including final scope and timing of operations.
D. CONTINGENT ASSETS AND LIABILITIES
As at 30 June 2015 the Group had no contingent assets or liabilities (2014: nil).
31. EVENTS OCCURRING AFTER THE REPORTING PERIOD
Subsequent to the period end, a parcel of land was disposed for $5.375m. The asset was disposed with proceeds used in
settlement of a loan held over the original purchase totalling $5.375m. The loan is included within current borrowings in these
financial statements.
There are no other material events that occurred subsequent to reporting date, that require recognition of, or additional disclosure in
these financial statements.
63
For
per
sona
l use
onl
y
Independent Auditors’ Reportto the shareholders of Bathurst Resources Limited
Report on the Financial StatementsWe have audited the Group financial statements of Bathurst Resources Limited (“the Company”) on pages 24 to 63, which comprise the balance sheet as at 30 June 2015, the income statement, statement of changes in equity and statement of cash flows for the year then ended, and the notes to the financial statements that include a summary of significant accounting policies and other explanatory information for the Group. The Group comprises the Company and the entities it controlled at 30 June 2015 or from time to time during the financial year.
Directors’ Responsibility for the Financial StatementsThe Directors are responsible for the preparation and fair presentation of these financial statements in accordance with New Zealand Equivalents to International Financial Reporting Standards and International Financial Reporting Standards and for such internal controls as the Directors determine are necessary to enable the preparation of financial statements that are free from material misstatement, whether due to fraud or error.
Auditors’ ResponsibilityOur responsibility is to express an opinion on these financial statements based on our audit. We conducted our audit in accordance with International Standards on Auditing (New Zealand) and International Standards on Auditing. These standards require that we comply with relevant ethical requirements and plan and perform the audit to obtain reasonable assurance about whether the financial statements are free from material misstatement.
An audit involves performing procedures to obtain audit evidence about the amounts and disclosures in the financial statements. The procedures selected depend on the auditors’ judgement, including the assessment of the risks of material misstatement of the financial statements, whether due to fraud or error. In making those risk assessments, the auditors consider the internal controls relevant to the Company’s preparation of financial statements that give a true and fair view of the matters to which they relate, in order to design audit procedures that are appropriate in the circumstances, but not for the purpose of expressing an opinion on the effectiveness of the Group’s internal control. An audit also includes evaluating the appropriateness of accounting policies used and the reasonableness of accounting estimates, as well as evaluating the overall presentation of the financial statements.
We believe that the audit evidence we have obtained is sufficient and appropriate to provide a basis for our audit opinion.
We are independent of the Group. Other than in our capacity as auditors and providers of other related assurance services we have no relationship with, or interests in, the Group.
Independent Auditors’ Reportto the shareholders of Bathurst Resources Limited
OpinionIn our opinion, the financial statements on pages 24 to 63, present fairly, in all material respects, the financial position of the Group as at 30 June 2015, and its financial performance and cash flows for the year then ended in accordance with New Zealand Equivalents to International Financial Reporting Standards and International Financial Reporting Standards.
Emphasis of matterWithout modifying our opinion, we draw attention to Note 2 in the financial statements which states that there are uncertainties in achieving the future cash flow forecasts. This indicates the existence of a material uncertainty that may cast significant doubt about the Group’s ability to continue as a going concern.
Restriction on Use of our ReportThis report is made solely to the Company’s shareholders, as a body, in accordance with the Companies Act 1993. Our audit work has been undertaken so that we might state those matters which we are required to state to them in an auditors’ report and for no other purpose. To the fullest extent permitted by law, we do not accept or assume responsibility to anyone other than the Company and the Company’s shareholders, as a body, for our audit work, for this report or for the opinions we have formed.
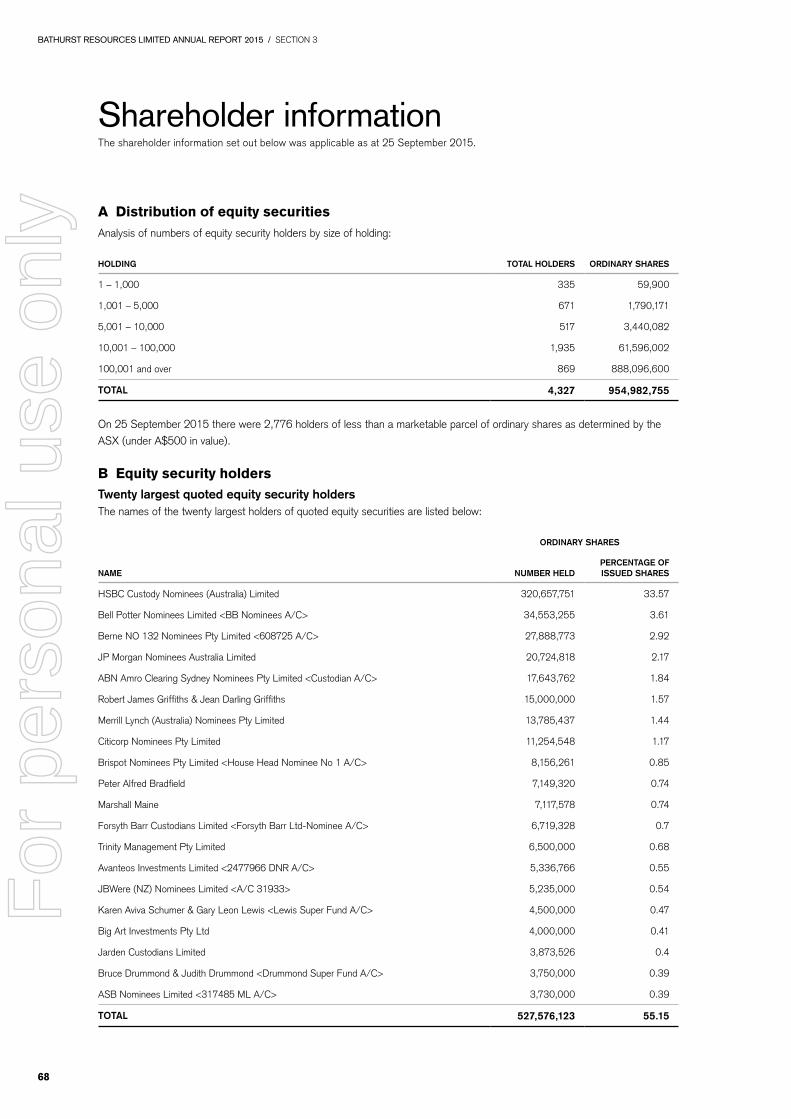
Shareholder informationThe shareholder information set out below was applicable as at 25 September 2015.
A Distribution of equity securitiesAnalysis of numbers of equity security holders by size of holding:
HOLDING TOTAL HOLDERS ORDINARY SHARES
1 – 1,000 335 59,900
1,001 – 5,000 671 1,790,171
5,001 – 10,000 517 3,440,082
10,001 – 100,000 1,935 61,596,002
100,001 and over 869 888,096,600
TOTAL 4,327 954,982,755
On 25 September 2015 there were 2,776 holders of less than a marketable parcel of ordinary shares as determined by the ASX (under A$500 in value).
B Equity security holdersTwenty largest quoted equity security holdersThe names of the twenty largest holders of quoted equity securities are listed below:
Asian Dragon Acquisitions Limited 57,323,965 6.00%
D Voting rightsThe voting rights attached to each class of equity securities are set out below:
i. Ordinary sharesOn a show of hands, every member present at a meeting in person or by proxy shall have one vote and upon a poll each share shall have one vote.
ii. OptionsNo voting rights.
E On-market buy-backThe company has no on-market buy-back on offer.
NoteAll Resources and Reserves quoted in this release are reported in terms as defined in the 2004 and 2012 Editions of the ‘Australasian Code for Reporting of Exploration Results, Mineral Resources and Ore Reserves’ as published by the Joint Ore Reserves Committee of the Australasian Institute of Mining and Metallurgy, Australian Institute of Geoscientists and Minerals Council of Australia (‘JORC’).All Resources quoted are reported as 30 October 2015 ASX Release – ‘Update on Resources and Reserves’.1 The Measured and Indicated Mineral Resources are inclusive of those Mineral Resources modified to produce the Ore Reserves. Resource tonnages have been calculated using a density value calculated using approximated in-ground moisture values (Preston and
Sanders method) and, as such, all tonnages quoted in this report are wet tonnes. All Coal Qualities quoted are on an Air Dried Basis.2 Escarpment Resources were depleted by mining. Further Resources were identified due to additional drilling and an updated geological
model.3 Cascade Resources were depleted by mining. 4 No additional work was undertaken on the coal resources for Deep Creek, Millerton North, North Buller, Blackburn and New Brighton since
originally reported. This information was prepared and first disclosed under the JORC Code 2004. It has not been updated since to comply with the JORC
Code 2012 on the basis that the information has not materially changed since it was last reported.5 In 2014 the Takitimu Resources were reported in two units ‘Coaldale’ and ‘Ohai’. These were combined into the Takitimu area in 2015 as
the Ohai area reported is contiguous with the Coaldale block of the Takitimu mine, and is covered by existing mining tenements.6 Additional drilling and a revision of the geological model resulted in a greater understanding of the coal resource and, consequently,
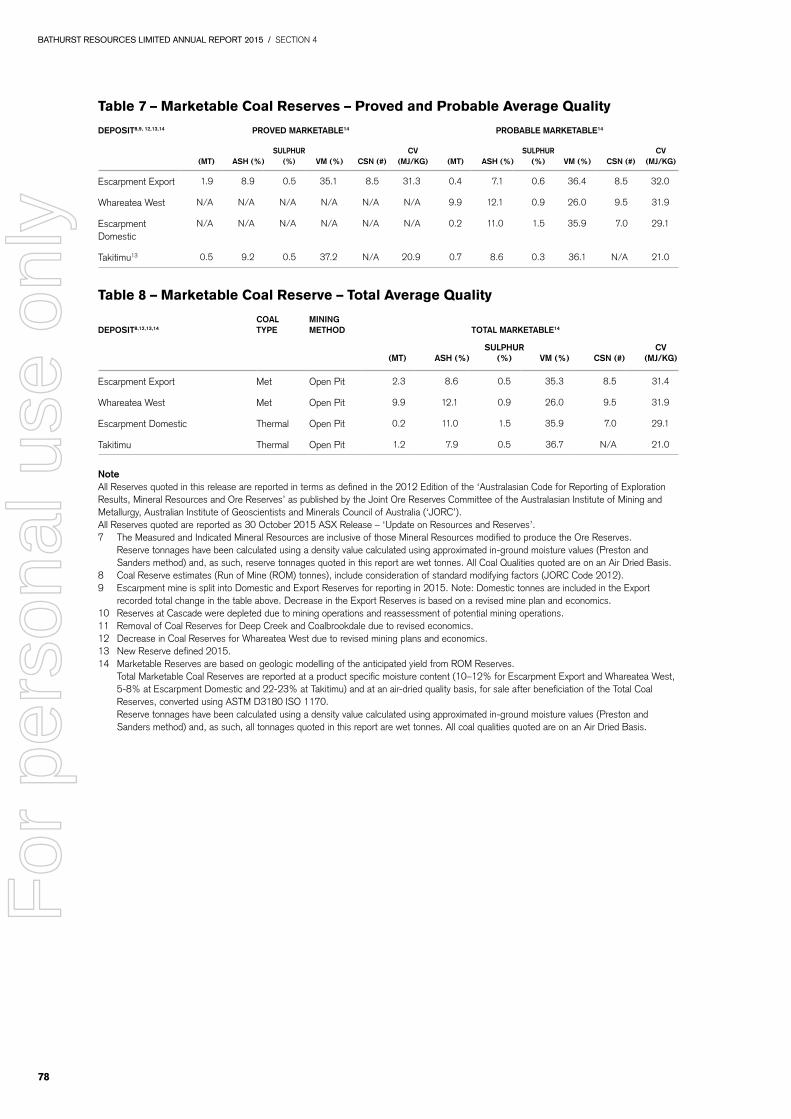
Takitimu Thermal Open Pit 1.2 7.9 0.5 36.7 N/A 21.0
NoteAll Reserves quoted in this release are reported in terms as defined in the 2012 Edition of the ‘Australasian Code for Reporting of Exploration Results, Mineral Resources and Ore Reserves’ as published by the Joint Ore Reserves Committee of the Australasian Institute of Mining and Metallurgy, Australian Institute of Geoscientists and Minerals Council of Australia (‘JORC’).All Reserves quoted are reported as 30 October 2015 ASX Release – ‘Update on Resources and Reserves’.7 The Measured and Indicated Mineral Resources are inclusive of those Mineral Resources modified to produce the Ore Reserves. Reserve tonnages have been calculated using a density value calculated using approximated in-ground moisture values (Preston and
Sanders method) and, as such, reserve tonnages quoted in this report are wet tonnes. All Coal Qualities quoted are on an Air Dried Basis.8 Coal Reserve estimates (Run of Mine (ROM) tonnes), include consideration of standard modifying factors (JORC Code 2012).9 Escarpment mine is split into Domestic and Export Reserves for reporting in 2015. Note: Domestic tonnes are included in the Export
recorded total change in the table above. Decrease in the Export Reserves is based on a revised mine plan and economics.10 Reserves at Cascade were depleted due to mining operations and reassessment of potential mining operations.11 Removal of Coal Reserves for Deep Creek and Coalbrookdale due to revised economics.12 Decrease in Coal Reserves for Whareatea West due to revised mining plans and economics.13 New Reserve defined 2015.14 Marketable Reserves are based on geologic modelling of the anticipated yield from ROM Reserves. Total Marketable Coal Reserves are reported at a product specific moisture content (10–12% for Escarpment Export and Whareatea West,
5-8% at Escarpment Domestic and 22-23% at Takitimu) and at an air-dried quality basis, for sale after beneficiation of the Total Coal Reserves, converted using ASTM D3180 ISO 1170.
Reserve tonnages have been calculated using a density value calculated using approximated in-ground moisture values (Preston and Sanders method) and, as such, all tonnages quoted in this report are wet tonnes. All coal qualities quoted are on an Air Dried Basis.
Resource qualityThe company is not aware of any information to indicate that the quality of the identified Resources will fall outside the range of specifications for Reserves as indicated in the above table.
Further Resource and Reserve information can be found on the company’s website at www.bathurstresources.co.nz
Mineral Resource and Ore Reserves governance and estimation processResources and Reserves are estimated by internal and external personnel, suitably qualified as Competent Persons under the Australasian Institute of Mining and Metallurgy, reporting in accordance with the requirements of the JORC code, industry standards and internal guidelines.
All Resource estimates and supporting documentation are reviewed by a Competent Person either employed directly by Bathurst or employed as an external consultant. If there is a material change in an estimate of a Resource, or if the estimate is an inaugural resource, the estimate and all relevant supporting documentation is further reviewed by an external suitably qualified Competent Person.
All Reserve estimates are prepared in conjunction with pre-feasibility, feasibility and life of mine studies which consider all material factors.
All Resource and Reserve estimates are then further reviewed by suitably qualified internal management.
The Resources and Reserves statements included in Bathurst’s 2015 Annual Report have been reviewed by qualified internal and external Competent Persons and internal management prior to their inclusion.
Competent Person statementsThe information on this report that relates to Mineral Resources for Deep Creek and the Mineral Reserves for Escarpment Export and Whareatea West is based on information compiled by Sue Bonham-Carter who is a full time employee of Golder Associates (NZ) Ltd and is a Member of the Australasian Institute of Mining and Metallurgy. Sue Bonham-Carter has sufficient experience which is relevant to the style of mineralisation and type of deposit under consideration and to the activity which she is undertaking to qualify as a Competent Person as defined in the 2004 and 2012 Edition of the ‘Australasian Code for Reporting of Exploration Results, Mineral Resources and Ore Reserves’. Sue Bonham-Carter consents to the inclusion in this report of the matters based on her information in the form and context in which it appears above.
The information in this report that relates to Exploration Results and Mineral Resources for Escarpment, Cascade,
Coalbrookdale, Whareatea West, Millerton North, North Buller, Blackburn, Takitimu, Canterbury Coal and New Brighton is based on information compiled by Hamish McLauchlan as a Competent Person who is a full time employee of Bathurst Resources Limited and is a Member of the Australasian Institute of Mining and Metallurgy. Mr. McLauchlan has a B.Sc and M.Sc (Hons) majoring in geology from the University of Canterbury, and has had 19 years of experience in the mineral resource industry in New Zealand and offshore. He has sufficient experience which is relevant to the style of mineralisation and type of deposit under consideration and to the activity which he is undertaking to qualify as a Competent Person as defined in the 2004 and 2012 Edition of the ‘Australasian Code for Reporting of Exploration Results, Mineral Resources and Ore Reserves’. Mr McLauchlan consents to the inclusion in this presentation of the matters based on his information in the form and context in which it appears above. This presentation accurately reflects the information compiled by the Competent Person.
The information on this report that relates to Mineral Resources and Reserves for Takitimu is based on information compiled by Damian Spring who is a full time employee of Premier Mining Consultants Ltd and is a Chartered Professional Member of the Australasian Institute of Mining and Metallurgy. Mr. Spring has sufficient experience which is relevant to the style of mineralisation and type of deposit under consideration and to the activity which he is undertaking to qualify as a Competent Person as defined in the 2012 Edition of the ‘Australasian Code for Reporting of Exploration Results, Mineral Resources and Ore Reserves’.
The information on this report that relates to Mineral Resources and Reserves for Escarpment Domestic is based on information compiled by Terry Moynihan who is a full time employee of Core Mining Consultants Ltd and is a Member of the Australasian Institute of Mining and Metallurgy. Mr. Moynihan has sufficient experience which is relevant to the style of mineralisation and type of deposit under consideration and to the activity which he is undertaking to qualify as a Competent Pperson as defined in the 2012 Edition of the ‘Australasian Code for Reporting of Exploration Results, Mineral Resources and Ore Reserves’.
Share registryComputershare Investor Services Limited159 Hurstmere RdTakapuna Central 0622New Zealand
AuditorPricewaterhouseCoopers113-119 The TerraceWellington 6011New Zealand
SolicitorMinter Ellison Rudd Watts125 The TerraceWellington 6011New Zealand
BankerWestpac Banking Corporation
Stock exchange listingBathurst Resources Limited shares are listed on the Australian Securities Exchange under the code BRL
Website addresswww.bathurstresources.co.nz
New Zealand company number4382538
80
For
per
sona
l use
onl
y
Annual General Meeting of ShareholdersTo be held at 9.00am on Monday 23 November 2015at the offices of Minter Ellison Rudd Watts,125 The Terrace, Wellington 6011.
All dollar amounts referred to in this report are expressed in New Zealand dollars unless otherwise noted.