Deakin Research Online Deakin University’s institutional research repository DDeakin Research Online Research Online This is the published version (version of record) of: Simmons, A., Sanigorski, A. M., Cuttler, R., Brennan, M., Kremer, P, Mathews, L and Swinburn, B. A. 2009, Nutrition and physical activity in children and adolescents : report 6 : lessons learned from Colac's be active eat well project (2002-6) Department of Human Services Victoria, Melbourne, Vic. Available from Deakin Research Online: http://hdl.handle.net/10536/DRO/DU:30021654 Reproduced with the kind permission of the copyright owner . Copyright : 2009, Department of Human Services (Victoria)
Transcript
Deakin Research Online Deakin University’s institutional research repository
DDeakin Research Online Research Online This is the published version (version of record) of: Simmons, A., Sanigorski, A. M., Cuttler, R., Brennan, M., Kremer, P, Mathews, L and Swinburn, B. A. 2009, Nutrition and physical activity in children and adolescents : report 6 : lessons learned from Colac's be active eat well project (2002-6) Department of Human Services Victoria, Melbourne, Vic. Available from Deakin Research Online: http://hdl.handle.net/10536/DRO/DU:30021654 Reproduced with the kind permission of the copyright owner . Copyright : 2009, Department of Human Services (Victoria)
from Colac’s Be Active Eat Well Project (2002-2006)
Report prepared for Department of Human Services
(Victoria) By the WHO Collaborating Centre for Obesity Prevention
Deakin University
This page is deliberately blank
Copyright protects this publication. This report was produced for Department of Human Services (Victoria) …. ISBN No XXXX Simmons A., Sanigorski AM, Cuttler R, Brennan M, Kremer P, Mathews L, & Swinburn BA (2008) Nutrition and Physical Activity in Children and Adolescents. Barwon-South Western Region. Sentinel Site Series. Report 6: Lessons learned from Colac’s Be Active Eat Well project (2002-6): Department of Human Services (Victoria)
4 WHO Collaborating Centre for Obesity Prevention, Deakin University Report 6: Lessons learned from Colac’s Be Active Eat Well project
Acknowledgements The work contained in this report, and the others in this series, represents an enormous effort from many people across a number of organisations. All of their efforts and contributions are gratefully acknowledged. Funding: The implementation of the three projects (Romp & Chomp, Be Active Eat Well, It’s Your Move!) and the support and evaluation provided by Deakin University has been funded from many sources, including the Victorian Department of Human Services, Australian Government Department of Health and Ageing, National Health and Medical Research Council, Australian Research Council, VicHealth, City of Greater Geelong, Barwon Health, Alcoa, Barwon Primary Care Forum, and Deakin University. Program implementation: Several organisations and staff have contributed to the implementation of these projects. Romp & Chomp: Barwon Health, City of Greater Geelong, Geelong Kindergarten Association, and Leisure Networks with significant input from Mark Brennan, Maree Crellin, Lisa De Majo, Kathleen Doole, Debbie Elea, Frank Giggins, Janet Park, Susan Parker, Sharon Sharp, Michael Smith, Karen Stagnitti, Janet Torode, Louise Van Herwerden and others. Be Active Eat Well: Colac Area Health, Colac Otway Shire, the primary schools and kindergartens in Colac and the Barwon South-Western Region, Victorian Government Department of Human Services (including Barwon South-Western Regional Office), Leisure Networks, Neighbourhood Renewal with significant input from Simon Baker, Tracey Bayne, Mark Brennan, Tim Bryar, Brooke Connolly, Ruth Cuttler, Juli Farquhar, Greg Fletcher, Christine Gurrie, Steve Illingworth, Di Leverret, Pauline Maunsell, Jorja Millar, Margaret Scanlon, Jason Thompson, John Townsend, Megan Trigg, Rachel Wood and others. It’s Your Move!: the secondary schools in Geelong, Bellarine and the Barwon South-Western Region, and the City of Greater Geelong with significant input from Sue Blackett, Leanne Denny, Kerryn Fearnsides, Christine Green, Sonia Kinsey, Kirsty Licheni, Louise Mathews, Kate Meadows, Lauren Reading, Lyndal Taylor and others Kristina Basile, Kathy McConnell, Helen Walsh, Rowland Watson and others from the Victorian Government Department of Human Services, and Virginia Cherry from the Department of Education and Early Childhood Development significantly contributed to all projects. The contribution of the participating schools, early childhood settings, parents, and children in the Barwon-South Western Region is gratefully acknowledged. Support and evaluation: The research and evaluation team from Deakin University that contributed to the work in these reports consisted of Dr Colin Bell, Associate Professor Max de Courten, Dr Peter Kremer, Mary Malakellis, Louise Mathews, Dr Marj Moodie Dr Andrea Sanigorski, Annie Simmons, Professor Boyd Swinburn, with vital support from many research assistants including Leva Azadi, Anthony Bernardi, Lauren Carpenter, Kerri Cuttler, Phil Day, Caryn Kave, Lawrie Meade, Lily Meloni, Narelle Robertson and others. Students who have also contributed to the projects are gratefully acknowledged: Luke Atkin, Cheryl-Ann Bennett, Camilla Birkebaek, Floor de Groot. Abbey Harding, Diana Isgro, Melanie Nichols, Amelie Roullier, Deuwke Schokker, Moniek van Zutphen and many placement students.
5 WHO Collaborating Centre for Obesity Prevention, Deakin University Report 6: Lessons learned from Colac’s Be Active Eat Well project
11 WHO Collaborating Centre for Obesity Prevention, Deakin University Report 6: Lessons learned from Colac’s Be Active Eat Well project
List of Appendices Appendix�A: BAEW�Project�Brief.....................................................................................................�63
12 WHO Collaborating Centre for Obesity Prevention, Deakin University Report 6: Lessons learned from Colac’s Be Active Eat Well project
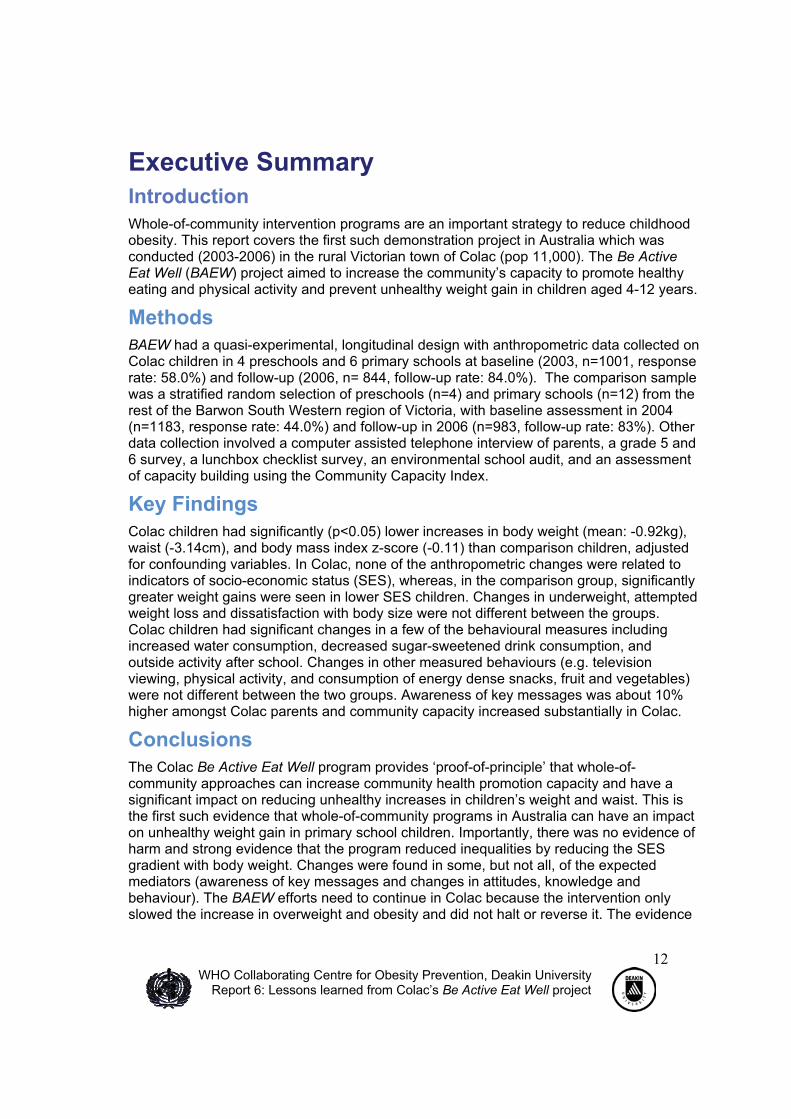
Executive Summary Introduction Whole-of-community intervention programs are an important strategy to reduce childhood obesity. This report covers the first such demonstration project in Australia which was conducted (2003-2006) in the rural Victorian town of Colac (pop 11,000). The Be Active Eat Well (BAEW) project aimed to increase the community’s capacity to promote healthy eating and physical activity and prevent unhealthy weight gain in children aged 4-12 years.
Methods BAEW had a quasi-experimental, longitudinal design with anthropometric data collected on Colac children in 4 preschools and 6 primary schools at baseline (2003, n=1001, response rate: 58.0%) and follow-up (2006, n= 844, follow-up rate: 84.0%). The comparison sample was a stratified random selection of preschools (n=4) and primary schools (n=12) from the rest of the Barwon South Western region of Victoria, with baseline assessment in 2004 (n=1183, response rate: 44.0%) and follow-up in 2006 (n=983, follow-up rate: 83%). Other data collection involved a computer assisted telephone interview of parents, a grade 5 and 6 survey, a lunchbox checklist survey, an environmental school audit, and an assessment of capacity building using the Community Capacity Index.
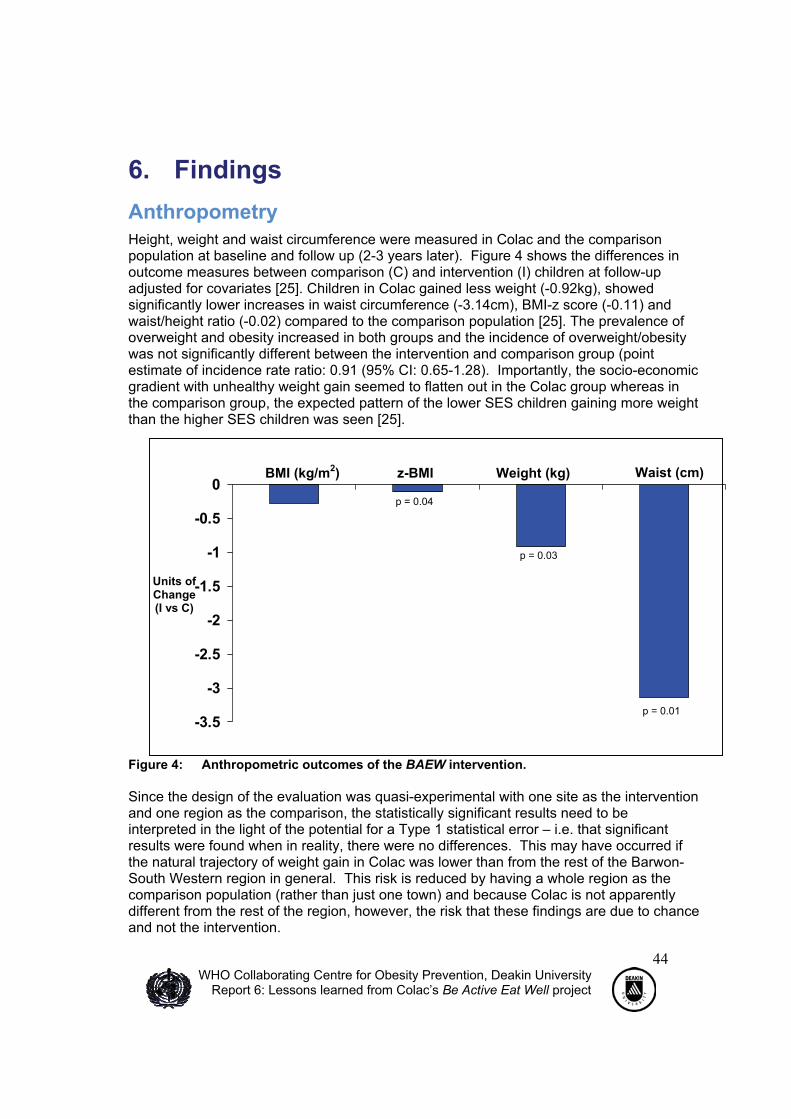
Key Findings Colac children had significantly (p<0.05) lower increases in body weight (mean: -0.92kg), waist (-3.14cm), and body mass index z-score (-0.11) than comparison children, adjusted for confounding variables. In Colac, none of the anthropometric changes were related to indicators of socio-economic status (SES), whereas, in the comparison group, significantly greater weight gains were seen in lower SES children. Changes in underweight, attempted weight loss and dissatisfaction with body size were not different between the groups. Colac children had significant changes in a few of the behavioural measures including increased water consumption, decreased sugar-sweetened drink consumption, and outside activity after school. Changes in other measured behaviours (e.g. television viewing, physical activity, and consumption of energy dense snacks, fruit and vegetables) were not different between the two groups. Awareness of key messages was about 10% higher amongst Colac parents and community capacity increased substantially in Colac.
Conclusions The Colac Be Active Eat Well program provides ‘proof-of-principle’ that whole-of-community approaches can increase community health promotion capacity and have a significant impact on reducing unhealthy increases in children’s weight and waist. This is the first such evidence that whole-of-community programs in Australia can have an impact on unhealthy weight gain in primary school children. Importantly, there was no evidence of harm and strong evidence that the program reduced inequalities by reducing the SES gradient with body weight. Changes were found in some, but not all, of the expected mediators (awareness of key messages and changes in attitudes, knowledge and behaviour). The BAEW efforts need to continue in Colac because the intervention only slowed the increase in overweight and obesity and did not halt or reverse it. The evidence
13 WHO Collaborating Centre for Obesity Prevention, Deakin University Report 6: Lessons learned from Colac’s Be Active Eat Well project
and lessons learnt from this and similar projects need to be incorporated into systems to support similar community capacity building throughout Victoria and Australia.
14 WHO Collaborating Centre for Obesity Prevention, Deakin University Report 6: Lessons learned from Colac’s Be Active Eat Well project
1. Background Childhood obesity Overweight and obesity arguably pose the single biggest threat to the health of Australian children. The prevalence of childhood and adolescent obesity has been steadily increasing in Australia [1] and around the world [2]. The negative impacts on health and psychological well being have been well described and they are substantial [2,3]. Indeed, recent estimates suggest that the health impacts of obesity may be so great that today’s children will be the first generation for many centuries to experience a lower life expectancy than their parents [4]. National and regional surveys show that childhood overweight and obesity in Australia is increasing and is now likely to be over 25% with much higher rates in some ethnic groups [1, 5, 6, 7].
Diet and physical activity patterns Clearly, changes in the dietary and physical activity behaviours have been mediating the childhood obesity epidemic, but in Australia, the lack of regular monitoring data has hampered a detailed understanding of the particular changes which might be the most implicated. Between 1985 and 1995, dietary patterns in children clearly became more obesogenic, with substantial increases in energy intake, especially of energy dense foods and beverages [8]. More recent trend surveys from NSW suggest that changes in physical activity and inactivity may be either static or improving with the exception of active transport to school which has been reducing for decades [9].
Childhood obesity prevention Systematic reviews of childhood obesity prevention programs have found only about 25 such studies [10, 11]. Overall, most studies were short term (1 year or less), focused on only a single or a few strategies, were in primary schools only, and showed little or no impact. The ones that did show some impact tended to be the high-intensity, less sustainable approaches. More recently, some interventions have shown more promising impacts [12, 13].
Sentinel Site for Obesity Prevention, Barwon-SW region The Deakin University / Department of Human Services (DHS) partnership in the Barwon-South Western region of Victoria established the Sentinel Site for Obesity Prevention in 2002. Its aim has been to build the evidence and expertise needed for obesity prevention in under-5s, primary school aged children, and adolescents through three whole-of-community demonstration programs [14]. The Colac BAEW project was the first of these to be established.
This report The purpose of this report is to present the findings from the Colac BAEW project and to highlight the lessons learned from community efforts to improve healthy eating and physical activity patterns and prevent unhealthy weight gain in children.
15 WHO Collaborating Centre for Obesity Prevention, Deakin University Report 6: Lessons learned from Colac’s Be Active Eat Well project
2. Overview of Be Active Eat Well project Be Active Eat Well (BAEW) was a whole-of community based project that aimed to promote healthy eating and physical activity behaviours and reduce unhealthy weight gain in children aged 4-12 years in the rural Australian town of Colac. It used a multi-setting, multi-strategy approach and was based on community capacity building principles [14]. Thus, BAEW was designed to build the community’s ability to create its own solutions to promoting healthy eating, physical activity and healthy weight. The intervention program was designed, planned and implemented by the key organisations in Colac, particularly Colac Area Health (lead agency), Colac Otway Shire, and the Colac Neighbourhood Renewal. The primary schools were the major setting for action but other settings such as kindergartens, neighbourhoods and fast food outlets were involved and use was made of the media and other social marketing opportunities. The intervention program was funded by the Department of Human Services (DHS) Victoria from 2002-2006 (one year of preparation, 3 years of intervention). Deakin University provided the support, training and evaluation for the project and this was funded by DHS, the Australian Department of Health and Ageing and VicHealth. BAEW had a quasi-experimental, longitudinal design with before (2003-4) and after (2006) data collection in Colac pre-schools and primary schools compared to a stratified random selection of preschools and primary schools from the rest of the Barwon South Western region of Victoria. Data collection involved anthropometry, a computer assisted telephone survey of parents, a grade 5 and 6 survey, a lunchbox checklist survey, an environmental school audit, and an assessment of capacity building using the Community Capacity Index. Figure 1 outlines the logic model for the project.
Intervention Dose1
� Community capacity2
� Environments3
� Knowledge, attitudes, beliefs, perceptions etc
� Behaviours � Anthropometry4
INPUTS
POPULATION MEDIATORS
INDIVIDUAL MEDIATORS
OUTCOMES
MODERATORS
Ethnicity, gender, age, SES
1 Intervention dose is either 1 or 0 (intervention, control) 2 Capacity is leadership, skills/knowledge, structures, resources 3 Relevant environments are schools, homes, neighbourhoods
4 Weight, BMI, BMI-z, waist, waist:height, prevalence of overweight and obesity Figure 1: Logic Model for Be Active Eat Well Project
16 WHO Collaborating Centre for Obesity Prevention, Deakin University Report 6: Lessons learned from Colac’s Be Active Eat Well project
3. Formative Evaluation Introduction This section reports on the formative stages of the BAEW Project and commences with the project proposal and project brief developed by the Victorian Government Department of Human Services. It comments on the approach taken in developing up a whole-of-community obesity prevention project and the reasons for choosing the township of Colac for this first project. The Project’s initial phase of setting up the project and developing the organisational relationships is described. Developing the BAEW Action Plan using the ANGELO (Analysis Grids of Elements Linked to Obesity) Process is also detailed. This section concludes with a commentary on the development of the evaluation design.
Project Brief In May 2002, DHS wrote a project brief titled Be Active Eat Well: A Community Building Approach to commit to improving the health and well being of Victorians by investing in physical activity and healthy eating initiatives (Appendix A – Project brief objectives). DHS envisaged BAEW as a community based initiative designed to provide the opportunity, resources and support for local communities to utilise physical activity and healthy eating related activities to achieve healthy changes in the community and to provide improved lifestyle opportunities for families and individuals. The project was expected to contribute to communities through approaches and interventions that:
� built and strengthened local environments (social, physical, economic and cultural) to enable healthy eating and physical activity
� supported the development of a local culture and initiatives which encouraged and endorsed healthy eating and physical activity
� contributed to community building and increased social capital. The BAEW Project was presented to key staff at Colac Area Health Colac in June 2002 (the reasons that Colac was chosen as an intervention community are outlined below). DHS allocated $300,000 over 3 years (July 2002 to June 2005) to the project with Colac Area Health being the auspice agency. The DHS funding was extended by $100,000 for a further year (to June 2006). In addition to the brief, a Support and Evaluation Program was also designed to undertake the evaluation and to provide support and high-level expertise to this community project in the areas of public health nutrition, physical activity promotion, health promotion, and community building. DHS provided about $40,000/year for four years to the Sentinel Site for Obesity Prevention team at Deakin University for the support and evaluation of the Colac project. However, the Sentinel Site for Obesity Prevention received a significant amount of other funding over these years and much of it contributed to the support and evaluation of BAEW. This supplementary funding included Department of Health and Ageing (through a Public Health Education and Research Program [PHERP] Innovations Grant of $450,000), DHS ($210,000), VicHealth (Public Health Research Fellowship for Dr Colin Bell), and Deakin University (funding for Professor Boyd Swinburn and supplementary support for Dr Bell). A full costing of the evaluation is underway.
17 WHO Collaborating Centre for Obesity Prevention, Deakin University Report 6: Lessons learned from Colac’s Be Active Eat Well project
o The broad brief from DHS was vital to giving the Colac community the scope to decide how best to allocate the funds – a more restrictive brief would not have been in keeping with the capacity building approach taken
o Four years was about the right duration for such a community project to become established and implemented
o The evaluation was detailed because it was a demonstration project and the real costs were likely to be at least as much as the project itself – high quality process, impact and outcome evaluations of obesity prevention projects are expensive and the traditional 10-15% of budget allocated to evaluation is only likely to be realistic for minimal evaluations
o Data analysis (including cost-effectiveness assessments) and research translation for projects like BAEW continue for years after the end of the project and they need to be considered in the funding models
Lessons learned – Project brief
Approach taken A comprehensive approach to obesity prevention In addressing the obesity epidemic, interventions involving the community at all levels are recognised as having the greatest potential. This comprehensive approach to obesity prevention is one that simultaneously addresses as many of the underlying behavioural and environmental causes of obesity as possible. The underlying premise is that single strategy approaches, such as public education about healthy choices, or single setting approaches, such as a school-based program, are going to be insufficient to achieve the ‘intervention dose’ required to reverse the current trends in obesity. The approach with the greatest sustainable effect is one that encompasses multiple strategies (e.g. community capacity building, social marketing, policy change, behaviour and environmental change, management of current overweight and obesity), in multiple settings and sectors, across both sides of the energy balance equation. Lessons from other epidemics also point to the need for a comprehensive approach and the importance of partnerships, community engagement in decisions, attention to socio-economic context, political commitment and use of multiple strategies in many settings, levels and sectors.
Community capacity building A capacity building approach has considerable merit in enabling actions across multiple-settings and sectors and creating ownership and sustainability. It also has a flexible approach, allowing actions to be tailored to local contexts. This is important if a consistent approach to obesity prevention action is expected to deal with a wide variety of contexts: different age groups, ethnicities, socio-economic conditions and existing community activities and capacities. There are several definitions for community capacity building with the most recent being included in the WHO Health promotion Glossary [15]. Here it is defined as;
‘the development of knowledge, skills, commitment, structures, systems and leadership to enable effective health promotion. It involves actions to improve health
18 WHO Collaborating Centre for Obesity Prevention, Deakin University Report 6: Lessons learned from Colac’s Be Active Eat Well project
at three levels: the advancement of knowledge and skills among practitioners; the expansion of support and infrastructure for health promotion in organisations, and; the development of cohesiveness and partnerships for health in communities’
o A multi-setting approach is important although, for primary school aged children, the schools inevitably became the major setting
o Defining ‘the intervention’ as community capacity building may be valuable in both considering the intervention from the funding body’s perspective (‘What are we funding?’) because it reinforces the need for allowing decisions on allocation of funding to be made at a local level and from a program implementation perspective (‘What are we doing?’) because it reinforces the focus on the key elements of supporting champions, building the relationships and partnerships, mobilising resources, lifting skills and expertise.
o ‘Community capacity boosting’ may be a useful way of conceptualising the scaling-up of this approach across many communities – it implies a finite period of focused resource input on the assumption (still to be proven for this issue) that once the community capacity has been built to a certain level it can continue to grow with a lower resource input
Lessons learned – Approach taken
Choice of location Staff at DHS responsible for the project consulted with key people within the Barwon-SW Regional Nutrition Network about the choice of sites for the BAEW project. Colac was chosen but not because it had a bigger obesity problem than other places. It was chosen because it had many of the features considered desirable for a demonstration project – it was of a small enough size to be manageable (population about 11,000), but large enough to have sufficient settings for intervention (e.g. 6 primary schools, 4 preschools); it was relatively disadvantaged socio-economically; it had supportive existing leadership; there was a significant level of professional skills and networks in the key organisations, and; it was relatively close to the Sentinel Site for Obesity Prevention team based at Deakin University in Geelong (about 1 hour drive away). The early discussions with key stakeholders in Colac were extremely positive and ongoing close collaborations particularly between Colac Area Health and the Colac Otway Shire provided a potential stable base for a multi-sector approach.
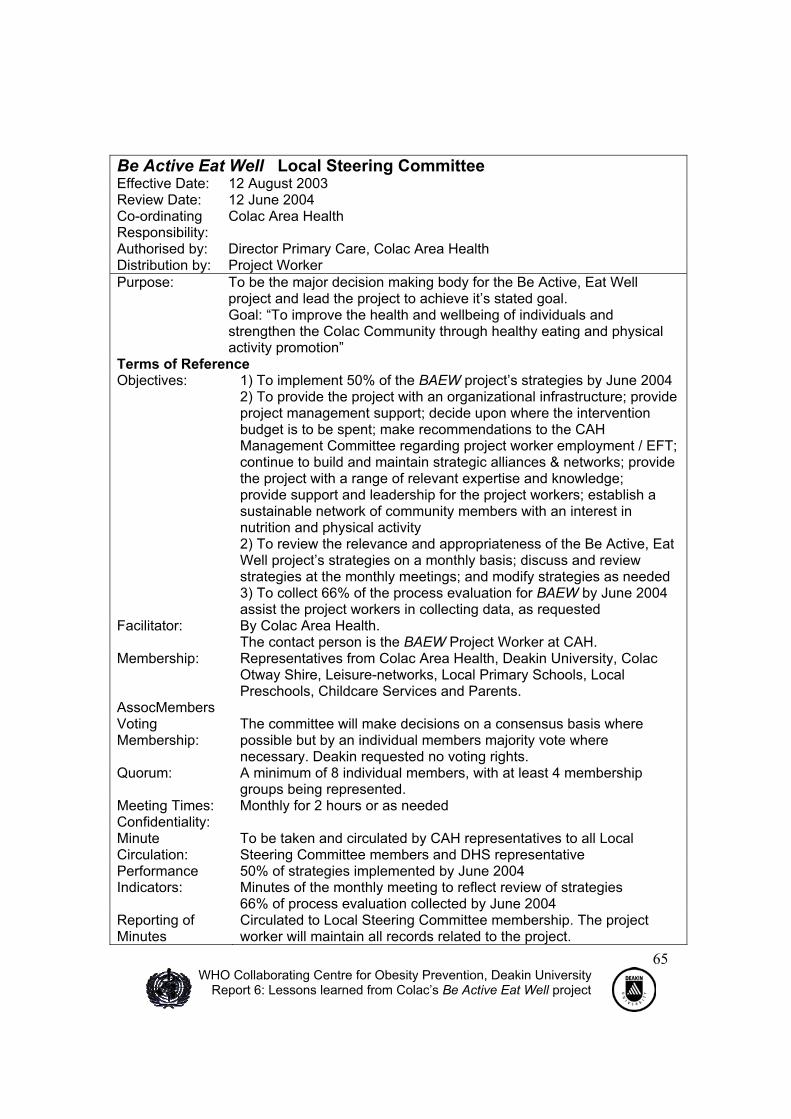
Project Set-up and Organisational Relationships Colac Area Health accepted the role as the auspice body and the Colac Otway Shire committed to being a long-term project partner. It was recognised that project management, organisational structures, coordination and strategic alliances needed to be established to support the implementation of the project. An interim steering committee was initially formed with membership from Colac Area Health, Colac Otway Shire, DHS and Deakin University with the first official meeting being held in June 2002. The interim steering committee organised the employment of a designated project worker/coordinator
19 WHO Collaborating Centre for Obesity Prevention, Deakin University Report 6: Lessons learned from Colac’s Be Active Eat Well project
that commenced in October 2002. The interim steering committee was disbanded in July 2003 and a two-tiered management system was set in place. The new structure consisted of a Reference Committee and a Local Steering Committee. This restructure occurred for four main reasons. Firstly, the membership of the interim steering committee was expanding. Secondly, requirements of committee members seemed to fall into two groups, local community members working on project strategies and non-local professionals supporting the project. Thirdly, it seemed strategic to plan long-term and establish a local and sustainable management group. Fourthly, if this was to be a truly community owned project then the local community needed to be empowered to steer the project. The Reference committee’s role was to provide higher level strategic input and support, and consisted of members from DHS, Deakin University, Colac Area Health, and Colac Otway Shire. The Reference Committee met every two months to receive updates and offer expertise and support. The Local Steering Committee was empowered to implement the project, with all strategy and budgetary decisions being the domain of this committee. Members included Colac Area Health, Colac Otway Shire, Leisure Networks (a local sports assembly), Neighbourhood Renewal, local primary schools, childcare services, parents and Deakin University. Monthly meetings ensured decisions were ratified quickly. Members joined the committee when required and departed as their roles were completed; however there remained a core group who were committed for the duration of the project. Terms of Reference were established for the Interim Steering Group, Local Steering Committee and Reference Committee (Appendix B). Deakin University provided support for interventions but their main role was in the provision of training and evaluation expertise. At the end of the project’s life there were a set of tensions that needed resolution. From a funding body’s perspective (DHS), they needed to ensure project closure (e.g. final reports, exit strategies, formal wind-up with appropriate acknowledgements and celebrations). From the local organisations’ perspective, they were keen to keep the activities going and a process of closure went against the philosophy of sustainability. This is the classic conundrum of having limited-term project funding for an ongoing need. Even though sustainability had been a priority for BAEW from the beginning, this conundrum was not fully addressed by the time project funding came to an end. Colac Area Health strategically located the BAEW staff in a community house located next to Colac’s Neighbourhood House and organised the newly commencing Colac Neighbourhood Renewal project to work from the same building. This provided the opportunity for close collaboration, allowing the two projects to value-add to each other. Contact with families within the community, especially vulnerable families, was greatly facilitated by the relationship with Neighbourhood Renewal and the Neighbourhood House.
20 WHO Collaborating Centre for Obesity Prevention, Deakin University Report 6: Lessons learned from Colac’s Be Active Eat Well project
o Having Colac Area Health as the auspice agency worked well because of their commitment to the project and their strong nutrition and health promotion expertise
o Having a small flexible steering group at the beginning worked well to get the project started and then the split into the two other committees with quite separate functions also worked well (this arrangement has also worked well in other demonstration projects in the Barwon-SW region)
o Contributing to the success of the work of the Interim Steering Committee were: � The commitment of partnerships to the goal and the sustainability of the work � Having all key players on the committee and allowing this to evolve with the
project � Prioritising the work of the project into partnership organisations i.e. advocating
the Project within members organisations � Collaboratively developing the Terms of Reference for the Interim Steering
committee � Coordinating and facilitating the community consultation / needs assessment
process which led to the development of the project’s action plan � Ensuring that the Interim Steering Committee were empowered to implement
the project by making strategic and budgetary decisions and thus creating project ownership
o The linkage of BAEW with the Neighbourhood Renewal team was very successful and the co-location of these projects in the community house facilitated this interaction
o The transition from finite project to ongoing program activities within the community needs much more consideration
Lessons learned – Project set up
Development of an Action Plan The Interim Steering Committee members from Colac Area Health and the Colac Otway Shire engaged with relevant community members. The community leaders attended the project’s initial community consultation, training and needs assessment process, referred to as the ANGELO Process (Analysis Grid for Elements Linked to Obesity). The Action Plan emerged from a 3 day training course which in the first instance aimed to build knowledge and skills in nutrition and physical activity promotion of community workers, teachers, and health professionals from the recreation, food, education and health sectors, for the prevention of childhood obesity. The course also provided the opportunity for participants to decide upon a variety of interventions that could be implemented in Colac. This development of the draft Action Plan was initiated through the ANGELO workshop within the training course. In developing the action plan the community began to own the project.
The ANGELO Framework was originally developed to dissect environments that drive the obesity epidemic [16]. It was subsequently expanded to include non-environmental elements (potential behaviours and knowledge/skill gaps) that are required to be addressed and is used to help identify solutions. Consequently it is now called the Analysis Grids for Elements (rather than Environments) Linked to Obesity.
21 WHO Collaborating Centre for Obesity Prevention, Deakin University Report 6: Lessons learned from Colac’s Be Active Eat Well project
The overall ANGELO Process enabled the community to overcome potential inertia which stems from not knowing where to begin or how to tackle prevention efforts for obesity. The resultant action plan from the ANGELO process responded to the expressed needs of the community and gave ownership to the community. It also ensured the targeted interventions were achievable within the capacity to deliver. The ANGELO Process involved the following phases: 1) community consultation and engagement of key stakeholders; 2) identifying potential environmental and behavioural components, and
knowledge and skill gaps using the ANGELO framework (grids); and 3) conducting a stakeholder workshop to discuss available and potential
‘intelligence’ (contextual information) and to develop a draft plan using the ANGELO process (Figure 2) to prioritise actions most likely to affect change
A description of the ANGELO Process is contained in Appendix C. Worksheets for the ANGELO process was developed to streamline the process for future workshops following the BAEW workshop. The worksheets were formulated on evidence from the literature and were modified for the community based on the intelligence gathered. They contained a list of up to 18 potential behaviours, up to 20 knowledge and skill gaps and between 10 and 30 environmental barriers in relevant settings of the target population, with space to add additional or new elements suggested by participants at the workshop.
Demographics, health & behaviour data on target population, existing nutrition & physical activity activities, socio-cultural studies
The ANGELO process
22 WHO Collaborating Centre for Obesity Prevention, Deakin University Report 6: Lessons learned from Colac’s Be Active Eat Well project
o The ANGELO Process provided an efficient and responsive way of achieving an agreed action plan for obesity prevention with a community. It gave a framework for prioritising the seemingly large number of potential activities into a plan of action for obesity prevention for a community with a defined target group and for key settings.
o The process required expert facilitation with skills and knowledge of community-based obesity prevention programs
o Alternative approaches using focus groups or other methods could produce similar outcomes, although the efficiency of the ANGELO Process was a big strength.
o The ANGELO Process has subsequently been used in a variety of contexts including different cultural groups and it has proven to be flexible enough to achieve this. For adolescent-focused projects, the adolescents were key contributors to the ANGELO Process and workshops.
Lessons learned – The ANGELO Process
The Action Plan The initial draft of the action plan that emerged from the workshop is presented in Table 1. After further consultations, it evolved into a more comprehensive working document. The evolution from a one page set of outline objectives to the extensive action plan shown in Appendix D is a testament to the expertise of the BAEW team. The extended action plan kept the focus on the objectives and provided a detailed record of processes and timelines while at the same time staying flexible and functional. In other demonstration projects that the Sentinel Site team have supported, the ANGELO Process has resulted in action plans that have a similar structure, but with some differences in content reflecting the different age groups and contexts. Some comments on the components of the action plan are itemised below. Vision: This highlighted that the BAEW was targeting the ‘Early Years’ which communicated the target group while allowing for a potential extension of BAEW to other age groups.
Population group: The target population was originally identified as children aged 2 to 12 years old in the Colac Community and their families and carers, although most of the evaluation and the intervention activity focused on the primary school age group. The inclusion of ‘families’ was important to ensure that the focus went beyond the children themselves.
Goal: This goal clearly articulated the health promotion and capacity building aspects of the project; however, it did not specifically identify body weight or obesity prevention. This was intentional because of the sensitivities about communicating the concept of ‘obesity’ to the public. Other demonstration projects which have developed an action plan along these lines have included the capacity building along with a component which specifically states that the part of the project goal is to ‘promote a healthy body weight’ or ‘prevent unhealthy weight gain’ or ‘prevent the development of overweight and obesity’. Having a reference to obesity prevention in the goal is important to legitimise the anthropometric changes as outcome measures.
23 WHO Collaborating Centre for Obesity Prevention, Deakin University Report 6: Lessons learned from Colac’s Be Active Eat Well project
Table 1 Initial action plan for Be Active Eat Well project
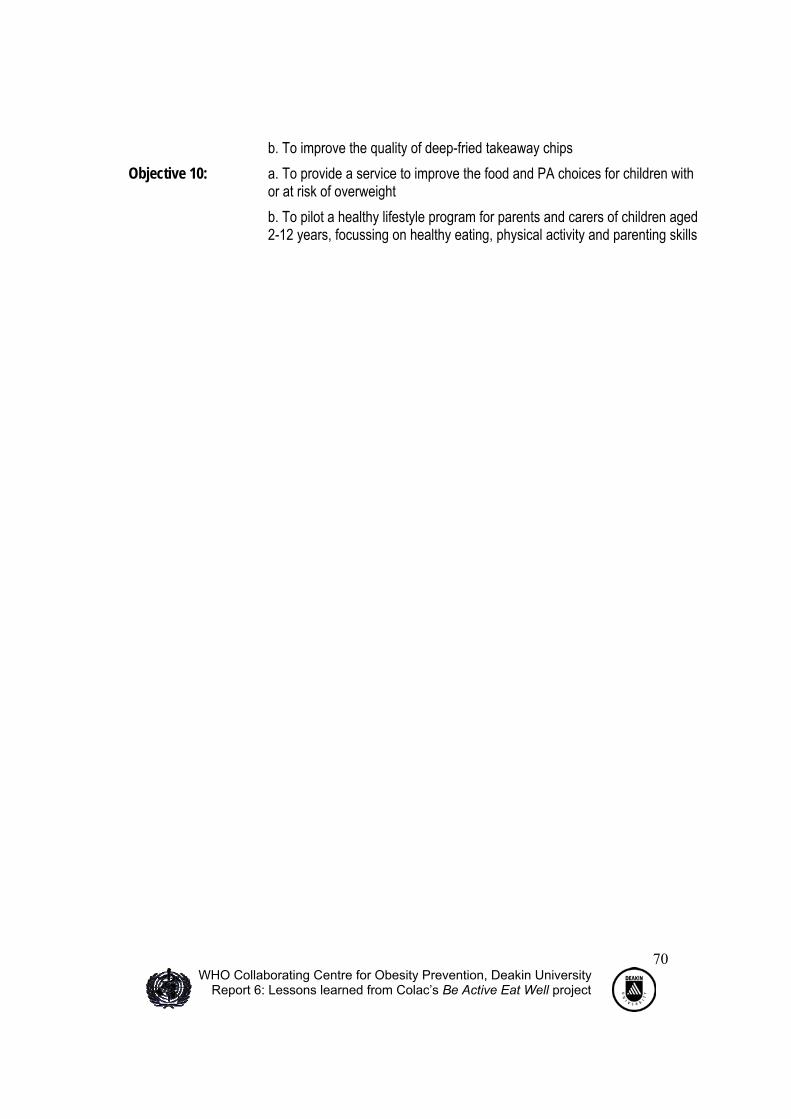
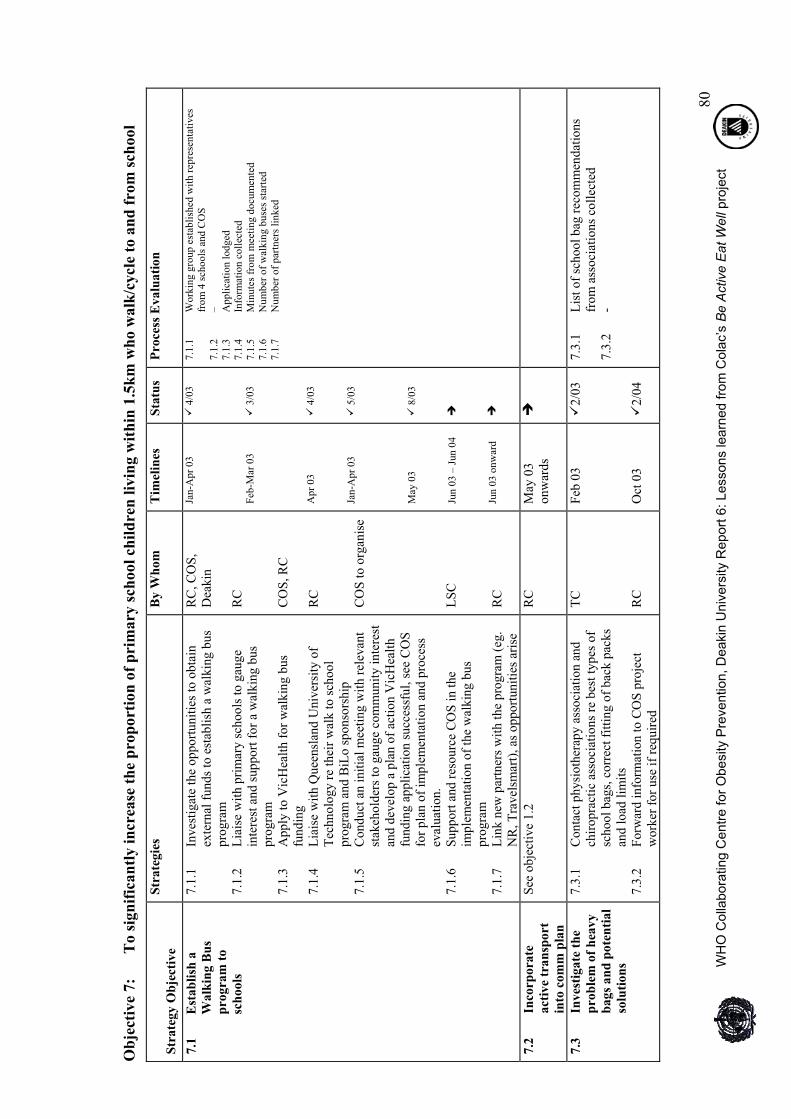
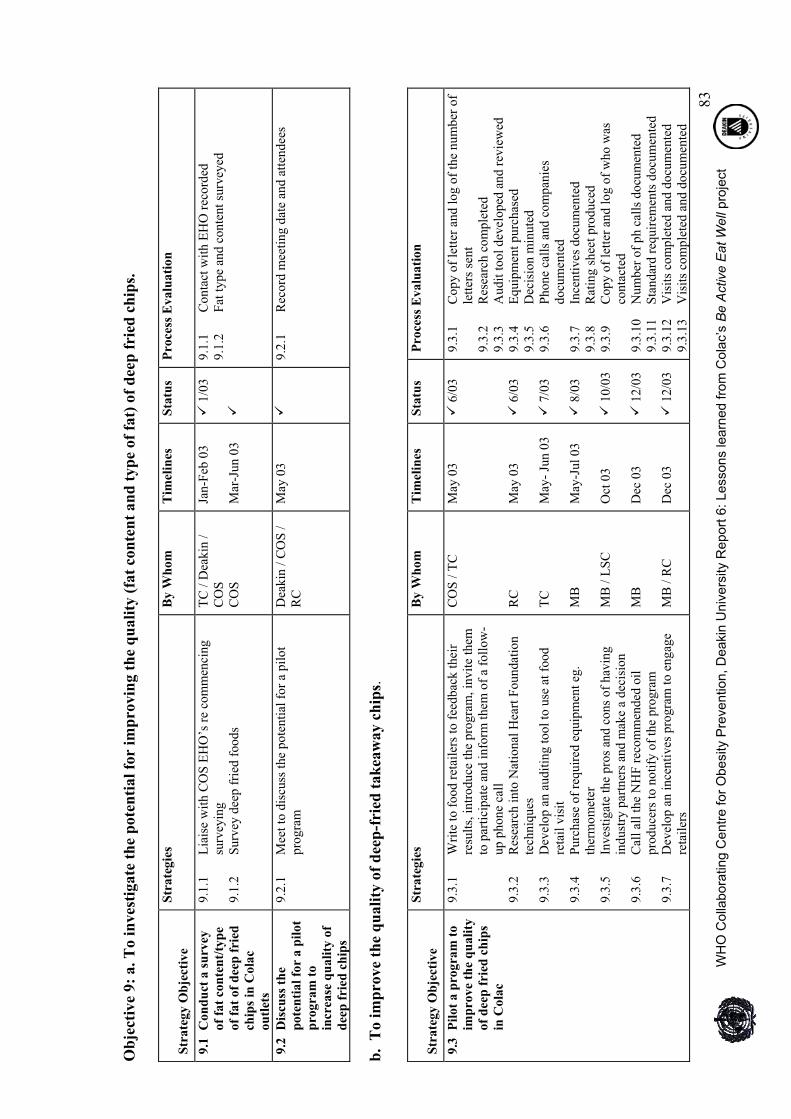
Be Active, Eat Well – Initial draft of the Action Plan Objective 1: To achieve a high awareness of the “Be Active Eat Well” messages among parents and children Objective 2: To build Colac community capacity to promote physical activity and healthy eating Objective 3: To evaluate the process, impact and outcomes of the ‘Be Active Eat Well’ project Objective 4: To significantly decrease the time spent watching TV & playing on computers or electronic games Objective 5: To significantly decrease the consumption of high sugar drinks and to promote the consumption of water Objective 6: To significantly decrease the consumption of packaged, energy dense snacks and significantly increase consumption of fruit Objective 7: To significantly increase the proportion of primary school children living within 1.5km who walk/cycle to school Objective 8: To significantly increase the amount of active play in the after-school to pre-dinner (3-6pm) & weekends Objective 9: To investigate the potential for improving the quality (fat content and type of fat) of deep-fried foods Objective 10: To provide a service to improve the food and physical activity choices for children with or at risk of overweight
Note that the term ‘significantly’ meant statistically significant since the study had multiple indicators per objective, so that an objective would be fully met, partially met or not met depending on whether all, some or none of the indicators showed significant changes compared with the comparison population.
24 WHO Collaborating Centre for Obesity Prevention, Deakin University Report 6: Lessons learned from Colac’s Be Active Eat Well project
Objectives: It is always a challenge to make objectives ‘SMART’. o The ‘S’ is for Specific and this was important to focus the objectives. For example,
objective 7 specifies that it is children who live within 1.5km of the school who are the target group. Similarly, Objective 8 identifies the periods for targeting increases in physical activity. Specifying the objectives helps enormously in developing the impact evaluation measures.
o The ‘M’ is for Measurable and this was difficult to define tightly in the absence of baseline data at the time of the formulation of the action plan. At the ANGELO workshop, an estimate of what would be considered a significant change was included (eg increase or decrease a specific behaviour by 10%). Since several measures of each behaviour were taken in the surveys, the ‘measurable’ was later defined as ‘significantly’ meaning statistically significant. If all of the measurements of, say, and sweet drink consumption were statistically reduced compared to the comparison population, the objective was said to be fully achieved. If only some showed significant reductions it would be partially achieved and if none were significant, the objective would not be met. As more prevalence estimates of relevant behaviours become available, it will be easier to put a quantitative figure on the expected changes.
o The ‘A’ is for Achievable and the ANGELO process ensured that ‘changeability’ was a key criterion for prioritisation. For example, vegetable intake may be low in children but since most vegetables are eaten in the home rather than at school, the ability of the program to influence family evening meals was not as high the ability to influence school lunches.
o The ‘R’ is for Relevant and the ANGELO criterion of ‘importance’ incorporated this characteristic. Having existing data on behaviours may further help in this regard. For example, there is a natural desire to include an objective to increase fruit consumption in children because it is a very positive message. However, low fruit consumption in children is not as big a problem as, for example, high junk food in the lunchboxes.
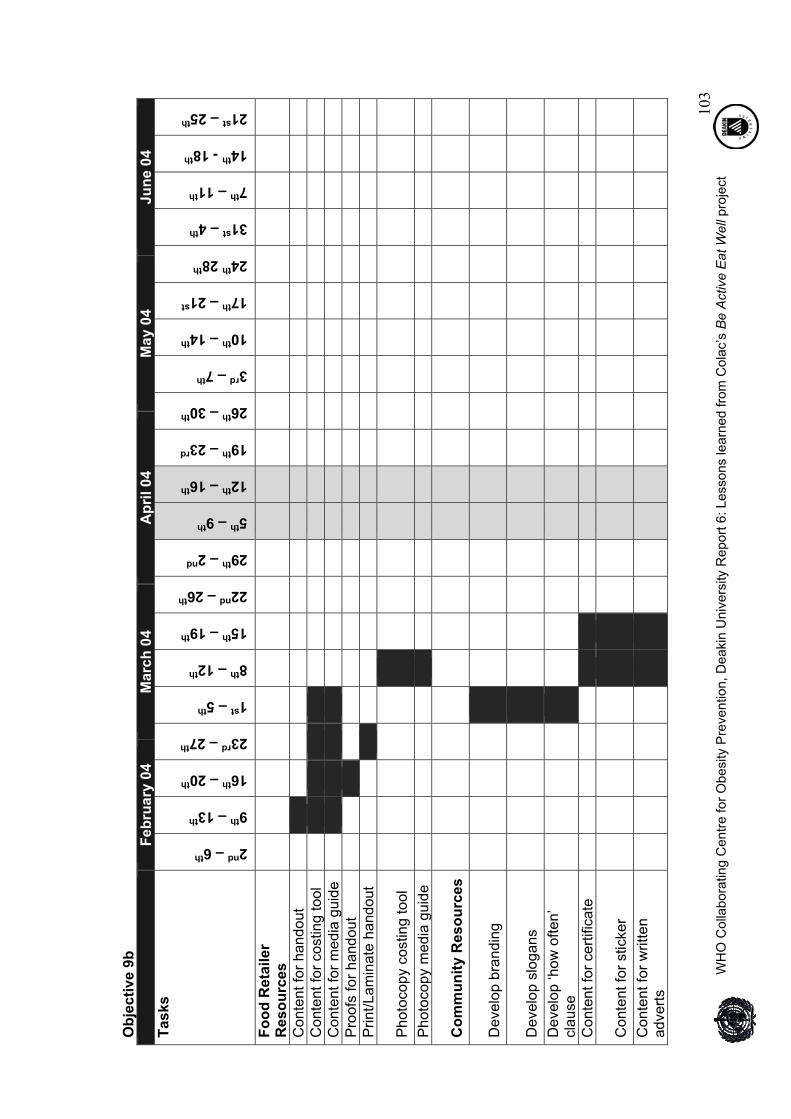
o The ‘T’ is for Time bound and this was set by the 3 year duration of the project. The first three objectives are common to all the action plans developed through the ANGELO Process as facilitated by Deakin University. Communications had its own objective because social marketing was a large part of the project and required its own plan. A community capacity objective was cross-cutting and ensured that key success factors such as the organisational structures were considered. Evaluation also had it own objective because it was a large part of the whole project. The next set of objectives stemmed from the priority behavioural elements obtained from the ANGELO Process. The final two objectives were innovative or exploratory interventions and the objectives were later modified after the initial scoping work was done (see Appendix D). Knowledge and skill gaps and the environmental barriers identified in the ANGELO Process were used to inform strategies of action for the behavioural objectives. Strategies typically consisted of social marketing, policy or program actions (see Appendix D) Following the agreement on the draft action plan at the end of the workshop, the plan was further refined when taken back to the community in consultation with other stakeholders.
25 WHO Collaborating Centre for Obesity Prevention, Deakin University Report 6: Lessons learned from Colac’s Be Active Eat Well project
Because the action plan highlighted many strategies that would need to be implemented within local primary schools, a presentation evening was provided to primary and pre-schools with a principal, teacher and parent attending from each school. This gave the project team an opportunity to network with the primary schools and pre-schools and gave the people representing these settings further opportunity to influence the content of the project’s action plan. A School Principal from the Colac School’s Network was invited to represent the schools on the Local Steering Committee, a commitment that continued throughout the project. Timelines, processes and accountability were assigned to the action plan by the project coordinator as it evolved. It was discussed that this would be a working, living document that would evolve over time, be added to as objectives were worked upon.
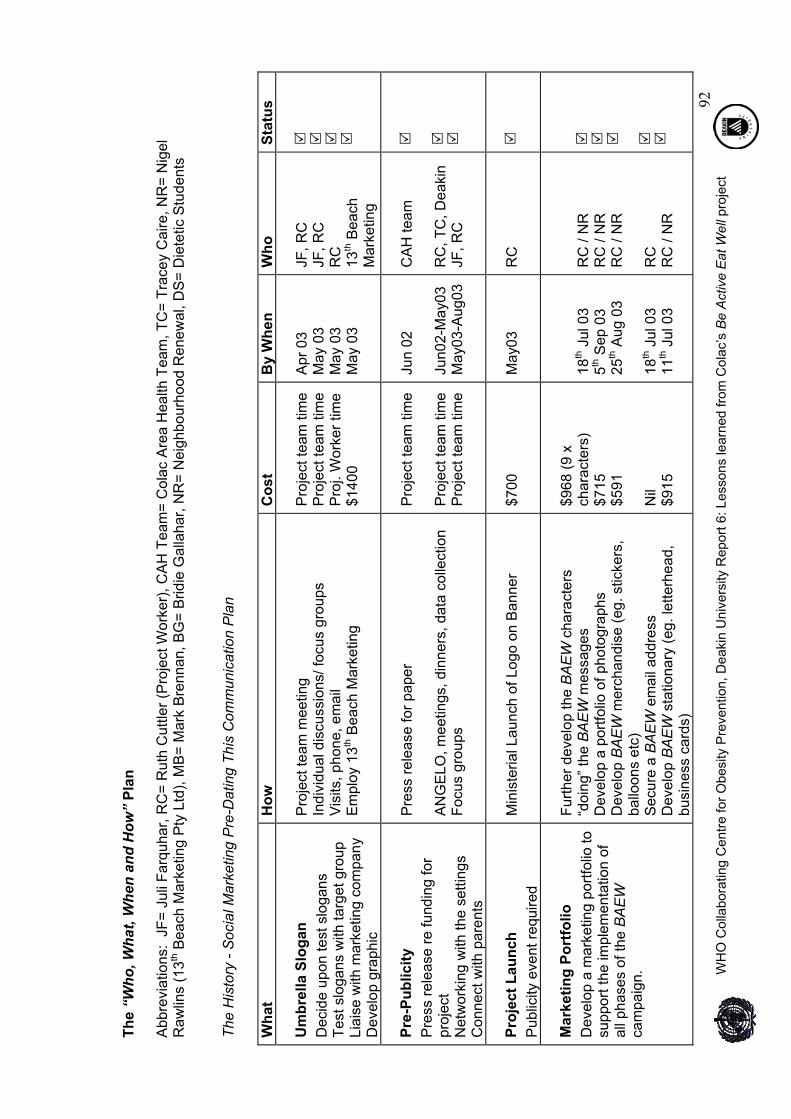
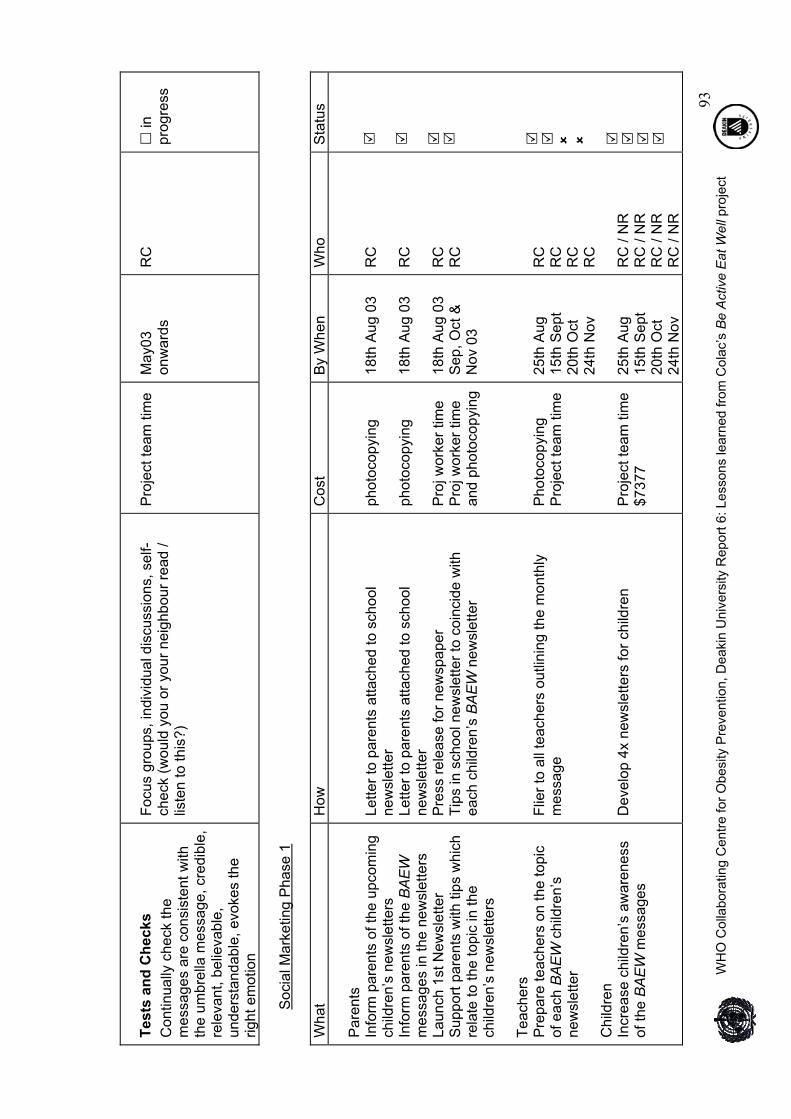
The Communication Plan The purpose of the Communication Plan was two-fold. First, it contained the social marketing plan for the project to outline the key strategies required to meet objective one around raising awareness of the project and its key messages. Second, it was recognised that pivotal to the success of the project, a high level of effective communication was required between the project teams, key stakeholders, the target group and their parents. This underpinned the coordination and management of the project in supporting its implementation. The second section of the Communication Plan outlines broad communication strategies, requirements and expectations of those involved. Appendix E shows the developed Communication Plan.
Social Marketing Plan Although an objective within the BAEW action plan, the social marketing objective ended up with its own sub-plan. A social marketing workshop was held over two half days in February 2003, three months following the development of the action plan. The aim was to provide key stakeholders and project team members an opportunity to obtain professional development training on social marketing principles including the principles of communication and persuasion. In addition, the facilitator, an expert in social marketing, Prof Rob Donovan (Curtin University, Western Australia) spent time on the second day to assist develop the social marketing messages with key stakeholders and develop a draft communication plan. Much of the coordinator’s initial time was then spent on working with other organisations to further develop the social marketing and communication plan, and coordinating and implementing the social marketing plan. The social marketing plan aimed to increase the community’s awareness of the BAEW messages and provided the umbrella messages for the interventions. The aim and objectives of the social marketing plan are outlined in Appendix E. The overarching message of the campaign was that children needed to be more physically active and eat healthier foods. This message was broken down into “campaign messages” (expressed in project language and for professional use) and “take-home messages” (expressed in plain language and for use in the community). The take-home messages were workshopped with parent focus groups. Initial activities revolved around developing and testing the slogans for the overarching message (children need to be more physically active and eating healthier foods) and
26 WHO Collaborating Centre for Obesity Prevention, Deakin University Report 6: Lessons learned from Colac’s Be Active Eat Well project
objectives (More Active Transport, Less Screen Time and More Active Play, More Fruit and Less Energy Dense Snacks, More Water and Less Sweet Drinks). Once these messages were validated, work commenced on developing the logo, working with a graphic design company. The project was officially launched, with its logo and key messages by the Minister for Health, Honourable Bronwyn Pike in May 2003.
Communication Plan The Communication Plan (Section 2 of Appendix E) outlined the protocols to be followed for publication, branding and working with the media that all team members and key stakeholders were required to follow.
o A community derived action plan was developed for the Be Active Eat Well project, which was locally relevant and owned. This document has been flexible and changeable throughout the four years of the project. Using the project action plan as a working document, whose strategies change and adapt as the project is implemented enables flexibility in implementation whilst always keeping the project goals and objectives in sight.
o The Be Active Eat Well project worked in a cooperative and integrated way with the community. This collaborative approach has been achieved through the project’s ability to initiate and sustain partnerships. Local partners provided an incredible amount of expertise and ideas to the project, all based on local experience and knowledge. The result of successful partnership collaboration has been the ability to role out multiple strategies in multiple settings within a three-year time frame.
Lessons learned – The Action Plan
27 WHO Collaborating Centre for Obesity Prevention, Deakin University Report 6: Lessons learned from Colac’s Be Active Eat Well project
4. Process Evaluation Introduction Process evaluation aims to determine fidelity (quality of project implementation), its recruitment, reach, the dose delivered and received, and overall implementation that indicate the extent to which the intervention has been implemented and received by the target group; along with the context in which the project is situated. This section reports on the components of the process evaluation for BAEW Project and summarises the process evaluation reports generated by the Project Coordinators which are available on the ‘Go for your life’ website (www.goforyourlife.vic.gov.au). The reports capture the majority of the components needed for a comprehensive process evaluation [17]. Process evaluation measures were built into the working action plan documents and were supplemented by meetings minutes and other documents as well as follow up key stakeholder interviews. The Project Coordinators decided to record the process evaluation indicators within the action plan, recording them against the strategies for each objective as it was a means to keep regular documentation and checks in place to ensure these were regularly collected and updated as the project evolved through various versions of the action plan. The process evaluation indicators can be viewed in the Action Plan (Appendix D). The main components used for documenting process evaluation data began with the project brief and included minutes of meetings, regular project updates, and versions of the action plan, key stakeholder interviews and reports.
Evaluation components (inputs) One of the major roles of the Project Coordinators was comprehensive record keeping. There were a variety of ways that records were kept over the course of the Project depending on their purpose. Computer files containing the working action plan, work plans, budgets, running logs, processes, minutes of meetings, photos and process evaluation measures were kept as well as copies of all documents generated to implement and evaluate the project.
Evolution of the action plan The action plan and work plans written against objectives formed the basis for the implementation and process evaluation of the project (see Appendix D). The Project Coordinators were responsible for updating the action plan on a regular basis, keeping track of actions against strategies which in turn were the steps required, to meet the objectives. Over the course of the life of the project there were 15 versions of the action plan and each version captured the implementation of the project.
28 WHO Collaborating Centre for Obesity Prevention, Deakin University Report 6: Lessons learned from Colac’s Be Active Eat Well project
Records (minutes, reports) Agendas and minutes from meetings were recorded by the Project Coordinator. The Interim Steering Committee and Local Steering Committee meet on a monthly basis and the Reference Committee met every two months. Discussion on previous actions and expected actions by specific members were recorded so this captured an overview of the running dialogue of the project’s implementation based around the objectives. Regular reports to DHS and other organisations such as the Department of Health and Ageing and VicHealth also contributed to the records.
Project Coordinator diaries Project Coordinators kept ongoing detailed diaries of activities which allowed cross checking of dates and estimations of time allocations for specific project objectives.
Resources produced, policy templates, media coverage etc Many resources were produced as part of the project and these form an important part of the process record. For example Awareness Raising (objective 1) involved the following:
� Newsletter for children � Communication plans � BAEW documentary � Kana Festival � Logos � Media � Parents tip sheets � Project Celebrations � Pictures/photos � Presentations/publications/Conferences � School policies � School staff notes � Social marketing workshop � Website
Project implementation Reports have been generated by the BAEW Project Coordinators on the outputs from the process evaluation from the seven behavioural objectives. The full reports can be viewed from the website links but are summarised below. In addition, there was a huge amount of effort included in the overall social marketing activities, in building community capacity in general, and establishing policies such as school food policies which are likely to be sustainable.
TV Powerdown The BAEW action plan included strategies aimed at decreasing the amount of time that children spend watching television and playing electronic / computer games. The community wanted to include strategies addressing this issue because they saw that the
29 WHO Collaborating Centre for Obesity Prevention, Deakin University Report 6: Lessons learned from Colac’s Be Active Eat Well project
benefits were potentially threefold. It was noted that TV watching is sedentary, often involves mindless snacking and exposes children to advertising of unhealthy foods. From the surveys conducted at baseline across the Barwon-South Western area [18], parents reported that; � children spent an average of 83 minutes watching television each school day. � children spent an average of 12 minutes playing electronic games each day. � 41% of households did not have rules for television watching � 41% of households had the television on during the evening meal every night of the
week � 19% of households had a television in the child’s bedroom. It was decided that the project would promote the implementation of the Planet Health TV Powerdown curriculum (www.planet-health.org) to the seven local primary schools. In addition, the three local secondary schools were keen to be involved so were included. The Planet Health resource outlined a two-week curriculum, aimed at grades 3 and above. The first week required students to monitor their normal TV / video watching and electronic game usage. The second “TV Powerdown” week encouraged children to limit their screen time to 1-2 hours per day.
Summary of results
All schools participated in the TV Powerdown Week commencing the week of May 16th 2005. Teachers were supported with a pack containing TV Powerdown Teacher Notes, The Planet Health TV Powerdown Curriculum and a Curriculum Ideas Sheet. In addition each school received a two week set of TV Powerdown School Newsletter inserts, promotional TV Powerdown Posters and a ‘Switch Off’ TV Children’s Newsletter for each student. Other marketing materials included school newsletter for parents, posters and emails to major employers in Colac and a press release. Parents received basic information about the planned TV Powerdown Week via the school newsletter inserts. Unfortunately, time did not permit the development of the desired parent guidelines and information packages.
Lessons Learned - TV Powerdown
� Few programs exist for addressing TV viewing � Parents had a low awareness of the issues and recommendations around TV/video
viewing and electronic game playing (compared with their knowledge of nutrition and physical activity)
� School teachers and principals were enthusiastic about including health messages into classroom teachings, however, they were also extremely busy professionals and appreciated programs that were quick and easy to implement
Further information is available at the following link: http://www.goforyourlife.vic.gov.au/hav/admin.nsf/Images/TV_PowerDown_Process_Evaluation_Report.pdf/$File/TV_PowerDown_Process_Evaluation_Report.pdf
30 WHO Collaborating Centre for Obesity Prevention, Deakin University Report 6: Lessons learned from Colac’s Be Active Eat Well project
Be Active Eat Well Schools Initiative The report on the BAEW Schools Initiative covered the objectives for sugar drinks/water and energy dense snacks/fruit. BAEW had several strategies that required implementation within primary schools; water policies, school nutrition policies and decreasing sales of sweet drinks in school canteens. In 2005, the BAEW Schools Initiative was developed recognising that teachers have limited time available for additional work but at the same time recognising that primary schools have a significant opportunity to support healthy eating and physical activity promotion strategies in childhood. The BAEW Schools Initiative was based on the internationally recognised “Health Promoting Schools” framework which is underpinned by the philosophy that: � Health and learning are inextricably linked � Health is a resource for living and learning The promotion of both health and learning is core business for schools. Colac primary schools were offered the opportunity and support to create a whole-of-school approach to healthy eating and physical activity which incorporated aspects of the BAEW action plan.
Summary of results
All schools participating in the school nutrition network implemented water bottles in classrooms but did not go as far as to write a water policy. It was decided to address the written water policy in 2005, as part of the BAEW Schools Initiative (under objective 6). This resulted in six of seven local primary schools having a documented and implemented school water policy. During that process, six out of the seven primary schools and two of the three secondary schools in Colac signed the Memorandum of Understanding with Colac Area Health. Dietitians were assigned to participating schools, working parties formed within each school, school audits completed and action plans developed and implemented. Participating schools documented and implemented water, fruit break and school nutrition policies. Four of the seven schools undertook canteen changes and policies.
Lessons Learned – BAEW Schools Initiative
� Multi-strategies were best incorporated into one holistic package for the schools, in this case, the BAEW Schools Initiative.
� Progress was made when meetings were held on site at the school which made it easier for teachers to attend and be engaged rather than expecting them to attend a series of off-site meeting.
� Different schools had different nutrition and physical activity priorities so a flexible program was required to address these differences.
Further information is available at the following link: http://www.goforyourlife.vic.gov.au/hav/admin.nsf/Images/BAEW_Schools_Initiative_Report.pdf/$File/BAEW_Schools_Initiative_Report.pdf
31 WHO Collaborating Centre for Obesity Prevention, Deakin University Report 6: Lessons learned from Colac’s Be Active Eat Well project
Be Active Lunch pack The Be Active Lunch Pack program initiative was undertaken as a strategy to achieve the project’s objective to increase the fruit consumption and decrease the energy-dense packaged snack intake of children. Be Active Lunch Packs were colourfully decorated, cardboard lunchboxes. The lunch packs contained a tub of fruit salad and a chicken and salad wrap. The idea of healthy food “combos” was discussed from the initial stages of the project. Leisure Networks, in its bid to provide the Kid’s – ‘Go for your life’ program developed an example cardboard lunchbox. The BAEW project coordinators investigated the potential for local businesses (fruit and vegetable shops) to sponsor the production and marketing of the lunch packs. These small business owners were reluctant to outlay money on a program with an uncertain outcome. Hence, the BAEW coordinators consulted with the project’s local steering committee and requested funding for a pilot of the program, which was approved. The aims of the pilot program were to significantly increase the fruit intake of children in Colac. The objectives were to pilot the initiative in at least one school, to determine the costs and the demand for Be Active Lunch Packs, and to investigate the potential for a sustainable Be Active Lunch Pack program sponsored by local businesses.
Summary of results
Seven schools participated in the Lunch Pack Pilot in term 4, 2005. Nine schools were initially engaged to be involved in the pilot, out of a possible ten schools in Colac. There was an existing relationship between three local food retailers and some schools, who already provided the canteen service to the school. Two of the schools couldn’t source a retailer who would provide low cost options on a regular basis; hence seven schools participated in the pilot. The piloting of the Be Active Lunch Packs required three main strategies: 1) Resource production and distribution, 2) Education and 3) Social Marketing Overall, 549 lunch packs were sold over the period of 12 weeks in seven schools. The Be Active Lunch Pack pilot program cost $8087.45 (without labour costs) to implement. This calculates to $1.60 per pack in set up costs, without the cost of the food contents. Labour for coordination of the initiative involved approximately 80 hours of time, hence costing $2000-$2400. Based costs and sales from fourth term 2005; businesses did not sponsor the program on an on-going basis.
Lessons learned – Be active Lunch packs
� Schools were interested in the program and participated in the pilot � Insufficient lunch packs were sold to make this a viable, sustainable program
Further information is available at the following link: http://www.goforyourlife.vic.gov.au/hav/admin.nsf/Images/Lunch_Pack_Pilot_Process_Report.pdf/$File/Lunch_Pack_Pilot_Process_Report.pdf
32 WHO Collaborating Centre for Obesity Prevention, Deakin University Report 6: Lessons learned from Colac’s Be Active Eat Well project
After School Activity Program The After School Activity Program was managed by Leisure Networks, a regional network promoting sport and active recreation. It sought to link children up to community clubs and sports groups by first having activities at school in the after school period. A small cost (gold coin) per participant was paid for each session to cover the costs of the coaches and supervisors.
Summary of results
In 2004 and 2005, the clubs who delivered activities included; golf, hockey, soccer, table tennis, scouts, tennis (2 clubs), croquet, tee ball, badminton, ten pin bowling and martial arts. Other key outcomes include: � Over 550 children participated in 12 local sports � Offered and delivered coach training to 12 local clubs � Up to $750 of equipment was supplied to each local club � Clubs were paid for their time, with majority of this funding directed toward coaches
Lessons learned – After School Activity Program
� Providing resources to Leisure Networks to implement this program was a successful strategy, as they are an organisation well qualified, networked and positioned to deliver such a program
� The program was popular and tapped an interest in children and sports clubs, especially in non-mainstream sports
� The program was difficult to sustain on a cost-neutral basis
Further details of the program can be viewed on the following website: http://www.goforyourlife.vic.gov.au/hav/admin.nsf/Images/BAEW_ASAP_Report.pdf/$File/BAEW_ASAP_Report.pdf
Be Active Arts The visual and performing arts were incorporated into the BAEW project as a way to: � Engage children in physical activity who weren’t interested in traditional sport. � Provide an alternative activity to TV viewing and computer games. � Raise awareness of the BAEW project through local festivals e.g. The Kana Festival � Engage disadvantaged children within Neighbourhood Renewal Areas to promote the
key messages of the project through their art work. � Encourage a broader understanding of health and well being through participation in
the after school art and craft sessions, Be Active Arts program and newsletter colouring competitions.
� Promote community participation in the design of social marketing materials for various strategies e.g. Walking School Bus
The Colac Neighbourhood Renewal (CNR) project team were an integral partner for the development and support of arts programs for the BAEW project. CNR had established
33 WHO Collaborating Centre for Obesity Prevention, Deakin University Report 6: Lessons learned from Colac’s Be Active Eat Well project
links with disadvantaged members of the community through its work in promoting consumer participation and the health and well being of the community. The synergies between the projects key objectives produced a powerful alliance between co-located workers and resulted in the joint development and implementation of project strategies. Consumer participation in the arts was also very important to local artists, as there was no formalised association or equipment to support child art programs in Colac. There were challenges and difficulties in supporting strategies with little to no tangible supports or community capacity prior to commencement.
Summary of results
The Be Active Arts program ran successfully for three terms in 2005. It was not run in term 1 of 2006, as it was a short-term due to the Commonwealth Games. It became evident that capacity amongst the artists to deliver the program was low. Hence, Creative Volunteering training was organised for artists to attend to up skill and build their capacity to deliver programs, such as Be Active Arts.
Lessons learned – Be Active Arts
� The After School Activity Program model transferred easily to the Be Active Arts program
� Engaging children who don’t like sports required innovative approaches to promote self-esteem, social inclusion and participation
Further details on the program can be viewed at: http://www.goforyourlife.vic.gov.au/hav/articles.nsf/practitioners/objective_8?Open
Active Transport The promotion of active transport across Victoria has produced some action by local communities to assess and improve their environment to support active transport. This was also part of the BAEW action plan and the Colac Otway Shire took the lead on establishing Walking School Buses in Colac using funding from VicHealth.
Summary of results
After a lot of effort, two walking school buses were established at two primary schools for BAEW. Each ran for one term and walked to school on Tuesdays, Wednesdays and Thursdays. The buses in Term 1 2004 engaged about 8-10 children each and in Term 2 2004 engaged about 2-4 children each. No walking school buses were continuing by 2005. Notable barriers to the program included: � Teasing of children on the walking bus walking with their fluorescent sashes. � Difficulty engaging parents (attendance at planned meetings was low). � This model is supposed to be based on school ownership of the program, but schools
felt somewhat imposed upon as the funding went to local government and not to schools directly.
� Establishing a sustainable group of walking bus leaders.
34 WHO Collaborating Centre for Obesity Prevention, Deakin University Report 6: Lessons learned from Colac’s Be Active Eat Well project
Lessons learned – Active transport
� There is opportunity to increase active transport to school because about half the children living close to school are driven by car
� Walking School Buses seemed like an option for younger students, especially those in their first year of school because this age group requires supervision whilst walking
� However, the program was difficult to establish and was not sustainable
Further details on the program can be viewed at: http://www.goforyourlife.vic.gov.au/hav/admin.nsf/Images/Walking_School_Bus_Report.pdf/$File/Walking_School_Bus_Report.pdf
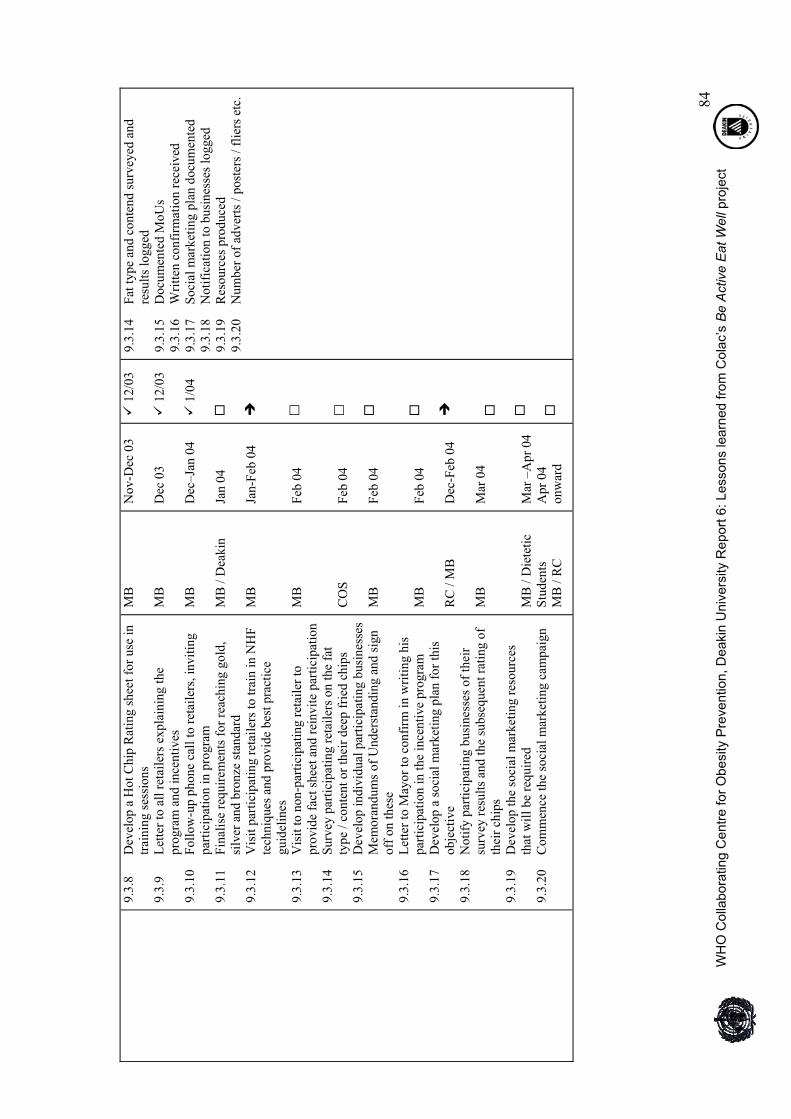
Choice Chips The Choice Chips strategy was based on previous interventions undertaken by the National Heart Foundations in Australia and New Zealand in an attempt to improve the quality of deep fried foods. Hot chips are one of the highest selling food items for takeaway food outlets and are substantial contributors to the population’s intake of fat. They are also a high source of saturated fat because many operators use cooking fats which are based on tallow or palm oil. The aims of the Choice Chips program for BAEW were: 1) to investigate the potential for improving the quality (fat content and type of fat) of deep
fried chips 2) to improve the quality of deep-fried takeaway chips through the implementation of an
incentive program
Summary of results
Only about half of the fast food operators in Colac participated in the program (none of the major chains outlets participated). Following the testing of the fat content of the chips and training programs for participating operators, a reduction of about 7.7 kg per week in total fat and a 50.7 kg per week in saturated fat was seen in participating retailers. The program also showed that the community wanted to eat healthier hot chips but retention of flavour was important.
35 WHO Collaborating Centre for Obesity Prevention, Deakin University Report 6: Lessons learned from Colac’s Be Active Eat Well project
Lessons learned – Choice Chips
� Takeaway food is an important part of the obesogenic environment and there is significant room for improvement in the fat content and type of fat in deep fried foods such as chips
� A substantial amount of effort was needed to convince even a proportion of the operators to change their deep frying practices
� Changing from the cheaper cooking fats which were high in saturated fat to the more expensive oils which were approved by the National Heart Foundation took some initial persuasion but once the operators learnt how to get the maximum frying life from the oil, this did not present an ongoing barrier and reductions in saturated fat are sustainable
� Changing the deep frying practices to reduce total fat content (so called ‘shake, bang, hang’ method) was partially successful with only some operators managing to keep the fat content of their chips below 10% (possibly because of differences in grade of chip and pre-fry treatment at the manufacturing stage)
� The outlet ownership changed hands so often that gaining improvements through a health promotion and recognition program like Choice Chips was not considered sustainable
� Regulations on the maximum saturated fat content of commercial cooking fats and a requirement to test and display the fat content of chips seem like more sustainable options
Further details on the program can be viewed at: http://www.goforyourlife.vic.gov.au/hav/articles.nsf/practitioners/objective_9?Open
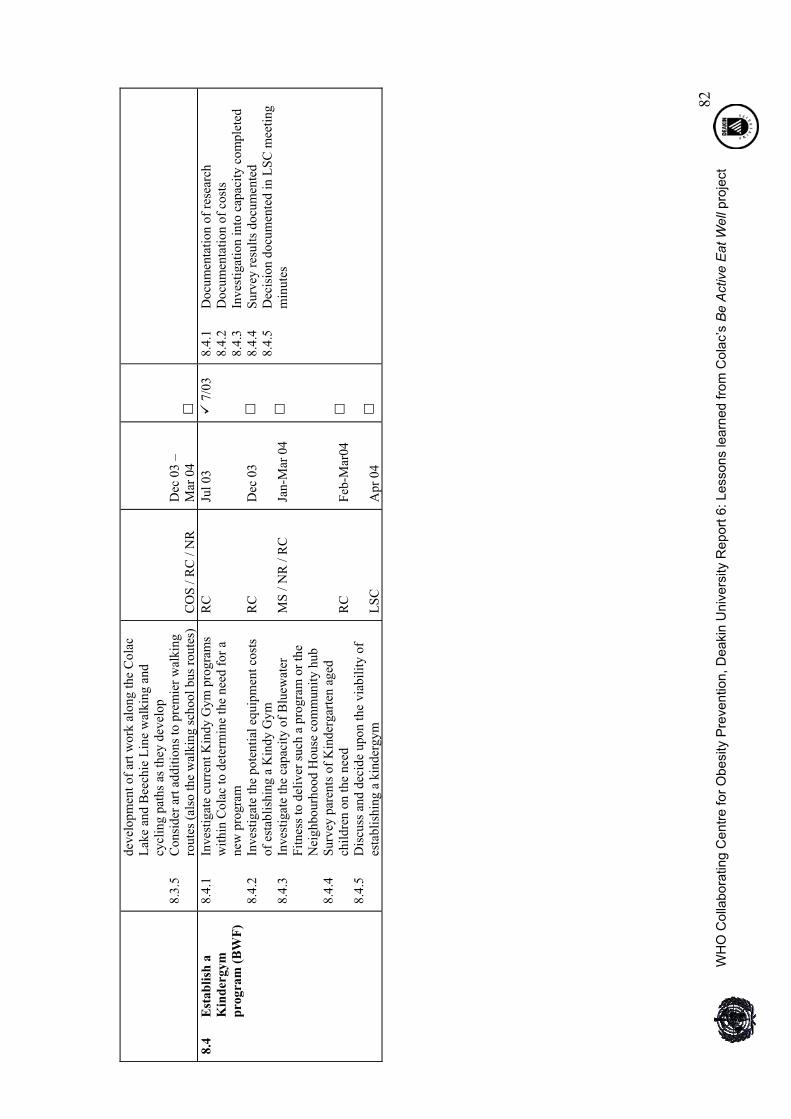
Happy Healthy Families The Happy Healthy Families program was developed to address a community concern for children who were overweight or obese. This concern was identified through the early community consultation processes and the ANGELO workshop, in November 2002. This was incorporated into the BAEW Action Plan as Objective 10; to provide a service to improve the food and physical activity choices for children with or at risk of overweight. ‘The Family Weight Management Program’ was purchased from The Children’s Hospital in Westmead, Sydney to fulfil this need. This program takes a family approach to weight management for children who are overweight or obese. Parents are involved in the program so they can be the agents for change in the family environment. It is an evidence-based program, which was developed in 1998 by the Department of Nutrition and Dietetics at the Children’s Hospital at Westmead. The program evolved into ‘Happy Healthy Families’ to provide peer support to families around the issues of healthy eating, physical activity, parenting skills and self -esteem. The first program was delivered in May of 2004 and since then seven programs have been completed, with 39 participants completing the program so far. This program was run in partnership with Colac Neighbourhood Renewal. The first session placed a strong emphasis on allowing the participants to take ownership of the group by deciding their own group goals. The programs ran for six consecutive weeks, with each
36 WHO Collaborating Centre for Obesity Prevention, Deakin University Report 6: Lessons learned from Colac’s Be Active Eat Well project
session lasting two and a half hours. This was followed up with group discussion about the establishment of group norms. Group norms helped to promote a relaxed and safe atmosphere for participants to feel comfortable about discussing their personal issues and questions.
Summary of results
The evaluation of the program showed that it was highly rated by participants and they were able state a number of specific changes already made at the behavioural level. The sustainability of Happy Healthy Families has been ensured, as Colac Area Health’s Nutrition Department and Colac Neighbourhood Renewal have built it into their on-going work plans.
Lessons learned – Overall project implementation o Many mini-programs or program components were tested up in the BAEW
program and incorporating mini-evaluations into each of these identified the potential impact of the activities, the barriers encountered and the likely sustainability for each component
o While they all contributed to the whole BAEW project and its successful impact on anthropometric outcomes, few of them were sustainable by themselves
o The policy-level changes in the schools were good examples of sustainable change because they became embedded through the system and led to real changes in food choices at school
o Programs which took a large amount of coordinator time, such as Walking School Bus and Choice Chips, turned out to be unsustainable
Lessons learned – Happy Healthy Families program
� There is a need for families to access credible sources of information on healthy eating, physical activity, self esteem and parenting and to be able to discuss issues in a safe environment.
� The initial focus on body weight was counter-productive and a barrier to engaging parents so this needs to be de-emphasized.
� There are not large numbers of people pressing for this type of service at present, so identifying ways to engage people who would benefit from a program like Happy Healthy Families is a challenge
Further details on the program can be viewed at: http://www.goforyourlife.vic.gov.au/hav/admin.nsf/Images/BAEW_Happy_Healthy_Families_Process_Report.pdf/$File/BAEW_Happy_Healthy_Families_Process_Report.pdf
37 WHO Collaborating Centre for Obesity Prevention, Deakin University Report 6: Lessons learned from Colac’s Be Active Eat Well project
5. Overview of Impact and Outcome Evaluation
Design A full description of the evaluation design is included in the accompanying report on Methods and Tools and in the overview paper by Bell et al [14]. Briefly, BAEW had a quasi-experimental, longitudinal design with anthropometric data collected on Colac children in 4 preschools and 6 primary schools at baseline (2003, n=1001, response rate: 58%) and follow-up (2006, n= 844, follow-up rate: 84%). The comparison sample was a stratified random selection of preschools (n=4) and primary schools (n=12) from the rest of the Barwon-South Western region of Victoria, with baseline assessment in 2004 (n=1183, response rate: 44%) and follow-up in 2006 (n=983, follow-up rate: 83%). Figure 3 shows the numbers involved in the impact and outcome evaluations. Other data collection involved a computer assisted telephone interview of parents, a grade 5 and 6 survey, a lunchbox checklist survey, an environmental school audit, and an assessment of capacity building using the Community Capacity Index [19]. The remainder of the Barwon South Western region of Victoria (population 323,000) was the comparison site because it was considered that a cluster randomised trial design would not fit a whole of community intervention and that the remainder of the region would provide a fair comparison population. The Barwon-South Western region (one of nine in Victoria) includes Geelong (population ~200,000) as the regional centre and covers the south-west coast of Victoria and is further broken down into eight networks. It is socio-economically disadvantaged compared to state-wide averages and in 2003, 12% of the population were born overseas. The sample frame for the comparison group was a stratified, random sample of the Barwon-South Western region with the Colac school network and any schools within a 30km radius excluded to avoid possible contamination. The schools and pre-schools across the remaining seven networks were stratified according to enrolment size (large: � 150; small: � 20; not included: < 20) and probability proportional to size (PPS) sampling was used to select large schools across the seven networks. Small schools and pre-schools were drawn from one network (simple random sample) and then PPS was used to select the actual schools. A longitudinal design was used (same children measured at baseline and follow-up) rather than a serial cross-sectional design to give a greater power to detect change. A cohort of about 1800 children (about 900 in each group) gave the power to detect approximately 1kg, 3cm and 0.1kg/m2 difference in weight, waist and BMI respectively, between intervention and comparison children (�=0.05, �=0.80), adjusting for confounders and with school as the primary sampling unit. Three years of intervention duration between measurements was considered long enough to ensure that the interventions had time to take effect and were also sustainable. Due to the nature of the quasi-experimental design, masking of group assignment was not possible.
38 WHO Collaborating Centre for Obesity Prevention, Deakin University Report 6: Lessons learned from Colac’s Be Active Eat Well project
Colac selected as intervention town (target group: children 4-12 years, total n in Colac ~ 2000)
Comparison schools selected using simple random sampling and probability proportional to size sampling methods to ensure similarity to the Colac sample and provide a regionally representative comparison group
All Colac children received intervention. 1001 of 1726 consented to data collection (response rate=58%). Child not available for measurement (n=4).
Loss to follow-up: Withdrawal from study (n=62)
Child moved out of intervention area/no longer in respondent’s care/wrong number (n=7)Parent worried about child’s self esteem/don’t want child measured again (n=21)Parent unwell/too busy for interview (n=14)Parent no longer interested (n=6)No reason given (n=14)
Child not available for measurement (n=96)
Intervention analysed (n=833)Excluded from anthropometry analysis due to: Incorrect data collection procedure
followed (n=6)
Comparison children received background activities only. 1183 of 2687 in selected sample consented to data collection (response rate=44%). Child not available for measurement (n=2)
Loss to follow-up: Withdrawal from study (n=26)
Child moved out of comparison area/no longer in respondent’s care/wrong number (n=7)Child no longer wants to be involved (n=1)Parent unwell/too busy for interview (n=9)No reason given (n=9)
Child not available measurement (n=174)
Comparison analysed on SES (n varied)Excluded from SES analysis due to:
Household income not available due to refusal or unknown (n=187)Maternal education not available/unknown (n=65)Paternal education not available/unknown (n=108)Area level SES^ not available (n=24)
Intervention analysed on SES (n varied)Excluded from SES analysis due to:
Household income not available due to refusal or unknown (n=202)Maternal education not available/unknown (n=128) Paternal education not available/unknown (n=147)Area level SES^ not available (n=22)
Anal
ysis
Follo
w-U
pAl
loca
tion
Enro
lmen
tIntervention Comparison
Comparison analysed (n=974)Excluded from anthropometry analysis due to: Incorrect data collection procedure
followed (n=7)
Figure 3: Flow diagram of participation in Be Active Eat Well evaluation
39 WHO Collaborating Centre for Obesity Prevention, Deakin University Report 6: Lessons learned from Colac’s Be Active Eat Well project
Participants Figure 3 shows the flow diagram of participants in BAEW impact and outcome evaluation and table 2 shows their characteristics. Note that the time between measures was substantially longer (about 1 year) for the intervention group versus the comparison group and because the children were growing and the intervention children had a longer secular exposure, all analyses needed to be adjusted for these differences in duration. The response rate of ~50% raises concerns about the potential selection bias. For example, a higher proportion of children who were overweight or from lower SES backgrounds may have not consented to participate. This would introduce a potential threat to external validity (i.e. whether the findings are representative of, and can be extrapolated to, the wider population). It may also pose a threat to internal validity (i.e. whether the findings are valid for the studied population) if there was a differential consent rate between the intervention and comparison regions which may explain the differential effects. An example of a possible bias from this would be if children were recruited from higher SES families in Colac and from lower SES families the comparison region and these groups were on different natural weight gain trajectories. No data were available on the SES or other characteristics of those who did not consent for the evaluation measurements. Overall the distribution of SEIFA Index quartiles in the intervention and comparison areas was similar. Table 2 Characteristics of the study populations at baseline and follow-up Baseline (2003-4) Follow-up (2006) Intervention Comparison Intervention Comparisonn 1001 1183 833 974 Age, years (sd) 8.21 (2.26) 8.34 (2.22) 11.13 (2.27) 10.31 (2.14)Female (%) 53.6 50.2 53.7 49.1 Height, cm (sd) 128.9 (14.2) 130.5 (13.9)a 146.2 (14.6) 142.3 (13.7)Weight, kg (sd) 30.7(10.4) 31.4 (10.4) 43.3 (14.7) 39.9 (13.3) BMI, kg/m2 (sd) 18.0 (3.0) 17.9 (2.9) 19.7 (3.9) 19.2 (3.6) BMI z score (sd)b 0.63 (0.93) 0.60 (0.88) 0.54 (0.94) 0.58 (0.88) Waist circum. cm (sd) 63.4 (8.9) 63.5 (9.1) 70.7 (11.5) 67.7 (10.7) Waist:height (sd) 0.49 (0.05) 0.49 (0.05) 0.48 (0.06) 0.48 (0.06) Thinness, grades1-3 (%)c 3.11 2.20 3.60 2.36 Overweight (%)3 18.76 19.73 21.61 20.43 Obese (%)3 8.53 6.77 8.76 7.91 Time between measures, years (sd) 2.97 (0.11) 2.11 (0.25)
aSignificantly different from baseline intervention group, p=0.01. bz-BMI: BMI z score calculated against the 2000 CDC growth reference from the United States. cBased on Coles et al (reference 25)
40 WHO Collaborating Centre for Obesity Prevention, Deakin University Report 6: Lessons learned from Colac’s Be Active Eat Well project
Measures The details of all the tools are included in the report on Methods and Tools.
Primary Outcome Measures (Outcome Evaluation) Changes in anthropometric measures of the children and change in community capacity were the primary outcomes. Briefly, the anthropometric outcomes were weight, body mass index (BMI as [weight in kg]/[height in m]2), BMI-z score (z-score is a measure of the standard deviation about the mean BMI for age of a standard population and it accounts for the variation in BMI with age), waist circumference, and waist:height ratio. The changes in community capacity were assessed with key stakeholders using the Capacity Building Index [20]. The Index examined capacity within four domains: Network Partnerships, Knowledge Transfer, Problem Solving, and Infrastructure.
Secondary Outcome Measures (Impact Evaluation) Secondary outcome measures of changes in nutrition and physical activity behaviours related to the intervention objectives were measured by questionnaires. To obtain these measures, parents reported on their child‘s eating and physical activity behaviours through an interviewer-assisted computer assisted telephone interview (CATI). Questions were also included on the home and local environment and at follow up the CATI questionnaire included questions on recall of any BAEW social marketing messages. Grade 5 and 6 children also completed their own surveys relating to their eating and physical activity behaviours on the previous day. In addition, all school-aged children had a lunchbox audit.
Environment Measures Changes to environments in home and community settings related to healthy eating and physical activity were also captured through CATI questions and changes in the school environment related to nutrition and physical activity were captured through a school environment audit questionnaire (adapted from [21]).
Demographic Measures The CATI of parents/guardians was used to capture information regarding parents’ socio-demographic characteristics, including maternal and paternal education level and household income (AUD). These were categorised as follows:
Education: Has completed a University degree; has a Technical and Further Education (TAFE) qualification (eg. diploma, trade qualification); completed secondary school; didn’t complete secondary school, Household income: $100,000+, $75,000-$99,999, $50,000-$74,999, $30,000-$49,999, < $30,000.
We also used the 2001 Socio-Economic Index for Areas (SEIFA) (index of relative advantage/disadvantage) as an area-level indicator of SES. The SEIFA classification used was based on geographic postal area of the child’s residential address and a low score on the SEIFA Index indicates an area of social disadvantage [22]. For analysis, SEIFA scores were classified into high SES and low SES based on the state-wide median [22].
Ethics approval This study was approved by the Deakin University Human Research Ethics Committee, the Victorian Department of Education Employment and Training, and the Catholic
41 WHO Collaborating Centre for Obesity Prevention, Deakin University Report 6: Lessons learned from Colac’s Be Active Eat Well project
Education Office. The trial was registered on the Australian Clinical Trials Registry (ACTRN012607000373471) and results given by the revised CONSORT statement [23].
Statistical analysis BMI (weight in kg/[height in m]2), waist/height ratio and BMI-z score were calculated against the 2000 CDC (Centers for Disease Control) growth reference from the United States using the zanthro module in STATA. Differences in follow-up anthropometry were determined by univariate regression analysis with group assignment (intervention or comparison) entered into the model together with the following covariates: baseline variable, age at follow-up, height at follow-up (for models with BMI, BMI-z score and weight only), gender and time between measurements. Incidence rate ratios were used to determine whether the rate of increase of overweight/obesity was different in the intervention and comparison groups (rate of incidence in the intervention group/rate of incidence in the comparison group). The International Obesity Task Force (IOTF) age-specific BMI cut-offs were also used to classify children’s weight status as either thinness grades 1-3, healthy weight, overweight or obese [23,24] using the LMS Growth, Microsoft Excel module [24]. Analyses were conducted using STATA SE 9.2 with clustering by school at follow-up. In all cases, p<0.05 was considered statistically significant.
Comments on evaluation design On reflection, it is valuable to ask what worked well and what didn’t for the evaluation and how it might be done better in the future.
What worked well
� Partnerships: The close working relationships between the funding body (DHS), the service providers (Colac Area Heath and its partners), the community, and the support and evaluation team (Deakin University) was a real strength, ensuring that the evaluation was closely linked to the intervention.
� Champions: Each of the groups had its champions who provided leadership and support to the project and its evaluation.
� Political support: Community action programs are usually good news stories and have good political support, but this is even more so when there is hard evidence from a rigorous evaluation that the action is making a difference.
� Sample size: The original sample size calculations that about 1000 participants would be needed in each of the intervention and comparison groups turned out to be about right.
� Multi-level measurements: Having data at the individual level, home level and school level will enable multilevel analysis to determine the specific intervention components that led to changes in anthropometry.
Evaluation difficulties
42 WHO Collaborating Centre for Obesity Prevention, Deakin University Report 6: Lessons learned from Colac’s Be Active Eat Well project
� Consent processes: Obtaining active consent was very time consuming for schools and project staff and the delays resulted in differential durations between measurements for the intervention and comparison populations. There are less burdensome consent processes used in similar projects overseas giving a higher response rate and less work for researchers and schools.
� Response rates: The response rate at baseline of about 50% is somewhat of a threat to external validity since some self-selection bias is likely (eg a higher proportion of overweight children not consenting to participate).
� Longitudinal design: This gave the evaluation greater power to detect differences and clearer analysis pathways but it was much more complex and expensive to follow the children after they left primary school or changed schools.
� Baseline timing: The timing of baseline evaluation and the planning ANGELO workshop was problematic because the baseline data should ideally inform the action plan but the action plan should ideally inform what is measured at baseline.
� Evaluation funding: The true costs of the evaluation were substantially greater than the amount allocated directly to the program evaluation and thus there was less capacity for fast feedback of the data into the project and to stakeholders.
� Results feedback: The feedback of information to the community was slower than ideal (above). In addition, the feedback to parents in Colac resulted in some negative responses about the assessment of body size for their child (a handful of parents expressed dissatisfaction that their child was categorised as ‘overweight’). This is an important but sensitive issue and in providing feedback to parents about their child’s height, weight, BMI and weight category (according to NHMRC guidelines) the evaluation team had the material to be given to parents tested several times through the BAEW Local Implementation committee and parent focus groups. Along with the anthropometry information was a specially designed booklet explaining the measurements, their meanings and family options for assessing food and activity choices and options for making healthy choices. More research is needed to develop systems for getting this information back to parents in a way that is helpful, credible and explanatory for them.
43 WHO Collaborating Centre for Obesity Prevention, Deakin University Report 6: Lessons learned from Colac’s Be Active Eat Well project
� It is important to keep the evaluation design as simple as possible, even in comprehensive projects, and to match it to capacity, especially human resources.
� Some simplification is possible in the questionnaires by moving from more comprehensive measures to indicators (eg previous day TV viewing rather than the average for the week) and by seeking only population data outcomes (eg frequencies or means) rather than individual level data
� Given the changes seen in BAEW and other studies now appearing, serial cross-sectional design would be simpler and could even allow for anonymous data collection (i.e. collecting only date of birth and gender), although the analyses become more complex if potential confounders such as SES need to factored in
� Systems for more rapid, helpful feedback to parents the community are needed – further research is needed on these issues
� The options for opt-out consent need to be explored to minimise burdens and increase external validity without sacrificing the rights of parents or children not to participate.
� The evaluation of community interventions needs to move from a single project evaluation to a systems-based approach integrating the measurements with the feedback to and support of the community ‘change-agents’ (parents, schools, local government, health and community organisations).
Lessons learned – Evaluation design and measures
44 WHO Collaborating Centre for Obesity Prevention, Deakin University Report 6: Lessons learned from Colac’s Be Active Eat Well project
6. Findings Anthropometry Height, weight and waist circumference were measured in Colac and the comparison population at baseline and follow up (2-3 years later). Figure 4 shows the differences in outcome measures between comparison (C) and intervention (I) children at follow-up adjusted for covariates [25]. Children in Colac gained less weight (-0.92kg), showed significantly lower increases in waist circumference (-3.14cm), BMI-z score (-0.11) and waist/height ratio (-0.02) compared to the comparison population [25]. The prevalence of overweight and obesity increased in both groups and the incidence of overweight/obesity was not significantly different between the intervention and comparison group (point estimate of incidence rate ratio: 0.91 (95% CI: 0.65-1.28). Importantly, the socio-economic gradient with unhealthy weight gain seemed to flatten out in the Colac group whereas in the comparison group, the expected pattern of the lower SES children gaining more weight than the higher SES children was seen [25].
-3.5
-3
-2.5
-2
.5
-1
-0.5
0
Figure 4:
Anthropometric outcomes of the BAEW intervention.
-1Units of Change
BMI (kg/m2) z-BMI Weight (kg) Waist (cm)
(I vs C)
p = 0.04
p = 0.03
p = 0.01
Since the design of the evaluation was quasi-experimental with one site as the intervention and one region as the comparison, the statistically significant results need to be interpreted in the light of the potential for a Type 1 statistical error – i.e. that significant results were found when in reality, there were no differences. This may have occurred if the natural trajectory of weight gain in Colac was lower than from the rest of the Barwon-South Western region in general. This risk is reduced by having a whole region as the comparison population (rather than just one town) and because Colac is not apparently different from the rest of the region, however, the risk that these findings are due to chance and not the intervention.
45 WHO Collaborating Centre for Obesity Prevention, Deakin University Report 6: Lessons learned from Colac’s Be Active Eat Well project
Doing no harm Examination of a number of ‘safety’ measures showed that the BAEW intervention did not increase the proportion of children participating in behaviours that would put them at increased risk of eating disorders. Specifically, the intervention did not increase:
o The prevalence of thinness/underweight (intervention from 3.1% at baseline to 3.6% at follow up, comparison 2.2% to 2.4%, ns)
o The self-reported level of children’s (grade 5 and 6 at baseline) ‘unhappiness’ (‘fairly’ and ‘extremely’) with their body size (intervention 6.3% to 13.4%; comparison 8.2% to 15.5%; ns)
o The proportion not feeling good about themselves (intervention 2.5% to 9.8%; comparison 2.3% to 4.8%, ns)
o The attempts to lose weight in the previous 12 months (intervention 37.6% to 34.5%; comparison 42.5% to 45.2%, ns)
o The frequency of teasing about weight (intervention 5.3% to 5.7%; comparison 4.1% to 9.5%, ns)
Increases in these variables are likely to be due to the children's transition into adolescence where body dissatisfaction is common, particularly for girls [27].
Lessons learned – Outcome evaluation
� The BAEW significantly reduced unhealthy weight gain although this was not enough to flatten out or reduce the growing prevalence in overweight and obesity in the intervention population,
� The changes were significant at a population level � The flattening of the SES gradient with weight gain is very encouraging
and provides evidence that a community-wide intervention program does not result in increased disparities across the social gradient, and may even help reduce these disparities
� There is now evidence that this type of intervention does not increase risk behaviours related to disordered eating patterns, does not increase stigmatisation or lead to increased dissatisfaction with body weight.
Behavioural changes Behavioural changes observed for the BAEW project are summarised for two broad behaviours: 1) nutrition behaviours; and 2) physically active and sedentary behaviours. Results for measures for each of these sets of behaviours are summarised according for the two conditions, intervention or comparison. Where appropriate, results reported have been adjusted for baseline values as well as for other potential confounding variables (e.g. duration between measurements, gender, age, seasonality).
Nutrition Foods and drinks consumed at home (parent-report)
Figure 5 shows the differences in the average intake of key foods and beverages at follow-up between the intervention and comparison groups. Fruit intake increased by about half
46 WHO Collaborating Centre for Obesity Prevention, Deakin University Report 6: Lessons learned from Colac’s Be Active Eat Well project
a serve more in the intervention group at follow-up. Although not significant, there was also a trend towards a larger increase in vegetables and decrease in fruit juice in the intervention group at follow-up. The consumption of packaged snacks, takeaway foods and soft drink changed by about the same amount in the intervention and comparison groups.
-0.2
-0.1
0.0
0.1
0.2
0.3
0.4
0.5
Package d Snacks
Fruit Vegetables Takeaway Foods
Fruit juice Soft drink
*
* p =0.02
Difference in serves
at follow-up
(I vs C)
^Difference adjusted for baseline consumption, age, gender, BMI and clustering by school
Figure 5: Differences in number of serves consumed by children at follow-up between
Intervention (I) and Comparison (C) group.
Foods and drinks brought to school (School Food Checklist)
Although the data are not shown here, there was no effect of the intervention on the amount of fruit or vegetables brought to school by children. The frequency of vegetables in children’s lunchboxes was very low across the study and did not increase as a result of the intervention. At baseline, fruit was found in about 70% of children’s lunch boxes and this did not increase as a result of the intervention. However, the BAEW intervention resulted in significant increases in the amount of water brought to school, with intervention children bringing on average 220mL more water to school than the comparison group (Figure 6). In addition, intervention children brought 110mL less sweet drinks to school. Although BAEW used multiple strategies, the increase in water most likely occurred because of the provision of water bottles to each BAEW child and the implementation of water policies. This resulted in an increase in both the number of children bringing water to school and the volume that they were bringing. Additional
47 WHO Collaborating Centre for Obesity Prevention, Deakin University Report 6: Lessons learned from Colac’s Be Active Eat Well project
restrictions placed on the beverage permitted in the bottle, and the types of beverages sold at the canteen were also likely to have contributed to the changes seen in beverages overall.
-0.6 -0.4 -0.2 0.0 0.2 0.4 0.6 0.8 1.0
Water Sweet drinks†
Change from baseline
Intervention Comparison *
* p <0.001 † Sweet drinks consist of fruit juice/cordial and soft drink category
Figure 6: Adjusted mean change in beverage serves in Be Active Eat Well Figure 7 shows that the BAEW intervention did not decrease the amount of energy-dense, nutrient-poor (EDNP) snacks brought to school by the intervention children compared to those in the comparison group. In most of the BAEW schools, the implementation of nutrition policies limited the availability and promotion of EDNP snacks in the school environment; however there were no restrictions on what could be brought to school from home – which is where the majority of these food items came from. The reduction in these snack foods in the comparison group was surprising and it is unclear why this occurred. Although the comparison students in this study were not exposed to any of the components of BAEW, it is possible they were involved in projects with similar messages within their own school. The comparison schools would have been exposed to state and nation-wide health promotion campaigns such as Kids- ‘Go for your life’ and the ‘Go For Two and Five’. These factors combined with increasing media coverage regarding the nutritional value of foods at school may have increased awareness of the issues in the comparison group. The increase seen in chocolates and lollies was unexpected and is likely to be an artefact of the timetabling of data collection in intervention schools. The data collection from intervention schools happened to be close to the Easter break, which meant that there was a higher frequency of chocolate (in the form of Easter eggs) brought to school at that time.
48 WHO Collaborating Centre for Obesity Prevention, Deakin University Report 6: Lessons learned from Colac’s Be Active Eat Well project
Figure 7: Adjusted mean change in serves of key foods in Be Active Eat Well
� The BAEW intervention resulted in increased consumption of fruit and water and decreased consumption of sweet drinks at school
� Reducing sweet drink consumption at school should one of the first actions because it seems readily achievable and can be embedded into policies
� The frequency of fruit brought to school was reasonably high already and probably represents a lower priority for interventions
� The continued high intake of energy dense snacks represents a immediate priority for early and sustained intervention action
� The results appear to mirror the level of intervention dose across the various key foods and beverages
� The higher frequency of chocolates in the lunch box in the intervention group was probably an artefact of timing, but it does highlight the need for care in data collection timetabling
� Even significantly resourced community projects like BAEW need to find more effective ways to create further changes towards healthier eating patterns
49 WHO Collaborating Centre for Obesity Prevention, Deakin University Report 6: Lessons learned from Colac’s Be Active Eat Well project
Physically active and sedentary behaviours The changes in time spent playing outside after school, watching TV (all day) and playing electronic games (all day) for the previous for the two surveys were computed for the intervention and comparison samples. This information is summarised in Figure 8.
-30
-20
-10
0
10
20
30
40
50
60
1 2 3
Tim
e (m
inut
es)
Intervention
Comparison
Change in time playing outside
after school (previous day)
Change in time watching TV
(previous day)
Change in time playing electronic
games (previous day)
Figure 8: Summary of (adjusted) change in outside play, watching TV and playing
electronic games for intervention and comparison samples. There was a marked increase in time spent playing outside after school for the intervention sample while the comparison sample showed a slight decrease. Differences in changes for TV watching and playing of computer games were mixed. For TV watching, the intervention sample showed a possible slight increase while the comparison sample reduced slightly. Trends for time playing computer games showed an opposite pattern, however none of these changes were statistically significant. Similarly there was no change in active transport to and from school.
Lessons learned – Physical Activity patterns
� The changes in physical activity mirrored the ‘dose’ of intervention in Colac – more was done to increase organised activity than was done to increase active transport or decrease television viewing
� Reducing TV viewing will be a real health promotion challenge because of low levels of awareness of the problem and difficulty in influencing an activity that takes place inside homes.
50 WHO Collaborating Centre for Obesity Prevention, Deakin University Report 6: Lessons learned from Colac’s Be Active Eat Well project
Environmental Audits Details of the environmental audits are shown in Appendix F.
The nutrition environment Written Healthy Eating Policies At baseline, there were 0/6 intervention schools with written policies promoting healthy eating, but at follow-up there were 5/6 schools with written policies. At baseline, there were 4/12 comparison schools with a written policy and at follow-up there were 5/12 schools with a written policy. Thus, the majority of the intervention schools implemented written healthy eating policies between baseline and follow-up, while the comparison schools did not. Analysis of the written Healthy Eating Policies Analysis of the written healthy eating policies is presented in Table F.2 (Appendix F). Data from the intervention schools could only be analysed at follow-up, because there were no schools at baseline with a written healthy eating policy. Therefore, follow-up data showed that all 5/6 intervention schools had a policy that included the availability of water, teaching on nutrition, setting aside adequate time for lunch, and encouraging children to adopt healthy eating behaviours. Most policies included what food is available, providing information to parents about healthy food/eating, staff acting as role models, food association with fundraising and special events and operating food service for profit. The type of food that may be brought from home and restricting access to stores/outlets featured minimally in the policies and vending machines at school were not included in any of the school policies. In comparison schools at follow-up, the written policies incorporated areas dealing with foods associated with special events and not operating the food service for profit. The majority of areas included in the written policies were similar at follow-up between the intervention and comparison schools. Effectiveness of the written Healthy Eating Policies Effectiveness of the written healthy eating policies was also examined. The data from intervention schools shows that the 5/6 schools with a policy at follow-up rated their policy as being very effective. Therefore, not only are they now writing policies, but some are regarding them as being very effective. Of the 5/12 comparison schools with a healthy eating policy, all still regard the policies as only moderately effective. Level of priority for nutrition The level of priority for nutrition in the school also was assessed by participants. There was an increase in the level of priority in the intervention schools as 6/6 participants rated their school’s priority for nutrition to be good to very good, compared to 0/6 at baseline. In the comparison schools there was some increase in the level of priority for nutrition (from 4/12 to 8/12 participants rating it as good or very good). The Food Service Sixteen out of the 18 schools participating in this study had a food service available for students to purchase food and drink at school. There was either an external lunch order service (LOS) that was usually provided by a local café or shop, with foods ordered delivered to the school or a canteen on site available for students to purchase food. At baseline, 6/6 intervention schools had a LOS, but at follow-up, only 1/6 schools offered a
51 WHO Collaborating Centre for Obesity Prevention, Deakin University Report 6: Lessons learned from Colac’s Be Active Eat Well project
LOS. There were 3/6 intervention schools with a canteen at baseline and at follow-up this increased to 5/6. Of these schools, only 1/6 offered both a LOS and canteen service (on different days). In the comparison schools, 7/12 had a LOS at baseline and this dropped to 6/12 at follow-up. There was no change in the number of canteens available, as they remained at 5/12 at both baseline and follow-up. There were 2 schools, one each from the intervention and comparison group that did not offer any food service to the students. When examining foods available at the schools, we have combined the data from the LOS and canteen and have presented it as information on the food service.
Availability and cost of key food and drinks available from the Food Service The availability of six particular food items which included both healthy and unhealthy options from the food service was examined (fruit, milk, fruit juice, pies, crisps and filled rolls) and is shown in Table F.3 (Appendix F). There was no substantial change in the availability of these key foods as a result of the BAEW intervention. In addition, the costs of these items remained the about the same across the intervention period, although the cost of filled rolls (which were already the most expensive item) increased in both intervention and comparison schools (Table F.4). Nutritional value of food service Staff from the schools were asked to rate the nutritional status of foods available from the food service by rating the following statement “Our food service mainly provides foods with high nutritional value”. Their answers are shown in Table F.5. At baseline most intervention respondents believed that their food service did not offer foods with high nutritional value and at follow-up, half agreed and half disagreed. Although the respondents’ perception of the food service improved in both groups, as discussed above, the actual foods and drinks available did not substantially change. School sponsorship and fundraising events The BAEW intervention resulted in a decrease in the number of schools with soft drink/fast-food sponsorship of fundraising or events at school compared to comparison schools where sponsorship and fundraising events occurred almost twice as frequently (Table F.6).
The physical activity environment Written Physical Activity Policies Most schools had some type of policy promoting physical activity (PA) and at follow-up there was a similar proportion of schools with a written PA policy in both groups. Analysis of the written Physical Activity Policies The areas covered in the written physical activity policies are shown in Table F.7 and these show that there was an increase in policies allowing access to equipment; encouraging cycling to school, using hats for outside play and ensuring all students can participate in physical activity at follow-up although this was no different between intervention and comparison schools.
52 WHO Collaborating Centre for Obesity Prevention, Deakin University Report 6: Lessons learned from Colac’s Be Active Eat Well project
Time devoted to formal Physical education/Sport at school per week The time devoted to formal physical education/sport per week, for each primary school year level is shown in Table F.8 and shows that there was a decrease in the average hours devoted to formal Physical Education/Sport in both groups across most year levels.
Lessons learned – Nutrition and Physical Activity School Environment
� Implementation of comprehensive nutrition policies was higher as a result of the BAEW intervention
� The intervention also resulted in reduced sponsorship of fundraising and school events by companies selling unhealthy products
� Between 2003 and 2006, however, there was much public debate about the nutrition and physical activity environments in Victorian schools and this probably accounts for some of the improvements in both intervention and comparison schools for the many of the environmental outcomes examined
� The decrease in formal PE across all age groups in both intervention and comparison schools is a concern and needs to be addressed
� The continued provision of predominately unhealthy items by the school food service and the unattractive pricing of healthy items need to be addressed at a policy level in order to create the substantial and sustained changes needed.
Community Capacity Building
Community Capacity Index The Community Capacity Index [19] was administered to measure the change in capacity within Colac to promote healthy eating and physical activity. Further it was implemented to gather evidence about the available capacity and to map that evidence against a set of indicators within four domains: Network Partnerships, Knowledge Transfer, Problem Solving and Infrastructure. Overall, capacity demonstrably increased in all four domains between baseline (time 1) and follow-up (time 2; Figures 9-12). Level one indicator represent relatively straight forward indicators of capacity for Network Partnerships, Knowledge Transfer and Problem Solving and they usually scored higher than level two and three indicators which represent more complex project network processes (Figures 9-11). Within the Infrastructure domain (Figure 12), achieved capacity was lowest for financial investments and highest for social investments at baseline. At follow-up, achieved capacity for the first three domains of Network Partnerships, Knowledge Transfer and Problem Solving (Figures 9-11) were relatively equivalent across the three levels. Financial Investment within the Infrastructure domain (Figure 12) achieved a lower capacity than the other investment areas. Policy investment made the highest gain from baseline to follow-up within this domain.
53 WHO Collaborating Centre for Obesity Prevention, Deakin University Report 6: Lessons learned from Colac’s Be Active Eat Well project
Network Partnerships
0
1
2
3
4
Level 1 Level 2 Level 3
Capacity Level
Ach
ieve
d C
apac
ity
(mea
n) Time 1Time 2
Figure 9: Achieved capacity for the domain of Network Partnerships at baseline and follow-up
Knowledge Transfer
0
1
2
3
4
Level 1 Level 2 Level 3
Capacity Level
Ach
ieve
d C
apac
ity
(mea
n) Time 1Time 2
Figure 10: Achieved capacity for the domain of Knowledge Transfer at baseline and follow-up
54 WHO Collaborating Centre for Obesity Prevention, Deakin University Report 6: Lessons learned from Colac’s Be Active Eat Well project
Problem Solving
0
1
2
3
4
Level 1 Level 2 Level 3
Capacity Level
Ach
ieve
d C
apac
ity
(mea
n) Time 1Time 2
Figure 11: Achieved capacity for the domain of Problem Solving at baseline and follow-up
Infrastructure
0
1
2
3
4
Polic
y Inv
estm
ent
Fina
ncial
Inve
stm
ent
Hum
an/In
telle
ctual
In...
Socia
l Inv
estm
ent
Capacity Type
Achi
eved
Cap
acity
(mea
n)
Time 1Time 2
Figure 12: Achieved capacity for the domain of Infrastructure at baseline and follow-up
Further details of the implementation and results from the Community Capacity Index can be seen in Appendix G.
55 WHO Collaborating Centre for Obesity Prevention, Deakin University Report 6: Lessons learned from Colac’s Be Active Eat Well project
Community Readiness to Change The Community Readiness to Change tool (Appendix H) was only administered at the completion of the BAEW Project to assist in explaining changes in the outcome variables of the project and potentially contributing to recommendations for ensuring sustainability. The tool was adapted for community-based obesity prevention from the generic tool [28]. The administration of the tool provided useful qualitative data on the community’s strengths and barriers to the implementation of the project. A more detailed review of the transcripts including quotes from participants is included in Appendix H. Twelve key stakeholders were interviewed against a pre-determined set of questions in each dimension and their responses were scored against a set of standard statements to determine the community’s readiness to change. Using the Community Readiness to Change assessment at the completion of the project showed that the BAEW project was, overall, at the ‘Initiation’ Stage of Readiness, having an overall score of 6. The ‘Initiation’ Stage is described as having enough information available to justify efforts and activities are underway. The scores for each dimension was as follows Dimension A. Community Knowledge about the Issue
BAEW was at Stage 5: Preparation o Active leaders begin planning in earnest o Community offers modest support of efforts
Dimension B. Existing Community Efforts
BAEW was at Stage 7: Stabilisation o Activities are supported by administrator or community decision
makers o Staff are trained and experienced
Dimension C. Community Knowledge of the Efforts
BAEW was at Stage 6: Initiation o Enough information is available to justify efforts o Activities are underway
Dimension D. Leadership
BAEW was at Stage 6: Initiation (as above) Dimension E. Community Attitudes
BAEW was at Stage 6: Initiation (as above) Dimension F. Resources Related to the Issue
BAEW was at Stage 6: Initiation (as above)
56 WHO Collaborating Centre for Obesity Prevention, Deakin University Report 6: Lessons learned from Colac’s Be Active Eat Well project
Analysis of the qualitative data from the twelve key stakeholders interviewed gave insight into the community’s strengths and the barriers to the implementation of the project. A series of key questions were analysed and the following is a summary of the overall responses (more detail can be found in Appendix H). What worked well out of these prevention efforts? When answering this question a few respondents referred to specific programs that had been implemented. Overall, the majority agreed that the After School Activity Program was the most successful program, followed by the ‘Be Active Schools Initiative’ then the Healthy Happy Families parenting program. Other respondents spoke in a more general way when answering this question. A few mentioned capacity building aspects that have occurred throughout the project for a range of groups and that the capacity of the groups to work together had increased. Also, the partnerships that have developed and been integral to the BAEW Project were recognised. One respondent acknowledged how the community was receptive to trialling BAEW’’s strategies and then being able to see the results for themselves, thus the community did not require much convincing to get them onboard. This was probably in part due to the decision by the Project Coordinator to start with some of the easier strategies of the action plan, get them underway to assist in keeping the momentum going and getting some runs quick results. Also it was acknowledged that the Council’s commitment to the Project was a major benefit as they were prepared to take on strategies of their own in partnership with local key stakeholders. What could be improved of these prevention efforts? Overall, seven main themes emerged when analysing the responses from the key stakeholders. These were around partnerships; engagement of parents and the community; having higher profile champions; having more policy based approaches; government approaches and support; resources; and communication. Is there a need to expand these effort/services? If not, why not? The majority of respondents agreed that the efforts and services created by BAEW needed to be at least maintained or expanded. However the sustainability of the programs put in place by BAEW was highlighted as a concern due to the capacity (resources) required to continue or maintain the efforts. What are the obstacles to promotion of physical activity and or healthy eating in your community? A number of respondents spoke about the broader picture in terms of influences from the macro environment. These included ‘TV advertising, the fast food industry and other groups or organisations or businesses that promote products for kids that promote sedentary behaviour and unhealthy eating that require counteracting at a broader level than at the community level’; …and ‘the availability of, and the number of outlets that provide energy dense foods’.
57 WHO Collaborating Centre for Obesity Prevention, Deakin University Report 6: Lessons learned from Colac’s Be Active Eat Well project
Another theme that was emphasised was the competing priorities of health and education in the school setting against other core curriculum items and the question of responsibility of schools to promote health, and if doing so the support (e.g. canteen managers network) to do it well. The urban environment, transport in and around Colac and lack of public transport, the weather and perceived lack of initiatives to be physically active in winter months and ‘stranger danger’ was considered an issue by a few respondents. One respondent saw the obstacle not as the promotion of physical activity and healthy eating but more the uptake of those messages and another saw it in terms of understanding messages.
Lessons learned – community capacity
� The Colac community’s capacity to promote healthy eating and physical activity had increased significantly over the course of BAEW
� Attained capacity at the end of the project was rated at the stage 6 (‘initiation’: activities are underway) of 9 stages of community readiness suggesting that there is still some distance to go before the community and organisations in Colac can be considered to be at full ownership and effectiveness.
� Nevertheless, the Colac BAEW team has been an invaluable source of expertise for other communities taking on similar challenges, so they are clearly providing leadership for Victoria (and beyond)
� Resources main a critical determinant of capacity � Forces outside the control of the community (such as the promotion of and access to
high-fat and high sugar foods) remain a significant challenge for efforts to improve children’s nutrition
� Engaging parents, promoting program champions, securing extra resources, and having more policy-based approaches would improve the prevention efforts
�
58 WHO Collaborating Centre for Obesity Prevention, Deakin University Report 6: Lessons learned from Colac’s Be Active Eat Well project
7. Conclusions The Colac Be Active Eat Well program provides ‘proof-of-principle’ that whole-of-community approaches to obesity prevention can increase community health promotion capacity and have a significant impact on reducing unhealthy increases in children’s weight and waist. This is the first such evidence that whole-of-community programs in Australia can have an impact on unhealthy weight gain in primary school children. Importantly, there was no evidence of harm and very strong evidence that the program reduced inequalities by reducing the SES gradient with body weight. Changes were found in some, but not all, of the expected mediators (awareness of key messages and changes in attitudes, knowledge and behaviour). The BAEW efforts need to continue in Colac because the intervention only slowed the increase in overweight and obesity and did not halt or reverse it. The evidence and lessons learnt from this and similar projects need to be applied widely throughout Victoria and Australia. This will involve building the systems of monitoring, community capacity building and program development.
59 WHO Collaborating Centre for Obesity Prevention, Deakin University Report 6: Lessons learned from Colac’s Be Active Eat Well project
8. Publications The publications arising to date from the BAEW project are listed below;
1. Sanigorski AM, Bell AC, Kremer PK, Swinburn BA. Lunchbox contents of Australian school children: room for improvement. Eur J Clin Nutr 2005;11: 1310-6
2. Swinburn BA, Carter R, Haby M, Moodie M, Bell AC. Childhood obesity – where are the solutions? Proceedings of the Ann Nutr Metab 18th International Congress of Nutrition; 2005 Sept 19-13; Durban, South Africa
3. Swinburn BA, Bell AC. A comprehensive approach to obesity prevention. In: Clinical Obesity. Kopelman P, Caterson I, Dietz W editors:, Blackwell Publishing 2005 . p. 456-72.
4. Kremer PJ, Bell AC, Swinburn BA. Calibration and reliability of a school food checklist: a new tool for assessing school food and beverage consumption. Asia Pac J Clin Nutr 2006; 15(4):465-73
5. Kremer PJ, Bell AC, Sanigorski AM, Swinburn BA. Overweight and obesity prevalence in children based on 6-month or 12-month IOTF cut-points: does interval size matter? Int J Obes (Lond). 2006; Apr;30(4):603-5
6. Sanigorski AM, Bell AC, Swinburn BA. Association between intake of sweetened beverages and obesity in Australian school children. Public Health Nutr 2007; Feb;10(2):152-7
7. van Zutphen M, Bell AC, Kremer PJ, Swinburn BA. Association between the family environment and television viewing in Australian children. J Pediatr Child Health .2007 Jun; 43(6):458-63
8. Swinburn BA, Bell C, King L, Magarey A, O’Brien K, Waters E. Obesity prevention programs demand high quality evaluations. Aust N Z J Public Health 2007 Aug; 31(4):305-7
9. Gibbs L, O’Connor T, Waters E, Booth M, Walsh O, Green J, Bartlett J, Swinburn BA. Body image considerations for school-based child obesity prevention research Int J Pediatr Obes (in press, accepted 01/07)
10. Sanigorski AM, Bell AC, Kremer PJ, Swinburn BA. High childhood obesity in an Australian population. Obesity (Silver Spring) 2007; 15 (8): 1908-1912.
60 WHO Collaborating Centre for Obesity Prevention, Deakin University Report 6: Lessons learned from Colac’s Be Active Eat Well project
11. Swinburn BA. Preventing obesity: selecting the best investments. In: The challenge of obesity in the WHO European Region and the strategies for response. In:. Branca F, Nikogosian H, Lobstein T, editors. WHO Regional Office for Europe. 2007, p. 238-42. Copenhagen ISBN 978 92 890 1408 3.
12. Lobstein T, Swinburn B. Health promotion to prevent obesity: evidence and policy needs. In: McQueen D, Jones C, editors. Global Perspectives on Health Promotion Effectiveness, International Union of Health Promotion and Education. New York, NY : Springer, c2007. ISBN 9780387709734.
13. Bell AC, van Zutphen M, Simmons A, Sanigorski A, Swinburn BA. Mid-intervention impact of ‘Be Active Eat Well’. Progress in Obesity Research (in press, accepted 11/06)
14. Swinburn B, King L, Bell C, Magarey A, O'Brien K, Waters E. Obesity prevention evaluations (right of reply). Aust N Z J Public Health 2008 Feb;32 (1):86.
15. Sanigorski AM, Bell AC, Kremer PJ, Cuttler R, SwinburnBA. Reducing unhealthy weight gain in children through community capacity-building: results of a quasi-experimental intervention program, Be Active Eat Well. Int J Obes (Lond).2008 Jul; 32(7); 1060-7.
16. Swinburn BA. Obesity prevention in children and adolescents. Psych Clinics N Am Jan 2009; 18(1):209-23
17. Bell AC, Simmons A, Sanigorski AM, Kremer PJ, Swinburn BA. Preventing childhood obesity: the sentinel site for obesity prevention in Victoria, Australia. Health Prom Int. 2008 Dec;23(4):328-36
61 WHO Collaborating Centre for Obesity Prevention, Deakin University Report 6: Lessons learned from Colac’s Be Active Eat Well project
9. References [1] Magarey AM, Daniels LA, Boulton TJ. Prevalence of overweight and obesity in
Australian children and adolescents: reassessment of 1985 and 1995 data against new standard international definitions. Med J Aust. 2001;174(11):561-4.
[2] Haslam DW, James WP. Obesity. Lancet. 2005 Oct 1;366(9492):1197-209. [3] Lobstein T, Bauer L, Uauy R. Counting the costs: the physical, psychosocial and
economic consequences of childhood obesity. Obes Rev. 2004;5:4-32. [4] Olshansky SJ, Passaro DJ, Hershow RC, Layden J, Carnes BA, Brody J, et al. A
potential decline in life expectancy in the United States in the 21st century. N Engl J Med. 2005 Mar 17;352(11):1138-45.
[5] Booth ML, Chey T, Wake M, Norton K, Hesketh K, Dollman J, et al. Change in the prevalence of overweight and obesity among young Australians, 1969-1997. Am J Clin Nutr. 2003 Jan;77(1):29-36.
[6] Sanigorski A, Bell, AC., Kremer, P., and Swinburn, B. High childhood obesity in an Australian population. Obesity. 2007;15(8):1908-12.
[7] ABS (Australian Bureau of Statistics). 1995 National Nutrition Survey. Australia. Canberra: Commonwealth of Australia, ABS, CAT. No. 4802.0; 1997.
[8] Cook P, Rutishauser IHE, Seelig M. Comparable data on food and nutrient intake and physical measurements from the 1983, 1985 and 1995 National Nutrition Surveys. Brisbane: Australian Food and Nutrition Monitoring Unit; 2001..
[9]. Booth M, Okely AD, Denney-Wilson E, Hardy L, Yang B, Dobbins T. NSW Schools Physical Activity and Nutrition Survey (SPANS) 2004: Full Report. Sydney: NSW Department of Health, 2006.
[10] Summerbell CD, Ashton V, Campbell KJ, Edmunds L, Kelly S, Waters E. Interventions for treating obesity in children. Cochrane Database Syst Rev. 2003(3):CD001872.
[11] Doak CM, Visscher TLS, Renders CM, Seidell JC. The prevention of overweight and obesity in children and adolescents: a review of interventions and programmes. Obesity Rev. 2006;7:111-36.
[12] Economos CD, Hyatt RR, Goldberg JP, Must A, Naumova EN, Collins JJ, et al. A community intervention reduces BMI z-score in children: Shape Up Somerville first year results. Obesity (Silver Spring, Md). 2007;15(5):1325-36.
[13] Taylor RW, McAuley KA, Barbezat W, Strong A, Williams SM, Mann JI. APPLE Project: 2-y findings of a community-based obesity prevention program in primary school age children. Am J Clin Nutr. 2007;86(3):735-42.
[14] Bell AC, Simmons A, Sanigorski AM, Kremer PJ, Swinburn BA. Preventing childhood obesity: the sentinel site for obesity prevention in Victoria, Australia. Health Prom Int. 2008 Dec;23(4):328-36
[15] Smith B, Tang K, Nutbeam D. WHO Health Promotion Glossary: new terms. Health Prom Int. 2006;21(4):340-5.
[16] Swinburn B, Egger, G. and Raza, F. Dissecting obesogenic environments: the development and application of a framework for identifying and prioritizing environmental interventions for obesity. Prev Med. 1999;29(6 Pt 1):563-70.
[17] Steckler A, Linnan L. Process evaluation for Public Health Interventions and Research. San Francisco: Jossy-Bas; 2002.
62 WHO Collaborating Centre for Obesity Prevention, Deakin University Report 6: Lessons learned from Colac’s Be Active Eat Well project
[18] van Zutphen M, Bell AC, Kremer PJ, Swinburn BA. Association between the family environment and television viewing in Australian children. J J Pediatr Child Health 2007;43(6):458-63.
[19] Bush R, Dower J, Mutch A. (Centre for Primary Health Care, The University of Queensland)Community Capacity Index, Version 2. Queensland, Australia: The University of Queensland; 2002.
[20] Bush R, Dower J, Mutch A. (Centre for Primary Health Care, the University of Queensland). Community Capacity Index Manual: Version 2. Queensland, Australia: The University of Queensland; 2002.
[21] Carter MA, Swinburn B. Measuring the 'obesogenic' food environment in New Zealand primary schools. Health Prom Int. 2004 Mar;19(1):15-20.
[22] Australian Bureau of Statistics. Information Paper: Census of Population and Housing -- Socio-Economic Indexes for Areas, Australia. Canberra: The Australian Bureau of Statistics; 2001. Report No.: 9039.0.
[23] Mohor D, Schultz KF, Altman DG. The CONSORT statement: revised recommendations for improving the quality of reports of parallel-group randomised trials. Clin Oral Invest. 2003;7:2-7.
[24] Cole TJ, Bellizzi MC, Flegal KM, Dietz WH. Establishing a standard definition for child overweight and obesity worldwide: international survey. BMJ. 2000 May 6;320(7244):1240-3.
[25] Cole TJ, Flegal KM, Nicholls D, Jackson AA. Body mass index cut offs to define thinness in children and adolescents: international survey. BMJ. 2007 Jun 25;335(7612):194.
[26] Sanigorski AM, Bell AC, Kremer PJ, Cuttler R, SwinburnBA. Reducing unhealthy weight gain in children through community capacity-building: results of a quasi-experimental intervention program, Be Active Eat Well. Int J Obes (Lond).2008 Jul; 32(7); 1060-7.
[27] Hill AJ. Motivation for eating behaviour in adolescent girls: the body beautiful. Proc Nutr Soc. 2006 Nov;65(4):376-84.
[28] Plested BA, Edwards RW, Jumper-Thurman P. Community readiness: A Handbook for Successful Change: Fort Collins, CO: Tri-Ethnic Center for Prevention Research, Colorado State University 2005.
63 WHO Collaborating Centre for Obesity Prevention, Deakin University Report 6: Lessons learned from Colac’s Be Active Eat Well project
Appendices Appendix A: BAEW Project Brief
Within the brief, the goal of BAEW was to improve the health and wellbeing of individuals and strengthen communities through a coordinated set of initiatives based on healthy eating and physical activity. The objectives were five-fold:
1) enhance social and cultural environments that support and endorse healthy eating and physical activity (including increased personal and community recognition)
2) enhance physical and economic environments that support and enable healthy
eating and physical activity
3) increase social capital and enhance the health promoting aspects of the local community
4) increase community and individual awareness of the importance and benefits and
opportunities for healthy eating and physical activity
5) increase the proportion of the community adopting healthier approaches to eating and adequate physical activity (as defined by Australian Dietary Guidelines and Australian Physical Activity Guidelines).
64 WHO Collaborating Centre for Obesity Prevention, Deakin University Report 6: Lessons learned from Colac’s Be Active Eat Well project
Appendix B: Terms of Reference
Be Active Eat Well Interim Steering Committee Effective Date: 16 July 2002 Review Date: 16 January 2003 Co-ordinating Responsibility:
Colac Area Health
Authorised by: Director Primary Care, Colac Area Health Distribution: Colac Area Health B. A.E. W working party Purpose:
To guide the initial program development towards an Action Plan for the BAEW project.
Terms of Reference Objectives: I) To establish a partnership between Colac Area Health, Dept of
Human Services, Deakin University, and Colac Otway Shire, that will lead to the development of a local steering committee with broad community representation by the end of October 2002 2) To employ and resource a project worker, within 2 months 3) To support the project worker to identify local communities needs. 4)To oversee the training workshops 5)To develop a 3 year draft Action Plan, with significant detail for the first 12 months, by end Oct 2002
Facilitator:
By Colac Area Health. The contact person is Manager, Dietetic Services at Colac Area Health.
Membership:
Representatives from Colac Area Health, Deakin University, Colac Otway Shire and Dept Human Services
Assoc Members Voting Membership:
The committee will make decisions on a consensus basis where possible but by a majority vote where necessary. Deakin requested no voting rights
Quorum: A representative from each membership Meeting Times: Fortnightly for 2 hours or as needed Confidentiality: Minute Circulation:
To be taken and circulated by CAH representatives
Performance Indicators:
Measured according to the purpose and the objectives
Reporting of Minutes
Circulated to Interim Steering Committee membership and delegates including DHS representative. All records related to the project will be maintained by the BAEW project manager
65 WHO Collaborating Centre for Obesity Prevention, Deakin University Report 6: Lessons learned from Colac’s Be Active Eat Well project
Be Active Eat Well Local Steering Committee Effective Date: 12 August 2003 Review Date: 12 June 2004 Co-ordinating Responsibility:
Colac Area Health
Authorised by: Director Primary Care, Colac Area Health Distribution by: Project Worker Purpose:
To be the major decision making body for the Be Active, Eat Well project and lead the project to achieve it’s stated goal. Goal: “To improve the health and wellbeing of individuals and strengthen the Colac Community through healthy eating and physical activity promotion”
Terms of Reference Objectives: 1) To implement 50% of the BAEW project’s strategies by June 2004
2) To provide the project with an organizational infrastructure; provide project management support; decide upon where the intervention budget is to be spent; make recommendations to the CAH Management Committee regarding project worker employment / EFT; continue to build and maintain strategic alliances & networks; provide the project with a range of relevant expertise and knowledge; provide support and leadership for the project workers; establish a sustainable network of community members with an interest in nutrition and physical activity 2) To review the relevance and appropriateness of the Be Active, Eat Well project’s strategies on a monthly basis; discuss and review strategies at the monthly meetings; and modify strategies as needed 3) To collect 66% of the process evaluation for BAEW by June 2004 assist the project workers in collecting data, as requested
Facilitator:
By Colac Area Health. The contact person is the BAEW Project Worker at CAH.
Membership:
Representatives from Colac Area Health, Deakin University, Colac Otway Shire, Leisure-networks, Local Primary Schools, Local Preschools, Childcare Services and Parents.
AssocMembers Voting Membership:
The committee will make decisions on a consensus basis where possible but by an individual members majority vote where necessary. Deakin requested no voting rights.
Quorum:
A minimum of 8 individual members, with at least 4 membership groups being represented.
Meeting Times: Monthly for 2 hours or as needed Confidentiality: Minute Circulation:
To be taken and circulated by CAH representatives to all Local Steering Committee members and DHS representative
Performance Indicators:
50% of strategies implemented by June 2004 Minutes of the monthly meeting to reflect review of strategies 66% of process evaluation collected by June 2004
Reporting of Minutes
Circulated to Local Steering Committee membership. The project worker will maintain all records related to the project.
66 WHO Collaborating Centre for Obesity Prevention, Deakin University Report 6: Lessons learned from Colac’s Be Active Eat Well project
Be Active Eat Well Reference Committee Effective Date: 12 August 2003 Review Date: 12 June 2004 Co-ordinating Responsibility:
Colac Area Health
Authorised by: Director Primary Care, Colac Area Health Distribution by: Project Worker Purpose:
To provide support, expertise, leadership and quality performance monitoring to the Be Active, Eat Well Project.
Terms of Reference Objectives: 1) To ensure 100% of the Be Active, Eat Well project’s objectives
by June 2005 2) To review and monitor the progress of the impact evaluation; provide the project with an organizational infrastructure; provide project management support, including recommendations on financial expenditure to take to the local steering committee for decision; provide the project with a range of relevant expertise and knowledge; provide support and leadership for the project worker/s monitor that the Be Active, Eat Well project is on course to meet its objectives within stated timeframes and, if it is not, provide solutions; to review and monitor budget expenditure; to communicate via common members to the local steering committee and the CAH management committee. 3) To review the relevance and appropriateness of the Be Active, Eat Well project’s strategies and objectives five times by June 2004; discuss and review strategies and objectives at reference committee meetings; make suggestions on changes to the strategies and objectives to take to the Local Steering Committee for decision.
Facilitator:
Health Promotion Manager, Colac Area Health The contact person is the Project Worker at Colac Area Health.
Membership:
Representatives from Colac Area Health, Deakin University, Colac Otway Shire and Department of Human Services.
Assoc Members Voting Membership:
The committee will make decisions on a consensus basis where possible but by an individual members majority vote where necessary. Deakin requested no voting rights.
Quorum: Not Applicable Meeting Times: 5 meetings per year, or as needed Confidentiality: Minute Circulation:
To be taken and circulated by CAH representatives
Performance Indicators:
100% of objectives achieved by June 2005 Minutes of meetings to reflect discussion and review of objectives
Reporting of Minutes
Circulated to Reference Committee membership. The project worker will maintain all records related to the project.
67 WHO Collaborating Centre for Obesity Prevention, Deakin University Report 6: Lessons learned from Colac’s Be Active Eat Well project
Appendix C: The ANGELO Process
The training course was held in Colac over 3 days in November 2002 and facilitated by Deakin University. The structure of the training program allowed for the presentation of background information on the first day to all participants, followed by an interactive workshop on the second and third days. The workshops were based on the ANGELO framework (Analysis Grid for Elements Linked to Obesity). The ANGELO framework is a conceptual model for understanding the environment in terms of obesogenicity and is a practical tool for prioritising strategies for intervention within each setting. A total of 24 participants attended the course from primary schools, the non-school care and education sector (child care centres, pre-school, kindergarten and family day care), health professionals, recreation professionals and food sectors representatives. Day 1 – Background information Topics included: Childhood nutrition, physical activity, obesity, foods and activities to target, influencing children’s physical activity and behaviour, and what can be done to promote Eating Well and Being Active in children. Days 2 & 3 ANGELO Workshops The workshops were based on the ANGELO framework. Initially, a comprehensive list of potential elements were identified against different aspects of the environment such as the physical, economic, political and socio-cultural environment. These elements were then rated for ‘importance’ and ‘changeability’ and a final ranking of each element was sought which formed the basis for setting priority areas for further action. The behaviours that rated high were: � TV / Screen time � High sugar drinks/ Water � High fat snacks � Fruit � Active Transport � Active Play Knowledge, skills, attitudes and perceptions of children that were identified by the group that needed addressing to achieve the selected behaviour change targets were: � Knowledge of children � TV and health/fitness � Fat in snacks � Sugar in drinks � Juice is not a health drink � Road safety � Bike skills � Perception of family meal times
68 WHO Collaborating Centre for Obesity Prevention, Deakin University Report 6: Lessons learned from Colac’s Be Active Eat Well project
� Perception of junk (high fat snacks/high sugar drinks) is normal and healthy lunches is ‘uncool’
Each setting was then discussed in terms of specific interventions that could be implemented. In the ‘School’ setting the following were identified as targets for action: � Lunchbox guidelines to parents � Policies on food in canteens and lunch orders � Curriculum on nutrition/foods � Water bottles in class In the ‘Home’ setting, the following were identified � Rules on TV/screen time � Foods in house and lunchboxes � Perceptions of safety and security Within the ‘Non-school care and education’ setting the following were targets for action: � Guidelines to parents on lunchbox content � Policies about fundraising using food � Programs on active play � Active transport from school to after school care � Food safety regulations as barrier The group then worked on writing objectives and strategies to develop as a draft action plan. This included input from schools, pre-schools, primary health care, and recreation, transport and food service settings
69 WHO Collaborating Centre for Obesity Prevention, Deakin University Report 6: Lessons learned from Colac’s Be Active Eat Well project
Appendix D: Action Plan- Be Active, Eat Well
NOTE: This Action Plan is a version (#13) from part-way through the project (2004)
Be Active, Eat Well – Action Plan Vision: Being Active and Eating Well in Colac – the Early Years Goal: To improve the health and wellbeing of individuals and strengthen the Colac
Community through healthy eating and physical activity promotion. Population group: Children aged 2 to 12 years old in the Colac Community and their families
and carers. Abbreviations: RC=Ruth Cuttler (project worker), AF=Anne Fenn, JF=Juli Farquhar,
MS=Margaret Scanlon, TC=Tracey Caire, MB=Mark Brennan, KM=Kathy McConnell, LSC= Local Steering Committee, CAH=Colac Area Health, COS=Colac Otway Shire, NR=Neighbourhood Renewal, DHS=Dept. of Human Services, LN= Leisurenetworks Comm Plan= Communications plan (separate plan),
Symbols: � = completed, � = in progress, � = not commenced behind schedule, �= not commenced as per schedule, �� = commenced ahead of schedule
GOAL: To improve the health and wellbeing of individuals and strengthen the Colac Community through healthy eating and physical activity promotion.
Objective 1: To achieve a high awareness of the “Be Active, Eat Well” messages among parents and children
Objective 2: To build Colac community capacity to promote physical activity and healthy eating
Objective 3: To evaluate the process, impact and outcomes of the “Be Active, Eat Well” project
Objective 4: To significantly decrease the time spent watching TV & playing on computers or electronic games
Objective 5: To significantly decrease the consumption of high sugar drinks and to promote the consumption of water
Objective 6: To significantly decrease the consumption of energy dense snacks and significantly increase consumption of fruit
Objective 7: To significantly increase the proportion of primary school children living within 1.5km who walk/cycle to and from school
Objective 8: To significantly increase the amount of active play after school and on weekends
Objective 9: a. To investigate the potential for improving the quality (fat content and type of fat) of deep-fried chips
70 WHO Collaborating Centre for Obesity Prevention, Deakin University Report 6: Lessons learned from Colac’s Be Active Eat Well project
b. To improve the quality of deep-fried takeaway chips Objective 10: a. To provide a service to improve the food and PA choices for children with
or at risk of overweight b. To pilot a healthy lifestyle program for parents and carers of children aged 2-12 years, focussing on healthy eating, physical activity and parenting skills
Obj
ectiv
e 1:
To
achi
eve
a hi
gh a
war
enes
s of
the
“Be
Act
ive,
Eat
Wel
l” m
essa
ges
amon
g pa
rent
s an
d ch
ildre
n St
rate
gy O
bjec
tive
St
rate
gies
B
y W
hom
T
imel
ine
Stat
us
Proc
ess E
valu
atio
n 1.
1 To
eng
age
pare
nts,
child
ren
and
the
com
mun
ity in
the
prom
otio
n of
phy
sica
l ac
tivity
and
nut
ritio
n fo
r ch
ildre
n
1.1.
1 En
gage
with
par
ents
, chi
ldre
n an
d th
e co
mm
unity
via
the
proj
ect’s
soci
al m
arke
ting
cam
paig
n (s
ee st
rate
gy o
bjec
tive
1.2)
1.
1.2
Mak
e lin
ks w
ith e
stab
lishe
d pr
imar
y sc
hool
pa
rent
and
frie
nds c
omm
ittee
s 1.
1.3
Invi
te p
aren
t rep
rese
ntat
ive
mem
bers
on
to th
e st
eerin
g co
mm
ittee
1.
1.4
Plan
and
faci
litat
e a
pare
nt fo
cus g
roup
to
asce
rtain
a p
aren
t’s p
ersp
ectiv
e on
the
issu
e of
he
alth
y ea
ting
and
phys
ical
act
ivity
for c
hild
ren.
1.
1.5
Con
tinue
to e
ngag
e w
ith th
e pa
rent
s who
at
tend
ed th
e fo
cus g
roup
1.
1.6
Use
the
links
and
co-
loca
tion
with
NR
to e
ngag
e w
ith p
aren
ts a
nd c
hild
ren
in th
e N
R a
reas
See
Com
m P
lan
Obj
.1.2
RC
LSC
RC
/ JF
RC
RC
May
03
onw
ard
Feb
03
onw
ard
Sep
03
May
-Aug
03
Aug
03
onw
ard
Sep
03
onw
ard
� � � 1
2/03
� 8
/03
� �
1.1.
1 Se
e ev
alua
tion
in C
omm
Pla
n.
1.1.
2 D
ocum
ent v
isits
/ co
rres
pond
ence
with
par
ent
com
mitt
ees
1.1.
3 Pa
rent
s on
com
mitt
ee
1.1.
4 Fo
cus g
roup
s run
and
repo
rt pr
oduc
ed
1.1.
5 D
ocum
ent f
ollo
wup
con
tact
with
pa
rent
s 1.
1.6
Doc
umen
t lin
ks w
ith p
aren
ts
esta
blis
hed
via
NR
1.2
To d
evel
op a
nd
impl
emen
t a
com
mun
icat
ion
plan
for
the
proj
ect
1.2.
1
Enga
ge a
soci
al m
arke
ting
cons
ulta
nt to
up
skill
th
e pr
ojec
t tea
m in
the
area
of s
ocia
l mar
ketin
g 1.
2.2
Prod
uce
a co
mm
unic
atio
n pl
an fo
r the
pro
ject
1.
2.3
Con
tinue
to d
evel
op th
e co
mm
unic
atio
n pl
an
over
the
dura
tion
of th
e pr
ojec
t 1.
2.4
Impl
emen
t the
pha
se 1
of t
he so
cial
mar
ketin
g pl
an
1.2.
5 Im
plem
ent p
hase
2 o
f the
soci
al m
arke
ting
plan
1.
2.6
Impl
emen
t pha
se 3
of t
he so
cial
mar
ketin
g pl
an
1.2.
7 D
evel
op th
e co
mm
unic
atio
n pl
an to
incl
ude
guid
elin
es fo
r the
com
mun
icat
ion
of p
roje
ct
info
rmat
ion
and
proc
esse
s for
dis
tribu
tion
of
info
rmat
ion
to th
e C
olac
com
mun
ity a
nd w
ider
co
mm
unity
.
BS
BAEW
Tea
m
RC
RC
RC
RC
KM
/ R
C
Dec
03
Feb
03
Jun
03
onw
ards
May
-Nov
03
Dec
03
onw
ards
Ju
l 03
onw
ards
N
ov-F
eb 0
4
� 0
2/03
� 5
/03
� � 1
2/03
� � �
1.2.
1 So
cial
mar
kete
r con
duct
ed
train
ing
sess
ion
1.2.
2 W
ritte
n an
d re
view
ed
com
mun
icat
ion
plan
1.
2.3
Ver
sion
s of c
omm
unic
atio
n pl
an
docu
men
ted
1.2.
4 N
umbe
r of n
ewsp
aper
arti
cles
, PO
S po
ster
s, bi
llboa
rds e
tc1.
2.5
Num
ber o
f new
spap
er a
rticl
es,
POS
post
ers,
billb
oard
s etc
1.2.
6 N
umbe
r of n
ewsp
aper
arti
cles
, PO
S po
ster
s, bi
llboa
rds e
tc1.
2.7
Com
mun
icat
ion
plan
do
cum
ente
d w
ith
com
mun
icat
ion
addi
tions
71
W
HO
Col
labo
ratin
g C
entre
for O
besi
ty P
reve
ntio
n, D
eaki
n U
nive
rsity
Rep
ort 6
: Les
sons
lear
ned
from
Col
ac’s
Be
Act
ive
Eat
Wel
l pro
ject
Obj
ectiv
e 2:
T
o bu
ild C
olac
com
mun
ity c
apac
ity to
pro
mot
e ph
ysic
al a
ctiv
ity a
nd h
ealth
y ea
ting
Stra
tegy
Obj
ectiv
e St
rate
gies
B
y W
hom
T
imel
ine
Stat
us
Proc
ess E
valu
atio
n
2.1
To e
stab
lish
proj
ect m
anag
emen
t, or
gani
satio
nal
infr
astr
uctu
re,
coor
dina
tion
and
stra
tegi
c al
lianc
es /
arra
ngem
ents
that
su
ppor
t the
im
plem
enta
tion
of th
e pr
ojec
t
2.1.
1 Id
entif
y in
tern
al a
nd e
xter
nal s
take
hold
ers
2.1.
2
Esta
blis
h an
inte
rim st
eerin
g co
mm
ittee
th
at m
eets
mon
thly
, to
guid
e th
e di
rect
ion
of th
e pr
ojec
t 2.
1.3
Expa
nd to
a st
eerin
g co
mm
ittee
that
in
corp
orat
es a
larg
e lo
cal c
ontin
genc
y 2.
1.4
Esta
blis
h an
d m
aint
ain
a st
eerin
g co
mm
ittee
dire
ctor
y 2.
1.5
Def
ine
the
role
s, re
spon
sibi
litie
s and
line
s of
man
agem
ent o
f the
Pro
ject
Wor
ker
posi
tion
2.1.
6 R
ecru
it a
proj
ect w
orke
r 2.
1.7
Dev
elop
and
an
initi
al a
ctio
n pl
an
2.1.
8 C
ontin
ue to
dev
elop
the
plan
thro
ugh
the
cour
se o
f the
pro
ject
2.
1.9
Dev
elop
a p
roje
ct b
udge
t and
mon
itor
expe
nditu
re (l
inks
to st
rate
gy o
bjec
t 2.4
) 2.
1.10
C
oord
inat
e m
eetin
gs e
tc
2.1.
11
Afte
r 12
mon
ths r
estru
ctur
e th
e m
anag
emen
t of t
he p
roje
ct to
ac
com
mod
ate
the
grow
ing
num
ber o
f pa
rtici
pant
s and
to in
clud
e a
larg
er lo
cal
mem
bers
hip
2.1.
12
Dev
elop
a re
stru
ctur
e pr
opos
al fo
r di
scus
sion
, agr
eem
ent a
nd im
plem
enta
tion
2.1.
13
Dev
elop
Ter
ms o
f Ref
eren
ce fo
r the
new
st
ruct
ure
2.1.
14
Impl
emen
t the
new
man
agem
ent s
truct
ure
(org
anis
e m
eetin
g tim
es, a
lloca
tion
of
peop
le to
mee
tings
etc
) 2.
1.15
R
evis
e th
e co
mm
unic
atio
n pl
an to
incl
ude
guid
elin
es fo
r the
com
mun
icat
ion
of
CA
H/C
OS/
DH
S
CA
H/C
OS/
DH
S
Stee
ring
Cte
Proj
ect W
orke
r
CA
H te
am
CA
H te
am
CA
H/C
OS/
Dea
kin
Proj
ect t
eam
CA
H F
in D
ept /
Pr
ojec
t Wor
ker
RC
JF /
RC
JF /
RC
/ TC
RC
RC
Jun-
Jul 0
2
Jun-
Jul 0
2
Jan
03
Aug
02
Aug
02
Aug
-Oct
02
Sep-
Dec
02
Nov
02
Jun
02
onw
ards
Oct
02
onw
ards
Ju
n 03
May
-Jun
03
Sep
03
Aug
03
� 6
/02
� 6
/02
�1/
03
� � 8
/02
� 1
0/02
�
11/
03
� � � � 7
/03
�7/
03
�9/
03
�8/
03
2.1.
1 St
ruct
ures
and
agr
eem
ents
in p
lace
2.
1.2
Com
mitt
ee fo
rmed
, min
utes
reco
rded
2.
1.3
Num
ber o
f inv
itatio
ns e
xten
ded
and
new
mem
bers
incl
uded
2.
1.4
Stee
ring
com
mitt
ee d
irect
ory
publ
ishe
d &
regu
larly
upd
ated
2.
1.5
Job
desc
riptio
n w
ritte
n, p
erfo
rman
ce
revi
ew in
pla
ce
2.1.
6 A
ppoi
ntm
ent o
f pro
ject
wor
ker
2.1.
7 A
ctio
n pl
an w
ritte
n an
d su
bmitt
ed to
D
HS
2.1.
8 R
ecor
d al
l dev
elop
men
tal v
ersi
ons o
f th
e ac
tion
plan
2.
1.9
Acc
ount
ing
syst
em in
pla
ce
2.1.
10
Mee
ting
date
s rec
orde
d 2.
1.11
D
ocum
enta
tion
of th
e re
stru
ctur
e pr
oces
s 2.
1.12
M
inut
es o
f mee
tings
to re
flect
di
scus
sion
, agr
eem
ent a
nd
impl
emen
tatio
n 2.
1.13
Te
rms o
f Ref
eren
ce d
ocum
ente
d an
d ac
cept
ed w
ithin
mee
ting
min
utes
2.
1.14
M
eetin
g tim
es o
rgan
ised
and
co
mm
unic
ated
2.
1.15
C
omm
unic
atio
n pl
an re
vise
d w
ith
com
mun
icat
ion
addi
tions
2.
1.16
M
eetin
g he
ld a
nd d
ocum
ent p
rodu
ced
72
W
HO
Col
labo
ratin
g C
entre
for O
besi
ty P
reve
ntio
n, D
eaki
n U
nive
rsity
Rep
ort 6
: Les
sons
lear
ned
from
Col
ac’s
Be
Act
ive
Eat
Wel
l pro
ject
proj
ect i
nfor
mat
ion
and
proc
esse
s for
di
strib
utio
n of
info
rmat
ion
to th
e C
olac
co
mm
unity
and
wid
er c
omm
unity
(lin
ks to
1.
2.7)
2.
1.16
C
oord
inat
e a
join
t mee
ting
of c
omm
ittee
s an
d as
soci
ated
gro
ups a
t the
mid
way
poi
nt
of th
e fu
ndin
g pe
riod
to re
view
and
pla
n
KM
/ R
C
RC
/ JF
Nov
-Feb
04
Nov
-Dec
03
� � 1
2/03
2.
2 To
iden
tify
and
deve
lop
partn
ersh
ips w
ith
com
mun
ity le
ader
s w
ho h
ave
an
inte
rest
in
prom
otin
g he
alth
y ea
ting
and
phys
ical
ac
tivity
2.2.
1 Id
entif
y ta
rget
setti
ngs
2.2.
2 C
onta
ct se
tting
s and
iden
tify
mem
bers
w
ithin
an
inte
rest
in n
utrit
ion
and
phys
ical
ac
tivity
2.
2.3
Enga
ge th
ese
lead
ers i
n at
tend
ing
train
ing
and
AN
GEL
O w
orks
hop
2.2.
4 W
ork
in p
artn
ersh
ip w
ith le
ader
s in
achi
evin
g th
e ob
ject
ives
dei
gned
from
the
AN
GEL
O w
orks
hop
2.2.
5 C
omm
ence
the
proc
ess o
f est
ablis
hing
a
sust
aina
ble
loca
l com
mun
ity g
roup
by
re-
stru
ctur
ing
the
proj
ect c
o –o
rdin
atio
n /
man
agem
ent a
fter 1
2 m
onth
(lin
ks to
2.
1.11
) 2.
2.6
Con
tinue
to li
nk w
ith n
ew p
artn
ers o
ver
the
cour
se o
f the
pro
ject
CA
H te
am
CA
H te
am
RC
/ A
F
Proj
ect T
eam
RC
/ JF
BAEW
Tea
m
Aug
02
Oct
02
Oct
02
Nov
02
onw
ards
Jun
03
onw
ards
Nov
02
onw
ard
�10
/02
�10
/02
�11
/02
� � �
2.2.
1 Se
tting
s doc
umen
ted
2.2.
2 N
umbe
r con
tact
ed a
nd le
vel o
f in
tere
st a
sses
sed
2.2.
3 N
umbe
r atte
ndin
g an
d pa
rtici
patio
n ev
alua
ted
2.2.
4 N
umbe
r of p
artn
ersh
ips f
orm
ed a
nd
lead
ers i
nclu
ded
in st
eerin
g gr
oup
2.2.
5 Ex
pand
ed lo
cal s
teer
ing
com
mitt
ee in
pl
ace
2.2.
6 Li
st o
f par
tner
s and
com
mun
ity
lead
ers
2.3
To su
ppor
t and
st
reng
then
envi
ronm
enta
l cha
nge
(phy
sica
l, ec
onom
ic,
polit
ical
and
soci
o-cu
ltura
l) to
ena
ble
heal
thy
eatin
g an
d ph
ysic
al a
ctiv
ity
2.3.
1 Id
entif
y op
portu
nitie
s to
prom
ote
heal
thy
eatin
g an
d ph
ysic
al a
ctiv
ity w
ithin
setti
ngs
via
the
AN
GEL
O p
roce
ss
2.3.
2 Id
entif
y ch
alle
nges
with
in se
tting
s tha
t di
sena
ble
heal
thy
eatin
g an
d ph
ysic
al
activ
ity v
ia th
e A
NG
ELO
pro
cess
2.
3.3
Dev
elop
obj
ectiv
es to
pro
mot
e he
alth
y ea
ting
and
phys
ical
act
ivity
with
in th
e se
tting
s with
in th
e A
NG
ELO
wor
ksho
p 2.
3.4
Liai
se w
ith se
tting
s to
ensu
re th
e im
plem
enta
tion
of th
e id
entif
ied
obje
ctiv
es
AN
GEL
O te
am
AN
GEL
O te
am
AN
GEL
O te
am
RC
/ TC
Nov
02
Nov
02
Nov
02
Dec
02
onw
ards
� 1
1/02
� 1
1/02
� 1
1/02
�
2.3.
1 A
NG
ELO
wor
ksho
p co
nduc
ted
with
at
leas
t 10
parti
cipa
nts
2.3.
2 C
halle
nges
list
ed a
nd d
iscu
ssed
in
wor
ksho
p 2.
3.3
Obj
ectiv
es, d
evel
oped
prio
ritis
ed a
nd
incl
uded
in a
ctio
n pl
an
2.3.
4 R
ecor
d of
num
ber o
f con
tact
s and
su
ppor
t giv
en
2.4
To p
rovi
de,
deve
lop
and
2.3.
5 R
esea
rch
rele
vant
pro
gram
s els
ewhe
re
and,
whe
re p
ossi
ble,
use
exi
stin
g re
sour
ces
AF
/ RC
D
ec-A
pr 0
3 �
3/0
3 2.
3.5
A li
brar
y of
reso
urce
s cre
ated
and
nu
mbe
r of r
esou
rces
reco
rded
73
W
HO
Col
labo
ratin
g C
entre
for O
besi
ty P
reve
ntio
n, D
eaki
n U
nive
rsity
Rep
ort 6
: Les
sons
lear
ned
from
Col
ac’s
Be
Act
ive
Eat
Wel
l pro
ject
stra
tegi
cally
allo
cate
re
sour
ces t
hat s
uppo
rt
the
prom
otio
n of
ph
ysic
al a
ctiv
ity a
nd
heal
thy
eatin
g
to a
chie
ve th
e go
als o
f the
impl
emen
tatio
n pl
an
2.3.
6 C
onsi
der r
esou
rce
oppo
rtuni
ties a
nd
barr
iers
with
in th
e lo
cal s
ettin
gs, w
hen
form
ing
the
impl
emen
tatio
n pl
an (v
ia
Ang
elo
proc
ess –
link
s with
stra
tegy
ob
ject
ive
2.3)
2.
3.7
Stra
tegi
cally
allo
cate
the
prop
ortio
n of
pr
ojec
t fun
ding
to a
chie
ving
the
impl
emen
tatio
n pl
an g
oals
2.
3.8
Supp
ort s
ettin
gs in
iden
tifyi
ng a
nd
appl
ying
for e
xter
nal f
undi
ng
oppo
rtuni
ties v
ia th
e on
goin
g st
eerin
g co
mm
ittee
(lin
ks w
ith st
rate
gy o
bjec
tive
2.3)
AN
GEL
O te
am
LSC
LSC
Nov
02
Dec
02
onw
ards
Dec
02
onw
ards
� 1
1/02
� �
2.3.
6 N
umbe
r of w
orks
hops
2.
3.7
Obj
ectiv
es c
oste
d ou
t and
prio
ritis
ed
2.3.
8 R
ecor
d of
ext
erna
l fun
ding
soug
ht a
nd
gain
ed
74
W
HO
Col
labo
ratin
g C
entre
for O
besi
ty P
reve
ntio
n, D
eaki
n U
nive
rsity
Rep
ort 6
: Les
sons
lear
ned
from
Col
ac’s
Be
Act
ive
Eat
Wel
l pro
ject
Obj
ectiv
e 3:
T
o ev
alua
te th
e pr
oces
s, im
pact
and
out
com
es o
f the
“B
e A
ctiv
e, E
at W
ell”
pro
ject
Stra
tegy
Obj
ectiv
e St
rate
gies
B
y W
hom
Tim
elin
esSt
atus
Pr
oces
s Eva
luat
ion
3.1
Col
lect
pro
cess
ev
alua
tion
3.1.
1 Sp
ecify
pro
cess
eva
luat
ion
requ
ired
to
eval
uate
the
proj
ect’s
stra
tegi
es
3.1.
2 C
olle
ct p
roce
ss e
valu
atio
n ov
er th
e pr
ojec
t’s im
plem
enta
tion
Dea
kin
/ RC
Proj
ect W
orke
rs
Nov
02
onw
ard
May
02
onw
ard
� �
3.1.
1 Pr
oces
s eva
luat
ion
mea
sure
s in
corp
orat
ed in
to a
ctio
n pl
ans
3.1.
2 Pr
oces
s eva
luat
ion
docu
men
ted
3.2
Col
lect
impa
ct
eval
uatio
n 3.
2.1
Def
ine
key
indi
cato
rs b
y se
arch
ing
the
liter
atur
e an
d co
nsul
ting
with
exp
erts
3.
2.2
Prio
ritis
e in
dica
tors
bas
ed o
n su
stai
nabi
lity
of m
easu
rem
ent,
rele
vanc
e to
PA
N,
usef
ulne
ss fo
r int
erve
ntio
n ev
alua
tion
usin
g IN
GR
ID (i
ndic
ator
grid
) 3.
2.3
Dev
elop
pop
ulat
ion
grou
p an
d se
tting
sp
ecifi
c qu
estio
nnai
res
3.2.
4 Li
aise
with
scho
ols a
nd o
ther
rele
vant
se
tting
s whe
re m
easu
rem
ents
will
take
pl
ace
3.2.
5 Pi
lot q
uest
ionn
aire
s and
dat
a co
llect
ion
tool
s and
tech
niqu
es in
app
ropr
iate
setti
ng
3.2.
6 M
easu
re in
dica
tors
as a
bas
elin
e fo
r Col
ac
inte
rven
tions
3.
2.7
Mea
sure
indi
cato
rs a
t the
com
plet
ion
of
Col
ac in
terv
entio
ns
Dea
kin
Dea
kin
Dea
kin
Dea
kin
Dea
kin
Dea
kin
Dea
kin
Nov
02
– Ja
n 03
D
ec 0
2 –
Jan
03
Dec
02
– Ja
n 03
Fe
b-A
pr 0
3
Feb
03
Mar
-Apr
03
Apr
-Jun
05
� � � � � � �
3.2.
1 Li
st o
f pot
entia
l ind
icat
ors c
reat
ed a
nd
sour
ces r
ecor
ded
3.2.
2 IN
GR
ID p
rodu
ced
and
publ
ishe
d 3.
2.3
ING
RID
pro
duce
d an
d pu
blis
hed
3.2.
4 N
umbe
r of s
ettin
gs c
onta
cted
3.
2.5
Pilo
t com
plet
ed in
at l
east
2 se
tting
s 3.
2.6
Bas
elin
e su
rvey
com
plet
ed
3.2.
7 Po
st in
terv
entio
n su
rvey
com
plet
ed
3.3
Col
lect
out
com
e ev
alua
tion
3.3.
1 C
olle
ct b
asel
ine
mea
n B
MI
3.3.
2 C
olle
ct p
ost i
nter
vent
ion
mea
n B
MI t
o ev
alua
te to
eva
luat
e ob
ject
ives
4-8
to
mea
sure
hea
lth a
nd w
ellb
eing
3.
3.3
Mea
sure
ach
ieve
men
t of o
bjec
tives
1,
2,9,
10 a
s ind
icat
ors o
f stre
ngth
enin
g th
e C
olac
Com
mun
ity
Dea
kin
Dea
kin
Dea
kin
Apr
03
Apr
-Jun
05
Apr
-Jun
05
� � �
3.3.
1 D
ata
colle
cted
on
base
line
mea
n B
MI
and
docu
men
ted
3.3.
2 Fo
llow
-up
mea
n B
MI c
olle
cted
and
do
cum
ente
d 3.
3.3
Eval
uatio
n of
obj
ectiv
e ac
hiev
emen
ts
com
plet
ed a
nd d
ocum
ente
d
75
W
HO
Col
labo
ratin
g C
entre
for O
besi
ty P
reve
ntio
n, D
eaki
n U
nive
rsity
Rep
ort 6
: Les
sons
lear
ned
from
Col
ac’s
Be
Act
ive
Eat
Wel
l pro
ject
Obj
ectiv
e 4:
To
sign
ifica
ntly
dec
reas
e th
e tim
e sp
ent w
atch
ing
TV
& p
layi
ng o
n co
mpu
ters
or
elec
tron
ic g
ames
Stra
tegy
Obj
ectiv
eSt
rate
gies
B
y W
hom
T
imel
ine
Stat
us
Proc
ess E
valu
atio
n
4.1
Res
earc
h ex
istin
g pr
ogra
ms
addr
essi
ng sc
reen
vi
ewin
g fo
r ch
ildre
n
4.1.
1 R
esea
rch
and
sour
ce e
xist
ing
pare
ntin
g pr
ogra
ms a
ddre
ssin
g sc
reen
vie
win
g fo
r ch
ildre
n 4.
1.2
Sour
ce e
xist
ing
guid
elin
es re
min
/ m
ax
scre
en ti
me
for c
hild
ren
4.1.
3 R
esea
rch
and
sour
ce e
xist
ing
curr
icul
um-
base
d pr
ogra
ms f
or p
rimar
y sc
hool
s 4.
1.4
Res
earc
h lo
cal w
ork
done
with
the
targ
et
grou
p on
TV
wat
chin
g
AF
AF
Dea
kin
RC
Dec
-Mar
03
Dec
-Mar
03
Dec
03
Apr
03
�3/
03
�3/
03
� 1
2/03
� 4
/03
4.1.
1 N
umbe
r sou
rced
and
doc
umen
ted
4.1.
2 G
uide
lines
sour
ced
and
docu
men
ted
4.
1.3
Num
ber s
ourc
ed a
nd d
ocum
ente
d 4.
1.4
Res
ults
of r
esea
rch
docu
men
ted
4.2
Rai
se p
aren
tal
awar
enes
s abo
ut
the
issue
s for
ch
ildre
n as
soci
ated
w
ith e
xces
sive
sc
reen
tim
e
4.2.
1 Se
e ob
ject
ive
1.2
RC
May
03
onw
ard
�
4.3
Dev
elop
and
im
plem
ent a
pr
ogra
m to
de
crea
se
child
ren’
s scr
een
view
ing
time
4.3.
1 In
vest
igat
e th
e po
ssib
ility
of e
ngag
ing
a Ps
ycho
logy
Hon
ors S
tude
nt to
take
on
this
pro
ject
4.
3.2
Inve
stig
ate
Dar
ryl H
earty
’s (D
eans
Mar
sh
Prim
ary
Scho
ol) i
nter
est i
n be
ing
invo
lved
in th
is p
roje
ct
4.3.
3 If
4.3
.1 d
oes n
ot e
vent
uate
, con
side
r em
ploy
ing
a pr
ojec
t wor
ker t
o de
velo
p th
e pr
ogra
m
4.3.
4 C
ondu
ct a
nee
ds a
sses
smen
t (eg
. foc
us
grou
ps w
ith p
aren
ts a
nd L
SC)
4.3.
5 D
evel
op a
pro
gram
4.
3.6
Pilo
t the
pro
gram
Dea
kin
RC
CA
H
Proj
ect W
orke
r
Proj
ect W
orke
r Pr
ojec
t Wor
ker
Jan
04
Feb
04
- Apr
-May
04
May
-Aug
04
Aug
-Oct
04
� � � � �
4.3.
1 O
utco
me
of th
is p
ropo
sal d
ocum
ente
d 4.
3.2
Inte
rest
ass
esse
d an
d do
cum
ente
d 4.
3.3
–4.
3.4
Nee
ds a
sses
smen
t con
duct
ed a
nd
outc
ome
docu
men
ted
4.3.
5 Pr
ogra
m d
evel
oped
4.
3.6
Prog
ram
pilo
ted
and
eval
uate
d
76
W
HO
Col
labo
ratin
g C
entre
for O
besi
ty P
reve
ntio
n, D
eaki
n U
nive
rsity
Rep
ort 6
: Les
sons
lear
ned
from
Col
ac’s
Be
Act
ive
Eat
Wel
l pro
ject
Obj
ectiv
e 5:
T
o si
gnifi
cant
ly d
ecre
ase
the
cons
umpt
ion
of h
igh
suga
r dr
inks
and
to p
rom
ote
the
cons
umpt
ion
of w
ater
Stra
tegy
Obj
ectiv
eSt
rate
gies
B
y W
hom
T
imel
ines
Stat
us
Proc
ess E
valu
atio
n 5.
1 Fa
cilit
ate
and
supp
ort t
he
intr
oduc
tion
of
wat
er p
olic
ies i
n Pr
imar
y Sc
hool
, Pr
e-sc
hool
, Fam
ily
Day
Car
e an
d Sp
ort &
Rec
Clu
bs
5.1.
1 R
esea
rch
exam
ple
wat
er p
olic
ies f
or
setti
ngs
5.1.
2 R
esea
rch
exis
ting
prog
ram
s tha
t hav
e in
volv
ed in
stitu
ting
wat
er p
olic
ies
5.1.
3 Li
aise
with
rele
vant
setti
ngs r
e w
ater
po
licie
s 5.
1.4
Doc
umen
t whe
re c
urre
nt p
olic
ies a
lread
y ex
ist a
nd th
ey d
o no
t 5.
1.5
Prov
ide
exam
ple
polic
ies t
o se
tting
s w
ithou
t pol
icie
s 5.
1.6
Supp
ort t
he d
evel
opm
ent a
nd
impl
emen
tatio
n of
pol
icie
s with
in
setti
ngs
(NB
link
s to
obje
ctiv
e 6.
2 fo
r prim
ary
scho
ols)
AF
RC
RC
RC
/ D
eaki
n
RC
RC
Dec
02
– Fe
b 03
N
ov-D
ec 0
3
Apr
-Jun
04
Apr
04
Apr
04
Apr
-Jun
04
� 2
/03
� � � � �
5.1.
1 R
ecor
d ex
iste
nce
of a
nd n
umbe
r of
polic
ies s
ourc
ed
5.1.
2 R
ecor
d ot
her p
rogr
ams a
nd th
eir k
ey
reco
mm
enda
tions
5.
1.3
Rec
ord
of c
onta
cts w
ith se
tting
s 5.
1.4
Doc
umen
tatio
n of
are
as o
f nee
d 5.
1.5
Num
ber o
f exa
mpl
e po
licie
s dis
tribu
ted
5.1.
6 N
umbe
r of n
ew p
olic
ies d
evel
oped
and
im
plem
ente
d
5.2
Red
uce
sale
s of
high
suga
r dr
inks
in
Pri
mar
y Sc
hool
s an
d Sp
ort a
nd R
ec
Clu
bs
5.2.
1 W
here
prim
ary
scho
ols e
lect
to a
dopt
ca
ntee
n po
licie
s as a
par
t of o
bjec
tive
6.2,
supp
ort e
mph
asis
on
wat
er
prom
otio
n an
d de
crea
sing
swee
t drin
ks
5.2.
2 W
here
wat
er p
olic
ies a
re in
trodu
ced
to
spor
t and
rec
club
s, en
sure
this
is
coup
led
with
stra
tegi
es to
dec
reas
e ca
ntee
n sa
les o
f sw
eet d
rinks
RC
RC
/ M
S
Apr
-Dec
04
Apr
-Dec
04
� �
5.2.
1 N
o. o
f prim
ary
scho
ol c
ante
ens m
akin
g ch
ange
s to
the
avai
labi
lity
of sw
eet
drin
ks
5.2.
2 N
o. o
f spo
rt an
d re
c cl
ubs m
akin
g ch
ange
s to
the
avai
labi
lity
of sw
eet
drin
ks
5.3
Com
mun
icat
ion
to
pare
nts o
n w
ater
ve
rsus
hig
h su
gar
drin
ks (i
nclu
ding
fr
uit j
uice
) via
so
cial
mar
ketin
g pl
an
See
Obj
1.2
R
CM
ay 0
3 on
war
ds
�
77
W
HO
Col
labo
ratin
g C
entre
for O
besi
ty P
reve
ntio
n, D
eaki
n U
nive
rsity
Rep
ort 6
: Les
sons
lear
ned
from
Col
ac’s
Be
Act
ive
Eat
Wel
l pro
ject
Obj
ectiv
e 6:
T
o si
gnifi
cant
ly d
ecre
ase
the
cons
umpt
ion
of e
nerg
y de
nse
snac
ks a
nd si
gnifi
cant
ly in
crea
se c
onsu
mpt
ion
of fr
uit
Stra
tegy
Obj
ectiv
eSt
rate
gies
B
yW
hom
T
imel
ines
Stat
us
Proc
ess E
valu
atio
n
6.1
Dev
elop
or
sour
ce
‘lunc
hbox
gui
delin
es’
to p
rom
ote
to p
aren
ts
6.1.
1 R
esea
rch
exis
ting
‘lunc
hbox
gui
delin
es’ f
or
pare
nts
6.1.
2 D
ecid
e on
a p
acka
ge o
f bes
t inf
orm
atio
n to
use
6.
1.3
Inve
stig
ate
best
opt
ions
for d
isse
min
atin
g gu
idel
ines
to p
aren
ts in
var
ying
setti
ngs (
scho
ols,
pres
choo
ls, f
amily
day
car
e)
6.1.
4 D
isse
min
ate
guid
elin
es v
ia m
etho
ds d
ecid
ed u
p in
6.1
.3
6.1.
5 C
omm
unic
ate
lunc
hbox
gui
delin
es to
par
ents
(li
nks t
o ob
ject
ive
1.2)
AF
/ RC
RC
/Nut
ritio
n D
ept
LSC
- Apr
04
onw
ard
Dec
02
– Fe
b 03
Mar
-Apr
04
May
04
June
04
Apr
-Dec
04
�2/
03
� � � �
6.1.
1 N
umbe
r of g
uide
lines
sour
ced
and
docu
men
ted
6.1.
2 D
ecis
ion
mad
e on
bes
t app
roac
h 6.
1.3
List
of o
ptio
ns c
onsi
dere
d an
d de
cisi
on m
ade
6.1.
4 N
umbe
r of l
unch
box
guid
elin
es
dist
ribut
ed
6.2
Faci
litat
e an
d su
ppor
t th
e in
trod
uctio
n of
pr
imar
y sc
hool
nu
triti
on p
olic
ies
6.2.
1 So
urce
exa
mpl
es o
f sch
ool n
utrit
ion
polic
ies
6.2.
2 Id
entif
y nu
tritio
n le
ader
s with
in sc
hool
s
6.2.
3 C
onve
ne a
scho
ols w
orki
ng p
arty
to d
iscu
ss a
nd
supp
ort e
ffor
ts to
est
ablis
h an
d im
plem
ent
polic
ies
6.2.
4 Pr
esen
t wor
king
par
ty w
ith o
ptio
ns to
incl
ude
in
scho
ol n
utrit
ion
polic
ies (
eg. c
ante
en, w
ater
, fru
it br
eak,
fund
rais
ing,
cur
ricul
um e
tc p
olic
ies)
6.
2.5
Scho
ols t
o de
cide
upo
n di
rect
ion
for t
heir
nutri
tion
polic
ies
6.2.
6 A
dopt
ion
and
impl
emen
tatio
n of
pol
icie
s
AF
RC
RC
RC
Scho
ols
Scho
ols
Feb
03
Feb
03
onw
ard
Apr
-Dec
04
Apr
-Dec
04
Apr
-Dec
04
Apr
-Dec
04
� 2
/03
� � � � �
6.2.
1 N
o. o
f cop
ies o
f pol
icie
s do
cum
ente
d 6.
2.2
–6.
2.3
Min
utes
of w
orki
ng p
arty
m
eetin
gs
6.2.
4 M
inut
es o
f wor
king
par
ty to
re
flect
opt
ions
6.
2.5
–6.
2.6
No.
of n
ew o
r im
prov
ed p
olic
ies
impl
emen
ted
6.3
Inve
stig
ate
the
exac
t fo
od h
andl
ing
requ
irem
ents
for
scho
ols w
ith r
egar
d to
fr
uit p
repa
ratio
n
6.3.
1 C
onta
ct re
leva
nt p
erso
n at
CO
S 6.
3.2
Obt
ain
info
rmat
ion
re fo
od h
andl
ing
requ
irem
ents
6.
3.3
Pass
info
rmat
ion
to sc
hool
wor
king
par
ty
RC
RC
RC
Mar
04
Mar
04
Apr
-Dec
04
� � �
6.3.
1 -
6.3.
2 In
form
atio
n co
llect
ed
6.3.
3 M
inut
es o
f wor
king
par
ty to
re
flect
dis
cuss
ion
of fo
od h
andl
ing
requ
irem
ents
78
W
HO
Col
labo
ratin
g C
entre
for O
besi
ty P
reve
ntio
n, D
eaki
n U
nive
rsity
Rep
ort 6
: Les
sons
lear
ned
from
Col
ac’s
Be
Act
ive
Eat
Wel
l pro
ject
6.4
Com
mun
icat
e to
pa
rent
s on
ED
snac
ks
vs fr
uit v
ia so
cial
m
arke
ting
plan
See
obj 1
.2
RC
May
03
onw
ard
�
79
W
HO
Col
labo
ratin
g C
entre
for O
besi
ty P
reve
ntio
n, D
eaki
n U
nive
rsity
Rep
ort 6
: Les
sons
lear
ned
from
Col
ac’s
Be
Act
ive
Eat
Wel
l pro
ject
Obj
ectiv
e 7:
T
o si
gnifi
cant
ly in
crea
se th
e pr
opor
tion
of p
rim
ary
scho
ol c
hild
ren
livin
g w
ithin
1.5
km w
ho w
alk/
cycl
e to
and
from
scho
ol
Stra
tegy
Obj
ectiv
eSt
rate
gies
B
yW
hom
T
imel
ines
Stat
us
Proc
ess E
valu
atio
n
7.1
Est
ablis
h a
Wal
king
Bus
pr
ogra
m to
sc
hool
s
7.1.
1 In
vest
igat
e th
e op
portu
nitie
s to
obta
in
exte
rnal
fund
s to
esta
blis
h a
wal
king
bus
pr
ogra
m
7.1.
2 Li
aise
with
prim
ary
scho
ols t
o ga
uge
inte
rest
and
supp
ort f
or a
wal
king
bus
pr
ogra
m
7.1.
3 A
pply
to V
icH
ealth
for w
alki
ng b
us
fund
ing
7.1.
4 Li
aise
with
Que
ensl
and
Uni
vers
ity o
f Te
chno
logy
re th
eir w
alk
to sc
hool
pr
ogra
m a
nd B
iLo
spon
sors
hip
7.1.
5 C
ondu
ct a
n in
itial
mee
ting
with
rele
vant
st
akeh
olde
rs to
gau
ge c
omm
unity
inte
rest
an
d de
velo
p a
plan
of a
ctio
n V
icH
ealth
fu
ndin
g ap
plic
atio
n su
cces
sful
, see
CO
S fo
r pla
n of
impl
emen
tatio
n an
d pr
oces
s ev
alua
tion.
7.1.
6 Su
ppor
t and
reso
urce
CO
S in
the
impl
emen
tatio
n of
the
wal
king
bus
pr
ogra
m
7.1.
7 Li
nk n
ew p
artn
ers w
ith th
e pr
ogra
m (e
g.
NR
, Tra
vels
mar
t), a
s opp
ortu
nitie
s aris
e
RC
, CO
S,
Dea
kin
RC
CO
S, R
C
RC
CO
S to
org
anis
e
LSC
RC
Jan-
Apr
03
Feb-
Mar
03
Apr
03
Jan-
Apr
03
May
03
Jun
03 –
Jun
04
Jun
03 o
nwar
d
� 4
/03
� 3
/03
� 4
/03
� 5
/03
� 8
/03
� �
7.1.
1 W
orki
ng g
roup
est
ablis
hed
with
repr
esen
tativ
es
from
4 sc
hool
s and
CO
S 7.
1.2
–7.
1.3
App
licat
ion
lodg
ed
7.1.
4 In
form
atio
n co
llect
ed
7.1.
5 M
inut
es fr
om m
eetin
g do
cum
ente
d 7.
1.6
Num
ber o
f wal
king
bus
es st
arte
d 7.
1.7
Num
ber o
f par
tner
s lin
ked
7.2
Inco
rpor
ate
activ
e tr
ansp
ort
into
com
m p
lan
See
obje
ctiv
e 1.
2 R
CM
ay 0
3 on
war
ds
�
7.3
Inve
stig
ate
the
prob
lem
of h
eavy
ba
gs a
nd p
oten
tial
solu
tions
7.3.
1 C
onta
ct p
hysi
othe
rapy
ass
ocia
tion
and
chiro
prac
tic a
ssoc
iatio
ns re
bes
t typ
es o
f sc
hool
bag
s, co
rrec
t fitt
ing
of b
ack
pack
s an
d lo
ad li
mits
7.
3.2
Forw
ard
info
rmat
ion
to C
OS
proj
ect
wor
ker f
or u
se if
requ
ired
TC RC
Feb
03
Oct
03
�2/
03
�2/
04
7.3.
1 Li
st o
f sch
ool b
ag re
com
men
datio
ns
from
ass
ocia
tions
col
lect
ed
7.3.
2 -
80
W
HO
Col
labo
ratin
g C
entre
for O
besi
ty P
reve
ntio
n, D
eaki
n U
nive
rsity
Rep
ort 6
: Les
sons
lear
ned
from
Col
ac’s
Be
Act
ive
Eat
Wel
l pro
ject
Obj
ectiv
e 8:
T
o si
gnifi
cant
ly in
crea
se th
e am
ount
of a
ctiv
e pl
ay a
fter
scho
ol a
nd o
n w
eeke
nds
Stra
tegy
Obj
ectiv
eSt
rate
gies
B
yW
hom
T
imel
ines
Stat
us
Proc
ess E
valu
atio
n
8.1
Dev
elop
an
Aft
er
Scho
ol A
ctiv
ities
Pr
ogra
m w
hich
pr
omot
es a
nd
supp
orts
spor
t and
re
crea
tion
prog
ram
s tha
t will
ru
n in
Col
ac
8.1.
1 D
evel
op a
pro
posa
l with
ratio
nale
, pla
n an
d co
stin
g 8.
1.2
Dec
ide
if pr
opos
al is
acc
epte
d fo
r fun
ding
by
BAE
W p
roje
ct
8.1.
3 Su
ppor
t Lei
sure
netw
orks
in th
e de
velo
pmen
t and
impl
emen
tatio
n of
the
ASA
P Se
e Le
isur
enet
wor
ks fo
r det
aile
d pr
ojec
t pla
n an
d re
ports
LN LSC
LSC
May
03
Jun
03
Jun
03
onw
ard
�5/
03
�6/
03
�
8.1.
1 Fi
nalis
ed p
ropo
sal d
ocum
ent
8.1.
2 LS
C m
inut
es to
refle
ct d
ecis
ion
8.1.
3 N
umbe
r of A
SAP
prog
ram
s run
and
at
tend
ance
num
bers
8.2
Eng
age
the
targ
et
grou
p in
the
rede
velo
pmen
t of
thre
e lo
cal p
arks
8.2.
1 D
eter
min
e th
e th
ree
park
s to
be d
evel
oped
8.
2.2
Map
the
park
s nea
rest
nei
ghbo
urs,
scho
ols
and
othe
r com
mun
ity h
ubs
8.2.
3 In
volv
e ne
ighb
ourh
ood
rene
wal
in th
e co
mm
unity
con
sulta
tion
invo
lvin
g pa
rks
in th
eir k
ey re
side
ntia
l are
as
8.2.
4 D
evel
op a
pla
n fo
r eng
agin
g an
d co
nsul
ting
with
the
com
mun
ity
cons
ulta
tion
in th
e re
deve
lopm
ent o
f the
se
park
s 8.
2.5
Supp
ort C
OS
and
NR
in th
e im
plem
enta
tion
of th
e re
deve
lopm
ent o
f th
ese
park
s
MS
RC
RC
MS
/ NR
LSC
Jun
03
Jul 0
3
Nov
03
Jan
04
Jan
04
onw
ard
�6/
03
�11
/03
�11
/03
� �
8.2.
1 Pa
rks d
efin
ed
8.2.
2 M
aps p
rodu
ced
8.2.
3 –
8.2.
4 Pl
an d
evel
oped
8.
2.5
No
of p
arks
rede
velo
ped
and
no o
f co
mm
unity
mem
bers
invo
lved
in th
e re
deve
lopm
ent p
roce
ss
8.3
Est
ablis
h a
“Be
Act
ive
Art
s”
prog
ram
whi
ch
offe
rs c
ultu
ral
oppo
rtun
ities
(as
an a
ltern
ativ
e to
T
V) f
or c
hild
ren
8.3.
1 Li
aise
with
CO
S C
ultu
ral a
nd L
eisu
re
Coo
rdin
ator
re o
ppor
tuni
ties f
or B
AEW
in
this
are
a
8.3.
2 Li
aise
with
the
Nei
ghbo
urho
od R
enew
al
proj
ect
8.3.
3 D
evel
op a
BAE
W fl
oat f
or th
e K
ana
Fest
ival
8.
3.4
Con
side
r a p
artn
ersh
ip in
the
appl
icat
ion
for f
undi
ng to
eng
age
child
ren
in th
e
RC
RC
NR
/ R
C
CO
S / R
C /
NR
Jun
03
Nov
03
Dec
-Mar
04
Dec
03
– M
ar04
�6/
03
�11
/03
� �
8.3.
1 M
eetin
g he
ld
8.3.
2 M
eetin
g he
ld
8.3.
3 Fl
oat d
evel
oped
and
inco
rpor
ated
in
para
de
8.3.
4 M
eetin
gs re
app
licat
ion
oppo
rtuni
ties
min
uted
8.
3.5
-
81
W
HO
Col
labo
ratin
g C
entre
for O
besi
ty P
reve
ntio
n, D
eaki
n U
nive
rsity
Rep
ort 6
: Les
sons
lear
ned
from
Col
ac’s
Be
Act
ive
Eat
Wel
l pro
ject
deve
lopm
ent o
f art
wor
k al
ong
the
Col
ac
Lake
and
Bee
chie
Lin
e w
alki
ng a
nd
cycl
ing
path
s as t
hey
deve
lop
8.3.
5 C
onsi
der a
rt ad
ditio
ns to
pre
mie
r wal
king
ro
utes
(als
o th
e w
alki
ng sc
hool
bus
rout
es)
CO
S / R
C /
NR
D
ec 0
3 –
Mar
04
�8.
4 E
stab
lish
a K
inde
rgym
pr
ogra
m (B
WF)
8.4.
1 In
vest
igat
e cu
rren
t Kin
dy G
ym p
rogr
ams
with
in C
olac
to d
eter
min
e th
e ne
ed fo
r a
new
pro
gram
8.
4.2
Inve
stig
ate
the
pote
ntia
l equ
ipm
ent c
osts
of
est
ablis
hing
a K
indy
Gym
8.
4.3
Inve
stig
ate
the
capa
city
of B
luew
ater
Fi
tnes
s to
deliv
er su
ch a
pro
gram
or t
he
Nei
ghbo
urho
od H
ouse
com
mun
ity h
ub
8.4.
4 Su
rvey
par
ents
of K
inde
rgar
ten
aged
ch
ildre
n on
the
need
8.
4.5
Dis
cuss
and
dec
ide
upon
the
viab
ility
of
esta
blis
hing
a k
inde
rgym
RC
RC
MS
/ NR
/ R
C
RC
LSC
Jul 0
3
Dec
03
Jan-
Mar
04
Feb-
Mar
04
Apr
04
� 7
/03
� � � �
8.4.
1 D
ocum
enta
tion
of re
sear
ch
8.4.
2 D
ocum
enta
tion
of c
osts
8.
4.3
Inve
stig
atio
n in
to c
apac
ity c
ompl
eted
8.
4.4
Surv
ey re
sults
doc
umen
ted
8.4.
5 D
ecis
ion
docu
men
ted
in L
SC m
eetin
g m
inut
es
82
W
HO
Col
labo
ratin
g C
entre
for O
besi
ty P
reve
ntio
n, D
eaki
n U
nive
rsity
Rep
ort 6
: Les
sons
lear
ned
from
Col
ac’s
Be
Act
ive
Eat
Wel
l pro
ject
Obj
ectiv
e 9:
a. T
o in
vest
igat
e th
e po
tent
ial f
or im
prov
ing
the
qual
ity (f
at c
onte
nt a
nd ty
pe o
f fat
) of d
eep
frie
d ch
ips.
Stra
tegy
Obj
ectiv
eSt
rate
gies
B
yW
hom
T
imel
ines
Stat
us
Proc
ess E
valu
atio
n
9.1
Con
duct
a su
rvey
of
fat c
onte
nt/ty
pe
of fa
t of d
eep
frie
d ch
ips i
n C
olac
ou
tlets
9.1.
1 Li
aise
with
CO
S EH
O’s
re c
omm
enci
ng
surv
eyin
g 9.
1.2
Surv
ey d
eep
frie
d fo
ods
TC /
Dea
kin
/ C
OS
CO
S
Jan-
Feb
03
Mar
-Jun
03
� 1
/03
�
9.1.
1 C
onta
ct w
ith E
HO
reco
rded
9.
1.2
Fat t
ype
and
cont
ent s
urve
yed
9.2
Dis
cuss
the
pote
ntia
l for
a p
ilot
prog
ram
to
incr
ease
qua
lity
of
deep
frie
d ch
ips
9.2.
1 M
eet t
o di
scus
s the
pot
entia
l for
a p
ilot
prog
ram
D
eaki
n / C
OS
/ R
CM
ay 0
3 �
9.2.
1 R
ecor
d m
eetin
g da
te a
nd a
ttend
ees
b. T
o im
prov
e th
e qu
ality
of d
eep-
frie
d ta
keaw
ay c
hips
.
Stra
tegy
Obj
ectiv
eSt
rate
gies
B
yW
hom
T
imel
ines
Stat
us
Proc
ess E
valu
atio
n
9.3
Pilo
t a p
rogr
am to
im
prov
e th
e qu
ality
of
dee
p fr
ied
chip
s in
Col
ac
9.3.
1 W
rite
to fo
od re
taile
rs to
feed
back
thei
r re
sults
, int
rodu
ce th
e pr
ogra
m, i
nvite
them
to
par
ticip
ate
and
info
rm th
em o
f a fo
llow
-up
pho
ne c
all
9.3.
2 R
esea
rch
into
Nat
iona
l Hea
rt Fo
unda
tion
tech
niqu
es
9.3.
3 D
evel
op a
n au
ditin
g to
ol to
use
at f
ood
reta
il vi
sit
9.3.
4 Pu
rcha
se o
f req
uire
d eq
uipm
ent e
g.
ther
mom
eter
9.
3.5
Inve
stig
ate
the
pros
and
con
s of h
avin
g in
dust
ry p
artn
ers a
nd m
ake
a de
cisi
on
9.3.
6 C
all a
ll th
e N
HF
reco
mm
ende
d oi
l pr
oduc
ers t
o no
tify
of th
e pr
ogra
m
9.3.
7 D
evel
op a
n in
cent
ives
pro
gram
to e
ngag
e re
taile
rs
CO
S / T
C
RC
TC MB
MB
/ LS
C
MB
MB
/ R
C
May
03
May
03
May
- Jun
03
May
-Jul
03
Oct
03
Dec
03
Dec
03
� 6
/03
� 6
/03
� 7
/03
� 8
/03
� 1
0/03
� 1
2/03
� 1
2/03
9.3.
1 C
opy
of le
tter a
nd lo
g of
the
num
ber o
f le
tters
sent
9.
3.2
Res
earc
h co
mpl
eted
9.
3.3
Aud
it to
ol d
evel
oped
and
revi
ewed
9.
3.4
Equi
pmen
t pur
chas
ed
9.3.
5 D
ecis
ion
min
uted
9.
3.6
Phon
e ca
lls a
nd c
ompa
nies
do
cum
ente
d 9.
3.7
Ince
ntiv
es d
ocum
ente
d 9.
3.8
Rat
ing
shee
t pro
duce
d 9.
3.9
Cop
y of
lette
r and
log
of w
ho w
as
cont
acte
d 9.
3.10
N
umbe
r of p
h ca
lls d
ocum
ente
d 9.
3.11
St
anda
rd re
quire
men
ts d
ocum
ente
d 9.
3.12
V
isits
com
plet
ed a
nd d
ocum
ente
d 9.
3.13
V
isits
com
plet
ed a
nd d
ocum
ente
d
83
W
HO
Col
labo
ratin
g C
entre
for O
besi
ty P
reve
ntio
n, D
eaki
n U
nive
rsity
Rep
ort 6
: Les
sons
lear
ned
from
Col
ac’s
Be
Act
ive
Eat
Wel
l pro
ject
9.3.
8 D
evel
op a
Hot
Chi
p R
atin
g sh
eet f
or u
se in
tra
inin
g se
ssio
ns
9.3.
9 Le
tter t
o al
l ret
aile
rs e
xpla
inin
g th
e pr
ogra
m a
nd in
cent
ives
9.
3.10
Fo
llow
-up
phon
e ca
ll to
reta
ilers
, inv
iting
pa
rtici
patio
n in
pro
gram
9.
3.11
Fi
nalis
e re
quire
men
ts fo
r rea
chin
g go
ld,
silv
er a
nd b
ronz
e st
anda
rd
9.3.
12
Vis
it pa
rtici
patin
g re
taile
rs to
trai
n in
NH
F te
chni
ques
and
pro
vide
bes
t pra
ctic
e gu
idel
ines
9.
3.13
V
isit
to n
on-p
artic
ipat
ing
reta
iler t
o pr
ovid
e fa
ct sh
eet a
nd re
invi
te p
artic
ipat
ion
9.3.
14
Surv
ey p
artic
ipat
ing
reta
ilers
on
the
fat
type
/ co
nten
t or t
heir
deep
frie
d ch
ips
9.3.
15
Dev
elop
indi
vidu
al p
artic
ipat
ing
busi
ness
es
Mem
oran
dum
s of U
nder
stan
ding
and
sign
of
f on
thes
e 9.
3.16
Le
tter t
o M
ayor
to c
onfir
m in
writ
ing
his
parti
cipa
tion
in th
e in
cent
ive
prog
ram
9.
3.17
D
evel
op a
soci
al m
arke
ting
plan
for t
his
obje
ctiv
e 9.
3.18
N
otify
par
ticip
atin
g bu
sine
sses
of t
heir
surv
ey re
sults
and
the
subs
eque
nt ra
ting
of
thei
r chi
ps
9.3.
19
Dev
elop
the
soci
al m
arke
ting
reso
urce
s th
at w
ill b
e re
quire
d 9.
3.20
C
omm
ence
the
soci
al m
arke
ting
cam
paig
n
MB
MB
MB
MB
/ D
eaki
n
MB
MB
CO
S
MB
MB
RC
/ M
B
MB
MB
/ D
iete
tic
Stud
ents
M
B /
RC
Nov
-Dec
03
Dec
03
Dec
–Jan
04
Jan
04
Jan-
Feb
04
Feb
04
Feb
04
Feb
04
Feb
04
Dec
-Feb
04
Mar
04
Mar
–A
pr 0
4 A
pr 0
4 on
war
d
� 1
2/03
� 1
2/03
� 1
/04
� � � � � � � � � �
9.3.
14
Fat t
ype
and
cont
end
surv
eyed
and
re
sults
logg
ed
9.3.
15
Doc
umen
ted
MoU
s 9.
3.16
W
ritte
n co
nfirm
atio
n re
ceiv
ed
9.3.
17
Soci
al m
arke
ting
plan
doc
umen
ted
9.3.
18
Not
ifica
tion
to b
usin
esse
s log
ged
9.3.
19
Res
ourc
es p
rodu
ced
9.3.
20
Num
ber o
f adv
erts
/ po
ster
s / fl
iers
etc
.
84
W
HO
Col
labo
ratin
g C
entre
for O
besi
ty P
reve
ntio
n, D
eaki
n U
nive
rsity
Rep
ort 6
: Les
sons
lear
ned
from
Col
ac’s
Be
Act
ive
Eat
Wel
l pro
ject
Obj
ectiv
e 10
: a. T
o pi
lot a
serv
ice
to im
prov
e th
e fo
od a
nd p
hysi
cal a
ctiv
ity c
hoic
es fo
r ch
ildre
n w
ith o
verw
eigh
t / o
besi
ty
Stra
tegy
Obj
ectiv
eSt
rate
gies
B
yW
hom
T
imel
ines
Stat
us
Proc
ess E
valu
atio
n
10.1
D
evel
op a
nd
pilo
t an
9 w
eek
prog
ram
for
fam
ilies
of
child
ren
aged
2-
12 y
ears
who
ar
e ov
erw
eigh
t/ ob
ese
10.1
.1
Dev
elop
pro
gram
wor
king
par
ty
10.1
.2
Res
earc
h ex
istin
g w
eigh
t man
agem
ent
prog
ram
s foc
ussi
ng o
n a
fam
ily b
ased
ap
proa
ch to
man
agin
g ch
ildho
od
over
wei
ght /
obe
sity
10
.1.3
C
ondu
ct a
lite
ratu
re re
view
abo
ut g
roup
ap
proa
ches
to m
anag
ing
child
hood
ov
erw
eigh
t and
obe
sity
10
.1.4
D
ecid
e up
on p
rogr
am c
onte
nt b
ased
on
the
resu
lts o
f the
10.
1.2
and
10.1
.3
10.1
.5
Res
ourc
e a
faci
lity
and
equi
pmen
t 10
.1.6
G
auge
refe
rral
inte
rest
from
like
ly re
ferr
ers
10.1
.7
Gai
n re
ferr
als
10.1
.8
Pilo
t the
pro
gram
10
.1.9
Pr
oduc
e an
eva
luat
ion
repo
rt
TC to
co
ordi
nate
a
wor
king
gro
up
to d
evel
op th
e pr
ogra
m
Jan0
3 Ja
n-Fe
b03
Jan-
Apr
03
Jan-
Apr
03
Jan-
Apr
03Ja
n-A
pr03
Jan-
Apr
03A
pr-J
un 0
3 D
ec 0
3
� 1
/03
� 4
/03
� 4
/03
� 5
/03
� 7
/03
� 3
/03
� 8
/03
� 1
0/03
�
12/
03
10.1
.1
Dev
elop
men
t of a
pro
gram
wor
king
pa
rty
10.1
.2
Doc
umen
tatio
n co
llate
d fr
om p
rogr
am
rese
arch
10
.1.3
D
ocum
enta
tion
colla
ted
from
lite
ratu
re
rese
arch
10
.1.4
Pr
ogra
m c
onte
nt d
evel
oped
and
re
view
ed
10.1
.5
Faci
lity
orga
nise
d an
d eq
uipm
ent
obta
ined
10
.1.6
D
ocum
enta
tion
of c
onta
ct w
ith
refe
rrer
s 10
.1.7
N
umbe
r of r
efer
rals
10
.1.8
A
t lea
st o
ne 8
-wee
k pr
ogra
m c
ompl
eted
10
.1.9
Pr
ogra
m e
valu
ated
for c
onte
nt,
deliv
ery,
etc
b. T
o pi
lot a
hea
lthy
lifes
tyle
pro
gram
for
pare
nts a
nd c
arer
s of c
hild
ren
aged
2-1
2 ye
ars,
focu
ssin
g on
hea
lthy
eatin
g, p
hysi
cal a
ctiv
ity a
nd
pare
ntin
g sk
ills
Stra
tegy
Obj
ectiv
eSt
rate
gies
B
yW
hom
T
imel
ines
Stat
us
Proc
ess E
valu
atio
n
10.2
C
reat
e a
new
nam
e fo
r th
e pi
lot
prog
ram
10.2
.1
Con
duct
focu
s gro
ups
10.2
.2
Empl
oy so
cial
mar
ketin
g te
chni
ques
10
.2.3
D
ecid
e up
on n
ew n
ame
JF /
TC
JF /
TC
JF /
TC
Feb-
Apr
04
Feb-
Apr
04
Feb-
Apr
04
� � �
10.2
.1
Focu
s gro
up re
port
10.2
.2
Doc
umen
tatio
n of
soci
al m
arke
ting
used
10
.2.3
D
ocum
enta
tion
of n
ew n
ame
10.3
Fi
nd a
n al
tern
ativ
e ve
nue
to h
ouse
the
prog
ram
10.3
.1
Inve
stig
ate
cond
uctin
g th
e pr
ogra
m fr
om
AC
E or
the
Nei
ghbo
urho
od H
ouse
rath
er
than
a h
ealth
faci
lity
JF /
TC
Feb-
Apr
04
�10
.3.1
In
vest
igat
ions
doc
umen
ted
85
W
HO
Col
labo
ratin
g C
entre
for O
besi
ty P
reve
ntio
n, D
eaki
n U
nive
rsity
Rep
ort 6
: Les
sons
lear
ned
from
Col
ac’s
Be
Act
ive
Eat
Wel
l pro
ject
86
W
HO
Col
labo
ratin
g C
entre
for O
besi
ty P
reve
ntio
n, D
eaki
n U
nive
rsity
Rep
ort 6
: Les
sons
lear
ned
from
Col
ac’s
Be
Act
ive
Eat
Wel
l pro
ject
10.4
D
evel
op a
co
mpr
ehen
sive
st
rate
gy to
rec
ruit
part
icip
ants
10.4
.1
Mee
ting
to d
iscu
ss a
vaila
ble
stra
tegi
es
10.4
.2
Dec
ide
upon
the
recr
uitm
ent s
trate
gies
to u
se
JF /
TC
JF /
TC
Feb-
Apr
04
Feb-
Apr
04
� �10
.4.1
M
eetin
g m
inut
ed
10.4
.2
Min
utes
refle
ct fi
nal d
ecis
ions
on
recr
uitm
ent o
ptio
ns.
No
of
parti
cipa
nts d
ocum
ente
d 10
.5
Pilo
t hea
lthy
lifes
tyle
pro
gram
10
.5.1
R
un th
e pr
ogra
m w
ith th
e su
gges
ted
chan
ges
from
eva
luat
ion
repo
rt 10
.1.9
JF
/ TC
M
ay-J
ul 0
4 �
10.5
.1
Prog
ram
con
duct
ed a
nd fi
nal r
epor
t pr
oduc
ed
Report 6: Lessons learned from Colac’s Be Active Eat Well project
87 WHO Collaborating Centre for Obesity Prevention, Deakin University
Appendix E: Communication Plan
NOTE – this is an example of the Communications Plan part way through the intervention period
BACKGROUND Deakin University (DU), with funding from the Department of Human Services (DHS) and the Department of Health and Ageing, has established Sentinel Site for Obesity Prevention in the Barwon-South Western Region of Victoria. Thus obesity prevention resources and expertise will be focussed within this region to trial and evaluate innovative projects. In May 2002, DHS approached Colac and to be the first project site within the Sentinel Site and the offer was accepted. DHS provided a project brief entitled “Be Active, Eat Well: A Community Building Approach” and funding of $300,000 over three years. This brief outlined a broad framework developed to “support local communities to utilise physical activity and healthy eating related activities to achieve healthy changes in the community and to provide improved lifestyle opportunities for families and individuals” with expertise and evaluation support from DU. Colac’s role would be to produce an action plan that was achievable within their local community. Initial discussions involved representatives from DHS, DU, Colac Area Health (CAH) and the Colac Otway Shire (COS). An interim steering committee was formed from this membership and children were determined to be the target group of the Be Active, Eat Well Project in Colac. Objective 1 in the Be Active, Eat Well action plan is “to achieve a high awareness of the Be Active, Eat Well messages among parents and children” ]. Section 1 of this document outlines the social marketing plan for the Be Active, Eat Well Project, which aims to meet this objective. Objective 2 in the Be Active, Eat Well action plan is “to build the Colac community capacity to promote physical activity and healthy eating’. Within this objective coordination of the project is highlighted as important in supporting the project’s implementation. Project coordination hinges on excellent communication within the Be Active, Eat Well teams and with the community. Section 2 of this document outlines a broad communication plan for this project.
Report 6: Lessons learned from Colac’s Be Active Eat Well project
88 WHO Collaborating Centre for Obesity Prevention, Deakin University
SECTION 1: SOCIAL MARKETING PLAN Aim To increase the community awareness of the Be Active, Eat Well messages. Objectives To achieve a high recall of the campaign amongst the target audience To increase the target group’s awareness of the Be Active, Eat Well messages To increase the target group’s knowledge about and understanding of the Be Active, Eat Well messages To increase the target group’s confidence in their ability to implement the Be Active, Eat Well messages To increase the amount of physical activity and healthy eating behaviours that correspond to the Be Active, Eat Well messages Target Group Children aged 2-12 years, their parents and carers. Campaign Messages The overarching message of the campaign is that children need to be more physically active and eating healthier foods. This message will be broken down into; “campaign messages” – expressed in project language and for professional use (see figure1) “take-home messages” – expressed in plain language and for use in the community, these indicate clearly what we want people to do (see figure 1). These take-home messages were workshopped with a parent focus group.
Figure 1 – Campaign Messages Expressed as Take Home Messages and Slogans
Children need to be more physically active and eating
healthier foods
Less Screen
Time and More Active Play
More Active Transport
More Fruit and
Less Energy Dense Snacks
More Water and Less
Sweet Drinks
Figure 1 - Be Active, Eat Well Campaign Messages
Report 6: Lessons learned from Colac’s Be Active Eat Well project
89 WHO Collaborating Centre for Obesity Prevention, Deakin University
Campaign Philosophy It is important to be clear about the purpose of any marketing campaign. Marketing campaigns usually have one of three purposes (see Table 2) and sometimes a mix of more than one purpose. The philosophy underpinning the Be Active, Eat Well Communication Plan is one of social marketing and to a lesser degree, advocacy. Table 2 – Be Active, Eat Well Campaign Philosophy Purpose Definition Be Active, Eat Well Publicity Individual / organisation profile
building �
Social Marketing Changing individuals’ knowledge, attitudes or behaviour around a particular health issue
�
Advocacy Issues and policies Changing physical, legislative, fiscal and social environments
� �
Campaign Message Take Home Message Marketing Slogan Overarching Message: Children need to be more physically active and eating healthier foods
� Being active and eating well can be easy Be Active, Eat Well – making it easy (in logo format)
More Active Transport � Choose to walk or cycle to and from school Making it easy… to walk to school
Less Screen Time and More Active Play
� Plan how much TV / computer / videos / electronic games you watch in your family
� Play actively everyday after school for at least an hour
Making it easy… to play actively
More Fruit and Less Energy Dense Snacks
� Children need at least 2 serves of fruit each day (each about the size they could cup in their hand)
� Limit packaged snacks, chocolate, lollies, cakes, sweet biscuits, muesli bars, fruit bars and fruit snacks to one or less small serves per day
� Muesli bars, fruit straps and fruit bars are high in sugar and should not be substituted for fruit
Making it easy… to eat more fruit
More Water and Less Sweet Drinks
� Water and milk are everyday drinks (remember children need only three serves of dairy per day so don’t exceed this in milk)
� Limit sweet drinks such as juice, cordial and soft drinks are drinks to a small glass or less per day
� Eat whole fruit, not juice. Juice, even 100% fruit juice varieties, contain just as much sugar as soft drinks and cordials
Making it easy… to drink water and
milk
Report 6: Lessons learned from Colac’s Be Active Eat Well project
90 WHO Collaborating Centre for Obesity Prevention, Deakin University
Available Hooks and Angles The Be Active, Eat Well project has several “hooks” or “angles” which are well established to be useful tools to engage the media. These include; New research i.e. leading Australia in the battle against overweight Statistics i.e. baseline data Children / babies i.e. our target group! Lots of opportunities for catchy pictures Celebrities and experts i.e. Deakin experts, politicians Local community issues i.e. Local baseline data collection A David and Goliath angle i.e. Our children against the TV advertising world Corporate big brother i.e. Our children against the multi-nationals These are simply the hooks and angles available to the project and don’t all need to be used. For example, it may be more strategic to make partners with some of the multi-national companies in town, rather that promote them as enemies. Methods Marketing methods vary greatly in terms of cost, time involved and mediums used. Some of the marketing methods that seem reasonable to resource within Be Active, Eat Well’s capacity are outlined below; Paid advertising (newspaper, radio) Press releases Merchandise (logo, stickers, magnets etc) Simple brochures distributed by inserting them in other people’s magazines Brochure / leaflets mailed out using already established data-bases Regular newspaper columns Newsletters Brochures Large scale media launches You will notice these methods being included within the “how” section of the “who, what, when and how” plan. Phases The plan for the Be Active, Eat Well social marketing campaign is mapped over three phases. These phases may overlap each other on a time scale (i.e. activities in phases 2 and 3 may be happening concurrently), however the intent of each stage is different. Phase 1 is the initial phase of the social marketing campaign and intends to increase the awareness of the target group about this new local project. Hopefully, by the end of this phase the target group will know that Be Active, Eat Well is running in Colac and has a focus on healthy eating and physical activity for children. This phase requires the most intensive marketing over a short period of time. The project’s “take-home” messages are introduced in this part of the campaign. Phase 2 will involve building on the awareness established in phase 1. The intention of this phase is to maintain the target group’s awareness of the project and to consolidate their awareness of the key messages. As the target group should already have an awareness of the project, the activities of phase 2 do not need to be timetabled as closely together or be as numerous.
91 WHO Collaborating Centre for Obesity Prevention, Deakin University Report 6: Lessons learned from Colac’s Be Active Eat Well project
Phase 3 intends to support the implementation of specific project strategies. For example, a social marketing campaign will be developed to increase the public’s demand for healthier and lower fat hot chips, a necessary step for the successful implementation of this objective. Phases 2 and 3 are tightly linked but worth separating in the plan in an effort to;
� prevent missing the opportunity to resource individual strategies � prevent becoming over involved in individual strategies and forgetting to see the
broader project picture. Evaluation Process Evaluation: Who- Project Worker What- Documentation of the communication process over the project’s funding period
(eg. methods used, number of newspaper articles, radio interviews, brochures etc), testing of materials with the target groups
When- Continuous over the course of the project Impact Evaluation: Who- Deakin University Support and Evaluation Team What- Include questions that will evaluate the objectives of the communication plan in
the 2nd CATI interview and consider focus groups at the end of the project When- At project conclusion
The
“Who
, Wha
t, W
hen
and
How
” Pl
an
Abb
revi
atio
ns:
JF=
Juli
Farq
uhar
, RC
= R
uth
Cut
tler (
Pro
ject
Wor
ker)
, CA
H T
eam
= C
olac
Are
a H
ealth
Tea
m, T
C=
Trac
ey C
aire
, NR
= N
igel
R
awlin
s (1
3th B
each
Mar
ketin
g P
ty L
td),
MB
= M
ark
Bre
nnan
, BG
= B
ridie
Gal
laha
r, N
R=
Nei
ghbo
urho
od R
enew
al, D
S=
Die
tetic
Stu
dent
s Th
e H
isto
ry -
Soc
ial M
arke
ting
Pre
-Dat
ing
This
Com
mun
icat
ion
Pla
n
92
W
HO
Col
labo
ratin
g C
entre
for O
besi
ty P
reve
ntio
n, D
eaki
n U
nive
rsity
Rep
ort 6
: Les
sons
lear
ned
from
Col
ac’s
Be
Act
ive
Eat
Wel
l pro
ject
Wha
t H
ow
Cos
t B
y W
hen
Who
St
atus
Um
brel
la S
loga
n D
ecid
e up
on te
st s
loga
ns
Test
slo
gans
with
targ
et g
roup
Li
aise
with
mar
ketin
g co
mpa
ny
Dev
elop
gra
phic
Pro
ject
team
mee
ting
Indi
vidu
al d
iscu
ssio
ns/ f
ocus
gro
ups
Vis
its, p
hone
, em
ail
Em
ploy
13th
Bea
ch M
arke
ting
Pro
ject
team
tim
e P
roje
ct te
am ti
me
Pro
j. W
orke
r tim
e $1
400
Apr
03
May
03
May
03
May
03
JF, R
C
JF, R
C
RC
13
th B
each
M
arke
ting
� �
�
�
Pre-
Publ
icity
P
ress
rele
ase
re fu
ndin
g fo
r pr
ojec
t N
etw
orki
ng w
ith th
e se
tting
s C
onne
ct w
ith p
aren
ts
Pre
ss re
leas
e fo
r pap
er
AN
GE
LO, m
eetin
gs, d
inne
rs, d
ata
colle
ctio
n Fo
cus
grou
ps
Pro
ject
team
tim
e P
roje
ct te
am ti
me
Pro
ject
team
tim
e
Jun
02
Jun0
2-M
ay03
M
ay03
-Aug
03
CA
H te
am
RC
, TC
, Dea
kin
JF, R
C
�
� �
Proj
ect L
aunc
h P
ublic
ity e
vent
requ
ired
Min
iste
rial L
aunc
h of
Log
o on
Ban
ner
$700
M
ay03
R
C
�
Mar
ketin
g Po
rtfo
lio
Dev
elop
a m
arke
ting
portf
olio
to
supp
ort t
he im
plem
enta
tion
of
all p
hase
s of
the
BA
EW
ca
mpa
ign.
Furth
er d
evel
op th
e B
AE
W c
hara
cter
s “d
oing
” the
BA
EW
mes
sage
s D
evel
op a
por
tfolio
of p
hoto
grap
hs
Dev
elop
BA
EW
mer
chan
dise
(eg.
stic
kers
, ba
lloon
s et
c)
Sec
ure
a B
AE
W e
mai
l add
ress
D
evel
op B
AE
W s
tatio
nary
(eg.
lette
rhea
d,
busi
ness
car
ds)
$968
(9 x
ch
arac
ters
) $7
15
$591
N
il $9
15
18th J
ul 0
3 5th
Sep
03
25th A
ug 0
3 18
th J
ul 0
3 11
th J
ul 0
3
RC
/ N
R
RC
/ N
R
RC
/ N
R
RC
R
C /
NR
� �
�
�
�
Test
s an
d C
heck
s C
ontin
ually
che
ck th
e m
essa
ges
are
cons
iste
nt w
ith
the
umbr
ella
mes
sage
, cre
dibl
e,
rele
vant
, bel
ieva
ble,
un
ders
tand
able
, evo
kes
the
right
em
otio
n
Focu
s gr
oups
, ind
ivid
ual d
iscu
ssio
ns, s
elf-
chec
k (w
ould
you
or y
our n
eigh
bour
read
/ lis
ten
to th
is?)
Pro
ject
team
tim
e M
ay03
on
war
ds
RC
�
in
prog
ress
Soc
ial M
arke
ting
Pha
se 1
Wha
t H
ow
Cos
t B
y W
hen
Who
S
tatu
s P
aren
ts
Info
rm p
aren
ts o
f the
upc
omin
g ch
ildre
n’s
new
slet
ters
In
form
par
ents
of t
he B
AE
W
mes
sage
s in
the
new
slet
ters
La
unch
1st
New
slet
ter
Sup
port
pare
nts
with
tips
whi
ch
rela
te to
the
topi
c in
the
child
ren’
s ne
wsl
ette
rs
Teac
hers
P
repa
re te
ache
rs o
n th
e to
pic
of e
ach
BA
EW
chi
ldre
n’s
new
slet
ter
Chi
ldre
n In
crea
se c
hild
ren’
s aw
aren
ess
of th
e B
AE
W m
essa
ges
Lette
r to
pare
nts
atta
ched
to s
choo
l ne
wsl
ette
r Le
tter t
o pa
rent
s at
tach
ed to
sch
ool
new
slet
ter
Pre
ss re
leas
e fo
r new
spap
er
Tips
in s
choo
l new
slet
ter t
o co
inci
de w
ith
each
chi
ldre
n’s
BA
EW
new
slet
ter
Flie
r to
all t
each
ers
outli
ning
the
mon
thly
m
essa
ge
Dev
elop
4x
new
slet
ters
for c
hild
ren
phot
ocop
ying
ph
otoc
opyi
ng
Pro
j wor
ker t
ime
Pro
j wor
ker t
ime
and
phot
ocop
ying
P
hoto
copy
ing
Pro
ject
team
tim
e P
roje
ct te
am ti
me
$737
7
18th
Aug
03
18th
Aug
03
18th
Aug
03
Sep
, Oct
&
Nov
03
25th
Aug
15
th S
ept
20th
Oct
24
th N
ov
25th
Aug
15
th S
ept
20th
Oct
24
th N
ov
RC
R
C
RC
R
C
RC
R
C
RC
R
C
RC
/ N
R
RC
/ N
R
RC
/ N
R
RC
/ N
R
�
�
� �
�
�
�
�
� �
�
�
93
WH
O C
olla
bora
ting
Cen
tre fo
r Obe
sity
Pre
vent
ion,
Dea
kin
Uni
vers
ity R
epor
t 6: L
esso
ns le
arne
d fro
m C
olac
’s B
e A
ctiv
e E
at W
ell p
roje
ct
Soc
ial M
arke
ting
Pha
se 2
Wha
t H
ow
Cos
t B
y W
hen
Who
St
atus
M
aint
ain
targ
et g
roup
aw
aren
ess
of th
e pr
ojec
t ge
nera
lly a
nd c
onso
lidat
e aw
aren
ess
of th
e ke
y pr
ojec
t m
essa
ges.
Maj
or s
pons
orsh
ip o
f Kan
a Fe
stiv
al
Dev
elop
and
Sig
n a
MoU
with
Kan
a C
omm
. D
evel
op a
BA
EW
floa
t D
evel
op a
ser
ies
of n
ewsp
aper
ad
verti
sem
ents
to ru
n pr
ior t
o fe
stiv
al (C
olac
H
eral
d an
d E
cho)
B
ook
adve
rt sp
ace
Run
4 x
adv
erts
ove
r 4 w
eeks
D
evel
op fr
uit s
hop
poin
t of s
ale
disp
lays
Li
aise
with
frui
t sho
ps
6 x
Dis
play
s im
plem
ente
d
$300
0 P
roj W
orke
r tim
e $5
00
Pro
j Wor
ker t
ime
Pro
j Wor
ker t
ime
$201
6 $5
0 P
roj W
orke
r tim
e P
roj W
orke
r tim
e
Dec
03
Nov
03
21st M
ar 0
4 D
ec 0
3 16
th F
eb 0
3 23
rd F
eb 0
3 1st
Mar
03
8th M
ar 0
3 15
th M
ar 0
3 D
ec 0
3 M
ar 0
4 22
nd M
ar 0
4 29
th M
ar 0
4 5th
Apr
04
12th A
pr 0
4 19
th A
pr 0
4 26
th A
pr 0
4
RC
R
C
BG
/ R
C /
NR
R
C /
NR
R
C
RC
R
C
RC
R
C
RC
/ N
R
RC
R
C
RC
R
C
RC
R
C
RC
�
�
�
�
�
�
�
�
�
�
�
�
�
�
�
�
�
94
WH
O C
olla
bora
ting
Cen
tre fo
r Obe
sity
Pre
vent
ion,
Dea
kin
Uni
vers
ity R
epor
t 6: L
esso
ns le
arne
d fro
m C
olac
’s B
e A
ctiv
e E
at W
ell p
roje
ct
Soc
ial M
arke
ting
Pha
se 3
95
WH
O C
olla
bora
ting
Cen
tre fo
r Obe
sity
Pre
vent
ion,
Dea
kin
Uni
vers
ity R
epor
t 6: L
esso
ns le
arne
d fro
m C
olac
’s B
e A
ctiv
e E
at W
ell p
roje
ct
Wha
t H
ow
Cos
t B
y W
hen
Who
S
tatu
s S
uppo
rt th
e im
plem
enta
tion
of
spec
ific
inte
rven
tions
.
Obj
ectiv
e 10
a (r
ecru
itmen
t of
grou
p pa
rtici
pant
s)
Adv
ertis
e 1s
t fam
ily w
eigh
t man
agem
ent
prog
W
eekl
y N
ews
CA
H N
otic
e B
oard
C
AH
All
Sta
ff em
ail l
istin
g P
rimar
y S
choo
l New
slet
ters
M
eet w
ith G
P’s
In
fo to
Pae
diat
ricia
ns
Mee
t with
Sch
ool P
sych
olog
ists
A
dver
tise
2nd
fam
ily w
eigh
t man
agem
ent
prog
E
cho
New
spap
er
Col
ac H
eral
d W
eekl
y N
ews
CA
H N
otic
e B
oard
C
AH
All
Sta
ff em
ail l
istin
g P
rimar
y S
choo
l New
slet
ters
In
fo to
GP
’s
Info
to P
aedi
atric
ians
In
fo to
Sch
ool P
sych
olog
ists
Pro
j Wor
ker t
ime
and
phot
ocop
ying
P
roj W
orke
r tim
e an
d ph
otoc
opyi
ng
Jul 0
3 Ju
l 03
Jul 0
3 Ju
l 03
Jul 0
3 Ju
l 03
Jul 0
3 S
ep /
Oct
03
Sep
/ O
ct 0
3 Fe
b-A
pr 0
3 S
ep /
Oct
03
Sep
/ O
ct 0
3 S
ep /
Oct
03
Sep
/ O
ct 0
3 S
ep /
Oct
03
Sep
/ O
ct 0
3 S
ep /
Oct
03
TC
TC
TC
TC
TC /
RC
TC
TC
TC
/ JF
TC
/ JF
TC
/ JF
TC
/ JF
TC
/ JF
TC
/ JF
TC
/ JF
TC
/ JF
TC
/ JF
�
�
�
�
�
�
�
�
�
�
�
�
�
�
�
�
Obj
ectiv
e 9b
D
evel
op s
ocia
l mar
ketin
g as
sets
to u
se w
ith th
e pa
rtici
patin
g fo
od re
taile
rs
Lam
inat
ed e
duca
tion
hand
out (
like
the
NH
F ‘ti
ps o
n ch
ips’
) C
ost m
anag
emen
t too
l
Pro
ject
Wor
ker
time
in
prep
arat
ion
and
Feb-
Apr
04
Feb-
Apr
04
MB
M
B
�
�
�
96
WH
O C
olla
bora
ting
Cen
tre fo
r Obe
sity
Pre
vent
ion,
Dea
kin
Uni
vers
ity R
epor
t 6: L
esso
ns le
arne
d fro
m C
olac
’s B
e A
ctiv
e E
at W
ell p
roje
ct
Wha
t H
ow
Cos
t B
y W
hen
Who
S
tatu
s D
evel
op s
ocia
l mar
ketin
g as
sets
to u
se in
the
com
mun
ity
Impl
emen
t a s
ocia
l mar
ketin
g ca
mpa
ign
aim
ed a
t cre
atin
g a
cons
umer
dem
and
for h
ealth
ier
hot c
hips
Gui
de fo
r adv
ertis
ing
Bra
ndin
g eg
. log
o S
loga
ns
Dev
elop
a “h
ow o
ften”
cla
use
to b
e in
corp
orat
ed in
to a
ll re
late
d ad
verti
sing
C
ertif
icat
e of
Par
ticip
atio
n S
ticke
rs fo
r Sho
p W
indo
ws
Adv
ertis
emen
ts (
for n
ewsp
aper
/ sc
hool
ne
wsl
ette
r / m
ajor
bus
ines
s st
aff n
ewsl
ette
rs)
Rad
io A
dver
tisem
ents
M
edia
Rel
ease
s P
oste
rs
Flye
rs
Coo
rdin
ate
the
follo
win
g;
Ass
igni
ng o
f gol
d, s
ilver
or b
ronz
e st
anda
rd
Pho
togr
aph
with
the
may
or fo
r gol
d st
anda
rd
Pre
sent
atio
n of
cer
tific
ates
, stic
kers
and
cas
h pr
izes
by
may
or
In s
hop
post
er d
ispl
ays
In s
hop
pam
phle
ts fo
r cus
tom
ers
Ove
r 6 w
eeks
new
spap
er a
nd ra
dio
adve
rts
Adv
erts
in m
ajor
new
slet
ters
eg.
sch
ools
, C
AH
, CO
S
Initi
al m
edia
rele
ase
Follo
w-u
p m
edia
rele
ase
with
suc
cess
sto
ries
prod
uctio
n co
sts
(this
sec
tion
to b
e fil
led
in a
s co
stin
gs a
re
rece
ived
–
estim
ated
bud
get
for
impl
emen
tatio
n of
ob
ject
ive
9b
$300
0)
Feb-
Apr
04
Feb-
Apr
04
Feb-
Apr
04
Feb-
Apr
04
Fe
b-A
pr 0
4 Fe
b-A
pr 0
4 Fe
b-A
pr 0
4 Fe
b-A
pr 0
4 Fe
b-A
pr 0
4 Fe
b-A
pr 0
4 Fe
b-A
pr 0
4 M
ar 0
4 A
pr 0
4 A
pr 0
4 A
pr 0
4 A
pr 0
4 M
ay-J
un 0
4 M
ay-J
un 0
4 A
pr 0
4 Ju
n 04
MB
D
S
DS
D
S
DS
D
S
DS
D
S
DS
D
S
DS
M
B /
RC
M
B /
RC
M
B /
RC
M
B /
RC
M
B /
RC
M
B /
RC
M
B /
RC
M
B /
RC
M
B /
RC
�
�
�
�
�
�
�
�
�
�
�
�
�
�
�
�
�
�
�
Obj
ectiv
e 5
P
rodu
ce w
ater
bot
tles
App
rox
$200
0 Fe
b 04
R
C
�
Gan
tt C
hart
for P
hase
1 o
f Soc
ial M
arke
ting
Cam
paig
n
July
03
Aug
ust 0
3 Se
ptem
ber 0
3 O
ctob
er 0
3 N
ovem
ber 0
3 Ta
sks
7th
– 11th
14th
– 18th
21st
– 25th
28th
– 1st
4th
– 8th
11th
– 15th
18th
– 22nd
25th
- 29th
1st
– 5th
8th
- 12th
15th
– 19th
22nd
– 26th
29th
– 3rd
6th
– 10th
13th
– 17th
20th
– 24th
27th
– 31st
3rd
– 7th
10th
– 14th
17th
–21st
24th
– 28th
Mar
ketin
g Po
rtfo
lio
C
ostin
gs fo
r por
tfolio
�
L.
head
and
b.c
ards
�
S
ort o
ut c
opyr
ight
�
B
AE
W e
mai
l
�
Dev
elop
cha
ract
ers
�
Mer
chan
dise
�
P
hoto
grap
hs
�
New
slet
ter 1
- sn
acks
New
slet
ter c
ostin
gs
�
Moc
k up
des
ign
�
Con
tent
new
slet
ter
�
C
onte
nt p
aren
t let
ter
�
Con
tent
par
ent t
ips
�
Con
tent
teac
her I
ntro
�
C
onte
nt te
ache
r not
es
1
�
Pro
ofs
new
slet
ter
�
Pro
ofs
pare
nt le
tter
�
97
WH
O C
olla
bora
ting
Cen
tre fo
r Obe
sity
Pre
vent
ion,
Dea
kin
Uni
vers
ity R
epor
t 6: L
esso
ns le
arne
d fro
m C
olac
’s B
e A
ctiv
e E
at W
ell p
roje
ct
98
WH
O C
olla
bora
ting
Cen
tre fo
r Obe
sity
Pre
vent
ion,
Dea
kin
Uni
vers
ity R
epor
t 6: L
esso
ns le
arne
d fro
m C
olac
’s B
e A
ctiv
e E
at W
ell p
roje
ct
Ju
ly 0
3 A
ugus
t 03
Sept
embe
r 03
Oct
ober
03
Nov
embe
r 03
Task
s
7th
– 11th
14th
– 18th
21st
– 25th
28th
– 1st
4th
– 8th
11th
– 15th
18th
– 22nd
25th
- 29th
1st
– 5th
8th
- 12th
15th
– 19th
22nd
– 26th
29th
– 3rd
6th
– 10th
13th
– 17th
20th
– 24th
27th
– 31st
3rd
– 7th
10th
– 14th
17th
–21st
24th
– 28th
Pro
ofs
teac
her f
lier
�
Prin
ting
new
slet
ter
�
Prin
ting
pare
nt le
tter
�
Prin
ting
teac
her f
lier
�
Pre
ss re
leas
e N
.pap
er
�
Par
ent L
ette
r Rel
ease
�
Te
ache
r Int
ro R
elea
se
�
New
slet
ter r
elea
se
�
Teac
her N
otes
R
elea
se
�
Tips
in s
choo
l n.le
tter
�
New
slet
ter 2
– a
ctiv
e tr
ansp
ort
Con
tent
new
slet
ter
�
Con
tent
teac
her f
lier
�
Pro
ofs
new
slet
ter
�
Pro
ofs
teac
her f
lier
�
Prin
ting
new
slet
ter
�
Prin
ting
teac
her f
lier
�
New
slet
ter r
elea
se
�
Tips
in s
choo
l n.le
tter
�
Ju
ly 0
3 A
ugus
t 03
Sept
embe
r 03
Oct
ober
03
Nov
embe
r 03
Task
s
7th
– 11th
14th
– 18th
21st
– 25th
28th
– 1st
4th
– 8th
11th
– 15th
18th
– 22nd
25th
- 29th
1st
– 5th
8th
- 12th
15th
– 19th
22nd
– 26th
29th
– 3rd
6th
– 10th
13th
– 17th
20th
– 24th
27th
– 31st
3rd
– 7th
10th
– 14th
17th
–21st
24th
– 28th
New
slet
ter 3
– a
ctiv
e pl
ay
Con
tent
new
slet
ter
�
Con
tent
teac
her f
lier
�
Pro
ofs
new
slet
ter
�
Pro
ofs
teac
her f
lier
�
�
Prin
ting
new
slet
ter
�
Prin
ting
teac
her f
lier
�
New
slet
ter r
elea
se
Tips
in s
choo
l n.le
tter
�
New
slet
ter 4
- dr
inks
Con
tent
new
slet
ter
�
�
Con
tent
teac
her f
lier
Pro
ofs
new
slet
ter
�
Pro
ofs
teac
her f
lier
�
Prin
ting
new
slet
ter
�
Prin
ting
teac
her f
lier
�
New
slet
ter r
elea
se
�
Tips
in s
choo
l n.le
tter
99
WH
O C
olla
bora
ting
Cen
tre fo
r Obe
sity
Pre
vent
ion,
Dea
kin
Uni
vers
ity R
epor
t 6: L
esso
ns le
arne
d fro
m C
olac
’s B
e A
ctiv
e E
at W
ell p
roje
ct
Gan
tt C
hart
for P
hase
2 o
f Soc
ial M
arke
ting
Cam
paig
n
Dec
embe
r 03
Janu
ary
04
Febr
uary
04
Mar
ch 0
4 A
pril
04
Task
s
1st
- 5th
8th
– 12th
15th
– 19th
29th
– 2nd
5th
– 9th
12th
– 16th
19th
– 23rd
26th
– 30th
2nd
– 6th
9th
– 13th
16th
– 20th
23rd
– 27th
1st
– 5th
8th
– 12th
15th
– 19th
22nd
– 26th
29th
– 2nd
5th
– 9th
12th
– 16th
19th
– 23rd
26th
– 30th
Kan
a Fe
stiv
al
Li
aise
and
spo
nsor
�
D
evel
op a
nd s
ign
MoU
�
Dev
elop
a B
AE
W
Floa
t
�
New
spap
er A
dver
ts
Dev
elop
4 a
dver
ts
�
Boo
k ad
vert
spac
e
Adv
ert 1
in tw
o pa
pers
Adv
ert 2
in tw
o pa
pers
Adv
ert 3
in tw
o pa
pers
Adv
ert 4
in tw
o pa
pers
Frui
t Sho
p D
ispl
ays
Dev
elop
dis
play
s
�
Li
aise
with
frui
t sho
ps
D
ispl
ay 1
in th
ree
shop
s
100
WH
O C
olla
bora
ting
Cen
tre fo
r Obe
sity
Pre
vent
ion,
Dea
kin
Uni
vers
ity R
epor
t 6: L
esso
ns le
arne
d fro
m C
olac
’s B
e A
ctiv
e E
at W
ell p
roje
ct
101
WH
O C
olla
bora
ting
Cen
tre fo
r Obe
sity
Pre
vent
ion,
Dea
kin
Uni
vers
ity R
epor
t 6: L
esso
ns le
arne
d fro
m C
olac
’s B
e A
ctiv
e E
at W
ell p
roje
ct
D
ecem
ber 0
3 Ja
nuar
y 04
Fe
brua
ry 0
4 M
arch
04
Apr
il 04
Ta
sks
1st
- 5th
8th
– 12th
15th
– 19th
29th
– 2nd
5th
– 9th
12th
– 16th
19th
– 23rd
26th
– 30th
2nd
– 6th
9th
– 13th
16th
– 20th
23rd
– 27th
1st
– 5th
8th
– 12th
15th
– 19th
22nd
– 26th
29th
– 2nd
5th
– 9th
12th
– 16th
19th
– 23rd
26th
– 30th
Dis
play
2 in
thre
e sh
ops
Dis
play
3 in
thre
e sh
ops
Dis
play
4 in
thre
e sh
ops
Dis
play
5 in
thre
e sh
ops
Dis
play
6 in
thre
e sh
ops
Gan
tt C
hart
s fo
r Pha
se 3
of S
ocia
l Mar
ketin
g C
ampa
ign
Obj
ectiv
e 10
a
July
03
Aug
ust 0
3 Se
ptem
ber 0
3 O
ctob
er 0
3 N
ovem
ber 0
3 Ta
sks
7th
– 11th
14th
– 18th
21st
– 25th
28th
– 1st
4th
– 8th
11th
– 15th
18th
– 22nd
25th
- 29th
1st
– 5th
8th
- 12th
15th
– 19th
22nd
– 26th
29th
– 3rd
6th
– 10th
13th
– 17th
20th
– 24th
27th
– 31st
3rd
– 7th
10th
– 14th
17th
–21st
24th
– 28th
Adv
ertis
e FW
MP
- Wee
kly
New
s
�
�
- CA
H N
otic
e B
oard
�
�
- CA
H A
ll S
taff
emai
l
�
�
- Prim
ary
Sch
ool
N’le
tter
�
�
- GP
s
�
�
- Pae
diat
ricia
ns
�
�
- Sch
ool P
sych
olog
ists
�
�
- Ech
o N
ewsp
aper
�
- Col
ac H
eral
d
�
102
WH
O C
olla
bora
ting
Cen
tre fo
r Obe
sity
Pre
vent
ion,
Dea
kin
Uni
vers
ity R
epor
t 6: L
esso
ns le
arne
d fro
m C
olac
’s B
e A
ctiv
e E
at W
ell p
roje
ct
Obj
ectiv
e 9b
Febr
uary
04
Mar
ch 0
4
Apr
il 04
M
ay 0
4 Ju
ne 0
4 Ta
sks
2nd
– 6th
9th
– 13th
16th
– 20th
23rd
– 27th
1st
– 5th
8th
– 12th
15th
– 19th
22nd
– 26th
29th
– 2nd
5th
– 9th
12th
– 16th
19th
– 23rd
26th
– 30th
3rd
– 7th
10th
– 14th
17th
– 21st
24th
28th
31st
– 4th
7th
– 11th
14th
- 18th
21st
– 25th
Food
Ret
aile
r R
esou
rces
Con
tent
for h
ando
ut
C
onte
nt fo
r cos
ting
tool
Con
tent
for m
edia
gui
de
P
roof
s fo
r han
dout
Prin
t/Lam
inat
e ha
ndou
t
Pho
toco
py c
ostin
g to
ol
Pho
toco
py m
edia
gui
de
Com
mun
ity R
esou
rces
Dev
elop
bra
ndin
g
Dev
elop
slo
gans
Dev
elop
‘how
ofte
n’
clau
se
Con
tent
for c
ertif
icat
e
Con
tent
for s
ticke
r
Con
tent
for w
ritte
n ad
verts
103
WH
O C
olla
bora
ting
Cen
tre fo
r Obe
sity
Pre
vent
ion,
Dea
kin
Uni
vers
ity R
epor
t 6: L
esso
ns le
arne
d fro
m C
olac
’s B
e A
ctiv
e E
at W
ell p
roje
ct
104
WH
O C
olla
bora
ting
Cen
tre fo
r Obe
sity
Pre
vent
ion,
Dea
kin
Uni
vers
ity R
epor
t 6: L
esso
ns le
arne
d fro
m C
olac
’s B
e A
ctiv
e E
at W
ell p
roje
ct
Fe
brua
ry 0
4 M
arch
04
A
pril
04
May
04
June
04
Task
s
2nd
– 6th
9th
– 13th
16th
– 20th
23rd
– 27th
1st
– 5th
8th
– 12th
15th
– 19th
22nd
– 26th
29th
– 2nd
5th
– 9th
12th
– 16th
19th
– 23rd
26th
– 30th
3rd
– 7th
10th
– 14th
17th
– 21st
24th
28th
31st
– 4th
7th
– 11th
14th
- 18th
21st
– 25th
Con
tent
for r
adio
ad
verts
Con
tent
for p
oste
rs
C
onte
nt fo
r pam
phle
ts
P
roof
s fo
r cer
tific
ate
P
roof
s fo
r stic
ker
P
roof
s fo
r writ
ten
adve
rts
Pro
ofs
for r
adio
adv
erts
Pro
ofs
for p
oste
rs
P
roof
s fo
r pam
phle
ts
P
rintin
g of
cer
tific
ates
Prin
ting
of s
ticke
r
Prin
ting
of w
ritte
n ad
verts
Prin
ting
of p
oste
rs
P
rintin
g of
pam
phle
ts
Writ
e m
edia
rele
ase
Cam
paig
n
Org
anis
e pr
ize
cheq
ues
Con
firm
with
May
or
R
elea
se m
edia
st
atem
ent
105
WH
O C
olla
bora
ting
Cen
tre fo
r Obe
sity
Pre
vent
ion,
Dea
kin
Uni
vers
ity R
epor
t 6: L
esso
ns le
arne
d fro
m C
olac
’s B
e A
ctiv
e E
at W
ell p
roje
ct
Fe
brua
ry 0
4 M
arch
04
A
pril
04
May
04
June
04
Task
s
2nd
– 6th
9th
– 13th
16th
– 20th
23rd
– 27th
1st
– 5th
8th
– 12th
15th
– 19th
22nd
– 26th
29th
– 2nd
5th
– 9th
12th
– 16th
19th
– 23rd
26th
– 30th
3rd
– 7th
10th
– 14th
17th
– 21st
24th
28th
31st
– 4th
7th
– 11th
14th
- 18th
21st
– 25th
May
or la
unch
:
- pre
sent
cer
tific
ate
- p
rese
nt s
ticke
r
- pre
sent
priz
e ch
eque
s
- in
shop
pos
ters
- in
shop
pam
phle
ts
W
eekl
y ne
wsp
aper
ad
verts
Wee
kly
radi
o ad
verts
Adv
erts
in n
ewsl
ette
rs
Fo
llow
-up
med
ia re
leas
e
106 WHO Collaborating Centre for Obesity Prevention, Deakin University Report 6: Lessons learned from Colac’s Be Active Eat Well project
SECTION 2: COMMUNICATION PROTOCOL Publications The Colac Project Manager is the central coordination point for all BAEW related communications. To ensure that BAEW communications are as effective and consistent as possible it is important that all proposed publications be submitted to the Colac Project Manager before going to print. This includes:
All work in progress documents must be clearly labelled DRAFT. When material is sent to external stakeholders all documents must be accompanied by the BAEW summary.
Branding When preparing your BAEW publication, there are two logos and an acknowledgement that are to be used (if appropriate):
1. BAEW logo 2. State Government of Victoria (Victoria the place to be) logo 3. ‘BAEW is an initiative of the Victorian Government’s Department of Human
Services.’ Generally the State Government of Victoria logo will only be used when DHS has signed off approval for the content. If you are in any doubt as to which branding to use please contact the Colac Project Manager or the DHS Project Manager. Contact: Colac Project Manager: … DHS Project Manager …..
Media protocol All inquiries from the media should be referred initially to the DHS Media Unit for information and advice on how the matter should be handled. This includes inquiries from local and state-wide newspapers, television and radio. BAEW project staff should NOT, under most circumstances, comment directly to the media without obtaining the appropriate authorisation to do so. In the event of an incident occurring that may create media interest, the Media Unit is to be notified as soon as possible. Contact: Bram Alexander, DHS Media Unit, ph: 9616 8803, mobile: 0412 260 811
107 WHO Collaborating Centre for Obesity Prevention, Deakin University Report 6: Lessons learned from Colac’s Be Active Eat Well project
Appendix F: Results from the School Environmental Audit
Table F.1: BAEW school profile and survey respondent results School Profile n Student population Public 15 3484Catholic 2 389Private 1 240Total 18 4113Survey Respondents Baseline n (%) Follow-up n (%) Principals 1 (2) 14 (47) Teachers 36 (77) 12 (40) Deputy Principals 3 (6) 0Senior Administrators 1 (2) 4 (13) Welfare/Guidance officers 2 (4) 0Other 4 (9) 0Total 47 30
108
WH
O C
olla
bora
ting
Cen
tre fo
r Obe
sity
Pre
vent
ion,
Dea
kin
Uni
vers
ity R
epor
t 6: L
esso
ns le
arne
d fro
m C
olac
’s B
e A
ctiv
e E
at W
ell P
roje
ct
Tab
le F
.2: A
sses
smen
t of w
hat a
reas
are
incl
uded
in th
e sc
hool
’s h
ealth
y ea
ting
polic
y.
Hea
lthy
eatin
g po
licy
incl
udes
:
Inte
rven
tion
Con
trol
Follo
w-u
p1 B
asel
ine2
Follo
w-u
p3
Yes
No
n/a4
Yes
No
n/a
Yes
No
n/a
Wha
t foo
d is
ava
ilabl
e 3
11
22
31
1A
vaila
bilit
y of
wat
er
52
23
2R
estri
ctin
g ac
cess
to st
ores
/out
lets
23
41
4Fo
od a
ssoc
iatio
n w
ith fu
ndra
isin
g 3
21
31
4Fo
od a
ssoc
iatio
n w
ith sp
ecia
l eve
nts
32
13
32
Ven
ding
mac
hine
s at t
he sc
hool
5
45
Info
rmat
ion
to p
aren
ts a
bout
hea
lthy
food
/eat
ing
41
31
32
Teac
hing
focu
sing
on
food
and
nut
ritio
n 5
44
1Se
tting
asi
de ti
me
for c
hild
ren
to e
at lu
nch
52
23
2Th
e ty
pe o
f foo
d th
at m
ay b
e br
ough
t fro
m h
ome
23
13
5St
aff a
ctin
g as
role
mod
els f
or h
ealth
y ea
ting
41
22
23
Enco
urag
ing
child
ren
to a
dopt
hea
lthy
eatin
g be
havi
ours
5
31
41
Ope
ratin
g sc
hool
food
serv
ice
for p
rofit
3
11
44
1
1 Onl
y fo
llow
-up
data
is p
rese
nted
for t
he in
terv
entio
n sc
hool
s, as
at b
asel
ine
no sc
hool
s had
a w
ritte
n he
alth
y ea
ting
polic
y, n
=5.
2 Con
trol s
choo
ls a
t bas
elin
e w
ith a
hea
lthy
eatin
g po
licy,
n=4
3 C
ontro
l sch
ools
at b
asel
ine
with
a h
ealth
y ea
ting
polic
y, n
=5
4 Not
app
licab
le (n
/a) w
as in
clud
ed a
s an
optio
n be
caus
e so
me
scho
ols w
ith a
writ
ten
heal
thy
eatin
g po
licy
did
not o
ffer
a fo
od se
rvic
e at
thei
r sch
ool a
t fol
low
-up.
109
WH
O C
olla
bora
ting
Cen
tre fo
r Obe
sity
Pre
vent
ion,
Dea
kin
Uni
vers
ity R
epor
t 6: L
esso
ns le
arne
d fro
m C
olac
’s B
e A
ctiv
e E
at W
ell P
roje
ct
Tab
le F
.3: T
he a
vaila
bilit
y of
sele
ct fo
ods a
nd d
rink
s fro
m th
e Fo
od se
rvic
e.
Food
Item
B
asel
ine
Follo
w-u
p A
ll th
e tim
e/Fr
eque
ntly
Som
etim
es/
Rar
ely
or
neve
rA
ll th
e tim
e/Fr
eque
ntly
Som
etim
es/
Rar
ely
or n
ever
Inte
rven
tion5
Frui
t2
41
4M
ilk4
24
1Fr
uitJ
uice
51
50
Pies
60
50
Cris
ps4
22
3Fi
lled
Rol
ls
60
50
Con
trol
6
Frui
t5
77
4M
ilk11
110
1Fr
uit J
uice
11
110
1Pi
es12
011
0C
risps
84
56
Fille
d R
olls
11
110
1
5 Inte
rven
tion
scho
ols w
ith a
food
serv
ice,
bas
elin
e n=
6, fo
llow
-up
n=5.
6 C
ontro
l sch
ools
with
a fo
od se
rvic
e, b
asel
ine
n=12
, fol
low
-up
n=11
.
Tab
le F
.4: A
vera
ge c
ost (
$) o
f sel
ect f
ood
item
s ava
ilabl
e fr
om th
e sc
hool
food
serv
ice.
Food
Item
s
Inte
rven
tion
Con
trol
Bas
elin
em
ean
(ran
ge)
Follo
w-u
p m
ean(
rang
e)B
asel
ine
mea
n(ra
nge)
Follo
w-u
p
mea
n (r
ange
) Fr
uit
$0.6
2 (0
.50-
1.00
) $0
.60
(0.6
0-0.
60)
$0.9
0 (0
.50-
2.00
) $0
.93
(0.6
0-2.
00)
Milk
$1.2
0 (1
.10-
1.50
) $1
.08
(0.8
0-1.
70)
$1.3
2 (1
.00-
1.50
) $1
.16
(0.5
0-1.
50)
Frui
t Jui
ce
$1.0
4 (1
.00-
1.15
) $1
.35
(1.0
0-2.
00)
$1.1
6 (0
.80-
1.40
) $1
.32
(0.8
0-2.
50)
Pies
$2.1
0 (1
.80-
2.50
) $2
.35
(1.9
0-3.
00)
$2.1
6 (1
.80-
2.70
) $2
.37
(2.0
0-2.
90)
Cris
ps$0
.60
(0.6
0-0.
60)
$0.6
5 (0
.60-
0.70
) $0
.93
(0.6
0-1.
40)
$1.0
0 (0
.70-
1.80
) Fi
lled
Rol
ls
$2.3
5 (1
.40-
3.60
) $3
.08
(2.6
0-4.
00)
$2.8
4 (1
.80-
4.00
) $3
.40
(2.4
0-4.
00)
Tab
le F
.5: A
nsw
ers t
o th
e qu
estio
n “D
oes t
he F
ood
serv
ice
prov
ide
food
s with
hig
h nu
triti
onal
val
ue?”
In
terv
entio
n1B
asel
ine
Follo
w-u
p St
rong
ly A
gree
A
gree
2N
eith
er1
2D
isag
ree
51
Stro
ngly
Dis
agre
e C
ontr
ol2
Bas
elin
e Fo
llow
-up
Stro
ngly
Agr
ee
2A
gree
2N
eith
er4
3D
isag
ree
63
Stro
ngly
Dis
agre
e 2
11 In
terv
entio
n sc
hool
s with
a fo
od se
rvic
e, b
asel
ine
n=6,
follo
w-u
p n=
5.
2C
ontro
l sch
ools
with
a fo
od se
rvic
e, b
asel
ine
n=12
, fol
low
-up
n=11
.
110
WH
O C
olla
bora
ting
Cen
tre fo
r Obe
sity
Pre
vent
ion,
Dea
kin
Uni
vers
ity R
epor
t 6: L
esso
ns le
arne
d fro
m C
olac
’s B
e A
ctiv
e E
at W
ell P
roje
ct
111
WH
O C
olla
bora
ting
Cen
tre fo
r Obe
sity
Pre
vent
ion,
Dea
kin
Uni
vers
ity R
epor
t 6: L
esso
ns le
arne
d fro
m C
olac
’s B
e A
ctiv
e E
at W
ell P
roje
ct
Tab
le F
.6: A
nsw
ers t
o th
e qu
estio
n “I
n th
e pa
st 1
2 m
onth
s hav
e an
y so
ft d
rink
/fast
food
com
pani
es sp
onso
red
any
fund
rais
ing
or o
ther
even
ts a
t sch
ool?
”In
terv
entio
n7 C
ontr
ol8
Bas
elin
eFo
llow
-up
B
asel
ine
Follo
w-u
p
Yes
21
47
No
45
85
Tab
le F
.7: A
sses
smen
t of w
hat a
reas
are
incl
uded
in th
e sc
hool
’s p
hysi
cal a
ctiv
ity p
olic
ies.
Phys
ical
act
ivity
pol
icy
incl
udes
:
Inte
rven
tion
C
ontr
olB
asel
ine
Follo
w-u
p B
asel
ine
Follo
w-u
p Y
esN
oY
esN
oY
esN
oY
esN
oU
se o
f sch
ool g
roun
ds ‘o
ut o
f hou
rs’
32
24
45
45
Acc
ess t
o eq
uipm
ent
41
60
72
90
Cyc
ling
to sc
hool
3
25
14
56
3Pa
rtici
patio
n in
spor
ts a
nd P
E 5
06
09
09
0H
ats f
or o
utsi
de p
lay
32
51
63
90
Ensu
ring
all s
tude
nts c
an p
artic
ipat
e 5
06
08
19
0Te
achi
ng fo
cusi
ng o
n ph
ysic
al a
ctiv
ity in
the
curr
icul
um
50
60
90
90
7 Inte
rven
tion
scho
ols,
n=6.
8 C
ontro
l sch
ools
, n=1
2.
112
WH
O C
olla
bora
ting
Cen
tre fo
r Obe
sity
Pre
vent
ion,
Dea
kin
Uni
vers
ity R
epor
t 6: L
esso
ns le
arne
d fro
m C
olac
’s B
e A
ctiv
e E
at W
ell P
roje
ct
Tab
le F
.8: A
vera
ge n
umbe
r of
hou
rs (m
ean)
dev
oted
to P
hysi
cal E
duca
tion/
Spor
t per
wee
k fo
r ea
ch y
ear
leve
l Y
ear
Lev
el
Inte
rven
tion
Con
trol
Bas
elin
e m
ean
hrs (
rang
e)
Follo
w-u
p m
ean
hrs (
rang
e)
Bas
elin
e m
ean
hrs
(ran
ge)
Follo
w-u
p m
ean
hrs
(ran
ge)
Prep
1.75
(1.5
0-2.
50)
1.38
(0.7
5-2.
00)
1.98
(0.7
5-3.
50)
1.58
(1.0
0-2.
50)
Gra
des 1
-2
1.33
(1.0
0-2.
00)
1.38
(0.7
5-2.
00)
1.73
(0.7
5-3.
00)
1.58
(1.0
0-2.
50)
Gra
des 3
-4
2.21
(1.7
5-3.
00)
1.46
(0.7
5-2.
00)
2.10
(0.7
5-3.
00)
1.79
(1.0
0-3.
00)
Gra
des 5
-6
2.63
(2.0
0-4.
00)
1.46
(0.7
5-2.
00)
2.60
(0.7
5-4.
50)
1.79
(1.0
0-3.
00)
113 WHO Collaborating Centre for Obesity Prevention, Deakin University Report 6: Lessons learned from Colac’s Be Active Eat Well project
Appendix G: BAEW Community Capacity
Community capacity was defined for this purpose as a collection of characteristics and resources which, when combined, improve the ability of a community to recognise, evaluate and address key problems. The Community Capacity Index (20) was administered for the BAEW Project to assist in identifying the extent of existing capacity to implement the Project. Further it was implemented to gather evidence about the available capacity and to map that evidence against a set of indicators within four domains. The Index examined capacity within the following four domains:
� Network Partnerships - the relationships between groups and organisations within the Project’s network. This included both the comprehensiveness and the quality of the relationships, i.e. are all of the significant groups and organisations involved and what is the nature of their involvement?
� Knowledge Transfer - the development, exchange and use of information
within and between the groups and organisations within the Project’s network.
� Problem Solving - the ability to use well-recognised methods to identify and solve problems arising in the development and implementation of the Project.
� Infrastructure - the level of investment in the Project by the groups and
organisations that make up the Project’s network. Infrastructure includes both tangible and non-tangible investments such as investment in the development of protocols and policy, social capital, human capital and financial capital.
Within the first three domains, three levels of capacity are identified, with each level measured by a set of indicators. The fourth domain, infrastructure, has four levels or sub-domains (policy, financial, human/intellectual, and social investments), also with indicators. The indicators within the Community Capacity Index represent the abilities, behaviours or characteristics of the Project’s network. The mean responses from the aggregate indicator at each level within the four domains are reported. The responses were from the BAEW’s Project network at baseline (Time 1) and then again at follow-up (Time 2). One of four different grades of achievement were recorded against the aggregate indicator; 1) not at all/very limited, 2) somewhat, 3) substantial or 4) almost entirely/entirely (represented on the y-axis in Figures 9-12 in the main report). The presence of particular activities and abilities indicates the level of capacity achieved. The three levels of capacity are described (represented on the x-axis in Figures 9-11, and in Figure 12, the x-axis shows the four levels or sub-domains for Infrastructure). The three levels of capacity represent increasing levels of complexity and sophistication of those domains. Overall, capacity demonstrably increased in all four domains between baseline and follow-up. At baseline, all level one indicators (that represent relatively straight forward indicators of capacity) for Network Partnerships, Knowledge Transfer and Problem Solving (Figures 9-11) scored higher than level two and three indicators
114 WHO Collaborating Centre for Obesity Prevention, Deakin University Report 6: Lessons learned from Colac’s Be Active Eat Well project
(representing more complex Project network processes). However for Knowledge Transfer (Figure 10), level one and two indicators scored equally at baseline. Within the Infrastructure domain (Figure 12), achieved capacity was lowest for financial investments and highest for social investments at baseline. At follow-up, achieved capacity for the first three domains of Network Partnerships, Knowledge Transfer and Problem Solving (Figures 9-11) were relatively equivalent across the three levels. Financial Investment within the Infrastructure domain (Figure 12) achieved a lower capacity than the other investment areas. Policy investment made the highest gain from baseline to follow-up within this domain. The following summarises the project network’s current capacity of the network to achieve its objectives in each domain at baseline and follow-up. Network Partnerships Within the Network Partnership domain, members of the network commented at baseline, on the existence of a strong network partnership that had the capacity to identify organisations and groups to implement the project. Members agreed that the project network had the ingredients and good existing relationships for a strong network partnership but noted that it had not been ‘tested’ or used to develop capacity at that point in time. Members recognised the capacity within the network, to begin identifying other leaders. At follow up, members recognised the role of key partners for support and delivery of objectives and commented that strong partnerships ensured the capacity of the network to roll out the Projects strategies. Comments were made about having ‘strong internal and external partnerships with excellent working relationships’. Knowledge Transfer At baseline, members recognised the importance of knowledge transfer for a smaller community to achieve best practice and service delivery. They acknowledged that this was the responsibility of all staff. The potential for knowledge transfer within and outside the network was not known however, it had not occurred to any extent at that stage;
‘The Project is in its early stage but members are eager and able to transfer knowledge.’
Members also recognised the capacity to integrate a program into mainstream practices. At follow-up, members were able to report on examples of a direct transfer of knowledge and skills and their processes in the delivery of the project and could see the benefit;
‘Knowledge gained by representatives within the network has already been transferred to individual agency work (not just from the evaluation of the project but rather from the implementation and lessons learnt).’
‘…skills directly transferred to the community to be retained in the community.’
115 WHO Collaborating Centre for Obesity Prevention, Deakin University Report 6: Lessons learned from Colac’s Be Active Eat Well project
One member commented that they thought the data collected at baseline was under-utilised. One of the strengths however was the social marketing campaign conducted throughout the project. The following comment viewed by one member reveals the overall sense of the project’s built capacity;
‘The action plan for Be Active Eat Well was developed by the local community. It has systematically shown an increase in the capacity of local children’s settings to promote healthy eating and active play, hence knowledge transfer has occurred.’
Problem Solving Due to the early stage of the project at baseline, it was thought that uncertain reporting relationships may hinder the ability of the network to problem solve. This was quickly rectified with the establishment of Project Infrastructure and Terms of Reference. On reflection at follow-up, members noted an ability to problem solve prior to and during the program intervention phases. It was recognised that this occurred at a steering group level, between project partners and also directly with clubs, schools and parents of participants. It was thought that this was due to ‘working in a multi-disciplinary network that provided opportunities to breakdown barriers and produce lateral approaches to problem solving’. Having a small network that grew together over time was considered beneficial to assist in good management of the Project. Infrastructure At baseline members could identify that infrastructure was available to develop policy, financial capital, human capital and social investments however it was ‘onlyjust starting to be recognised as a means to build upon’. Members of the network saw that strong social and human investments and new relationships were emerging, where previously few links were held. Some aspects of infrastructure were not evident at the beginning however it had potential, e.g. training. Policy was viewed as being ‘distant’ with no policy investments recognised by some at baseline. The network was viewed as still requiring financial and human capital to make it sustainable with one commenting;
‘Financial investments in terms of people’s time is given and external funding makes it easy.’
By the end of the project, members saw investments in the Infrastructure domain and could give examples as evidence of built capacity. Members recognised partnership investments and potential future benefits;
‘Colac Area Health have especially invested a lot in Be Active Eat Well mostly through staffing and other resources. This will continue to help make certain areas (e.g. schools and the Happy Healthy Families Program) continue through the Nutrition Department’.
‘Learnings from Be Active Eat Well will provide better local understanding by Council of the holistic approach required to achieve solutions in childhood obesity’.
116 WHO Collaborating Centre for Obesity Prevention, Deakin University Report 6: Lessons learned from Colac’s Be Active Eat Well project
Policy investment was stronger at follow-up but the financial investment or human capital investment in the broader community was thought to be disappointing at follow-up. Social capital was viewed as good and it was suggested that this was because of the relatively small size of the community.
117 WHO Collaborating Centre for Obesity Prevention, Deakin University Report 6: Lessons learned from Colac’s Be Active Eat Well project
Appendix H: Community Readiness to Change
The Community Readiness to Change Model (28) was designed by the Tri-Ethnic Center for Prevention Research at Colorado State University to provide a theoretical basis for understanding and community readiness. It forms a basis to understanding a community’s preparedness to take action on an issue. In this case it was applied to obesity prevention. The model has six dimensions; Dimension A. Community Knowledge about the Issue (Obesity Prevention) Dimension B. Existing Community Efforts Dimension C. Community Knowledge of the Efforts Dimension D. Leadership (includes appointed leaders & influential community members) Dimension E. Community Attitudes Dimension F. Resources Related to the Issue (people, money, time, space, etc.) The Community Readiness to Change Model was only administered at the completion of the BAEW Project to assist in explaining changes in the outcome variables of the project and potentially contributing to recommendations for ensuring sustainability. The administration of the tool provided useful qualitative data on the community’s strengths and barriers to the implementation of the Project. Twelve key stakeholders were interviewed against a pre-determined set of questions in each dimension (refer to Report 6 on methodology). Their responses were scored against a set of statements and when analysed related to the following stages of readiness; Score Stage of Readiness Description 1 No Awareness Issue is not generally recognised by the community
or its leaders as a problem (or it may truly not be an issue)
2 Denial/Resistance At lease some community members recognize that it is a problem, but there is little recognition that it might be a local problem
3 Vague Awareness Most feel that there is a local problem, but there is not immediate motivation to do anything about it.
4 Preplanning There is clear recognition that something must be done, and there may even be a committee. However, efforts are not focussed or detailed.
5 Preparation Active leaders begin planning in earnest. Community offers modest support of efforts.
6 Initiation Enough information is available to justify efforts. Activities are underway.
7 Stabilization Activities are supported by administrator or community decision makers. Staff are trained and experienced.
8 Confirmation / Expansion
Standard efforts are in place. Community members feel comfortable using services, and they support expansions. Local data are regularly obtained.
9 High Level of Community Ownership
Detailed and sophisticated knowledge exists about prevalence, causes and consequences. Effective evaluation guides new directions. Model is applied to other issues.
118 WHO Collaborating Centre for Obesity Prevention, Deakin University Report 6: Lessons learned from Colac’s Be Active Eat Well project
Using the Community Readiness assessment at the completion of the project showed that the BAEW Project was, overall, at the ‘Initiation’ Stage of Readiness, having an overall score of 6. The ‘Initiation’ Stage is described as having enough information available to justify efforts and activities are underway. The scores for each dimension was a follows Dimension A. Community Knowledge about the Issue Stage: 5 Preparation: active leaders begin planning in earnest. Community
offers modest support of efforts. Dimension B. Existing Community Efforts Stage: 7 Stabilisation: activities are supported by administrator or community
decision makers. Staff are trained and experienced. Dimension C. Community Knowledge of the Efforts Stage: 6 Initiation: Enough information is available to justify efforts. Activities
are underway. Dimension D. Leadership Stage: 6 Initiation: Enough information is available to justify efforts. Activities
are underway. Dimension E. Community Attitudes Stage: 6 Initiation: Enough information is available to justify efforts. Activities
are underway. Dimension F. Resources Related to the Issue Stage: 6 Initiation: Enough information is available to justify efforts. Activities
are underway. Because the Community Readiness Model was implemented only at the completion of the project, these scores are not significantly valuable. What is of more interest is the analysis of the qualitative data on the community’s strengths (lessons learnt) and barriers to the implementation of the Project. For this purpose, the results from five key indicator questions under three areas have been extracted from the Community Readiness interviews of the key stakeholders. The key questions were: Community Efforts (programs, activities, policies etc)
What worked well out of these prevention efforts? What could be improved? Is there a need to expand these efforts/services? If not, why not?
Community Knowledge of Efforts
How could the community’s knowledge about these efforts be improved? Community Attitude
What are the obstacles to promotion of physical activity and/or healthy eating in your community?
119 WHO Collaborating Centre for Obesity Prevention, Deakin University Report 6: Lessons learned from Colac’s Be Active Eat Well project
Twelve key stakeholders were interviewed and the following is a broader summary of the overall responses to the key questions. What works well out of these prevention efforts? When answering this question a few respondents referred to specific programs that had been implemented. Overall the majority agreed that the After School Activity Program was the most successful program, followed by the ‘Be Active Schools Initiative’ then the Healthy Happy Families parenting program.
After School Activity Program: …it has addressed the need that was in the community and it’s created good links between schools and sport’s clubs for example, and it’s been easy to implement and it’s achieved the goal the project ….it is sustainable, so the schools and the Shire can keep it running in the absence of BAEW program staff. (B4)
…it’s actually been picked up and used in north Geelong so it’s transferable, it’s been a really successful program. (B1)
The ‘Be Active Schools’ program was considered to work well after some initial adjustments and finding a way to work with the schools to create a win-win situation;
Working with the primary schools we had our ups and downs trying different ways to engage with them. The final way that we have tried has worked really well which is a decentralizing approach - instead of asking them to come to us and meet externally to the school, we actually go into each school individually and work out an action plan for each school … you’ve got to make it really easy for them,…. has made it really successful.(B1) …the schools have really appreciated our efforts in terms of being involved in the schools (B3)
Other respondents spoke in a more general way when answering this question (what works well out of these prevention efforts?). A few mentioned capacity building aspects that have occurred throughout the project that have worked well on a range of groups, raising the capacity of the groups to work together. Also, the partnerships that have developed and been integral to the BAEW Project were recognised.
I think there’s good partnerships being built. Working with Neighbourhood Renewal means that they’ve been able to link with vulnerable and disadvantaged communities, overall they’ve done a great job. (B11) I think with our project we’ve had such great partnerships and that without those we couldn’t have done a lot of what we have done, so having a really good partnership with the Colac Otway Shire, with the Neighbourhood Renewal project which started after us, a Colac network of schools,… the partnerships have been really crucial to making the whole thing successful overall, and I think the partnership with Deakin in terms of having the project really well evaluated has worked well, they’ve been able to help us, support us as well as evaluate, so it’s been good. (B1)
120 WHO Collaborating Centre for Obesity Prevention, Deakin University Report 6: Lessons learned from Colac’s Be Active Eat Well project
One respondent acknowledged how the community was receptive to trialling BAEW’s strategies and then being able to see the results for themselves, thus the community did not require much convincing to get them onboard. This was probably in part due to the decision by the Project Coordinator to start with some of the easier strategies of the action plan, get them underway to assist in keeping the momentum going and getting some runs on the board or quick results. Also it was acknowledged that the Council’s commitment to the Project was a major benefit as they were prepared to take on strategies of their own in partnership with local key stakeholders What could be improved in these prevention efforts? Overall, seven main themes emerged when analysing the responses from the key stakeholders. These were around partnerships; engagement of parents and the community; having higher profile champions; having more policy based approaches; government approaches and support; resources; and communication. Partnerships, engagement and champions Two respondents thought that the engagement of more community partners would have benefited the sustainability of the Project ‘so the more they can be involved the better off the program is as in terms of sustaining it over the long term...’ It was also viewed that if the engagement of parents and getting the Project’s messages across to this group was more successful in the beginning then the outcomes of the project would have been enhanced by that. On this view it was thought that if the project could have been enhanced if the focus was more on community development rather than just physical activity and healthy eating. Engaging higher profile champions was also viewed as an area that could have been developed further.
Policy based approaches and government approach Strong views were made in favour of policy based approaches which underpin sustainability at the community level, with industry (Hot Chips program) and at a government level.
… the more potent and sustainable ones are going to be ones that are related to policies and rules and that sort of thing, so when the canteen policies are instituted when they have regular fruit breaks which become institutionalized, then they have policies around what you’re supposed to bring in your water bottle, and we also saw it with the hot chips program, where we tried to change deep frying patterns and the fat content of chips through education and promotion rather than through rules and policies. We found that the education required a lot of effort the operators kept changing etc, so I think in general we have to move towards more policy based approaches.(B9)
ResourcesResources for the project from training, key partners, to funding were viewed as necessary for continuity.
I think that any prevention efforts requires an injection of support at regular intervals or it will eventually run out of effort potentially it depends very much if you get a change of people that are involved in it. The improvement to me is really a part of making certain that there are groups in the community that will be responsible for keeping some sort of sustainable contact with the different groups or different schools or bodies that you’re dealing with so you keep the network going of support.(B6)
121 WHO Collaborating Centre for Obesity Prevention, Deakin University Report 6: Lessons learned from Colac’s Be Active Eat Well project
Communication BAEW maintained a well structured and executed communication plan (Appendix E) however the philosophy of the project and how that was portrayed could have been improved according to one of the key stakeholders.
I think also the communication around the project and whether it was an obesity prevention project or a community capacity project, that could have been improved, we could have…, I think we went along with two philosophies to start with, obesity prevention and we were talking obesity and then there were also building capacity, building setting’s ability to promote healthy eating and physical activity, and for a while they went along hand in hand and that was fine, but when we got to weighing and measuring the children and the families getting feedback on the individual child it kind of …, that’s when there was a bit of a conflict because we lost capacity at that point in the project, so the philosophies didn’t blend well from there. From then on we restructured, ‘ok we don’t talk obesity, we talk healthy eating and physical activity’, so I think that communication, it was something that we learnt along the way, having, been clear of your philosophy at the start, and I think that we are a bit unique too because of the way we started. It wasn’t us saying we wanted this project or applying for funding. People came to us and said do you want to do this? So it was a little different but I think it could have been improved…, that guiding philosophy.(B1)
Turning to the programs that were implemented for BAEW, the Active Transport program was the only one viewed as requiring a totally different approach. Feedback showed that not enough research was conducted into understanding the reasons and the barriers to why people don’t actively walk or cycle. More planning was required around the walk-ability of the community. Also some issues arose about ownership and funding for schools for the Walking School Bus and thus building rapport and delivering resources were perceived as needing more attention. Respondents were able to reflect on other programs delivered through BAEW and consider some valuable lessons learnt. Comments can be viewed in Appendix H. These ranged from recognising that only a certain degree of change can occur through education and support without policy/government or even legal intervention to support environmental change with the Hot Chips program; to challenging philosophies, beliefs and attitudes; and recognising that engaging with schools is a negotiated business, taking time to negotiate the best way to work together and recognising that this may be different for each school. Only one comment was made in terms of project management. Risk management was identified as a process that could have been conducted more comprehensively: Is there a need to expand these effort/services? If not, why not? The majority of respondents agreed that the efforts and services created by BAEW needed to be at least maintained or expanded. However the sustainability of the programs put in place by BAEW were highlighted as a concern due to the capacity (resources) required to continue or maintain the efforts.
Well there definitely is, obviously, but it needs to be done along a smart track of what works and what doesn’t and it does need to be evaluated along the way
122 WHO Collaborating Centre for Obesity Prevention, Deakin University Report 6: Lessons learned from Colac’s Be Active Eat Well project
so that we know where to put future efforts. I think if one was going to continue this and to roll it out to other communities then we would need to make it much more efficient I guess about how it was done to make it cost effective.(B9)
I think there is a need to expand in terms of continuity and just reinforcing those messages continuously but from our point of view its about reviewing how we provide those services and ensuring that they’re up to date with the needs and the appropriateness of the community needs. So yes I think there’s need to expand and also review as we’re doing that.(B8) I think there is a need to expand the effort but the rate of expansion is going to be controlled by the commitment that different people in the community can make and whether or not they are curtailed by funding. Efforts to go forward really depend on funding, there’s very few voluntary groups that can take up a large cause left in the community these days and there’s restrictions on the existing workforce, some of the sustainability that has been left behind with BAEW into the organizations that they’ve worked with means that they will be efforts to make aspects of that project continue.(B6)
One view was more cautious:
I don’t think there’s a need to expand them yet, as I was saying before if we’re really going to do it right I think we need to sell the message of what’s being achieved in BAEW and it seems like we are going to show positive results and then if that’s the case it almost needs to go back to a governmental level to say how can we support communities to do this through law, changing and supporting the environment in which we work with, rather than throwing more money at the interventions and trying to battle through it they could put more research in trying to say right if we make this intervention into law and stuff that almost paves the way for people like myself, project workers to implement the strategies, it cuts down the time immensely. If we are going to put money into it, to put it that way.(B2)
What are the obstacles to promotion of physical activity and or healthy eating in your community? A number of respondents spoke about the broader picture in terms of influences from the macro environment. These included ‘TV advertising, the fast food industry and other groups or organisations or businesses that promote products for kids that promote sedentary behaviour and unhealthy eating that require counteracting at a broader level than at the community level’ (B4); …and ‘the availability of, and the number of outlets that provide energy dense foods’(B2).
Another theme that was emphasised was the competing priorities of health and education in the school setting against other core curriculum items and the question of responsibility of schools to promote health, and if doing so the support (e.g. canteen managers network) to do it well The urban environment, transport in and around Colac and lack of public transport, the weather and supposedly lack of initiatives to be physically active in winter months and ‘stranger danger’ was considered an issue by a few respondents.
123 WHO Collaborating Centre for Obesity Prevention, Deakin University Report 6: Lessons learned from Colac’s Be Active Eat Well project
One respondent saw the obstacle not as the promotion of physical activity and healthy eating but more the uptake of those messages and another saw it in terms of understanding messages.
I don’t think there are many obstacles in promoting, the obstacles are in the uptake or the willingness to accept. With a smaller rural community I think access to local media, to schools, access to a number of the settings that children or their parents are involved in, I think that can be done fairly well, I think it’s the uptake. So health promotion and getting the message out apart from requiring resources and time and effort and the right message and a lot of background work and not just good will but also the resources to do it, I think that the real obstacle is the uptake of the message.(B5) There’s some barriers in people in terms of understanding the health messages, I think parents think fruit juices are healthy, they think flavoured mineral water is healthy, there are some education points that people have some knowledge deficit, they think muesli bars and fruit straps really contain fruit, they’ve been barriers, I think there ones that we have addressed quite well and you have to keep addressing them as new parents come through so that’s where the sustainability gets a bit difficult, and I don’t think that there is any awareness about issues about television at all, I think that is one for the future. And parents, and being a parent, the TV is a tool for so many things for you in your life that to be challenged on that is really, really difficult. That’s a barrier too.(B1)