16
Be Rational! Clipboard Math #20 **EXPLAIN how you picked your answer.
| Date post: | 24-Dec-2015 |
| Category: |
Documents |
| Upload: | sibyl-gibbs |
| View: | 217 times |
| Download: | 1 times |

Clipboard Math #20
Be Rational!
**EXPLAIN how you picked your answer.
Clipboard Math #20
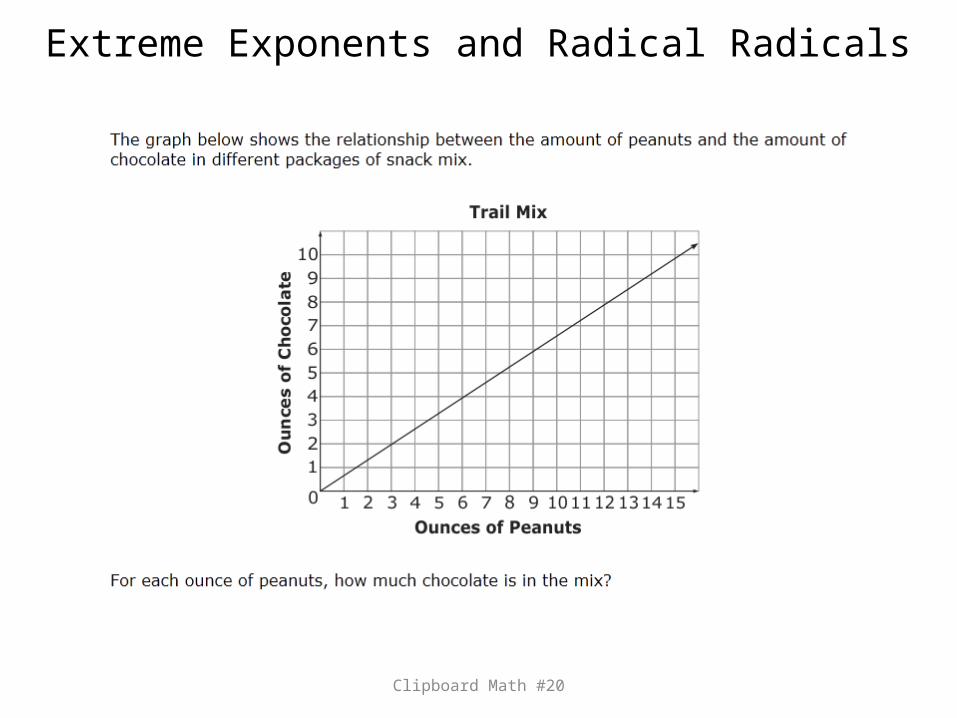
Extreme Exponents and Radical Radicals
Clipboard Math #20
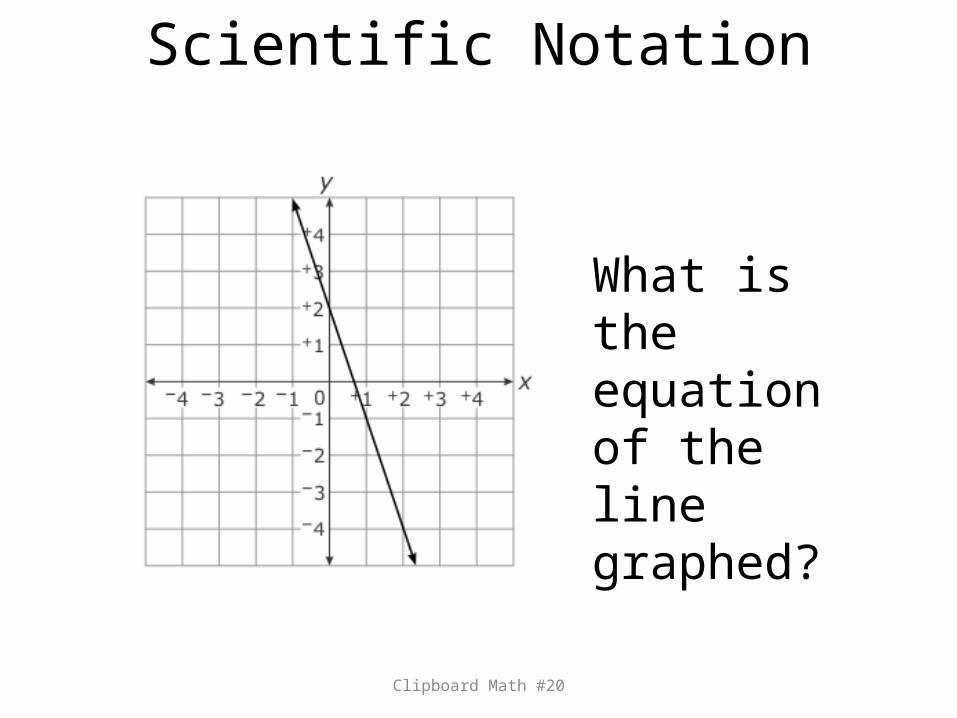
Scientific Notation
What is the equation of the line graphed?

Clipboard Math #20
Slippery Slope
B
D
A
C
Which is the graph of y = 3x - 7?
Clipboard Math #20
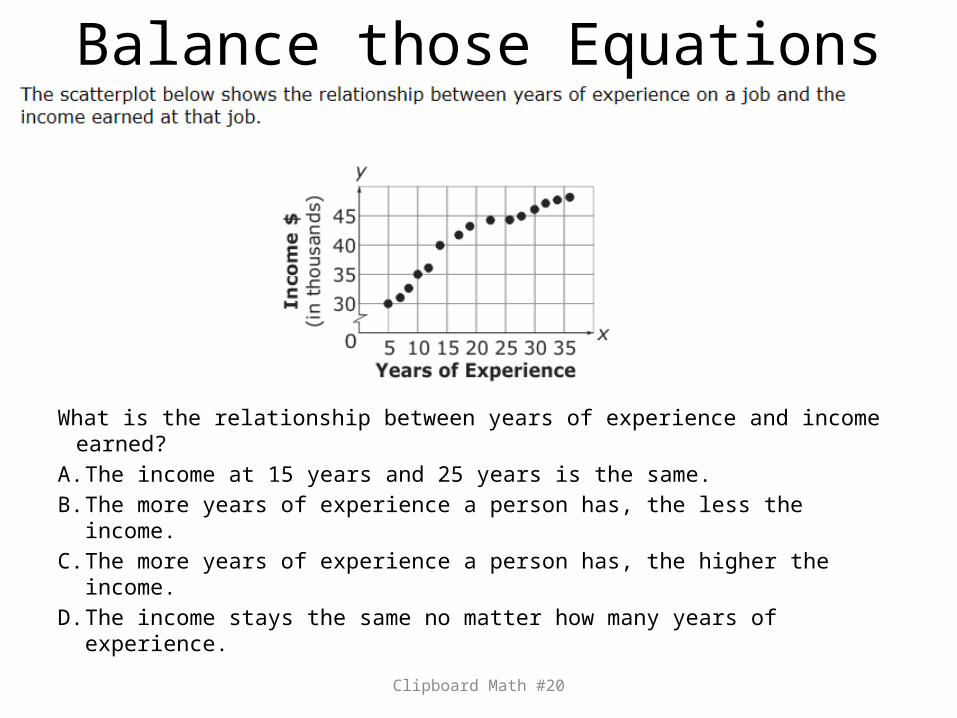
Balance those Equations
What is the relationship between years of experience and income earned?
A. The income at 15 years and 25 years is the same.B. The more years of experience a person has, the less the income.C. The more years of experience a person has, the higher the income.D. The income stays the same no matter how many years of experience.
Clipboard Math #20
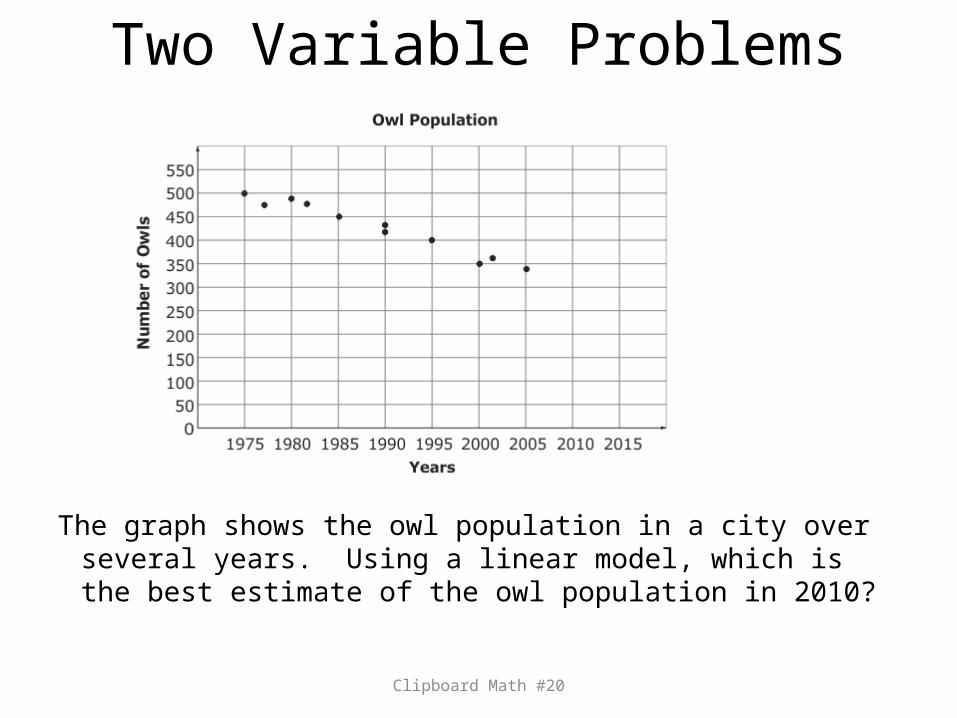
Two Variable Problems
The graph shows the owl population in a city over several years. Using a linear model, which is the best estimate of the owl population in 2010?
Clipboard Math #20
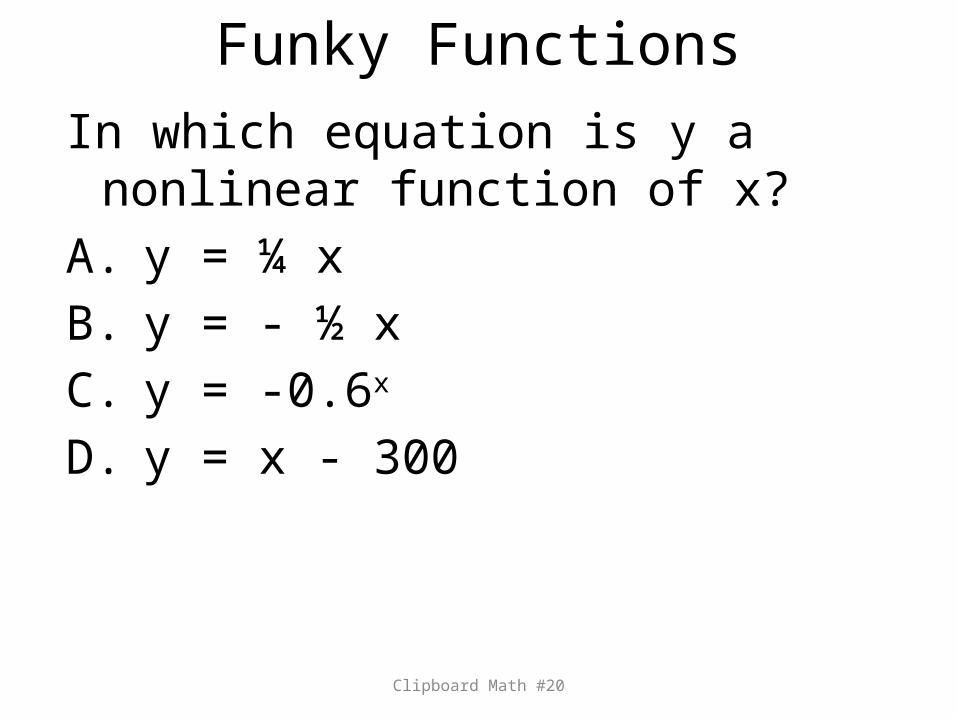
In which equation is y a nonlinear function of x?
A. y = ¼ xB. y = - ½ xC. y = -0.6x
D. y = x - 300
Funky Functions

Clipboard Math #20
Which set of points are linear?
Modeling Relationships
***Please show work to receive credit.
Clipboard Math #20
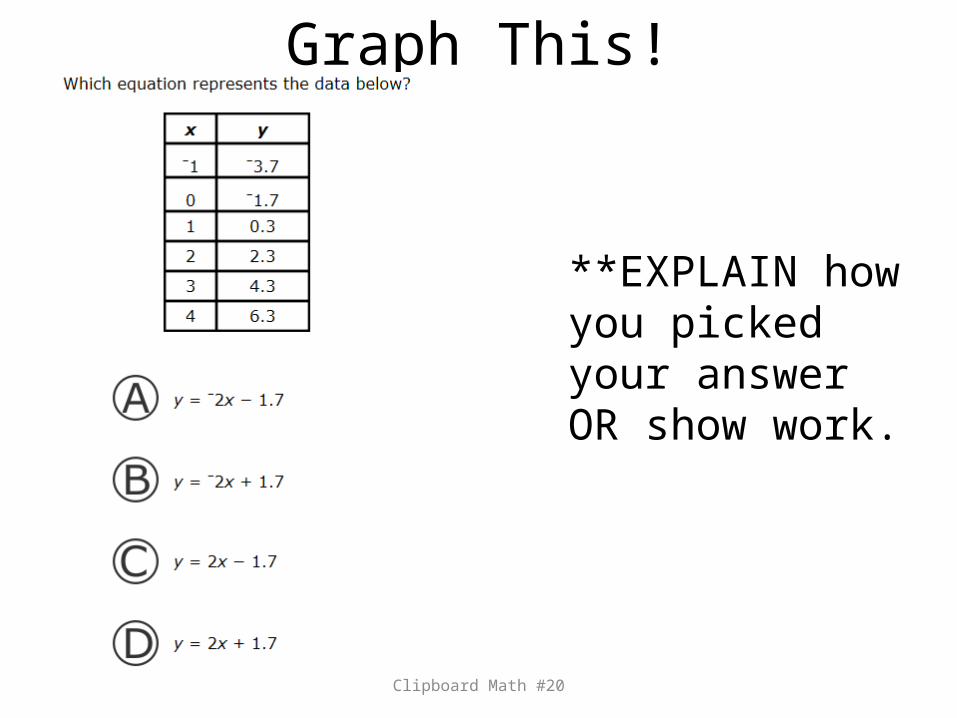
Graph This!
**EXPLAIN how you picked your answer OR show work.
Clipboard Math #20
Write an equation of a line that has a slope of 5 and passes through the point (10, -15).
Transforming Transformations
***Please show work to receive credit.
Clipboard Math #20
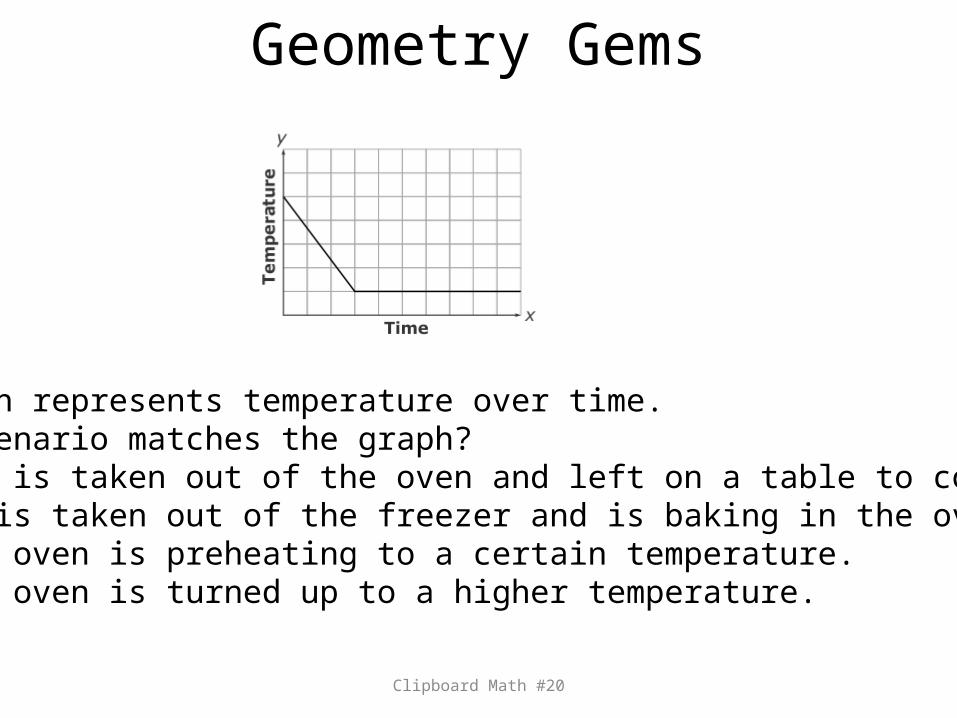
Geometry Gems
The graph represents temperature over time.Which scenario matches the graph?A. A cake is taken out of the oven and left on a table to cool.B. A pie is taken out of the freezer and is baking in the oven.C. A cold oven is preheating to a certain temperature.D. A warm oven is turned up to a higher temperature.

Clipboard Math #20
The graph shows time vs. velocity over a 50-minute period.Which scenario would be best represented by the graph?A. An object increases speed and then loses speed.B. An object continues to move away from a starting point.C. An object moves away from a starting point and then begins to come
back.D. An object increases speed, then moves at a constant rate, and then loses
speed.
Pythagorean Theorem
Clipboard Math #20
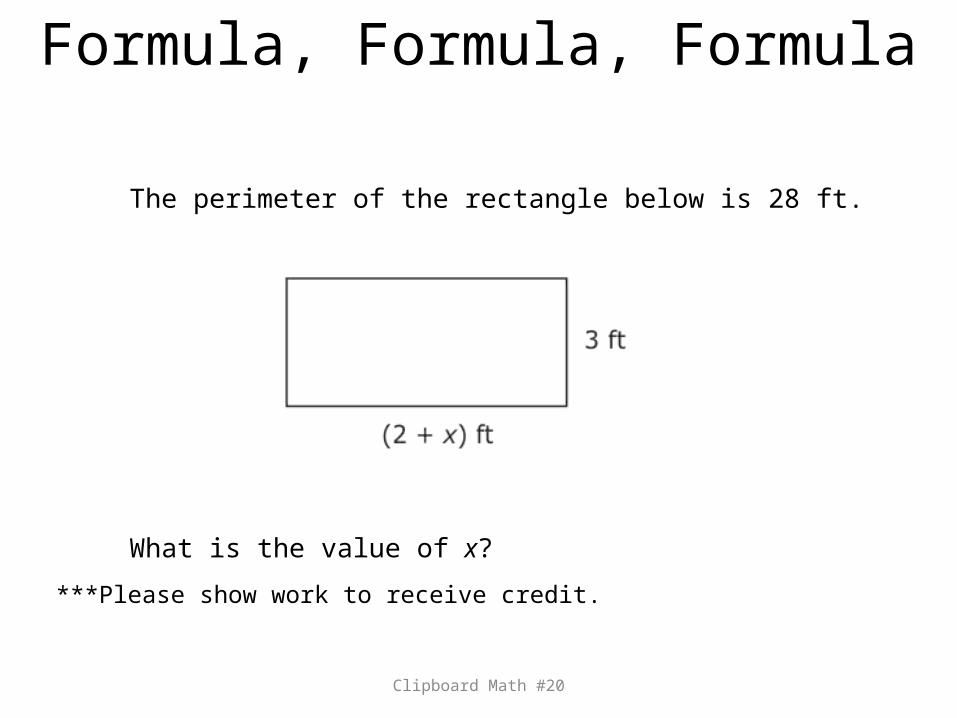
Formula, Formula, Formula
The perimeter of the rectangle below is 28 ft.
What is the value of x?
***Please show work to receive credit.
Clipboard Math #20
Scatterbrained
Three times the difference of a number x and seven is twenty-three minus the sum of three times a number x and two. What is the value of x?
***Please show work to receive credit.

Clipboard Math #20
Data, Data, Data
Triangle STV is shown.
What is the value of x? ***Please show work to receive credit.
Clipboard Math #20
BONUS
Triangle RST has vertices at R(3, 1), S(3, 5), and T(6, 5). What is the perimeter of triangle RST?
***Please show work to receive credit.


![[MS-RDPECLIP]: Remote Desktop Protocol: Clipboard … · Remote Desktop Protocol: Clipboard Virtual Channel ... Remote Desktop Protocol: Clipboard Virtual ... Remote Desktop Protocol:](https://static.documents.pub/doc/80x56/5ae3205b7f8b9a097a8dc1a3/ms-rdpeclip-remote-desktop-protocol-clipboard-desktop-protocol-clipboard.jpg)


