1 International Journal ofScience and Engineering Investigations vol. 1, issue 1, February 2012 Beam Ductility Experiment Using 500 Grade Steel Shohana Iffat 1 , Kazi Maina 2 , Munaz Ahmed Noor 3 1 Lecturer, Ahsanullah University of Science & Technology, Dhaka, Bangladesh. 2 Lecturer, Stamford University, Bangladesh. 3 Professor, Bangladesh University of Engineering & T echnology, (BUET), Dhaka. ( 1 [email protected]) Abstract - There is a growing focus on the ductility ofreinforcing steels following the introduction of Grade 500 steel in Bangladesh. This focus is driven primarily by relief ofcongestion; particularly in buildings assigned a high seismic design category. Very few flexural ductility experiments are available using Grade 500 steel and it is difficult to maintain sufficient ductility using high strength steel. To evaluate the flexural ductility, it is necessa ry to conduct non-linear moment- curvature experiment or numerical analysis. Moment Curvature is a method to accurately determine the load-deformation behavior of a concrete section using nonlinear material stress- strain relationship. The present experiment has been designed to provide detailed information on the sectional ductility properties (moment-curvature and ductility ratio) and neutral axis depth of rectangular beam using Grade 500 steel. Sectional ductility mainly represented by the moment-curvature relationshi p of a section, and from this relation ductility ratio ofa section is determined. Detail test results from this study are presented in this paper. The results of an experimental program on simply supported beams subjected to two-point loading are presented. Nine specimens, with three different reinforcement ratio and three different concrete strengths have been tested. An attempt is made to classify the performance of the specimens according to the ductility they exhibited varying tensile steel ratio and concrete compressive strength. Moment- curvature relation, depth of neutral axis, strain in the materials are considered as performance criteria in this study. From the experiment it has been observed that curvature and ductility ofa high concrete strength beam is higher than a low concrete strength beam. But no significant change in moment capacity with change in concrete strength. The moment capacity is higher in high steel beam than low steel beam. But curvature and ductility of a high steel beam is less than a low steel beam. It has been observed that the analytical values obtained, closer to the experimental results. In this paper concept of minimum flexural ductility was also explained. The use of higher strength steel would allow a higher flexural strength and stiffness to be achieved while maintaining the same minimum level offlexural ductility if steel ratio is properly selected. The use ofhigh strength steel also allows the use of a smaller steel area for a given flexural strength requirement to save the amount ofsteel needed and to avoid steel congestion. Keywords- Beams; Ductility ratio; Grade 500; ReinforcedConcrete; Moment CurvatureI.INTRODUCTIONAn attempt is made to classify the performance of high strength steel specimens according to the ductility they exhibited varying tensile steel ratio and concrete compressive strength. Moment-curvature relation, depth of neutral axis, strain in the materials are considered as performance criteria in this study. Higher grades are often used to permit smaller concrete members, relating to the space problems for placement of the reinforcement. Even though the steel ordinarily constitutes only a few percent of the total volume ofreinforced concrete, it is a major cost factor. This reduction in concrete member and percentage of steel tend to reduce the flexure stiffness and ductility of a member. Flexural strength and stiffness can be easily evaluated using the ordinary beam bending theory, but there exists no simple method for evaluating the flexural ductility of a reinforced concrete (RC) beam. It is generally considered that in the interests of safety, it is essential to pro-vide a certain minimum level of flexural ductility and that for this purpose, just designing the beam sections to be under-reinforced is not sufficient. In most of the existing design codes, reinforcement detailing rules, which impose limits on either the tension steel ratio or the neutral axis depth, have been incorporated to guarantee the provision ofminimum flexural ductility. II.RESEARCH SIGNIFICANCEThe problem of control on reinforcing steel becomes an important issue when one considers seismic loading especially when the structure is made of Grade 500 steel. In areas requiring design for seismic loading, ductility becomes an extremely important consideration . The flexural ductility of the beam section may be evaluated in terms of a curvature ductility factor defined by energy absorption and dissipation of post elastic deformation for survival in major earthquakes. Thus, structures incapable of behaving in a ductile fashion must be designed for much higher seismic forces if collapse is to be avoided. Generally, the ductility may be defined as the capacity of a material, section, structural element, or structure to undergo an excessive plastic deformation without a great loss of its resistance. In order to ensure enough ductility, all the structural elements should be correctly reinforced: the detailed rules created for that purpose, especially in codes of practice, should
Transcript
8/3/2019 Beam Ductility Experiment Using 500 Grade Steel
Science and Engineering Investigations vol. 1, issue 1, February 2012
Beam Ductility Experiment Using 500 Grade Steel
Shohana Iffat1, Kazi Maina
2, Munaz Ahmed Noor
3
1Lecturer, Ahsanullah University of Science & Technology, Dhaka, Bangladesh.2Lecturer, Stamford University, Bangladesh.
3Professor, Bangladesh University of Engineering & Technology, (BUET), Dhaka.([email protected])
Abstract- There is a growing focus on the ductility of reinforcing steels following the introduction of Grade 500 steelin Bangladesh. This focus is driven primarily by relief of
congestion; particularly in buildings assigned a high seismicdesign category. Very few flexural ductility experiments areavailable using Grade 500 steel and it is difficult to maintainsufficient ductility using high strength steel. To evaluate theflexural ductility, it is necessary to conduct non-linear moment-curvature experiment or numerical analysis. Moment Curvatureis a method to accurately determine the load-deformationbehavior of a concrete section using nonlinear material stress-strain relationship. The present experiment has been designedto provide detailed information on the sectional ductilityproperties (moment-curvature and ductility ratio) and neutralaxis depth of rectangular beam using Grade 500 steel. Sectionalductility mainly represented by the moment-curvaturerelationship of a section, and from this relation ductility ratio of
a section is determined. Detail test results from this study arepresented in this paper. The results of an experimental programon simply supported beams subjected to two-point loading arepresented. Nine specimens, with three different reinforcementratio and three different concrete strengths have been tested.An attempt is made to classify the performance of thespecimens according to the ductility they exhibited varyingtensile steel ratio and concrete compressive strength. Moment-curvature relation, depth of neutral axis, strain in the materialsare considered as performance criteria in this study. From theexperiment it has been observed that curvature and ductility of a high concrete strength beam is higher than a low concretestrength beam. But no significant change in moment capacitywith change in concrete strength. The moment capacity ishigher in high steel beam than low steel beam. But curvatureand ductility of a high steel beam is less than a low steel beam.It has been observed that the analytical values obtained, closerto the experimental results. In this paper concept of minimumflexural ductility was also explained. The use of higher strengthsteel would allow a higher flexural strength and stiffness to beachieved while maintaining the same minimum level of flexural ductility if steel ratio is properly selected. The use of high strength steel also allows the use of a smaller steel area fora given flexural strength requirement to save the amount of steel needed and to avoid steel congestion.
Keywords- Beams; Ductility ratio; Grade 500; Reinforced Concrete; Moment Curvature
I. INTRODUCTION
An attempt is made to classify the performance of highstrength steel specimens according to the ductility they
exhibited varying tensile steel ratio and concrete compressivestrength. Moment-curvature relation, depth of neutral axis,strain in the materials are considered as performance criteria inthis study. Higher grades are often used to permit smallerconcrete members, relating to the space problems forplacement of the reinforcement. Even though the steelordinarily constitutes only a few percent of the total volume of reinforced concrete, it is a major cost factor. This reduction inconcrete member and percentage of steel tend to reduce theflexure stiffness and ductility of a member. Flexural strengthand stiffness can be easily evaluated using the ordinary beambending theory, but there exists no simple method forevaluating the flexural ductility of a reinforced concrete (RC)beam. It is generally considered that in the interests of safety, itis essential to pro-vide a certain minimum level of flexuralductility and that for this purpose, just designing the beamsections to be under-reinforced is not sufficient. In most of theexisting design codes, reinforcement detailing rules, whichimpose limits on either the tension steel ratio or the neutral axisdepth, have been incorporated to guarantee the provision of minimum flexural ductility.
II. RESEARCH SIGNIFICANCE
The problem of control on reinforcing steel becomes animportant issue when one considers seismic loading especially
when the structure is made of Grade 500 steel. In areasrequiring design for seismic loading, ductility becomes anextremely important consideration. The flexural ductility of thebeam section may be evaluated in terms of a curvature ductilityfactor defined by energy absorption and dissipation of postelastic deformation for survival in major earthquakes. Thus,structures incapable of behaving in a ductile fashion must bedesigned for much higher seismic forces if collapse is to beavoided.
Generally, the ductility may be defined as the capacity of amaterial, section, structural element, or structure to undergo anexcessive plastic deformation without a great loss of itsresistance. In order to ensure enough ductility, all the structuralelements should be correctly reinforced: the detailed rulescreated for that purpose, especially in codes of practice, should
8/3/2019 Beam Ductility Experiment Using 500 Grade Steel
International Journal of Science and Engineering Investigations, Volume 1, Issue 1, February 2012 2
www.IJSEI.com Paper ID: 10112-01
be respected. Besides, the ductility of the structural elementsdepends directly on the plastic rotation’s capacity of the criticalsections obtained through:
• The choice of suitable ductility characteristics of steel;
• The design of the section so that the position of theneutral axis in failure is small; and
• The adoption of transversal reinforcement with spacingsufficiently small to guarantee a suitable confinement of thecompressed concrete.
In performance-based design an adequate design isproduced when a structure is dimensioned and detailed in sucha way that the local deformation demands are smaller than theircorresponding maximum tolerable limits for each performancelevel. Ideally, the deformation demands and deformationcapacities must be checked at the critical region of all members(i.e., at all plastic hinges) by checking the maximum strain, themaximum strain ductility ratio, the maximum curvature, the
maximum curvature ductility ratio, the maximum rotation orthe maximum rotation ductility with their corresponding limits.
This research would help to understand the ductilityparameters discussed above. This would also provideinformation on role of concrete strength and Grade 500 steelratio on moment-curvature relation, ductility ratio and neutralaxis depth.
III. TEST SPECIMENS
The beams were 7.5 feet c/c long with a 10 inch × 12 inchcross section and clear span was 7ft and 9 inch. They weresimply supported and subjected to a symmetric loadingcomposed of two equal concentrated forces. Such loading led,in theory, to pure bending between applied forces. The failurein the mentioned area between applied forces occurred alwaysby simple bending. A total of nine rectangular concrete beamswere fabricated and tested.
In order to assure a failure by flexure located between thepoint loads, a sufficient amount of stirrups was put in the zoneoutside the point loads in order to prevent failure by shear. Thecentral zone between point loads had no stirrups to avoidconfinement of the concrete. Since this zone was, in theory, inpure bending, the stirrups would not be necessary as far as theresistance is concerned. Out of nine, three beams werereinforced with 3 #6 Grade 500 steel rebars, other three beamswere reinforced with 2#6 Grade 500 steel rebars and rest threebeams were reinforced with 2#5 Grade 500 steel rebars in thetension side. The clear cover was 1 inch. Each beams had toprovide 2#3 top bars for holding the stirrup. All beams werereinforced against shear failure by placing #3 Grade 500 steelat a spacing of 5 in centre to centre closed-type stirrups for 5.25and 6.5 ksi concrete and 3 in centre to centre for 7.25 ksiconcrete.
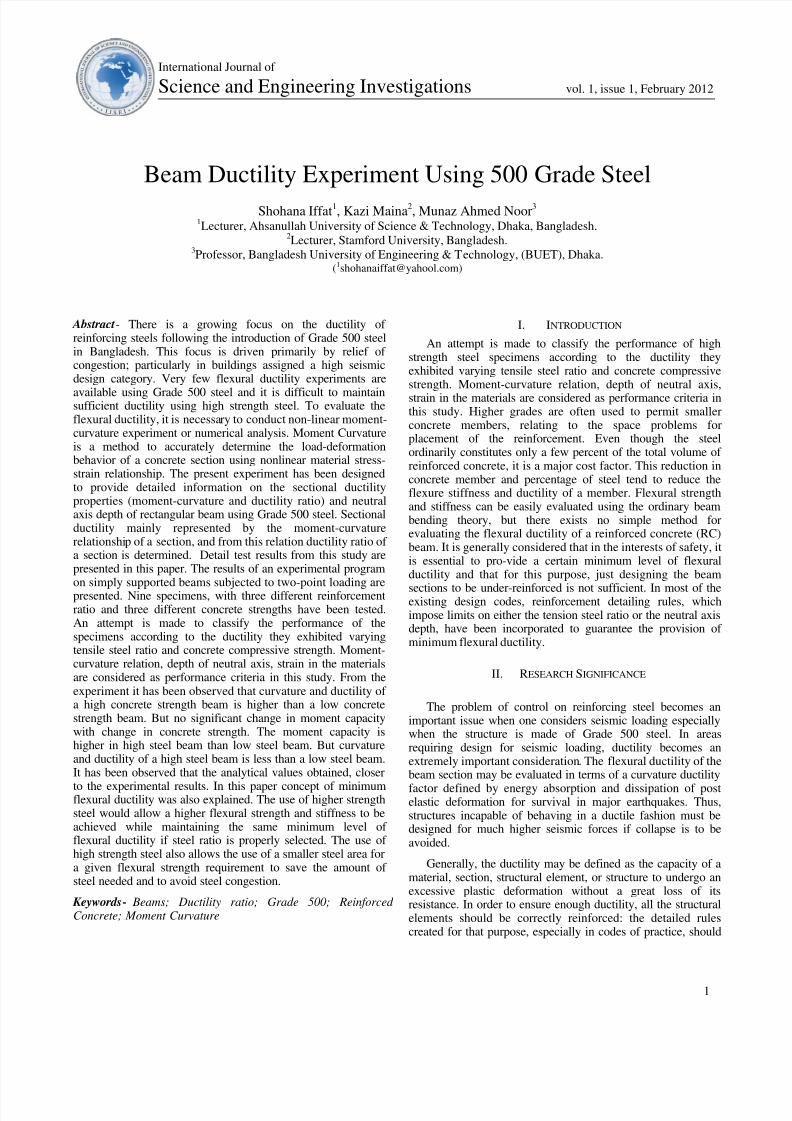
Figure1: Beam specimens with different steel ratio and concrete strength
TABLE1. EXPERIMENTAL PARAMETERS
Steel ratio fc’(ksi) Designation
0.0128
6.5 B1
5.25 B4
7.25 B7
0.009
6.5 B2
5.25 B5
7.25 B8
0.007
6.5 B3
5.25 B6
7.25 B9
TABLE2. COMPONENTS AND AMOUNTS FOR MIX DESIGN
ComponentMix design (kg/m^3)
5ksi 6ksi 7ksi
Cement 435 480 520
water 200 192 208
Sylhet sand 710 730 668
Crushed stone 1064 1094 1006
FA/TA 0.4 0.4 0.4
W/C 0.46 0.4 0.4
Density 2408 2412 2400
Achieved strength 5.25 6.5 7.25
IV. EXPERIMENTAL PROGRAM
Portland Composite Cement (PCC) conforming to BDS-EN197 Part 1 was used for all mixes. Sylhet sand with specific
8/3/2019 Beam Ductility Experiment Using 500 Grade Steel
International Journal of Science and Engineering Investigations, Volume 1, Issue 1, February 2012 3
www.IJSEI.com Paper ID: 10112-01
gravity of 2.68 was used as fine aggregates. Crushed stone withspecific gravity of 2.69 was used as coarse aggregates. Grade500 steel was used as reinforcing steel.
Experimental design was prepared to understand the non-linear behavior of beam under monotonic loading for different
steel ratios and concrete compressive strengths. Three steelratios and three concrete compressive strengths were taken,which is shown in Figure 1 and also given in Table 1.
The compressive strength of the concrete was determinedby compression tests on typical samples of each mix of concrete. The type of mix design used to produce the concreteand the details of each mix are presented in Table2.
Concrete beams were simply supported and two pointloading was applied. Monotonic loading was applied till thedeflection of the beam stars to flow. The load was applied at 3feet distance from the end of each beam. Load was applied intons. Load was increasing by about 2 tons and cracking
patterns were observed and recorded by camera. Theexperimental setup is shown in Figure 2. One linear voltagedisplacement transducers (LVDT) were placed at centre of thebeam to measure the deflections at centre. The crack propagations were monitored using hand held microscope. Fiveholes were made in along the depth of the beam to measure thestrain in the cross section. All strains, crack propagation anddeflection measurements were measured at every loadincrement. The first crack load was noted immediately after theformation and all the cracks were marked as and when theypropagated in the beam. Propagation of cracks can be seen inthe Figure 2.
Figure 2: Beam specimen in test frame
V. TEST RESULTS
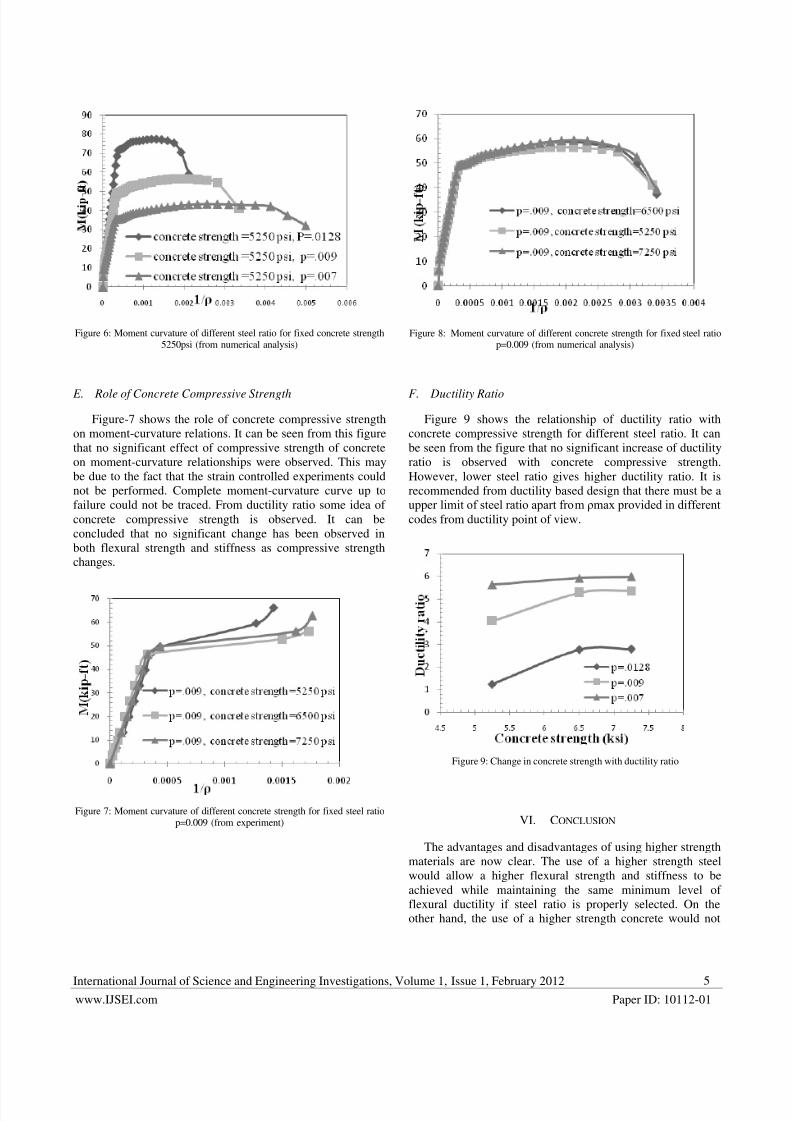
A. Strain
The tensile and compressive strains of reinforcement andconcrete respectively were measured at every load increment.The strain measurements against the loads for B4, B8 and B9beams are shown in Figure 3. The negative values show the
compressive strains in the concrete, while the tensile strains inthe reinforcement are shown in positive values.
The higher strains in B4 beam may be attributed to higherdeflection due to low modulus of elasticity of beam. Beam B4has lower steel ratio than other two beams shown here. The
strains were linear in beams until yielding of steel and thenrapidly increased before failure. The higher strains in concretebeams also show that good bond between steel and concreteexisted till the yielding of steel. The strains, before final failuremay have been higher than the strains mentioned here.
0
2
4
6
8
10
12
14
-0.005 0 0.005 0.01 0.015
D e p
t h ( i n c h )
Strain
l1 l2
l3 l4
l5 l6
l7 l8
l9 L10
Figure 3: Depth vs. strain
B. Neutral Axis Depth
As mentioned earlier, the necessary ductility may be
achieved through an idealization of the section so that theposition of the neutral axis in failure, defined by the parameter
da, is limited to a certain maximum value. Such methodologyis valid only for sections submitted to simple bending, such as
the critical sections of the beams tested in this study. Therefore,
the study of the evolution of the neutral axis’ depth from thestart to the failure load is very important. Also important is the
value of the parameter da in failure and its relationship with theductility itself. One of the objectives of this study is to check if
these variations follow the same tendencies already observed
and accepted for RC beam with normal strength steel. The
experimental values of the position of the neutral axis at the
critical section, for a given beam and for each load level, were
simply calculated by intersecting the line obtained byregression analysis from the experimental strains along the
height of the section with the vertical axes. The value of the
bending moment at the mid span of each beam was statically
calculated from the value of the total load applied to the beam
at the considered load level. Figure 4 shows, for the critical
section of the test beams, the evolution of the neutral axis’depth, taken throughout the tests up to failure. Such evolution
is plotted according to the quotient M/Mu, M being the
moment at the mid spans of the beams and where the failure
has occurred is taken as Mu. The analysis of the graph (Figure
4) shows the existence of three distinct zones of the behavior of
8/3/2019 Beam Ductility Experiment Using 500 Grade Steel
International Journal of Science and Engineering Investigations, Volume 1, Issue 1, February 2012 6
www.IJSEI.com Paper ID: 10112-01
allow a higher flexural strength and stiffness to be achieved
while maintaining the same minimum level of flexuralductility; it only allows the use of a smaller steel area for a
given flexural strength requirement to save the amount of steel
needed and to avoid steel congestion. Proper bond between
high strength concrete and high strength steel is observed evenafter post yield period. Strain curve and moment-curvature
curve both validate the compatibility between the materials.
From the tests, the evolution of the position of the neutral axis
for high strength beams as the load increases is identical to
that reported for RC concrete beams with normal strength
steel. The behavior of the formation and the growth of the
cracks for normal-strength steel beams seem to be also validfor concrete beams using high-strength steel. There must be
upper limit of steel ratio apart from pmax provided in codes of
practice from ductility ratio point of view.
REFERENCES
[1] ACI Committee 318, 2002. “Building Code Requirements forStructural Concrete (ACI 318-02) and Commentary (ACI 318R-02).”American Concrete Institute, Farmington Hills, Michigan.
[2] Ansley, H. M. “Investigation into the Structural Performance of MMFX Reinforcing.” MMFX Steel Corporation: Technical Resources.August 13, 2002, www.mmfxsteel.com/technical_resources/default.asp
#documentation.
[3] ASTM A370-97-02: Standard Test Method and Definitions forMechanical Testing of Steel Products.
[4] ASTM C-143-00: Standard Test Method for Slump of HydraulicConcrete.
[5] ASTM C39-01: Standard Test Method for Compressive Strength of Cylindrical Concrete Specimens.
[6] ASTM C496-96: Standard Test Method for Splitting Tensile Strengthof Cylinder Specimens.
[7] ASTM E8-01: Standard Method of Tension Testing of MetallicMaterials.
[8] Clarke, J.L. “Alternative Material for the Reinforcement andPresstressing of Concrete.” Blackie and Professional. Chapman andHall, 1993, pp. 204.
[9] Clemena, G.G., and Virmani, Y.P. “ Corrosion Protection: ConcreteBridge.” Federal Highway Administration (FHWA). Retrieved July14,2003, www.tfhrc.gov/structur/corros/introset/htm.
[10] Collins, P.M., and Michell, D. Prestressed Concrete Structures.Response Publications, Canada, 1997, pp. 169-185 144
[11] El-Hacha, R., and Rizkalla, S.H. “Fundamental Material Propert ies of MMFX Steel Rebars.” North Carolina State University, NCSU-CFLReport No. 02-04. July 2002.
[12] Galloway, J., Chajes, J. M. “Application of High-PerformanceMaterials to Bridges Strength Evaluation of MMFX steel.” Universityof Delaware: NSFREU 2002. August 8, 2002,http://www.ce.udel.edu/cibre/reu/02reports/Gallo.