ENVIRONMENT t ~D E P A R T M E N T iW ~P A P E R SPAENOI ~~w X PAPER NO. X ENVIRONMENTAL ECONOMICS SERIES Beating the Resource Curse The Case of Botswana Maria Sarraf Moortaza Jiwanji October 2001 The World Bank Public Disclosure Authorized Public Disclosure Authorized Public Disclosure Authorized Public Disclosure Authorized Public Disclosure Authorized Public Disclosure Authorized Public Disclosure Authorized Public Disclosure Authorized
Transcript
ENVIRONMENTt ~D E P A R T M E N TiW ~P A P E R SPAENOI
~~w X PAPER NO. X
ENVIRONMENTAL ECONOMICS SERIES
Beating theResource CurseThe Case of Botswana
Maria SarrafMoortaza Jiwanji
October 2001
The World Bank
Pub
lic D
iscl
osur
e A
utho
rized
Pub
lic D
iscl
osur
e A
utho
rized
Pub
lic D
iscl
osur
e A
utho
rized
Pub
lic D
iscl
osur
e A
utho
rized
Pub
lic D
iscl
osur
e A
utho
rized
Pub
lic D
iscl
osur
e A
utho
rized
Pub
lic D
iscl
osur
e A
utho
rized
Pub
lic D
iscl
osur
e A
utho
rized
O THE WORLD BANK ENVIRONMENT DEPARTMENT
Beating theResource Curse
The Case of Botswana
Maria SarrafMoortaza Jiwanji
October 2001
Papers in this series are not formal publications of the World Bank. They are circulated to encourage thought and discussion. The useand citation of this paper should take this into account. The views expressed are those of the authors and should not be attributed tothe World Bank. Copies are available from the Environment Department, The World Bank, Room MC-5-126.
Contents
ABsTRAcr vACKNOWLEDGMENTS Vii
ABBREVIATIONS iX
Chapter 1Introduction 1
Chapter 2The Resource Curse 3
Economic Explanations of the Resource Curse 4The effect on non-boom tradable sectors and the Dutch Disease 4Skill accumulation and the resource curse 5The boom-sector: Low linkages with the rest of the economy 5The Staple Trap Trajectory 6
Political Dimensions to the Resource Curse 6Inappropriate economic management 6Rent seeking 7
Policy Suggestions from the Literature 8
Chapter 3The Case of Botswana 9
Development of the Mining Sector 9Management of the Mineral Boom 10
Management of government's budget and accumulation of international reserves :Management of the exchange rate and economic diversification 13
Other Aspects of the Economy 14
Chapter 4Conclusion 17
NoTEs 19
REFERENCES 21
Environmental Economics Series
Beating the Resource Curse - The Case of Botswana
FIGuREs
1. Revenue, expenditure, and development expenditure as a percent of GDP 122. Reserves in months of imports of goods and services 123. Formal employment by sector, 1989 14
TABLES
1. Comparison between Botswana and Sub-Saharan Africa for selected indicators 92. Contribution of the mining sector to GDP, government revenue, and export earnings in
selected years 103. Government current revenue, expenditure, and surplus (million current pula) 114. Growth of output for selected groups of countries, 1970-1996 135. Gini index in Botswana 15
iv Environment Department Papers
Abstract
The endowment of natural resources has often on non-boom tradable sectors; inefficientbeen associated with disappointing economic investment beyond the absorptive capacity ofdevelopment. This phenomenon is referred to in the country; and rent seeking behavior. Bythe literature as the "resource curse," which exploring the case of the mineral boom inhypothesizes that economies experiencing Botswana, this paper will demonstrate that theresource booms, either through price increases resource curse is not necessarily the fate ofor new discoveries, will experience resource abundant countries. The adoption ofunsustainable growth rates. There are various sound economic policies and the goodmechanisms through which a resource-boom management of windfall gains have allowedcan negatively impact on an economy. For Botswana to continuously manage growth andinstance, it can lead to excessive government to become one of the great success stories ofexpenditure during the boom period and drastic developing countries.cuts when the boom ends; detrimental impacts
Environmnental Economics Series V
Acknowledgments
For providing the original inspiration and for Aziz Bouzaher for reviewing various versions of
guidance throughout, we are deeply grateful to this paper and providing valuable feedback.
Kirk Hamilton. We would also like to thank Finally we acknowledge the assistance of Thor
Gary McMahon, Richard Auty, Felix Remy, and Sigvaldason in helping to edit the paper.
Environmental Econornics Series vii
Abbreviations
BT Booming Tradable Sector
GDP Gross Domestic Product
GNP Gross National Product
HCI Heavy and Capital-Intensive Industry
NBT Non-Boom Sector
NT Non-Tradable Sector
Environmental Economics Series ix
1 Introduction
Let us start by asking a puzzling question: if countries that experience export booms isyou suddenly inherit a pot of gold, will you be inherently linked with the fact that they arebetter or worse off in the long run? The obvious richly endowed in natural resources.reply is better off; few people would argue that Alternatively, might the symptoms of the cursemore income is a bad thing. Standard economic be avoided through prudent economictheory asserts that one can never be made worse management?off by a positive wealth effect. The answer,however, is not always that straightforward. It In this paper, we will show that the naturaldepends on how you manage this unexpected resource curse is not necessarily the fate ofgain. If you decide to quit your job, you might resource abundant countries. By exploring thespend the money over a couple of years or even case of Botswana, we will demonstrate howtake up a loan based on your improved sound economic policies and good managementcircumstances. Once the pot of gold runs out, of windfall gains can lead to sustainedyou might not be able to get your old job back. economic growth. In the first section, weIf you still have to service a loan, you may then describe the main dimensions for the resourceend up worse off. If you decide to invest the curse, based on a survey of the currentmoney wisely in assets that generate revenue literature. This discussion includes both pureeach year for the rest of your life, you will economic explanations for the curse (such asprobably be better off.' effects on the non-boom tradable sectors, effects
on skill accumulation, and the low linkages ofThis simple example illustrates what can the boom sector) and more political dimensionshappen when countries experience an export that manifest themselves via inappropriateboom. The discovery of new natural resources economic management and rent seeing(or a sudden increase in the price of an activities. The paper's second section describesexportable resource) may unexpectedly in detail the case of Botswana. This case studyincreases revenues. Unfortunately, many begins with a description of the economiccountries have been unable to properly manage development of Botswana since itsthese windfall gains, ending up spending too independence, followed by a closer examinationmuch, too quickly. This phenomenon has been of the development of the mining sector and itsreferred to in the literature as the "natural contribution to economic growth. Finally, itresource curse." A key question is whether the explores the means by which the Governmentunder-performance of resource-abundant has managed the mineral boom.
Environmental Economics Series
2/ The Resource Curse
"We are in part to blame, but this is the curse of consensus on the measurement of resourcebeing born with a copper spoon in our mouths." abundance. The various metrics include export
- Keneth Kuanda, dependence (Sachs and Warner 1995), performer President of Zambia capita land area (Wood and Berge 1994),
export orientation, and population size
Throughout the 1980s and early 1990s many (Surquin and Chenery 1989). In fact StijnsTreougho abutdant countries have suffered from (2001) argues that the findings by Sachs andresource abundant countries have suffered from Waer(95aenorbutwnchgsaelow growth. This phenomenon has been termed .me in9the are no natu resucethe "Resource Curse" by Auty (1993), whomaeithmasrofnualeorcthgues thaRresource Curse"abyutyan (199, w y abundance from trade-flows to reserves orarue tha reouc abnac seealroduction of natural resources. In contrast,
associated with disappointing rates of economic Wooduand Berg1 argues ta thetbasicdevelopment. It should not be interpreted as an findings are not sensitive to theseiron law, but rather as a strong recurrent classifications.tendency (Auty 1994a). Furthermore, it poses aninteresting conceptual question as to why a The theory side of the resource curse literature"resource boom," either through an seeks to explain the relatively weakimprovement in terms-of-trade or a resource performance of resource-abundant economies.discovery, does not lead to sustained economic Several explanations have been advanced,growth. The paradox of the resource curse is which offer a range of economic factors boththat a resource boom provides valuable foreign internal and external to the economy. Theseexchange, attracts foreign investment, and include effects on production and investmentprovides raw material for production. structures within the economy and the price
volatility of international primary goodsSome studies, however, find that the resource markets (Auty 1998, Mikesell 1997). On thecurse phenomenon is not widespread (Graham other hand, some authors argue that the root of1995 in Mikesell 1997). On balance, however, the problem is political in that incorrect policythere is substantial evidence that supports the choice leads to the same outcomes and thatresource curse hypothesis, ranging from resource booms inspire rent-seeking activitiesmineral rich to oil-exporting countries. Sachs (Auty 1998, McMahon 1997, Ross 1999). Theand Warner (1995), for example, provide a fundamental question that arises from thissubstantive empirical investigation of 96 literature is whether or not resourcecountries, and find that economies with a high abundance is inherently a precondition forratio of natural resource exports to GDP in poor economic performance (as the above1971 (the base year) tended to have low quote by President Kuanda suggests), orgrowth rates during subsequent years (1971 to whether the curse could have been avoided1989). Unfortunately, there is no clear with an appropriate set of policies?
Environmental Economics Series 3
Beating the Resource Curse - The Case of Botswana
Economic Explanations of the increased the relative export prices of non-Resource Curse boom tradable goods and subsequently
damaged Peru's manufacturing andExport booms can cause major distortions in the a ged Peru's Mikesellg andeconomies of resource-abundant countries. agricultural sectors (Mikesel 1997).These distortions tend to affect the structure of One way to explain the apparent difficultiesproduction and investment, and can persist long experienced in the manufacturing sector is toafter the boom subsides. They increase domestic consider how governments reallocate windfall gainsincome, affect savings and investment, from the booming tradable (BT) sectors to non-government expenditures, and relative prices in tradable (NT) sectors (for example,different sectors of the economy. An export construction), and non-boom tradable (NBT)boom will typically involve a surge in foreign sectors (such as manufacturing). A typicalexchange via increased exports of the affectedproducts (and not other tradable sectors). This respnus ito a r oue-ois toaorb (therevenues into the domestic economy (that is,leads to an appreciation in the real exchange the NT sector), as was the case in Bolivia afterrate. Changes in the real exchange rate reduce the mineral-boom of the 1970s (Auty and Eviathe relative prices of tradable manufactured 2001). This "spending effect," as it is termed inproducts relative to non-tradable products, such the Dutch Disease literature (for example, Usuias construction and services (Mikesell 1997). For 1997), leads to movements of labor and capitalinstance, in Bolivia the real exchange rate towards the NT sectors (McMahon 1997).appreciated by 17 percent from 1973 to 1974,and then doubled between 1979 and 1983. As a One of the reasons for the movement of laborresult non-mining activity was relatively un- and capital away from manufacturing was thatcompetitive and its share of exports slumped to NBT goods became more expensive relative to5.2 percent of total exports in 1985 (Auty and NT goods through the appreciation in realEvia 2001). However, there is no single reason exchange rates, as was the case in Boliviafor the resource curse and not all the during the early 1970s (Auty and Evia 2001). Assuggestions in the literature apply to each a result it was quite common for mineral rents
resource-abundant country'. to be used for the protection of the NBT sectors
The effect on non-boom tradable sectors and the through subsidies and protectionist strategies.Dutch Disease However, the inadequate performance of the
weakened NBT sectors during post-boomMany studies seeking to explain the resource downswings required levels of subsidy from thecurse (such as Usui, 1997; Auty, 1998) place mining tradable sectors that weremajor emphasis on the failure of resource- unsustainable. This was the case in Southabundant economies to promote a competitive America (Bolivia, Guyana, pre-Pinochet Chile)manufacturing sector, often termed the "Dutch and sub-Saharan Africa (Zambia, Zaire andDisease."2 The case of Peru, where GDP growth Nigeria) according to Auty (1994b). Anotherrates declined from 3.5 percent in 1970-1980 to reason for deficiencies in manufacturing sectorsnegative 0.5 percent in 1980-1993, provides an is that governments tend to "leap-frog" labor-adequate illustration of the damaging intensive manufacturing industries in favor ofconsequences for the manufacturing sector. heavy and capital-intensive (HCI) industries, asDuring the 1980s, Peru experienced a resource- was the case in Mexico and Brazil (Auty 1994a).boom through dramatic increases in the price of There is also some evidence to suggest thatcopper and other minerals. The resulting countries which leap-frogged the labor-appreciation of the real exchange rate intensive manufacturing sector displayed
4 Environment Department Papers
The Resource Curse
higher inequalities of income distribution Sachs (1996) models the incentives to invest in(Auty and Kiiski, 2001 referring to the education, by analyzing labor movementsexperience of southeast Asian countries). between the BT and NT sectors. Changes in
resource-boom sectors, as explained above,In summary, it has been proposed in the push up the wages in the (unskilled) NTliterature that the greater the natural resource sectors. Therefore, younger workers will workendowment, the higher the demand for NT in NT and they will be better off if they makegoods, and, consequently, the smaller the no investment in education. Birdsall and othersallocation of labor and capital to NBT sectors. (1997) found evidence for the differences in the
incentives to invest in education betweenThe~~ obiu.usini h xett hc resource-abundant and resource-deficient
relative losses in NBT sectors can explain low couries.bHoever theresorif icalrates of overall economic growth. In terms of evidencestoHsuggest that natrl resouce
the~~~~~~~ Duc Dies*fet h vdnehsbe evidence to suggest that natural resourcethe Dutch Dlsease effect, the evidence has been production has a negative impact on theinconclusive. In a survey of several empical manufacturing sector, learning-by-doing, andinvestigations, McMahon (1997) finds no ultimately economic growth (Stijns 2001).substantive evidence of the Dutch Diseaseeffect. In contrast, Auty and Evia (2001) argue The boom-sector: Low linkages with the rest ofthat the Bolivian economy in the early 1970s the economyshowed clear signs of Dutch Disease through
low dversficaion,witha smllerthanPrimary goods are generally produced in anlow diversification, with a smaller thanenlvwihfwbcaradfoadexpected agricultural sector and protectedenlvwihfwbcaradfoadexpefactduagricultua sector aundmptecitved linkages to the rest of the economy. They aremanufacturing oetowth typically highly capital intensive, with a smallinternational outputs. (albeit well paid) workforce, and inputs are
Skill accumulation and the resource curse generally imported (Auty and Kiiski 2001).Hirschman (1958), Seers (1964) and Baldwin
The manufacturing sector is often regarded as (1966) established these arguments morethe principal source of technological progress, formally, by encouraging the view thatand as a consequence there are educational linkages between the primary sector and theexternalities associated with it. This externality rest of the economy are minimal (in Sachs andeffect comes through the knowledge and skills Warner 1995).that are generated through the manufacturing Another implcation of weak linkages of the
sector. As a result, Sachs and Warner (1995) primary goods sector is that the only wayhypothesize that a shift in labor away from general benefits can be derived from amanufacturing will depress growth in labor resource-boom is through the taxation ofproductivity. Furthermore, a deterioration in resource rents. Therefore, in the face of widelythe manufacturing sector could lead to a fluctuating export revenues, governments mayreduction in the demand for education and find it diffict to promote economic growth.learning-by-doing and a commensurate fall in This disadvantage of low linkages was evidentthe long-term growth potential of an economy in Bolivia (Auty and Evia 2001). Furthermore,(Matsuyama 1992). In Matsyama's model, Mikesell (1997) found that governmentsforces that push the economy away from experienced widely fluctuating exportmanufacturing and towards agriculture (the revenues (Mikesell 1997), leading toboom sector) will lower the growth rate of the fluctuating levels in overall governmenteconomy (cited in Sachs and Warner 1995). revenues.
Environnental Economics Series 5
Beating the Resource Curse - The Case of Botswana
The Staple Trap Trajectory Political Dimensions to the Resource Curse
Auty provides a more formal analysis of the The economic after-effects of resource-boomsresource curse by specifying a model that have created hardship for resource-exportingdescribes the behavior and incentive structure nations. These hardships led to persistentlyof resource-abundant economies experiencing slow growth. Furthermore, there appear to have
been active policies pursued by governmentsresource booms. He attributes the symptoms of be ciepfce use ygvnuetresource boom. Hthat exacerbated the effects of the resource curse
the resource curse to a pattern of behavior hecalls a "staple trap" trajectory. Countries on istuish bete policiesthtwrthis trajectory tend to experience strong Dutch ingppropriteeo migided th at wereinappropriate or misguided and those that wereDisease effects, closed economies, few related to rent seeking. In either case, the rootincentives for the development of capital, and cause was substantial increases in governmenthigh dependency on the boom sectors for revenues caused by the boom.foreign exchange and revenues. When theboom subsides, groups with vested interests Inappropriate economic managementblock the required adjustments to real Natural resource booms have often reinforcedexchange and wage rates. or created inappropriate economic policies in
resource-abundant countries (McMahon 1997).An example consistent with the staple trap Though there are a large number of studies ontrajectory is that of Bolivia (Auty and Evia the implications of resource-abundant2001). Bolivia was especially vulnerable to the economies, there is little consensus on whichstaple trap. It exhibited Dutch Disease effects, countries have under-performed as a result ofwhich had already weakened the non-mining inadequate policy responses to a resource boom
(Usui 1997). Nevertheless, there are someeconoy. Ivestmnt eficincy ws lo andstriking examples of inappropriate economic
the economy was not diversified. Most of the mangement.mineral windfall was not translated into
investment and went into higher consumption. McMahon (1997) argues that one of the mostPerhaps most significantly, the resource boom significant factors behind the negative impact ofcreated incentives to relax market discipline. resource booms is the irreversibility of governmentIn terms of macroeconomic policy, the expenditure. When the revenue streams from thegovernment failed to sterilize the additional boom subsided, it was very difficult to adjustforeign exchange inflows and it used its expenditures down to levels on par with thesehydrocarbon reserves as collateral for foreign smaller revenues. For instance, in Trinidad andborrowing, which increased to 78 percent of Tobago there was public pressure to share theGDP from 1975 to 1979 (Auty and Evia 2001). benefits of the boom, which led to large
subsidies for food, fuel, utilites, and loss-making enterprises. By 1981, when the annual
The resource curse thesis is merely a strong mkn nepie.B 91 hnteanathenresource curse tuch,exestisois n astron ligrowth rate of GDP was actually negative, there
tenencradasch,excpto r lik, was considerable political difficulty in makingMore significantly, it has been suggested that cutbacks (McMahon 1997). Furthermore, theseprudent policy can avoid pitfalls (Auty 1994a). increases in government expenditureThe next section, therefore, illustrates how sometimes went towards the civil service byincorrect policy can perpetuate the resource way of an increase in the number of jobs andcurse. pay levels. In Cote d'Ivoire, for example, the
6 Environment Department Papers
The Resource Curse
coffee and cocoa booms of 1976 to 1981 led to a They find evidence that increasing dependency50 percent increase in expenditures on the civil on primary products is positively correlatedservice (McMahon 1997). with closed trade policy (cited in Auty and
Kiiski, p14).Similarly, there are many examples ofgovernments investing windfall gains In order to finance expansionary fiscal policiesinefficiently. Unproductive investment booms and/or irreversible government expenditures,were evident in many countries. Lal and Myint, governments have been known to borrow on1996 (cited in Auty and Kiiski 2001) find that the strength of their booms. Examples of boom-the efficiency of investment in resource- based borrowing include Jamaica and Nigeriaabundant countries collapsed during the 1970s. (Cuddington 1989; cited in McMahon 1997).Furthermore, McMahon finds evidence in Mexico implemented a highly expansionaryseveral countries of political pressure on fiscal policy aimed at rapid development, andgovernment to spread investments towards spent its oil revenues in an imprudent way.failing industries. Governments tended to invest Together with the onslaught of capital flight,the windfalls in the NT sectors (for example, these led to a severe current account deficit,construction), or in projects with low rates of leading Mexico to an accumulation of short-return. Options for investment were not in term debt (Usui 1997). The example of Mexicoabundance, given the undeveloped and stands in stark contrast to that of Indonesiaconstrained nature of financial sectors and where a conservative stance to foreignrestriction on holding foreign assets (McMahon borrowing was adopted.1997). However, the key mistake was thatrecurrent cost and capacity issues (such as skill Rent seekingrequirements) were not taken into account. In Inappropriate economic management can alsofact, the case of Botswana is exemplary of how be influenced by the effort of rent-seekers thatto avoid these investment pitfalls (see below). are both within and outside of the public
sector. For instance, in Brazil, rent-seekingAuty (1993) provides an interesting argument, groups bocked r ratwld havewhich attributes the low performance of rov ed reconmo the unoptiveresource-abundant economies to their ability to rban-idutra preas Au 19) inc faptit
postpoe refoms duesimplyto thelargeurban-industrial areas (Auty 1995). In fact, itpostpone reforms due simply to the largerevenues from the primary sector. In particular, has been noted that resource-abundantthese large revenues reduced the incentives to economies are often more susceptible to rent-develop competitive manufacturing sectors. seeking behavior, due to the concentration ofRents are used to support long-standing import wealth either in the public sector or in thesubstitution strategies,3 as part of the hands of a small number of companiesprotectionism of non-booming tradable sectors (McMahon 1997). Auty (1998) argues that the(as already mentioned above), long after they existence of large resource rents distractshave been of benefit (Auty 1998). This attenton away from long-term economicprolonged protection of non-boom tradable development goals and towards rent seekingindustries eventually reduces the activity.competitiveness of manufacturing sectors(Mikesell 1997). Sachs and Warner (1995b) Bates (1994 cited in McMahon 1997) argueshypothesize that governments seek to protect that the traditional functions of the state, inthe manufacturing sectors (in fear of the Dutch light of a resource-boom, give way to theDisease) through protectionist trade policy. redistribution of revenues. As such, socio-
Environmental Econornics Series 7
Beating the Resource Curse - The Case of Botswana
economic development goals are pushed to the diversify is one important reason whyside by rent seeking and patronage. Lane and many mineral economies experience suchTornell (1995 cited in McMahon 1997) contend disappointing rates of economic growththat a resource boom can lead to a "feeding (Auty 1994b)frenzy" in which rent seekers fight for thenatural resource rents. * Macroeconomic related policies: Avoid large-
scale debt; accumulate budget surplusesPolicy Suggestions from the Literature (for example, Indonesia, Usui 1997); follow
The resource curse literature, as a result of a prudent exchange rate managementidentifying the nature of the problem as well as policy by controlling the appreciation ofanalyzing success stories, is furnished with the exchange rate (Mikesell 1997); create apolicy suggestions on how to avoid or mitigate stabilization fund to guard againstthe detrimental impact of the resource curse. commodity-price volatility (SeymourOne caveat to these policy prescriptions is that 2000).they cannot be applied across all resource-abundant economies experiencing resource Other more specific policy suggestions includebooms. Nevertheless, there are some general the promotion of autonomous fiscal andprinciples that arise out of the literature, which monetary authorities in response to thestand out in relation to the Botswana onslaught of rent seekers and special interestexperience: groups (McMahon 1997), and the adoption of
Environmental and Natural Resource
* Investment strategy: Do not invest beyond Accounting (EARA) policies which provide athe absorptive capacity; consider all the rationale for the effective management ofrecurrent costs associated with new mineral windfalls to secure sustained rapidinvestment programs; only invest when the economic growth (Auty and Evia 2001).expected rate of return is considerablyabove that which can be earned in risk-less The above literature rview highlights severalforeign assets; in fact some argue that it is channels of influence through which resourcebetter to leave windfall gains in the hands booms have lead to negative effects in manyof the private sector (Collier and Gunning resource-abundant economies. However, it is1996 in McMahon, p38); pursue investments argued in this paper that being endowed withwith high social rates of return, particularly natural resource wealth is not an inescapablethose in human capital and infrastructure pre-condition for unsustainable economic(Seymour 2000) growth. From these theoretical and empirical
investigations of the resource curse, a number of
* Economic diversification: Improves policy suggestions have been put forward. Theeconomic performance by increasing the following case study of Botswana demonstratesflexibility with which an economy can how the adoption of such policy suggestionsrespond to external or intemal shocks can lead to outcomes in contrast to the resource(Daniel 1992 in Auty 1994b). Failure to curse thesis.
8 Enviroranent Department Papers
3 The Case of Botswana
"...we intend to conserve our resources wisely and income economy. Compared with other Sub-not destroy them. Those of us who happen to live in Saharan African countries, the economic growthBotswana in the 20th century are no more important of Botswana appears even more striking
than our descendants in centuries to come." (Table 1).
- Hon. Sir QKI Masire,former President of Botswana This rapid economic growth is not totally
surprising given the discovery of large mineral
Since its independence from Britain in 1966, deposits, mainly diamonds. What is remarkableBotswana has become one of the great success about Botswana is the way in which the mineralstories of developing countries. Between 1966 boom was managed. By avoiding commonand 1989, it was the world's fastest growing pitfalls of mineral booms, such as the "Dutcheconomy. Botswana's Gross Domestic Product Disease," the Government was able to(GDP) grew at an average of 13.9 percent per continuously manage growth well. The purposeannum between 1965-80, at an average of 11.3 of this section is to explore the factors that led topercent between 1980-89, and at an average of such and extraordinary economic record, and to4.75 percent between 1990-98 (The World Bank draw the lessons learned.1991, 1998, and 2001). At independence, Development of the Mining SectorBotswana was among the twenty-five poorestcountries in the world. Since then, the mineral The mining sector is largely dominated by thesector has grown significantly and is now a diamond industry and, to a lesser extent, bydominant part of Botswana's economy. By 1989 copper-nickel. The first diamond mine wasthe country was ranked as a lower-middle discovered in 1967 by De Beers in the region ofincome economy and in 1998, income per capita Orapa. Since then this mine has yielded morehad reached $3,460 (in constant 1995 USD) and than 118 million carats of diamond. Today,Botswana was considered an upper-middle diamond mining is dominated by the Debswana
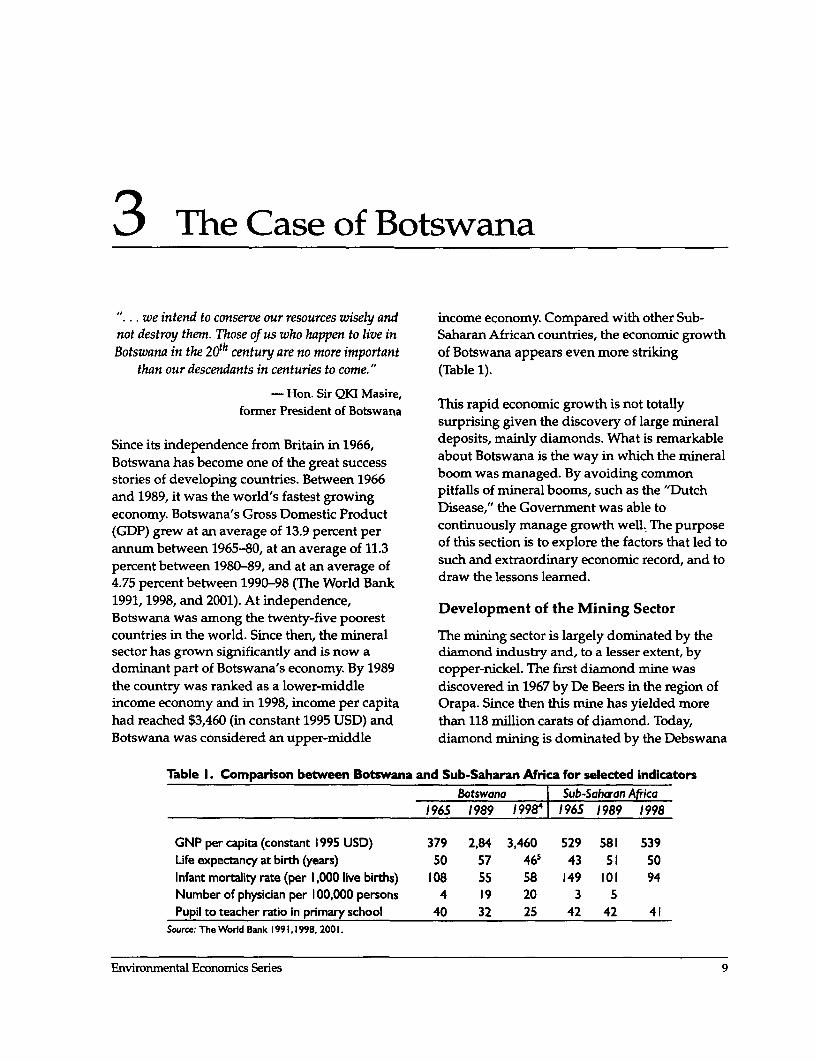
Table 1. Comparison between Botswana and Sub-Saharan Africa for selected indicatorsBotswana |Sub-Saharan Africa
1965 1989 199841 1965 1989 1998
GNP per capita (constant 1995 USD) 379 2,84 3,460 529 581 539Life expectancy at birth (years) 50 57 465 43 51 50Infant mortality rate (per 1,000 live births) 108 55 58 149 101 94Number of physician per 100,000 persons 4 19 20 3 5Pupil to teacher ratio in primary school 40 32 25 42 42 41
Source: The World Bank 1991,1998, 2001.
Environmental Econornics Series 9
Beating the Resource Curse - The Case of Botswana
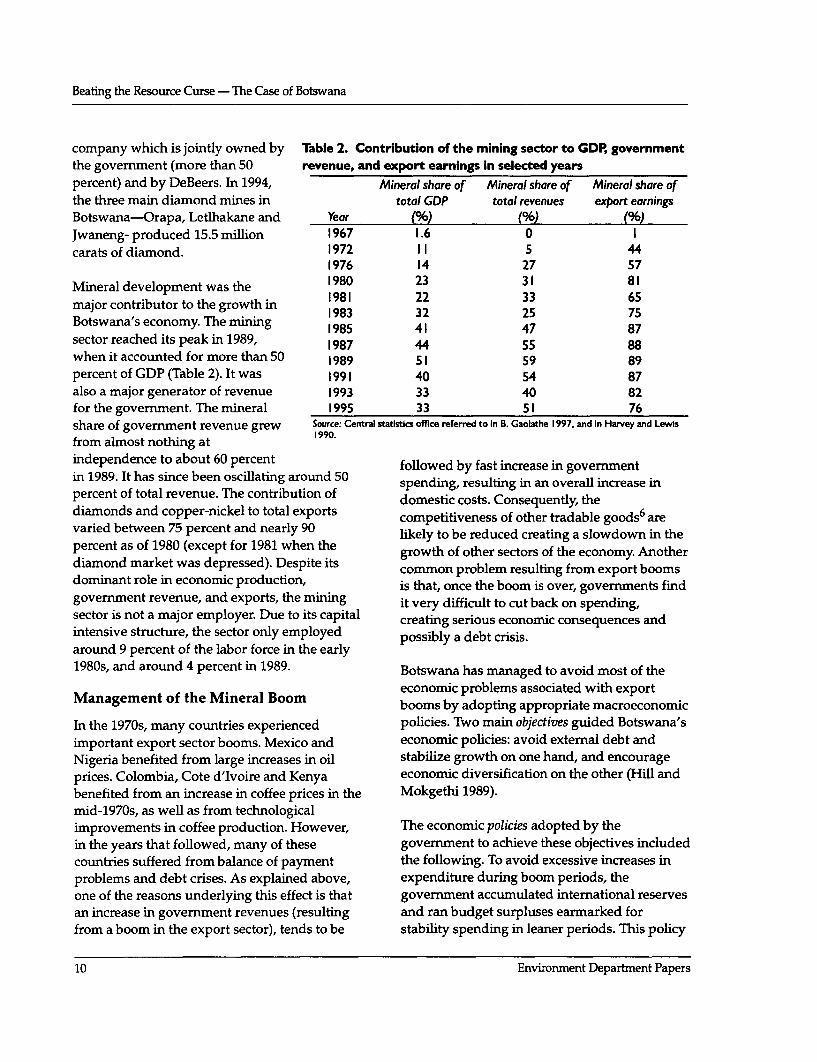
company which is jointly owned by Table 2. Contribution of the mining sector to GDP, governmentthe government (more than 50 revenue, and export earnings in selected yearspercent) and by DeBeers. In 1994, Mineral share of Mineral share of Mineral share ofthe three main diamond mines in total GDP total revenues export earningsBotswana-Orapa, Letlhakane and Year (%) (%) (%)Jwaneng- produced 15.5 million 1967 1.6 0 1carats of diamond. 1972 11 5 44
1976 14 27 57
Mineral development was the 1980 23 31 81major contributor to the growth in 1981 22 33 65Botswana's economy. The mining 1985 41 47 87sector reached its peak in 1989, 1987 44 55 88when it accounted for more than 50 1989 51 59 89percent of GDP (Table 2). It was 1991 40 54 87also a major generator of revenue 1993 33 40 82for the government. The mineral 1995 33 51 76share of government revenue grew Source: Central statistics office referred to in B. Gaolathe 1997, and in Harvey and Lewis
from almost nothing at
independence to about 60 percent followed by fast increase in governmentin 1989. It has since been oscillating around 50 spending, resulting in an overall increase inpercent of total revenue. The contribution of domestic costs. Consequently, thediamonds and copper-nickel to total exports competitiveness of other tradable goods6 arevaried between 75 percent and nearly 90 hlkely to be reduced creating a slowdown in thepercent as of 1980 (except for 1981 when the growth of other sectors of the economy. Anotherdiamond market was depressed). Despite its common problem resulting from export boomsdominant role in economic production, is that, once the boom is over, governments findgovernment revenue, and exports, the mining it very difficult to cut back on spending,sector is not a major employer. Due to its capital creating serious economic consequences andintensive structure, the sector only employed possibly a debt crisis.around 9 percent of the labor force in the early1980s, and around 4 percent in 1989. Botswana has managed to avoid most of the
economic problems associated with exportbooms by adopting appropriate macroeconomic
In the 1970s, many countries experienced policies. Two main objectives guided Botswana'simportant export sector booms. Mexico and economic policies: avoid external debt andNigeria benefited from large increases in oil stabilize growth on one hand, and encourageprices. Colombia, Cote d'Ivoire and Kenya economic diversification on the other (Hill andbenefited from an increase in coffee prices in the Mokgethi 1989).mid-1970s, as well as from technologicalimprovements in coffee production. However, The economic policies adopted by thein the years that followed, many of these government to achieve these objectives includedcountries suffered from balance of payment the following. To avoid excessive increases inproblems and debt crises. As explained above, expenditure during boom periods, theone of the reasons underlying this effect is that government accumulated international reservesan increase in government revenues (resulting and ran budget surpluses earmarked forfrom a boom in the export sector), tends to be stability spending in leaner periods. This policy
10 Enviromnent Department Papers
The Case of Botswana
avoided having to drastically cut expenditures This ability to maintain expenditures in lineduring bad years and reduced inflationary with long term growth had been a strongpressures. A second central policy was to stabilizing force.manage the nominal exchange rate to avoid realappreciation of the local currency. This was Investment decisions: Given the high level ofachieved largely through the accumulation of savings, the government had to decide how tointemational reserves. Preventing the local allocate its surpluses between internationalcurrency from appreciating allowed other reserves and domestic investment. A commontradable goods to maintain competitiveness on problem in countries where windfall gainsworld markets, and hence encouraged economic accrue principally to the government is that itdiversification. will tend to invest in projects that have lower
rates of return vis-a-vis the private sector. It isManagement of government's budget and often argued, therefore, that a substantial part ofaccumulation of international reserves the windfall gains should be kept in the hand of
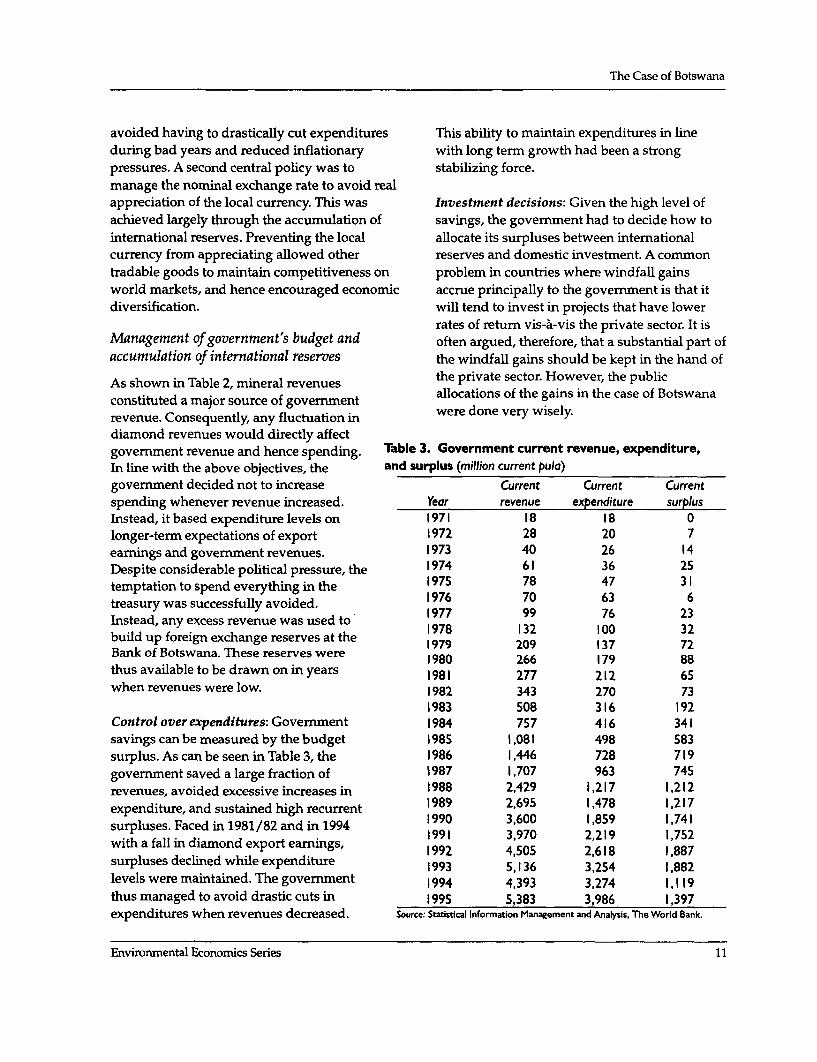
As shown in Table 2, mineral revenues the private sector. However, the publicconstituted a major source of goverment allocations of the gains in the case of Botswanarevenue. Consequently, any fluctuation in were done very wisely.diamond revenues would directly affectgovernment revenue and hence spending. Table 3. Government current revenue, expenditure,In line with the above objectives, the and surplus (million current pula)government decided not to increase Current Current Currentspending whenever revenue increased. Year revenue expenditure surplusInstead, it based expenditure levels on 1971 18 18 0longer-term expectations of export 1972 28 20 7earnings and government revenues. 1973 40 26 14Despite considerable political pressure, the 1974 61 36 25temptation to spend everything in the 1975 78 47 31treasury was successfully avoided. 1976 70 63 6Instead, any excess revenue was used to 1977 99 76 23build up foreign exchange reserves at the 1978 209 137 72Bank of Botswana. These reserves were 1980 266 179 88thus available to be drawn on in years 1981 277 212 65when revenues were low. 1982 343 270 73
1983 508 316 192Control over expenditures: Government 1984 757 416 341savings can be measured by the budget 1985 1,081 498 583surplus. As can be seen in Table 3, the 1986 1,446 728 719government saved a large fraction of 1987 1,707 963 745revenues, avoided excessive increases in 1988 2,429 1,217 1 ,212expenditure, and sustained high recurrent 1989 2,695 1,478 1 ,217surpluses. Faced in 1981/82 and in 1994 1990 3,600 2,859 1,741with a fall in diamond export earnings, 1992 4,505 2,618 1,887surpluses declined while expenditure 1993 5,136 3,254 1,882levels were maintained. The government 1994 4,393 3,274 1, 119thus managed to avoid drastic cuts in 1995 5,383 3,986 1,397expenditures when revenues decreased. Source: Statistical Information Management and Analysis, The World Bank.
Envirornmental Econornics Series 11
Beating the Resource Curse - The Case of Botswana
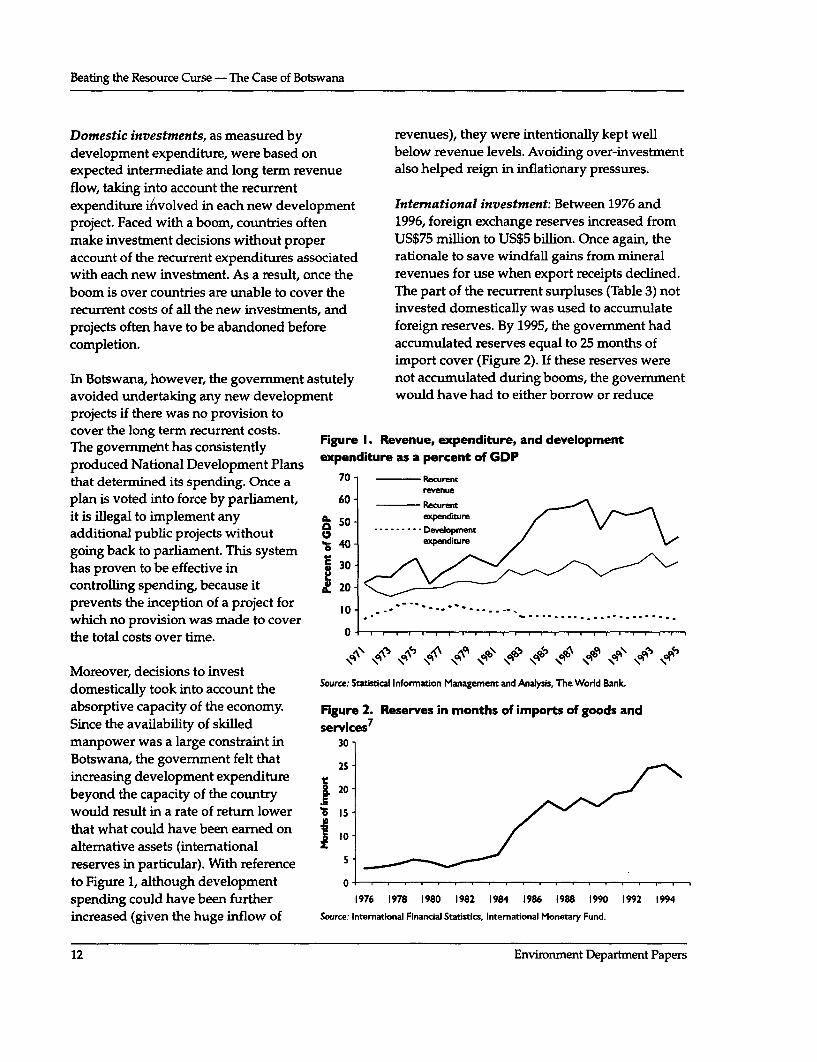
Domestic investments, as measured by revenues), they were intentionally kept welldevelopment expenditure, were based on below revenue levels. Avoiding over-investmentexpected intermediate and long term revenue also helped reign in inflationary pressures.flow, taking into account the recurrentexpenditure iAvolved in each new development International investment: Between 1976 andproject. Faced with a boom, countries often 1996, foreign exchange reserves increased frommake investment decisions without proper US$75 million to US$5 billion. Once again, theaccount of the recurrent expenditures associated rationale to save windfall gains from mineralwith each new investment. As a result, once the revenues for use when export receipts declined.boom is over countries are unable to cover the The part of the recurrent surpluses (Table 3) notrecurrent costs of all the new investments, and invested domestically was used to accumulateprojects often have to be abandoned before foreign reserves. By 1995, the government hadcompletion. accumulated reserves equal to 25 months of
import cover (Figure 2). If these reserves wereIn Botswana, however, the government astutely not accumulated during booms, the governmentavoided undertaking any new development would have had to either borrow or reduceprojects if there was no provision tocover the long term recurrent costs.Thcoverthelongterm hasconsienty costs Figure 1. Revenue, expenditure, and developmentThe government has consistentlyexndtrasapcntoGDproduced National Development Plans expenditure as a percent of GDPthat determined its spending. Once a 70 Reurentplan is voted into force by parliament, 60 revnue
it is illegal to implement any X so expdiure
additional public projects without -going back to parliament. This system % /has proven to be effective in 30controlling spending, because it Z 20 -prevents the inception of a project for 1 0 -" -" " ' -.
which no provision was made to coverthe total costs over time. 0
AN A'3 ^p^\* ^ o o O 'q N"qA3Nq
Moreover, decisions to investdomestically took into account the Source: Statistici Information Management and Analysis, The World Bank.
absorptive capacity of the economy. Figure 2. Reserves in months of imports of goods andSince the availability of skilled services 7
manpower was a large constraint in 30
Botswana, the government felt that 2S
increasing development expenditure t
beyond the capacity of the country 20
would result in a rate of return lower '8 is5that what could have been earned on IO
alternative assets (international Ireserves in particular). With reference S
to Figure 1, although development 0spending could have been further 1976 1978 1980 1982 1984 1986 1988 1990 1992 1994
increased (given the huge inflow of Source: International Financial Statistics, International Monetary Fund.
12 Environment Department Papers
The Case of Botswana
imports when diamond revenues declined. exchange rates. A common problem in countriesInstead of having to respond under pressure experiencing export booms is an appreciation ofwith drastic, fast acting policies, the the local currency leading to a reduction in thegovernment had considerable leeway for more competitiveness of other sectors in the economy.thoughtful decision making. Another advantage By avoiding real appreciation of the pula, otherof investing a part of the windfall gains in traded goods could continue to competeforeign exchange rather than domestically is successfully. Botswana's policy was, therefore,that it prevents the exchange rate from to use the exchange rate as a tool to promoteexcessively appreciating. economic diversification. The accumulation of
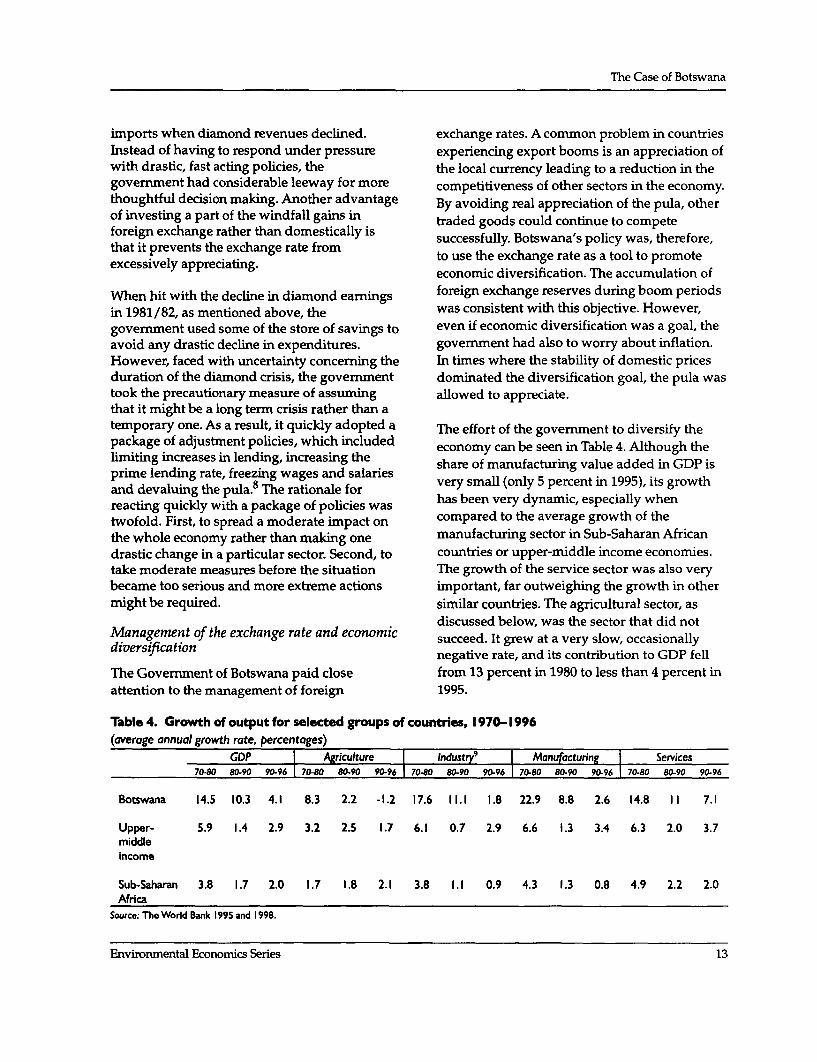
When hit with the decline in diamond earnings foreign exchange reserves during boom periodsin 1981/82, as mentioned above, the was consistent with this objective. However,government used some of the store of savings to even if economic diversification was a goal, theavoid any drastic decline in expenditures. government had also to worry about inflation.However, faced with uncertainty conceming the In times where the stability of domestic pricesduration of the diamond crisis, the government dominated the diversification goal, the pula wastook the precautionary measure of assuming allowed to appreciate.that it might be a long term crisis rather than atemporary one. As a result, it quickly adopted a The effort of the govemrnent to diversify thepackage of adjustment policies, which included economy can be seen in Table 4. Although thelimiting increases in lending, increasing the share of manufacturing value added in GDP isprime lending rate, freezing wages and salariesand devaluing the pula.8 The rationale for very small (only 5 percent in 1995), its growthreacting quickly with a package of policies was has been very dynamic, especially whentwofold. First, to spread a moderate impact on compared to the average growth of thethe whole economy rather than making one manufacturing sector in Sub-Saharan Africandrastic change in a particular sector. Second, to countries or upper-middle income economies.take moderate measures before the situation The growth of the service sector was also verybecame too serious and more extreme actions important, far outweighing the growth in othermight be required. similar countries. The agricultural sector, as
discussed below, was the sector that did notManagement of the exchange rate and economic succeed. It grew at a very slow, occasionallydiversification negative rate, and its contribution to GDP fell
The Government of Botswana paid close from 13 percent in 1980 to less than 4 percent inattention to the management of foreign 1995.
Table 4. Growth of output for selected groups of countries, 1970-1996(average annual growth rate, percentages)
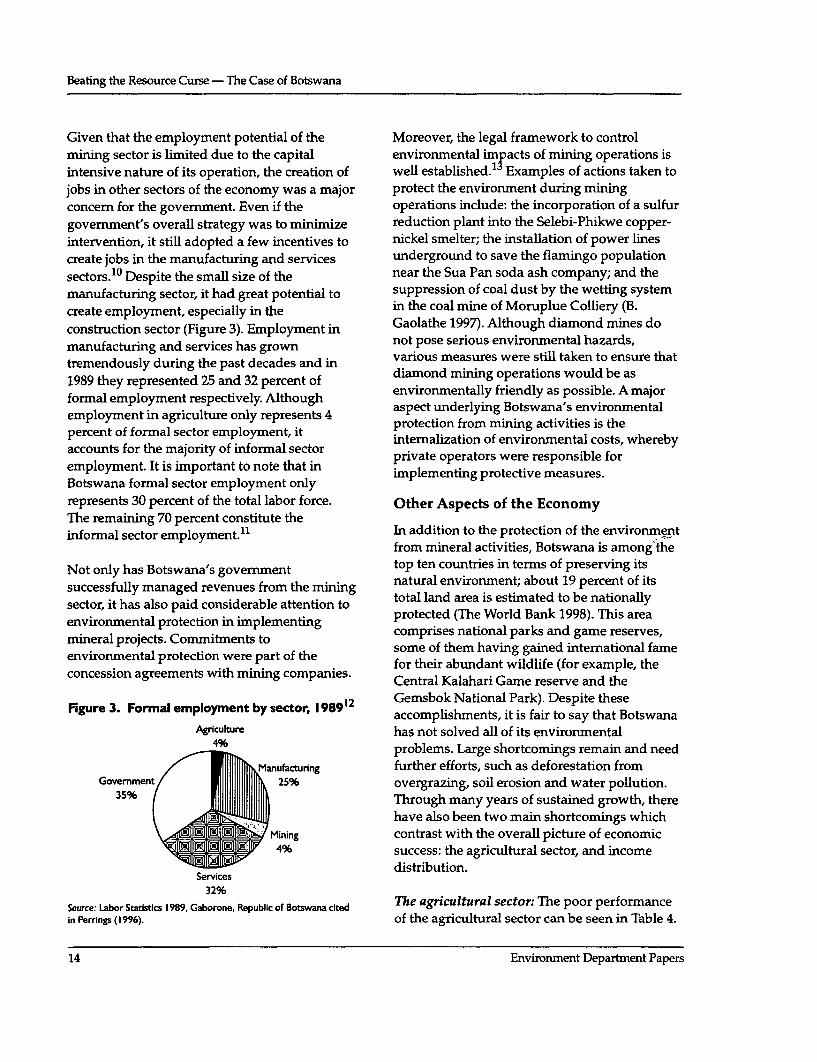
Given that the employment potential of the Moreover, the legal framework to controlmining sector is limited due to the capital environmental impacts of mining operations isintensive nature of its operation, the creation of well established.1 Examples of actions taken tojobs in other sectors of the economy was a major protect the environment during miningconcern for the governnent. Even if the operations include: the incorporation of a sulfurgovernment's overall strategy was to minimize reduction plant into the Selebi-Phikwe copper-intervention, it still adopted a few incentives to nickel smelter; the installation of power linescreate jobs in the manufacturing and services underground to save the flamingo populationsectors.10 Despite the small size of the near the Sua Pan soda ash company; and themanufacturing sector, it had great potential to suppression of coal dust by the wetting systemcreate employment, especially in the in the coal mine of Moruplue Colliery (B.construction sector (Figure 3). Employment in Gaolathe 1997). Although diamond mines domanufacturing and services has grown not pose serious environmental hazards,tremendously during the past decades and in various measures were still taken to ensure that1989 they represented 25 and 32 percent of diamond mining operations would be asformal employment respectively. Although environmentally friendly as possible. A majoremployment in agriculture only represents 4 aspect underlying Botswana's environmentalpercent of formal sector employment, it protection from mining activities is theprceuntsforthemajority of informal sector empinternalization of environmental costs, wherebyaccounts for the majority of informal sector prvt oprtr eerepnil oemployment. It is important to note that in 'im et e measue wsBotswana formal sector employment onlyrepresents 30 percent of the total labor force. Other Aspects of the EconomyThe remaining 70 percent constitute theinformal sector employment.11 In addition to the protection of the environment
from mineral activities, Botswana is among the
Not only has Botswana's government top ten countries in terms of preserving itssuccessfully managed revenues from the mining natural environment; about 19 percent of itssector, it has also paid considerable attention to total land area is estimated to be nationallyenvironmental protection in implementing protected (The World Bank 1998). This areamineral projects. Commitments to comprises national parks and game reserves,environmental protection were part of the some of them having gained interational fameconcession agreements with mining companies. for their abundant wildlife (for example, the
Central Kalahari Game reserve and the
Figure 3. Formal employment by sector, 1989 12 Gemsbok National Park). Despite theseaccomplishments, it is fair to say that Botswana
Agriculture has not solved all of its environimental
4% problems. Large shortcomings remain and needManufacturing further efforts, such as deforestation from
Government 25% overgrazing, soil erosion and water pollution.35% t | l l lill Through many years of sustained growth, there
have also been two main shortcomings whichi 1 38 X 1 Mining contrast with the overall picture of economic
4% R B disuccess: the agricultural sector, and incomedistribution.
Services32%
Source: Labor Statistics 1989, Gaborone, Republic of Botswana cited The agricultural sector: The poor performancein Perrings (1996). of the agricultural sector can be seen in Table 4.
14 Environment Department Papers
The Case of Botswana
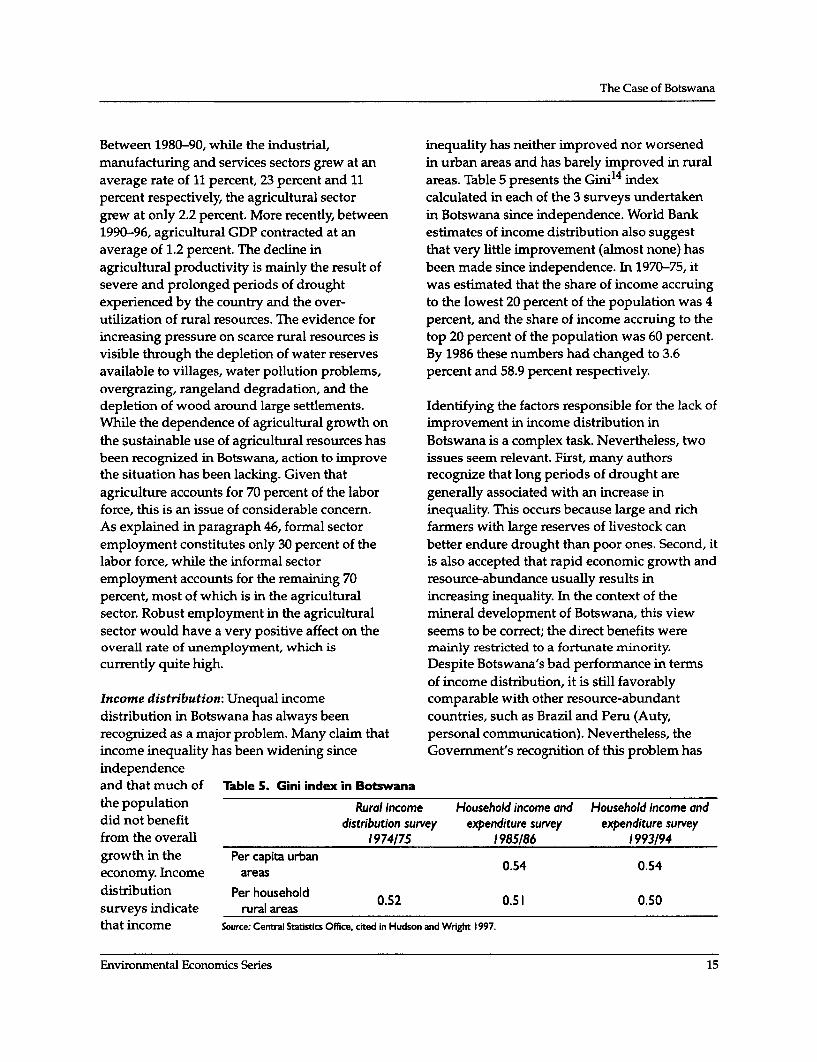
Between 1980-90, while the industrial, inequality has neither improved nor worsenedmanufacturing and services sectors grew at an in urban areas and has barely improved in ruralaverage rate of 11 percent, 23 percent and 11 areas. Table 5 presents the Gini14 indexpercent respectively, the agricultural sector calculated in each of the 3 surveys undertakengrew at only 2.2 percent. More recently, between in Botswana since independence. World Bank1990-96, agricultural GDP contracted at an estimates of income distribution also suggestaverage of 1.2 percent. The decline in that very little improvement (almost none) hasagricultural productivity is mainly the result of been made since independence. In 1970-75, itsevere and prolonged periods of drought was estimated that the share of income accruingexperienced by the country and the over- to the lowest 20 percent of the population was 4utilization of rural resources. The evidence for percent, and the share of income accruing to theincreasing pressure on scarce rural resources is top 20 percent of the population was 60 percent.visible through the depletion of water reserves By 1986 these numbers had changed to 3.6available to villages, water pollution problems, percent and 58.9 percent respectively.overgrazing, rangeland degradation, and thedepletion of wood around large settlements. Identifying the factors responsible for the lack ofWhile the dependence of agricultural growth on improvement in income distribution inthe sustainable use of agricultural resources has Botswana is a complex task. Nevertheless, twobeen recognized in Botswana, action to improve issues seem relevant. First, many authorsthe situation has been lacking. Given that recognize that long periods of drought areagriculture accounts for 70 percent of the labor generally associated with an increase inforce, this is an issue of considerable concern. inequality. This occurs because large and richAs explained in paragraph 46, formal sector farmers with large reserves of livestock canemployment constitutes only 30 percent of the better endure drought than poor ones. Second, itlabor force, while the informal sector is also accepted that rapid economic growth andemployment accounts for the remaining 70 resource-abundance usually results inpercent, most of which is in the agricultural increasing inequality. In the context of thesector. Robust employment in the agricultural mineral development of Botswana, this viewsector would have a very positive affect on the seems to be correct; the direct benefits wereoverall rate of unemployment, which is mainly restricted to a fortunate minority.currently quite high. Despite Botswana's bad performance in terms
of income distribution, it is still favorablyIncome distribution: Unequal income comparable with other resource-abundantdistribution in Botswana has always been countries, such as Brazil and Peru (Auty,recognized as a major problem. Many claim that personal communication). Nevertheless, theincome inequality has been widening since Government's recognition of this problem hasindependenceand that much of Table S. Gini index in Botswanathe population Rural income Household income and Household income anddid not benefit distribution survey expenditure survey expenditure surveyfrom the overall 1974/75 1985186 1993194growth in the Per capita urban 0.54 0.54economy. Income areasdistribution Per household 0.52 0.51 0.50surveys indicate rural areasthat income Source: Central Statistics Office, cited In Hudson and Wright 1997.
Environmental Economics Series 15
Beating the Resource Curse - The Case of Botswana
pushed it to invest in many social aspects of the educated population is one of seriouseconomy, such as education and health. But the unemployment (estimated at 21.2 percent inproblem that seems to be facing a now better 1994).
16 Environment Department Papers
4 Conclusion
The "resource curse" literature shows, through resource abundant countries, and that prudentvarious channels of influence, how resource economic management can help avoid orbooms can actually harm resource-abundant mitigate the detrimental effects of the resourceeconomies. A review of the literature offers both curse. The discovery of large diamond depositseconomic and political dimensions to the allowed Botswana to witness an importantproblems of resource-abundant economies. For export boom and the world's fastest growth ininstance, an increase in copper prices in Peru GDP. The country moved from being the 25thlead to an appreciation of the real exchange rate poorest country in 1966 to an upper-middlewhich subsequently damaged the economy thirty years later. The most importantmanufacturing and agricultural sectors. In factor in Botswana's long term sustainedBolivia, low linkages of the booming mineral economic growth was its ability to avoidsector to the rest of the economy did not common problems associated with exportpromote sustainable economic development. In booms and the adoption of sound economicterms of political influences, Brazil's attempts to policies. Its main objectives were to avoidremove protection for uncompetitive sectors extemal debt, stabilize growth and to encouragewere blocked by rent seeking groups. In short, economic diversification. This paper hasthe curse of resource booms is very real. explored the various economic policies adoptedHowever, the question raised in this paper is by the Botswana government to achieve thosewhether or not resource-abundance and objectives. Even if the agricultural sector andsubsequent resource-booms lead to inevitably income distribution have had a less successfullow economic performance. fate, various lessons could be drawn from
Botswana's capacity to manage the revenue ofThe case of Botswana illustrates how a natural the resource booms and to sustain long termresource curse is not necessarily the fate of all economic growth.
Environmnental Economics Series 17
Notes
1. This example is drawn from a similar 8. For additional information please refer toexample cited in McMahon (1997). Hill and Mokgethi (1989).
2. The Dutch Disease model is named after the 9. Industry includes mining.disappointing experience of the discovery of 10. For more information on this issue, pleasenatural gas in the Netherlands. The term is refer to Siwawa-Nadi (1996).popularly used to refer to all economic 11. The size of the labor force estimate is basedhardships associated with resource exports. on the projection of the population assumedIts more formal definition, however, to be economically active. Informal sectordescribes two effects of a resource boom: an employment is the difference between theappreciation of the real exchange rate; the estimated labor force and formaltendency to draw capital and labor away employment (Perrings 1996).from non-boom tradable sectors, making 12. Manufacturing includes: electricity, water,them more un-competitive (Ross 1999). and construction. Services include
3. Import substitution strategies were commerce, transport, and financial.promoted by the United Nations Economic 13. The legislation related to the environmentalCommission, as part of the development impacts of mining operations include: Thecampaign of the 1960s and 1970s (cited in Atmospheric Pollution Prevention Act ofSachs and Wamer 1995). 1971; the Mining, Quarries, Works, and
4. 1998 or latest available year. Machinery Act of 1973; and the Mines and5. The decrease in life expectancy since the Mineral Act of 1976.
early nineties is mainly due to the high 14. A Gini index measures the extent to whichincidence of HIV infection in Botswana. the distribution of income among
6. By other tradable goods, it is meant tradable individuals or households within angoods other than the one experiencing a economy deviates from a perfectly equalboom (such as minerals, in the case of distribution. A Gini index of 0 representsBotswana). perfect equality while an index of 100
7. Represents international reserves expressed implies perfect inequality (The World Bankin terms of the number of months of import 1998).of goods and services which could be paidfor.
Environmental Economics Series 19
References
Auty, R. 1993. Sustaining Development in Birdsall and F. Jasperson, eds. Pathways toMineral Economies: The Resource Curse Growth: Comparing East Asia and LatinThesis. Routledge, London. America. Washington DC: Inter-American
___. 1994a. "Industrial Policy Reform in Six Development Bank, 93-127.Large Newly Industrializing Countries: The Gaolathe B. 1997. "Development of Botswana'sResource Curse Thesis." World Mineral Sector." Aspects of the BotswanaDevelopment, Vol 22, No 1 pp. 11-26. Economy, Selected Papers.
. 1994b. "The Resource Curse Thesis: Gaolathe N. 1997. "Botswana's Boom andMinerals in Bolivian Development, 1970- Recession Experience: A Discussion."90." Singapore Journal of Tropical Aspects of the Botswana Economy, SelectedGeography, Vol. 15, No. 2 pp. 95-111. Papers.
. 1995. "Industrial Policy, Sectoral Harvey, C., and S. Lewis. 1990. Policy choice andMaturation, and Postwar Economic Growth development in Botswana. St Martin's Press,in Brazil: The Resource Curse Thesis." New York.Economic Geography vol. 71 No. 3. Harvey, C. 1993. "Botswana: Is the Economic
____. 1998. "Resource Abundance and Miracle Over?" Journal of African Economies,Economic Development: Improving the Vol. 1, No. 3.Performance of Resource-Rich Countries." Hill, C., and N. Mokgethi. 1989. "Botswana:The United Nations University World Macroeconomics Management ofInstitute for Development Economics Commodity Booms, 1975-86." SuccessfulResearch, Helsinki. Development in Africa, Economic
Auty, R., and J. L. Evia. 2001. "A Growth Development Institute of The World Bank.Collpsewith Point Resources: Bo-ivia." Hudson, D., and M. Wright. 1997. "Income
Collapser 1 in Auty, R., ed. ResourceInequality in Botswana-Trends SinceChapter 11 in Auty, R., ed. Resource * v ,Abundance and Economic Development. Independence." Aspects of the BotswanaAbundance ~ ~ ~ ~ ~ ~ ~Ecnoy Selcte Papers.eelpmntWIDER Studies in Development Economics, Economy, Selected Papers.Oxford University Press. cao,G 97 TeNtrlRsucOxfod Unversty Pess Curse: Myth or Reality?" mimeo, World
Auty, R. and S. Kiiski. 2001. "Natural Resources, Bank Institute.Capital Accumulation, Structural Change Mikesell, R. "Explaining the Resource Curse,and Welfare." Chapter 2 in Auty, R., ed. with Special Reference to Mineral-ExportingResource Abundance and Economic Countries." Resources Policy, Vol. 23, No. 4,Development. WIDER Studies in pp. 191-199, 1997Development Economics, Oxford University Mohohlo, L. 1997. "Central Banks as ProtectorsPress. of National Wealth: Botswana's Case."
Birdsall, N., D. Ross, and R. Sabot. 1997. Aspects of the Botswana Economy, Selected"Education, growth, and inequality." In N. Papers.
Environmental Economnics Series 21
Beating the Resource Curse - The Case of Botswana
Perrings, C. 1996. Sustainable Development and Syrquin, M., and H. B. Chenery. 1989. "PatternsPoverty Alleviation in Sub-Saharan Africa: The of Development 1950 to 1983." World BankCase of Botswana. Macmillan Press, London. Discussion Paper 41, Washington DC: World
Ross, M. 1999. "The Political Economy of the Bank.Resource Curse." World Politics, Vol. 51, Usui, N. 1997. "Dutch Disease and PolicyNo. 2, pp. 297-322. Adjustments to the Oil Boom: A
Sachs, J., and A. Warner. 1995. "Natural Comparative Study of Indonesia andResource Abundance and Economic Mexico." Resources Policy, Vol. 23, No. 4,Growth." Development Discussion Paper pp. 151-162.No. 517a, Harvard Institute for Wood, A., and K. Berge. 1994. "ExportingInternational Development. Manufactures: Human Resources, Natural
Seymour, J.M. 2000. "East Tmior's Resource Resources and Trade Policy." Journal ofCurse?" Global Policy Forum, UN Security Development Studies, Vol. 34, pp. 35-59.Council. <http://www.globalpolicy.org/ The World Bank. 1998. World Developmentsecurity/natres/oil/001130et.htm>. Indicators.
Siwawa-Ndai, P. 1997. "Industrialization in . 2001. World Development Indicators.
Botswana." Aspects of the Botswana . 1991. World Development Report.Economy, Selected Papers. . 1995. World Development Report.
Stijns, J. C. 2001. "Natural Resource Abundance Wright, M. 1997. "The Use of Mineral Revenuesand Economic Growth Revisited." in Botswana: Super Caution vs.(Unpublished Second Draft) University of Pragmatism." The Research Bulletin, Vol. 15California at Berkeley. No.1, Bank of Botswana.
22 Environment Department Papers
Environment DepartmentThe World Barik1818 H Street, N.W.Washington, D.C. 20433Telephone 202-473-3641Faxsimile 202-477-0565