16
The Barth-Haas Group and Germain Hansmaennel present Market Leaders and their Challengers in the Top 40 Countries in 2012 Beer Production
The Barth-Haas Group and Germain Hansmaennel present
Market Leaders and their Challengers in the Top 40 Countries in 2012
Beer Production

The Barth-Haas Hops Academy
It is well known that hops are a prime flavour component in beer, but their remarkably high impact on the final product is often overlooked. The closer one looks at hops, the more revealing their importance to beer becomes. Hops have see-mingly inexhaustible potential not only in terms of aroma and bitterness, but also in the other attributes they provide in the brewing process and finished beer.
Understanding the complexities of hops and tapping into their full potential is why we brought the BARTH-HAAS HOPS ACADEMY into being. Having an acute knowledge of the usage, effects and impact of this special brewing ingredient will help the brewer optimize process efficiencies and develop distinctive high-quality beers.
The Hop Aroma Compendium – a whole new experience of hops!
Just discover the Hop Aroma Compendium, a unique description of the aromas of hop varieties, constituting a further element in Barth-Haas‘ projects designed to increase hop expertise in the brewing industry and in other sectors. A purely technical analysis does not do justice to the hops and is of only little help to the brewer when it comes to developing new recipes. In particular the skilful use of flavour hops produced unique and individual beers, which was the main reason for that unique project.
At the end of 2013 Volume 3 of the Hop Aroma Compendium will be published presenting further hop varieties. Together with Volume 1 and 2 there are now more than 130 hop varieties which were tasted by two world champion beer sommeliers and a perfumist and a Barth-Haas expert panel.
The 2013 winners are:
The Barth-Haas Grants – your hops research opportunity
Since 2007 the Barth-Haas Group has awarded five grants of 2,000 EUR each year to support research ideas that focus on hops and hop products in brewing. Our grants have become so successful that hop research is now experiencing a revival. The ideas funded so far reveal just the tip of the iceberg concerning the unknown properties of hops. The previously funded research projects looked into
hop derived anti-foams
dry hopping techniques
hop aroma utilisation during brewing
the role of hops in flavour stability
instrumental bitterness detection
hops and gushing
hop derived flavour active compounds
While these research projects have answered many questions, as is often the case in the world of science, they have also gene-rated many more interesting questions at the same time. Like in the previous year, we have decided to support six research ideas with our grants in order to meet with the increasing number of applications.
A list of the research projects that were supported with the Barth-Haas Grants since 2007 can be found on our website: www.barthhaasgroup.com
2
More about hops
University/Institute Research Supervisor Student Title
1 KU Leuven, Belgium Prof. Guy Derdelincks Zhara Shokribousjein Hop antifoam, fractions of hop antifoam as well as hop aid antifoam regarding gushing surpression and application in the brewing process
2 KaHo St. Lieven, Belgium Prof. Luc de Cooman Tatiana Praet Chemical-analytical and sensorial characterisation of the „kettle hoppy“ aroma of beer
3 TU Berlin, Germany Prof. Frank-Juergen Methner Fabian Götz Development and optimization of a fast and easy-to-handle dry-hopping technique for the usage of pelletized hops
4 UC Davis, USA Dr. Anita Oberholster Brad Titus Determination of the effectiveness of dry hopping on flavor stability of beer
5 UC Louvain, Belgium Prof. Sonia Collin Hadrien Massart Study of new hop glucosylic compounds: flavor potential of theaspiran derived molecules
6 UC Louvain, Belgium Prof. Sonia Collin Emilie Vercruysse S-conjugates precursors of thiols in hop, a resource for increasing the beer hoppy aroma shelf life

Explanation
RANKING The ranking of the countries is based on production volume. The number on the left of the country indicates its world beer production ranking.
POPULATION (POP): Million inhabitants.
GROSS NATIONAL PRODUCT (GNP): in billion US-dollars.
PRODUCTION (PROD): Beer in million hectolitres.
PER CAPITA CONSUMPTION (PCC): Beer in litres.
MARKET SHARE (MS): Market share based on the breweries’ dome-stic sales. The breweries are mentioned in the national ranking either if their market share is higher than 10 % with a minimum volume of 1 million hl or if they appear in the top 40 brewery list having more than 5 % market share in the respective country.
FINANCIAL PARTICIPATION
If the group behind the domestic brewery is written in capital letters it means the group has a participation over 50 %. If it is writ-ten in lower case it means the group has a participation below 50 %.
BREWERY GROUPS - ABBREVIATIONS ABI AB INBEV SABM SAB-MILLER HEI HEINEKEN CAR CARLSBERG MOCO MOLSON-COORS KIR KIRIN
SOURCES Barth-Report 2012/2013, United Nations and World Bank Statistics
EDITION NOTICE
Publisher: Joh. Barth & Sohn GmbH & Co. KG Freiligrathstrasse 7/9, 90482 Nuremberg, Germany
Project responsibility: Stephan Barth, Managing Partner, Nuremberg
Editor: Heinrich Meier, Georgensgmuend
Layout: Buero Alexander Froede, Cologne
Printer: Pinsker Druck und Medien GmbH, Mainburg
ABOUT THE FRONT COVER
Beer flavour through dry hopping. The picture shows a fully loaded hop kiln with freshly harvested hops in the process of being dried. The title is a word play with “Hop drying” which is the necessary process to prevent hops from spoiling, being turned into “Dry hopping” the process of imparting wonderful flavour into great beers.
3

WEYERMANN® SPECIALTY MALTS
Specialty Malting CompanyBrennerstrasse 17-19 · 96052 Bamberg - Germany · www.weyermannmalt.com
Mexico 6
USA 2
Canada 19
6 Mexico POP 114.8 GNP 1,207.8 PROD 82.500* PCC 60 MS 99 %
MODELO·ABI (MS 56 %) CUAUHTEMOC FEMSA·HEI
2 USA POP 311.9 GNP 15,752.8 PROD 229.314 PCC 75 MS 81 %
AB INBEV·ABI (MS 47 %) MILLERCOORS·SABM/moco CROWN IMPORTS
19 Canada POP 34.5 GNP 1,804.6 PROD 19.525 PCC 65 MS 80 %
LABATT·ABI (MS 41 %) MOLSON-COORS·MOCO
North and Central AmericaThe Americas: Total Beer production 571.2m hl (compared to 2011 +5.8m hl)
4
Quick Helper POP: Million inhabitants GNP: Gross National Product in billion US-dollars PROD: Production of beer in million hectolitres * Estimate PCC: Per Capita Consumption of beer in litres MS: Market Share
ABI AB INBEV SABM SAB-MILLER HEI HEINEKEN CAR CARLSBERG MOCO MOLSON-COORS KIR KIRIN
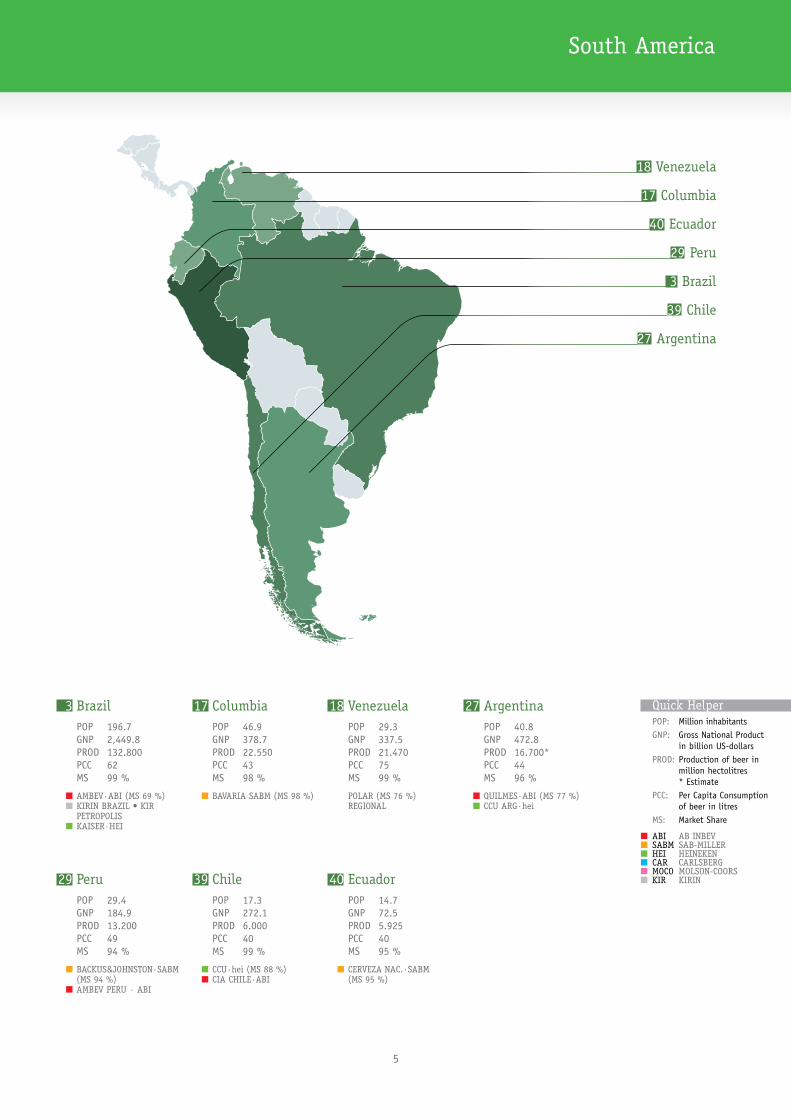
South America
18 Venezuela
17 Columbia
29 Peru
3 Brazil
39 Chile
27 Argentina
40 Ecuador
3 Brazil POP 196.7 GNP 2,449.8 PROD 132.800 PCC 62 MS 99 %
AMBEV·ABI (MS 69 %) KIRIN BRAZIL • KIR PETROPOLIS KAISER·HEI
17 Columbia POP 46.9 GNP 378.7 PROD 22.550 PCC 43 MS 98 %
BAVARIA SABM (MS 98 %)
29 Peru POP 29.4 GNP 184.9 PROD 13.200 PCC 49 MS 94 %
BACKUS&JOHNSTON·SABM (MS 94 %) AMBEV PERU · ABI
18 Venezuela POP 29.3 GNP 337.5 PROD 21.470 PCC 75 MS 99 %
POLAR (MS 76 %) REGIONAL
27 Argentina POP 40.8 GNP 472.8 PROD 16.700* PCC 44 MS 96 %
QUILMES·ABI (MS 77 %) CCU ARG·hei
39 Chile POP 17.3 GNP 272.1 PROD 6.000 PCC 40 MS 99 %
CCU·hei (MS 88 %) CIA CHILE·ABI
40 Ecuador POP 14.7 GNP 72.5 PROD 5.925 PCC 40 MS 95 %
CERVEZA NAC.·SABM (MS 95 %)
5
Quick Helper POP: Million inhabitants GNP: Gross National Product in billion US-dollars PROD: Production of beer in million hectolitres * Estimate PCC: Per Capita Consumption of beer in litres MS: Market Share
ABI AB INBEV SABM SAB-MILLER HEI HEINEKEN CAR CARLSBERG MOCO MOLSON-COORS KIR KIRIN

Answers for industry.
siemens.com/brewery
Always the same taste – worldwide.BRAUMAT makes it easier to reproduce recipes
How your beer can always taste the same: with our BRAUMAT process control system, which seamlessly controls and monitors the brewing process, therefore securing absolute reproducibility of a brew.
Or with the Interspec MES module, which simplifies the exchange and implementation of recipe data at various brewing locations. Our portfolio keeps the taste consistent.
E200
01-F
210-
T110
-V1-
7600
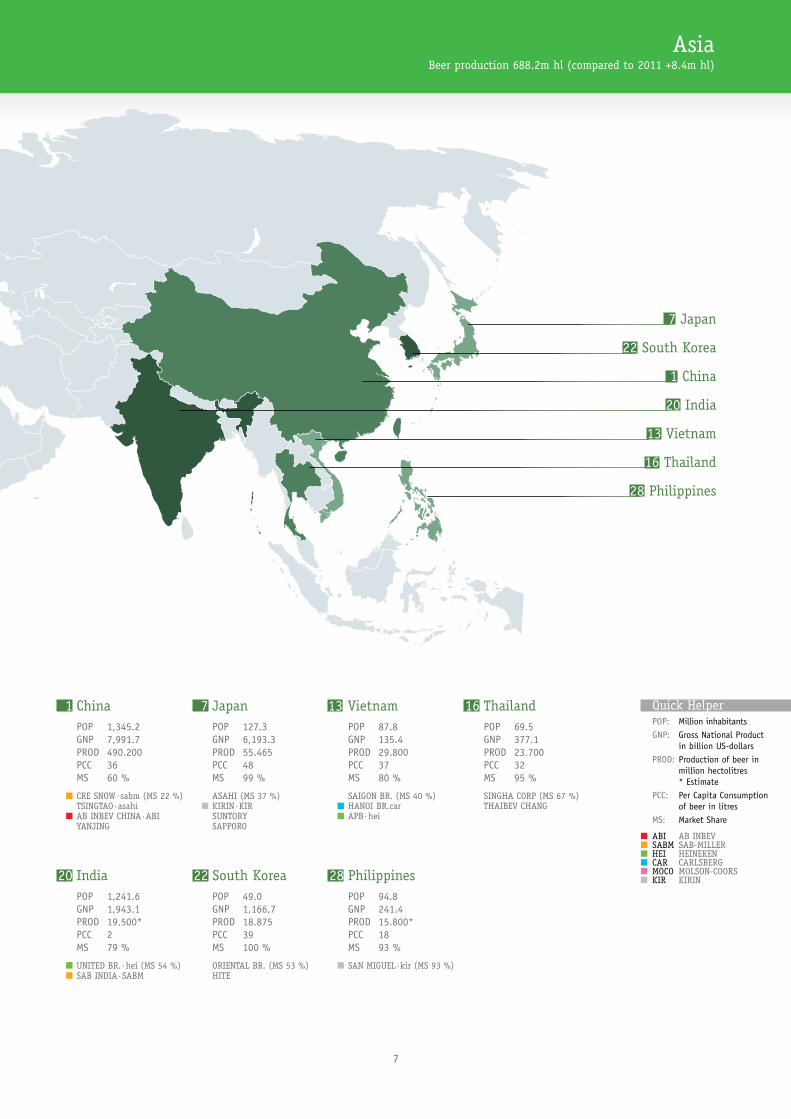
20 India POP 1,241.6 GNP 1,943.1 PROD 19.500* PCC 2 MS 79 %
UNITED BR.·hei (MS 54 %) SAB INDIA·SABM
AsiaBeer production 688.2m hl (compared to 2011 +8.4m hl)
1 China POP 1,345.2 GNP 7,991.7 PROD 490.200 PCC 36 MS 60 %
CRE SNOW·sabm (MS 22 %) TSINGTAO·asahi AB INBEV CHINA·ABI YANJING
7 Japan POP 127.3 GNP 6,193.3 PROD 55.465 PCC 48 MS 99 %
ASAHI (MS 37 %) KIRIN·KIR SUNTORY SAPPORO
28 Philippines POP 94.8 GNP 241.4 PROD 15.800* PCC 18 MS 93 %
SAN MIGUEL·kir (MS 93 %)
16 Thailand POP 69.5 GNP 377.1 PROD 23.700 PCC 32 MS 95 %
SINGHA CORP (MS 67 %) THAIBEV CHANG
22 South Korea POP 49.0 GNP 1,166,7 PROD 18.875 PCC 39 MS 100 %
ORIENTAL BR. (MS 53 %) HITE
7 Japan
22 South Korea
1 China
20 India
13 Vietnam
16 Thailand
28 Philippines
13 Vietnam POP 87.8 GNP 135.4 PROD 29.800 PCC 37 MS 80 %
SAIGON BR. (MS 40 %) HANOI BR.car APB·hei
7
Quick Helper POP: Million inhabitants GNP: Gross National Product in billion US-dollars PROD: Production of beer in million hectolitres * Estimate PCC: Per Capita Consumption of beer in litres MS: Market Share
ABI AB INBEV SABM SAB-MILLER HEI HEINEKEN CAR CARLSBERG MOCO MOLSON-COORS KIR KIRIN
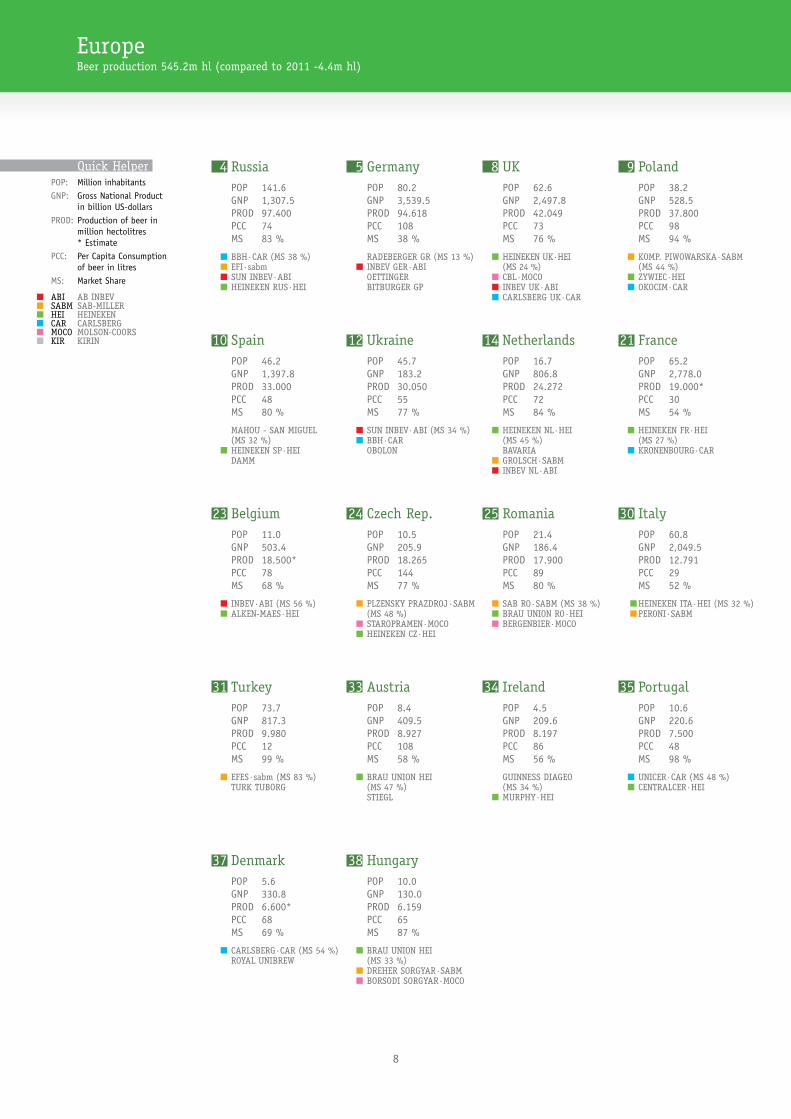
EuropeBeer production 545.2m hl (compared to 2011 -4.4m hl)
4 Russia POP 141.6 GNP 1,307.5 PROD 97.400 PCC 74 MS 83 %
BBH·CAR (MS 38 %) EFI·sabm SUN INBEV·ABI HEINEKEN RUS·HEI
10 Spain POP 46.2 GNP 1,397.8 PROD 33.000 PCC 48 MS 80 %
MAHOU - SAN MIGUEL (MS 32 %) HEINEKEN SP·HEI DAMM
24 Czech Rep. POP 10.5 GNP 205.9 PROD 18.265 PCC 144 MS 77 %
PLZENSKY PRAZDROJ·SABM (MS 48 %) STAROPRAMEN·MOCO HEINEKEN CZ·HEI
31 Turkey POP 73.7 GNP 817.3 PROD 9.980 PCC 12 MS 99 %
EFES·sabm (MS 83 %) TURK TUBORG
37 Denmark POP 5.6 GNP 330.8 PROD 6.600* PCC 68 MS 69 %
CARLSBERG·CAR (MS 54 %) ROYAL UNIBREW
5 Germany POP 80.2 GNP 3,539.5 PROD 94.618 PCC 108 MS 38 %
RADEBERGER GR (MS 13 %) INBEV GER·ABI OETTINGER BITBURGER GP
12 Ukraine POP 45.7 GNP 183.2 PROD 30.050 PCC 55 MS 77 %
SUN INBEV·ABI (MS 34 %) BBH·CAR OBOLON
23 Belgium POP 11.0 GNP 503.4 PROD 18.500* PCC 78 MS 68 %
INBEV·ABI (MS 56 %) ALKEN-MAES·HEI
33 Austria POP 8.4 GNP 409.5 PROD 8.927 PCC 108 MS 58 %
BRAU UNION HEI (MS 47 %) STIEGL
38 Hungary POP 10.0 GNP 130.0 PROD 6.159 PCC 65 MS 87 %
BRAU UNION HEI (MS 33 %) DREHER SORGYAR·SABM BORSODI SORGYAR·MOCO
8 UK POP 62.6 GNP 2,497.8 PROD 42.049 PCC 73 MS 76 %
HEINEKEN UK·HEI (MS 24 %) CBL·MOCO INBEV UK·ABI CARLSBERG UK·CAR
14 Netherlands POP 16.7 GNP 806.8 PROD 24.272 PCC 72 MS 84 %
HEINEKEN NL·HEI (MS 45 %) BAVARIA GROLSCH·SABM INBEV NL·ABI
21 France POP 65.2 GNP 2,778.0 PROD 19.000* PCC 30 MS 54 %
HEINEKEN FR·HEI (MS 27 %) KRONENBOURG·CAR
34 Ireland POP 4.5 GNP 209.6 PROD 8.197 PCC 86 MS 56 %
GUINNESS DIAGEO (MS 34 %) MURPHY·HEI
9 Poland POP 38.2 GNP 528.5 PROD 37.800 PCC 98 MS 94 %
KOMP. PIWOWARSKA·SABM (MS 44 %) ZYWIEC·HEI OKOCIM·CAR
25 Romania POP 21.4 GNP 186.4 PROD 17.900 PCC 89 MS 80 %
SAB RO·SABM (MS 38 %) BRAU UNION RO·HEI BERGENBIER·MOCO
30 Italy POP 60.8 GNP 2,049.5 PROD 12.791 PCC 29 MS 52 %
HEINEKEN ITA·HEI (MS 32 %) PERONI·SABM
35 Portugal POP 10.6 GNP 220.6 PROD 7.500 PCC 48 MS 98 %
UNICER·CAR (MS 48 %) CENTRALCER·HEI
Quick Helper POP: Million inhabitants GNP: Gross National Product in billion US-dollars PROD: Production of beer in million hectolitres * Estimate PCC: Per Capita Consumption of beer in litres MS: Market Share
ABI AB INBEV SABM SAB-MILLER HEI HEINEKEN CAR CARLSBERG MOCO MOLSON-COORS KIR KIRIN
8

4 Russia
31 Turkey
25 Romania
12 Ukraine
38 Hungary
9 Poland
33 Austria
30 Italy
24 Czech Rep.
21 France
5 Germany
23 Belgium
14 Netherlands
37 Denmark
10 Spain
35 Portugal
8 UK
34 Ireland
Europe
98
Countries with more export than import:
Production EXP-IMP Saldo MS basis PROD+IMP-EXP
Germany 94.6 8.0 86.6
Netherlands 24.3 11.5 12.8
Belgium 18.5 10.0 8.5
Countries with more import than export:
Production IMP-EXP Saldo MS basis PROD+IMP-EXP
UK 42.0 2.3 39.7
Spain 33.0 1.6 31.4
France 19.0 2.7 16.3
Italy 12.8 4.3 8.5
As the trade of beer across national borders is insignificant in most countries, the market share in the domestic market is synonymous with the total market share with the exception of the following countries:

Fachverlag Hans Carl GmbH P.O. Box 99 01 53 90268 Nuremberg, GermanyPhone: ++49(0)911/9 52 85-0
Web:www.brauwelt.dewww.brauweltinternational.comwww.carllibri.com
Indispensable–
Worldwide
Print – Newsletter – OnlineContact us now!
IndispensableIndispensable
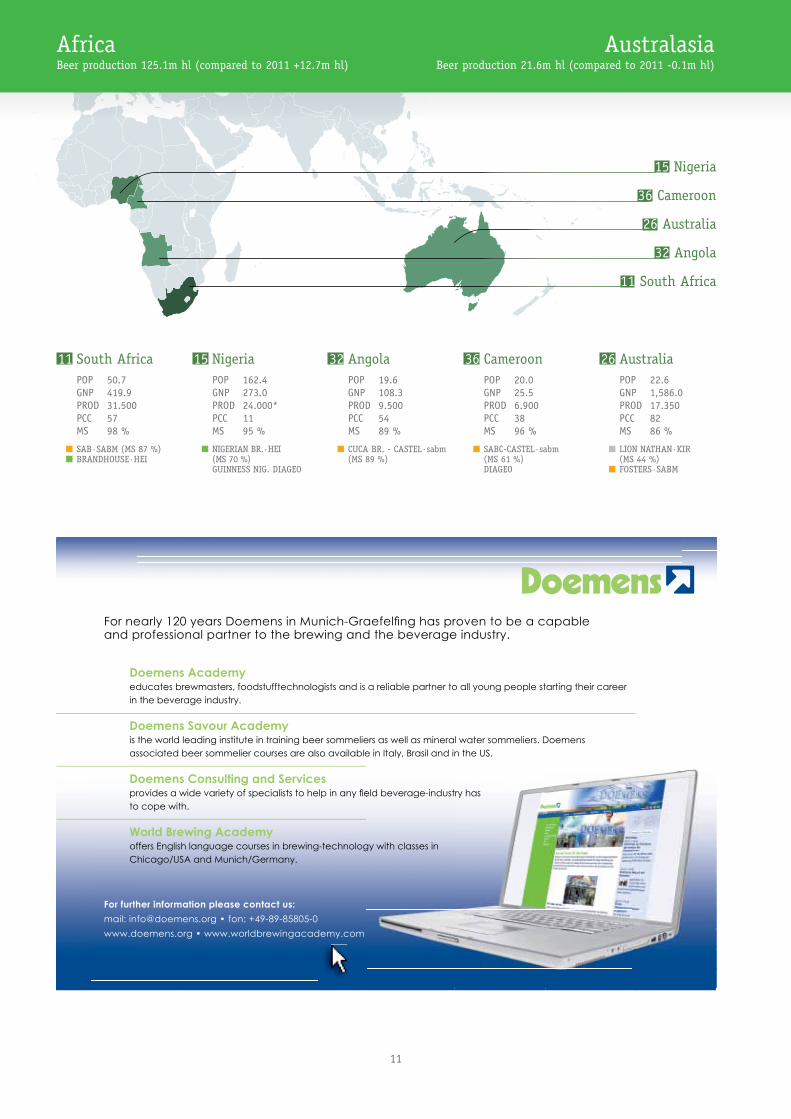
Australasia Beer production 21.6m hl (compared to 2011 -0.1m hl)
AfricaBeer production 125.1m hl (compared to 2011 +12.7m hl)
11 South Africa POP 50.7 GNP 419.9 PROD 31.500 PCC 57 MS 98 %
SAB·SABM (MS 87 %) BRANDHOUSE·HEI
15 Nigeria POP 162.4 GNP 273.0 PROD 24.000* PCC 11 MS 95 %
NIGERIAN BR.·HEI (MS 70 %) GUINNESS NIG. DIAGEO
32 Angola POP 19.6 GNP 108.3 PROD 9.500 PCC 54 MS 89 %
CUCA BR. - CASTEL·sabm (MS 89 %)
36 Cameroon POP 20.0 GNP 25.5 PROD 6.900 PCC 38 MS 96 %
SABC-CASTEL·sabm (MS 61 %) DIAGEO
26 Australia POP 22.6 GNP 1,586.0 PROD 17.350 PCC 82 MS 86 %
LION NATHAN·KIR (MS 44 %) FOSTERS·SABM
36 Cameroon
15 Nigeria
26 Australia
32 Angola
11 South Africa
11
Doemens Academy educates brewmasters, foodstufftechnologists and is a reliable partner to all young people starting their career in the beverage industry.
Doemens Savour Academy is the world leading institute in training beer sommeliers as well as mineral water sommeliers. Doemens associated beer sommelier courses are also available in Italy, Brasil and in the US.
Doemens Consulting and Services provides a wide variety of specialists to help in any eld beverage-industry has to cope with.
World Brewing Academy offers English language courses in brewing-technology with classes in Chicago/USA and Munich/Germany.
e in Italy, Brasil and in the US.
eld beverage-industry has
gy itwithh cllasses iin
For nearly 120 years Doemens in Munich-Graefel ng has proven to be a capable and professional partner to the brewing and the beverage industry.
For further information please contact us:
mail: [email protected] • fon: +49-89-85805-0
www.doemens.org • www.worldbrewingacademy.com
Barth-Report.indd 1 05.03.13 11:40

More about hops
12
Successful peoplehave competent partners!
Sachon trade publicationsInnovative magazines for professional decision makers
Verlag W. Sachon GmbH + Co. · Schloss Mindelburg · D-87719 MindelheimPhone +49/ 82 61/9 99-0 · Fax +49/ 82 61/9 99-3 91 · [email protected] · www.sachon.de
Your Sachon contacts:
BREWING AND BEVERAGE INDUSTRY Sabine Berchtenbreiter, Phone +49/ 82 61 / 9 99-3 38INTERNATIONAL, ESPAÑOL and CHINAGETRÄNKEINDUSTRIE
BRAUINDUSTRIE Anita Elsäßer, Phone +49/ 82 61 / 9 99-3 31DOEMENSIANER
GETRÄNKEFACHGROSSHANDEL Helga Reß, Phone +49/ 82 61 / 9 99-3 32
Anzeige englisch - NEU A4 –:0 11.03.2013 13:51 Uhr Seite 4
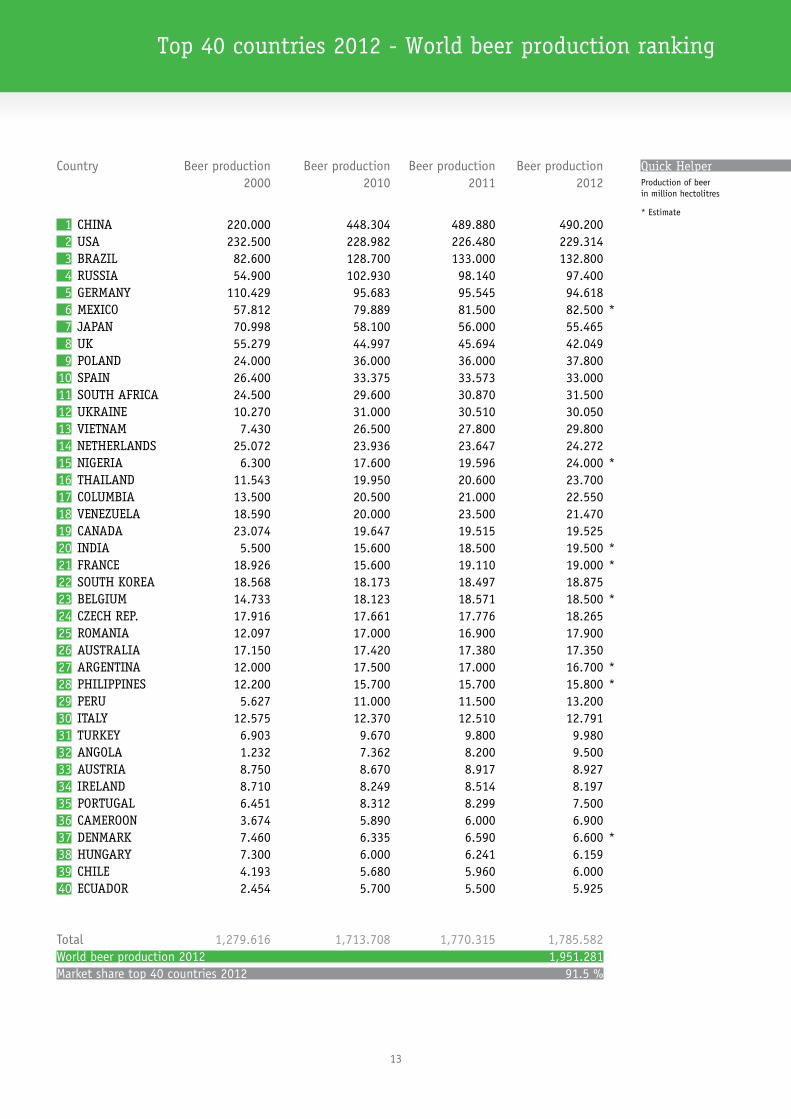
Top 40 countries 2012 - World beer production ranking
Country Beer production Beer production Beer production Beer production 2000 2010 2011 2012
1 CHINA 220.000 448.304 489.880 490.200 2 USA 232.500 228.982 226.480 229.314 3 BRAZIL 82.600 128.700 133.000 132.800 4 RUSSIA 54.900 102.930 98.140 97.400 5 GERMANY 110.429 95.683 95.545 94.618 6 MEXICO 57.812 79.889 81.500 82.500 * 7 JAPAN 70.998 58.100 56.000 55.465 8 UK 55.279 44.997 45.694 42.049 9 POLAND 24.000 36.000 36.000 37.800 10 SPAIN 26.400 33.375 33.573 33.000 11 SOUTH AFRICA 24.500 29.600 30.870 31.500 12 UKRAINE 10.270 31.000 30.510 30.050 13 VIETNAM 7.430 26.500 27.800 29.800 14 NETHERLANDS 25.072 23.936 23.647 24.272 15 NIGERIA 6.300 17.600 19.596 24.000 * 16 THAILAND 11.543 19.950 20.600 23.700 17 COLUMBIA 13.500 20.500 21.000 22.550 18 VENEZUELA 18.590 20.000 23.500 21.470 19 CANADA 23.074 19.647 19.515 19.525 20 INDIA 5.500 15.600 18.500 19.500 * 21 FRANCE 18.926 15.600 19.110 19.000 * 22 SOUTH KOREA 18.568 18.173 18.497 18.875 23 BELGIUM 14.733 18.123 18.571 18.500 * 24 CZECH REP. 17.916 17.661 17.776 18.265 25 ROMANIA 12.097 17.000 16.900 17.900 26 AUSTRALIA 17.150 17.420 17.380 17.350 27 ARGENTINA 12.000 17.500 17.000 16.700 * 28 PHILIPPINES 12.200 15.700 15.700 15.800 * 29 PERU 5.627 11.000 11.500 13.200 30 ITALY 12.575 12.370 12.510 12.791 31 TURKEY 6.903 9.670 9.800 9.980 32 ANGOLA 1.232 7.362 8.200 9.500 33 AUSTRIA 8.750 8.670 8.917 8.927 34 IRELAND 8.710 8.249 8.514 8.197 35 PORTUGAL 6.451 8.312 8.299 7.500 36 CAMEROON 3.674 5.890 6.000 6.900 37 DENMARK 7.460 6.335 6.590 6.600 * 38 HUNGARY 7.300 6.000 6.241 6.159 39 CHILE 4.193 5.680 5.960 6.000 40 ECUADOR 2.454 5.700 5.500 5.925 Total 1,279.616 1,713.708 1,770.315 1,785.582 World beer production 2012 1,951.281 Market share top 40 countries 2012 91.5 %
Quick Helper Production of beer in million hectolitres
* Estimate
13
Successful peoplehave competent partners!
Sachon trade publicationsInnovative magazines for professional decision makers
Verlag W. Sachon GmbH + Co. · Schloss Mindelburg · D-87719 MindelheimPhone +49/ 82 61/9 99-0 · Fax +49/ 82 61/9 99-3 91 · [email protected] · www.sachon.de
Your Sachon contacts:
BREWING AND BEVERAGE INDUSTRY Sabine Berchtenbreiter, Phone +49/ 82 61 / 9 99-3 38INTERNATIONAL, ESPAÑOL and CHINAGETRÄNKEINDUSTRIE
BRAUINDUSTRIE Anita Elsäßer, Phone +49/ 82 61 / 9 99-3 31DOEMENSIANER
GETRÄNKEFACHGROSSHANDEL Helga Reß, Phone +49/ 82 61 / 9 99-3 32
Anzeige englisch - NEU A4 –:0 11.03.2013 13:51 Uhr Seite 4

Merger and acquisition highlights
14
WWW.HAFFMANS.NLWWW.SUEDMO.DE
WWW.PENTAIRBEVERAGESYSTEMS.COM
YOUR PASSION FOR BEER IS OUR MOTIVATION!Beer Membrane FiltrationQuality Control Equipment CO2 SystemsMicrofiltrationProcess EngineeringProcess TechnologyProject ManagementValve TechnologyWater Treatment
Merger and acquisition highlights among the 40 largest brewing groups worldwide
Major M&A activity in 2012 started off with the acquisition of StarBev by the MolsonCoors Group expanding into Eastern Europe and giving it exposure to emerging markets. Integration of MolsonCoors UK unit and its newly acquired Central and Eastern European unit is ongoing.
Later in the year tension ran high when Heineken battled for control of Asia-Pacific Breweries, Singapore, with the owners of Beer Thai, who had made an unsolicited offer for APB. After a nailbiting couple of weeks Heineken emerged as the winner and took full control of APB.
The full acquisition of Grupo Modelo by ABI had not been com-pleted by the end of 2012 and had run into some regulatory
issues forcing ABI to make concessions in to the US anti-trust authority. We continue to report Grupo Modelo as a separate entity in the 2012 league table.
We have been able to obtain a consolidated production figure for the Kirin Group for the first time and therefore no longer include Brasil Kirin (formerly Schincariol) nor Lion in our table, of which Kirin owns a majority.
The elemination of 5 previous entries in the table makes room for new breweries: Krombacher of Germany, Beer Thai of Thailand, Habeco of Vietnam, Brau Holding International of Germany and SiPing Ginsberg Brewery.
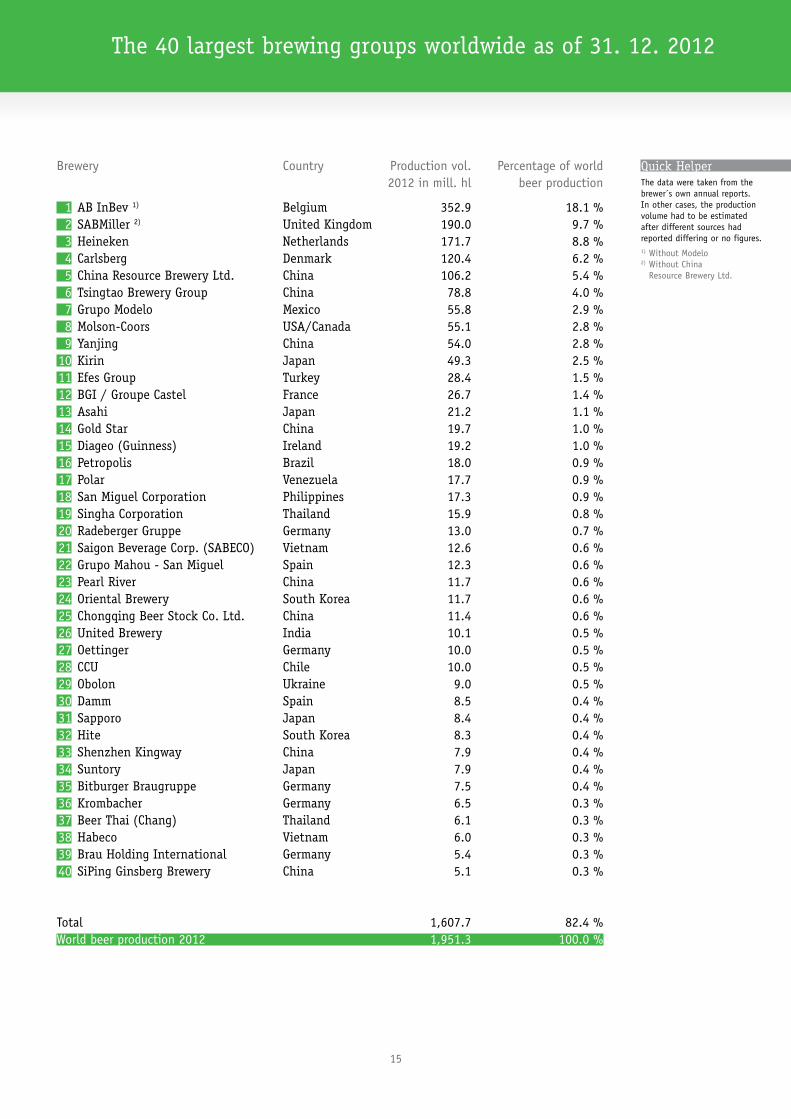
The 40 largest brewing groups worldwide as of 31. 12. 2012
Brewery Country Production vol. Percentage of world 2012 in mill. hl beer production
1 AB InBev 1) Belgium 352.9 18.1 % 2 SABMiller 2) United Kingdom 190.0 9.7 % 3 Heineken Netherlands 171.7 8.8 % 4 Carlsberg Denmark 120.4 6.2 % 5 China Resource Brewery Ltd. China 106.2 5.4 % 6 Tsingtao Brewery Group China 78.8 4.0 % 7 Grupo Modelo Mexico 55.8 2.9 % 8 Molson-Coors USA/Canada 55.1 2.8 % 9 Yanjing China 54.0 2.8 % 10 Kirin Japan 49.3 2.5 % 11 Efes Group Turkey 28.4 1.5 % 12 BGI / Groupe Castel France 26.7 1.4 % 13 Asahi Japan 21.2 1.1 % 14 Gold Star China 19.7 1.0 % 15 Diageo (Guinness) Ireland 19.2 1.0 % 16 Petropolis Brazil 18.0 0.9 % 17 Polar Venezuela 17.7 0.9 % 18 San Miguel Corporation Philippines 17.3 0.9 % 19 Singha Corporation Thailand 15.9 0.8 % 20 Radeberger Gruppe Germany 13.0 0.7 % 21 Saigon Beverage Corp. (SABECO) Vietnam 12.6 0.6 % 22 Grupo Mahou - San Miguel Spain 12.3 0.6 % 23 Pearl River China 11.7 0.6 % 24 Oriental Brewery South Korea 11.7 0.6 % 25 Chongqing Beer Stock Co. Ltd. China 11.4 0.6 % 26 United Brewery India 10.1 0.5 % 27 Oettinger Germany 10.0 0.5 % 28 CCU Chile 10.0 0.5 % 29 Obolon Ukraine 9.0 0.5 % 30 Damm Spain 8.5 0.4 % 31 Sapporo Japan 8.4 0.4 % 32 Hite South Korea 8.3 0.4 % 33 Shenzhen Kingway China 7.9 0.4 % 34 Suntory Japan 7.9 0.4 % 35 Bitburger Braugruppe Germany 7.5 0.4 % 36 Krombacher Germany 6.5 0.3 % 37 Beer Thai (Chang) Thailand 6.1 0.3 % 38 Habeco Vietnam 6.0 0.3 % 39 Brau Holding International Germany 5.4 0.3 % 40 SiPing Ginsberg Brewery China 5.1 0.3 % Total 1,607.7 82.4 % World beer production 2012 1,951.3 100.0 %
Quick Helper The data were taken from the brewer´s own annual reports. In other cases, the production volume had to be estimated after different sources had reported differing or no figures.1) Without Modelo 2) Without China Resource Brewery Ltd.
15

www.barthhaasgroup.com
Wir strive
More than
200 years of expertise.
experts worldwide.
610
FOR YOUR SUCCESS!
8generations.
Germain Hansmaennel
8 A rue du Maire Kuss • B.P. 48, 67068 Strasbourg, FrancePhone: +33-6-08 89 57 46 • Fax: +33-3-88 32 67 17 • E-Mail: [email protected]
www.barthhaasgroup.com


