Page 1
1
Economics 101
Fall 2016
Answers to Homework #2
Due Thursday, October 13, 2016
Directions: The homework will be collected in a box before the lecture.
Please place your name, TA name and section number on top of the homework (legibly). Make
sure you write your name as it appears on your ID so that you can receive the correct grade.
Late homework will not be accepted so make plans ahead of time.
Show your work. Good luck!
Please realize that you are essentially creating “your brand” when you submit this homework. Do
you want your homework to convey that you are competent, careful and professional? Or, do you
want to convey the image that you are careless, sloppy, and less than professional. For the rest of
your life you will be creating your brand: please think about what you are saying about yourself
when you do any work for someone else!
1. Demand Shifts
Consider the following scenarios and indicate the effects on demand. For each scenario, draw a graph,
show if there is a movement along the curve or a shift, and show the effect on the equilibrium price and
quantity.
a. Suppose the government announces in November that a tax increase of 3% on snow blowers will occur
during the month of December. What will happen to the demand for snow blowers during the month of
November?
Consumers will buy snow blowers in November, ahead of the 3% tax increase taking place in December.
The demand for snow blowers will increase, and the demand curve will shift right. The equilibrium price
and quantity of snowblowers in November will increase.
b. Assume that Top Ramen noodles are an inferior good. Consumer income rises in 2016. What are the
effects of an increase in consumer income on the demand for Top Ramen noodles in 2016?
Page 2
2
Recall that for inferior goods, an increase in income results in a decrease in demand of the good. Because
Top Ramen noodles are an inferior good, as consumer income rises, demand for the noodles will decrease
and the demand curve will shift left. The equilibrium price and quantity of Top Ramen noodles will
decrease.
c. A recent study claims that carrageenan, a key ingredient found in frozen yogurt, is linked to an
increased risk for cancer. How will this study impact the demand for frozen yogurt?
The new study will cause the demand for frozen yogurt to decrease, and the demand curve will shift left.
The equilibrium price and quantity of frozen yogurt will decrease.
d. You believe that ice cream is a tasty substitute for frozen yogurt. Given the information in part (c), how
will the demand for ice cream change?
Because ice cream is a substitute for frozen yogurt, people will buy less frozen yogurt and buy more ice
cream. The demand curve for ice cream will shift right. The equilibrium price of ice cream and the
equilibrium quantity of ice cream will increase.
Page 3
3
e. After the launch of driver-less taxis in Pittsburgh, a glitch in the technology caused several road
accidents. How will this impact the demand for driverless taxis? How will this impact the demand for
traditional taxis?
People will take fewer driver-less taxi rides at every price and therefore the demand for driver-less taxi
rides will decrease: the demand for driver-less taxis will shift to the left. Assuming traditional taxis are
considered a substitute for driverless taxis, demand for traditional taxis will increase and the demand
curve for traditional taxis will shift right. The equilibrium price of a taxi ride provided by a driver-less
taxi will fall while the equilibrium price of a traditional taxi ride will rise. The equilibrium quantity of
driver-less taxi rides will decrease while the equilibrium quantity of traditional taxi rides will increase.
f. Consider the market for college education. Suppose an influential economist announces that the value
of college education is now lower than a salaried position requiring only a high-school degree. How will
this new information affect the demand of college education?
The demand for college education will decrease, and the demand curve will shift left. One would expect
the equilibrium price of college to fall and the equilibrium quantity of college education to also decrease.
Page 4
4
2. Market Demand, Consumer Surplus, Producer Surplus
Consider the demand for widgets. The population of City A collectively has demand for widgets
expressed by the equation Q = 200 - 10P where Q is the quantity of widgets and P is the price. The
population of City B has a demand for widgets expressed by the equation Q = 200 - 40P.
a. Draw the demand curves of City A and City B on separate graphs. Label your intercepts, where the y-
intercept represents the price at which zero quantity is demanded.
Answer:
b. Draw the market demand curve of widgets for both City A and City B. Clearly label the kink point.
Give the equation of the market demand curve for each linear segment. In your equation, express quantity
as the dependent variable (that is, write your equation in x-intercept form).
The equation for the demand curve for P greater than or equal to 5 is Q = 200 - 10P. At P = 5, City B
begins to demand widgets as well, so the demand is Q = 400 - 50P for P less than or equal to 5.
Page 5
5
c. Suppose the supply curve for widgets is Q = 40P - 240. What is the equilibrium price and quantity of
widgets? Make sure you are using the market demand curve from part (b).
To answer this question, it is best to first graph the supply function. Transforming it into y-intercept form,
we have
Q = 40P - 240
Q + 240 = 40P
P = (1/40)Q + 6
We know that supply for prices less than 6 is 0. Therefore only City A buys widgets in equilibrium, so we
can use the equation for the top line of the graph:
40P - 240 = 200 – 10P
440 = 50P
P = $8.80 per widget
Q = (40)(8.8) - 240 = 112 widgets
The equilibrium price is $8.80 per widget and the equilibrium quantity is 112 widgets.
d. Calculate the value of producer and consumer surplus when this market is at its equilibrium. Show your
work.
Producer surplus is (1/2)(112 - 0)(8.80 - 6) = $156.8
Consumer surplus is (1/2)(112 - 0)(20 - 8.80) = $627.2
e. How much of the consumer surplus goes to the City B population when the widget market is in
equilibrium?
Only City A buys widgets in equilibrium, so City B gains no consumer surplus.
3. Price Ceilings and Price Floors
The supply and demand functions for apples is as follows:
Page 6
6
Market Demand: QD = 10 - 2P
Market Supply: QS = 3P - 9
a. Suppose the United States government imposes a price ceiling at $6. Is there a shortage or a surplus in
this market?
Given this information , the imposition of this price ceiling does not result in a shortage or a surplus.
First solve for the market equilibrium price and quantity:
10 - 2P = 3P - 9
19 = 5P
$3.80 per apple = P
Q = 10 - 2(3.80) = 2.40 apples
So the equilibrium price and equilibrium quantity are P = $3.80 per apple, Q = 2.40 apples
The price ceiling (a maximum price that can be charged) is set above the market price so it doesn’t
change the market equilibrium.
b. Now suppose the government lowers the price ceiling to $3.50 per apple. Describe the change in the
shortage or surplus.
With a price ceiling of $3.50 per apple, producers only supply 1.50 units of apples, and consumers
demand 3 units of apples. Therefore there is a shortage of 1.50 units of apples. This is an effective price
ceiling since the price ceiling is set below the equilibrium price.
c. Now suppose the government imposes a price ceiling or price floor that leaves a surplus of 4 units.
Given this information is this a price floor or a price ceiling? What government implemented price would
create this surplus?
It is a price floor. We must find the price at which a horizontal distance between quantity supplied and
quantity demanded is 4 units and where supply is greater than demand (since we are dealing with a
surplus).
Qs - Qd = 4
(3P - 9) – (10 - 2P) = 4
P = $4.60 per unit of apples
4. Joint PPF and trading range of prices
Pentos and Volantis are two cities that produce both swords (S) and daggers (D). The workers in Pentos
need 4 hours to make one sword and 2 hours to make one dagger. The workers in Volantis need 3 hours to
make either one sword or one dagger. Workers in both cities work 12 hours a day.
Page 7
7
a. Which city has a comparative advantage in producing swords? Which city has a comparative advantage
in producing daggers?
Whoever has a lower opportunity cost in producing swords has a comparative advantage in producing
swords. So in order to answer the question, we need to find the opportunity costs of producing swords for
both cities.
When using all of their time, the workers of Pentos could produce either 12/4 = 3 swords, or 12/2 = 6
daggers. So the opportunity cost of producing 3 swords is 6 daggers, and the opportunity cost of
producing 1 sword is 6/3 = 2 daggers.
The workers of Volantis could at most produce 12/3 = 4 swords, or 12/3 = 4 daggers. The opportunity
cost of producing 1 sword is 4/4 = 1 dagger.
Since Volantis has a lower opportunity cost in producing swords, it has a comparative advantage in
producing swords. This means that Pentos has a comparative advantage in producing the other good, i.e.
daggers. You could use similar calculations to validate the claim.
b. The two cities now engage in bilateral trade (that is, they trade with one another). Draw the joint PPF
graph. Put swords on the horizontal axis and daggers on the vertical axis. Label the coordinates of any
“kink points”.
To determine the shape of the joint PPF curve, you basically need three key information points: the
vertical intercept, the horizontal intercept, and the kink point(s). Now we have two cities with two
different opportunity costs for swords, so the joint PPF should be made up of two line segments, and one
kink point between them.
The vertical intercept represents the total amount of daggers the two cities could produce, when no
swords are being produced. You simply add the vertical intercepts from the two individual PPFs, and get
6+4 = 10 daggers.
The horizontal intercept represents the total amount of swords that the two cities could make, when no
daggers are being made. That number is 3+4 = 7 swords.
At the kink point, the city with a comparative advantage in making swords is only making swords, and
the city with a comparative advantage in making daggers is only making daggers. So Pentos is making 6
daggers and no swords, and Volantis is making 4 swords and no daggers. Therefore the kink point is (4,
6).
Together, the joint PPF looks like this:
Page 8
8
c. Find the slope-intercept form of each line segment that makes up the joint PPF curve.
You need to write down the equation for each of the two line segments.
The upper line segment passes through (0, 10) and (4, 6). The slope is (6-10) / (4-0) = -1, and the vertical
intercept is 10. So the slope-intercept form is Y = -X+10. Or, if we use S as our symbol for swords and D
as our symbol for daggers: D = 10 - S for 6 ≤ D ≤ 10.
The lower line segment passes through (4, 6) and (7, 0). The slope is (0-6) / (7-4) = -2. Plug in (7, 0) into
Y = -2X+b, we can solve for b = 14. So the slope intercept form is Y = -2X + 14. Or, using the same
symbols as before: D = 14 - 2S for 0 ≤ D ≤ 6.
Notice that the slope of the upper line segment comes from the opportunity cost of producing swords in
Volantis, and the slope of the lower line segment comes from the opportunity cost of swords in Pentos.
d. What is the trading range of prices for one sword? What is the trading range of prices for one dagger?
In your answer be careful to include the units of measurement.
The people of Pentos are willing to buy one sword, if its price is lower than its opportunity cost of
production in Pentos, which is 2 daggers (otherwise, they are better off making it themselves).
Similarly, the people of Volantis are willing to sell one sword, if its price is higher than its opportunity
cost of production in Volantis, which is 1 dagger (otherwise, the Volantenes are better off buying swords
instead of making them).
Hence the trading range of prices for one swords is between 1 dagger and 2 daggers. Notice that the range
is essentially between the opportunity costs of making one sword in the two cities.
Page 9
9
Similarly, the trading range of prices for one dagger is between the opportunity costs of making one
dagger in the two cities. In other words, it is between 1/2 sword and 1 sword.
e. The consumers in the two cities demand a total production of 3 swords and 7 daggers. Under this
scenario, which city is producing swords, and which city is producing daggers?
Refer to the following graph for the production arrangements along the joint PPF curve. Notice that the
city with comparative advantage in one good will be the first to make that good. If it still does not
produce enough of that good, then the other city joins in.
Page 10
10
Now, notice that the point (3, 7) lies on the upper segment of the joint PPF curve. The two cities need to
produce a lot of daggers, but not many swords. The city with a comparative advantage in daggers, Pentos,
will focus completely on producing daggers, while Volantis will do a little of both.
f. A third city, Braavos, now enters the market. The workers of Braavos could at most produce either 6
swords or 6 daggers in a day. Draw a new joint PPF curve for all three cities. How many kink points are
there?
Notice that the opportunity cost of producing one sword for Braavos is 6/6 = 1 dagger. This is the same as
for Volantis. Therefore, the individual PPF curves for Braavos and for Volantis have the same slope
(remember, absolute value of the slope = opportunity cost of the x-axis item).
This means that for the joint PPF of the three cities, we only have two different slopes (one for Pentos,
and one for Braavos and Volantis). Therefore, the joint PPF only has two line segments and one kink
point. Essentially, you have view Braavos and Volantis as one single nation with a comparative advantage
in making swords, while Pentos remains the city with a comparative advantage in daggers. Then the
single kink point happens when Pentos is making only daggers, while Braavos and Volantis are making
only swords. Pentos makes 6 daggers, while Braavos and Volantis make 4 + 6 = 10 swords.
The joint PPF looks like this:
g. What is the trading range of prices for one sword between all three cities?
Again, it might help if you consider Volantis and Braavos as one single nation, with the exact same
opportunity cost for sword. Then, the trading range of prices for one sword remains the same as before.
Page 11
11
5. International trade
The supply and demand curves for sushi rolls in Japan are:
Supply: P = 2Q + 100
Demand: P = 1000 - 4Q
The price is measured in Japanese Yens (¥), while the quantity is measure in the millions.
a. Under autarky (this term means that the market is closed to trade and that there is no international
trade), how many sushi rolls are produced in Japan? What is the price for one sushi roll?
To calculate the autarky equilibrium, simply set the supply equal to the demand. You will get 2Q + 100 =
1000 - 4Q, which means Q = 150 million. Plug in Q = 150 into either the supply or the demand equation,
and you could solve for P = ¥400.
The graph looks like this:
b. Suppose that Japan enters the international market for sushi, where one sushi roll costs ¥100. Given
this information, how many sushi rolls does Japan import? Find the consumer surplus (CS) and the
producer surplus (PS).
Page 12
12
As Japan enters the international market, it becomes a price taker for sushi rolls and has to accept ¥100
as its domestic price. Plug in P = ¥100 into the demand equation P = 1000 - 4Q. You get Q = 225, which
is the quantity demanded by Japanese consumers. Plug in P = ¥100 into the supply equation P = 2Q +
100, and you get Q = 0, which is the quantity supplied by Japanese producers. The difference between
them is the quantity imported, which is 225 million.
Notice that under the ¥100 price level, Japanese sushi producers simply stop producing. This industry is
completely eliminated by foreign competition. So producer surplus is zero: PS = 0. The consumer surplus
is the area of the grey triangle in graph: CS = (1000 - 100)*(225/2) = ¥101,250 million.
c. To protect its sushi industry, the Japanese government decides to impose a quota on imported sushi
rolls. Now Japanese consumers can at most buy 75 million foreign sushi rolls, and only through a
certified importer, Cheap Sushi Inc. Given this information, find the consumer surplus (CS) and producer
surplus (PS) again. What is the deadweight loss (DWL) resulting from the imposition of this quota?
After the quota is imposed, Japanese consumers can only import 75 million foreign sushi rolls. This
means that the domestic price for sushi rolls in Japan must rise, such that the difference between the
quantity demanded and the quantity supplied is reduced to 75 million.
Suppose that the domestic price is Pd. Solving for Q in the demand equation, we have quantity demanded
= (1000 – Pd)/4. Solving for Q in the supply equation, we have quantity supplied = (Pd - 100)/2. So the
difference 75 = (1000 – Pd)/4 - (Pd - 100)/2. And we could solve for Pd, which is ¥300. At a price of
Quantity demanded is (1000 – 300)/4 = 175, and quantity supplied by domestic suppliers is (300 – 100)/2
= 100. The difference between the quantity demanded domestically and the quantity supplied
domestically is the amount of the imports: in this case, the imports are 75 million.
Page 13
13
The consumer surplus is the area of the grey triangle in the graph: CS = (1000 – 300)*(175/2) = ¥61,250
million. The producer surplus is the area of the green triangle in the graph: PS = (300 – 100)*100/2 = ¥10000 million.
The area of the blue rectangle represents the profit of the importing company, Cheap Sushi Inc. The
company buys each sushi roll on the world market for ¥100, then sells it in the domestic market for ¥
300, earning ¥200 for each sushi roll imported. Together, it earns 200*75 = ¥15,000 million.
The deadweight loss is represented by the area of the two striped triangles in the graph. Together, these
areas are equal to the total deadweight loss (DWL). DWL = (300 - 100)*(100/2) + (300 - 100)*(50/2) =
¥15,000 million. You can check the answer by adding up all the surpluses, the license holder revenue
and deadweight loss together, which should equal to the total surplus when the market is open to trade
and before the quota is imposed of ¥101,250 million.
d. As the CEO of Cheap Sushi Inc., what is the maximum amount you are willing to pay for the legal
right to sell imported sushi rolls?
Cheap Sushi Inc. earns a profit of ¥15,000 million simply by moving sushi rolls from the international
market to Japan’s domestic market (assuming no transportation costs). Therefore, the company is willing
to pay up to ¥15,000 million for this privilege. If the import certificate costs exactly ¥15,000 million,
then the company is indifferent between importing and not importing.
e. Due to complaints from the World Trade Organization (WTO), the Japanese government decides to
drop the import quota, but subsequently imposes a tariff that leads to the same amount of imports as under
the previous quota. What is the amount of the tariff? What is the resulting deadweight loss?
Page 14
14
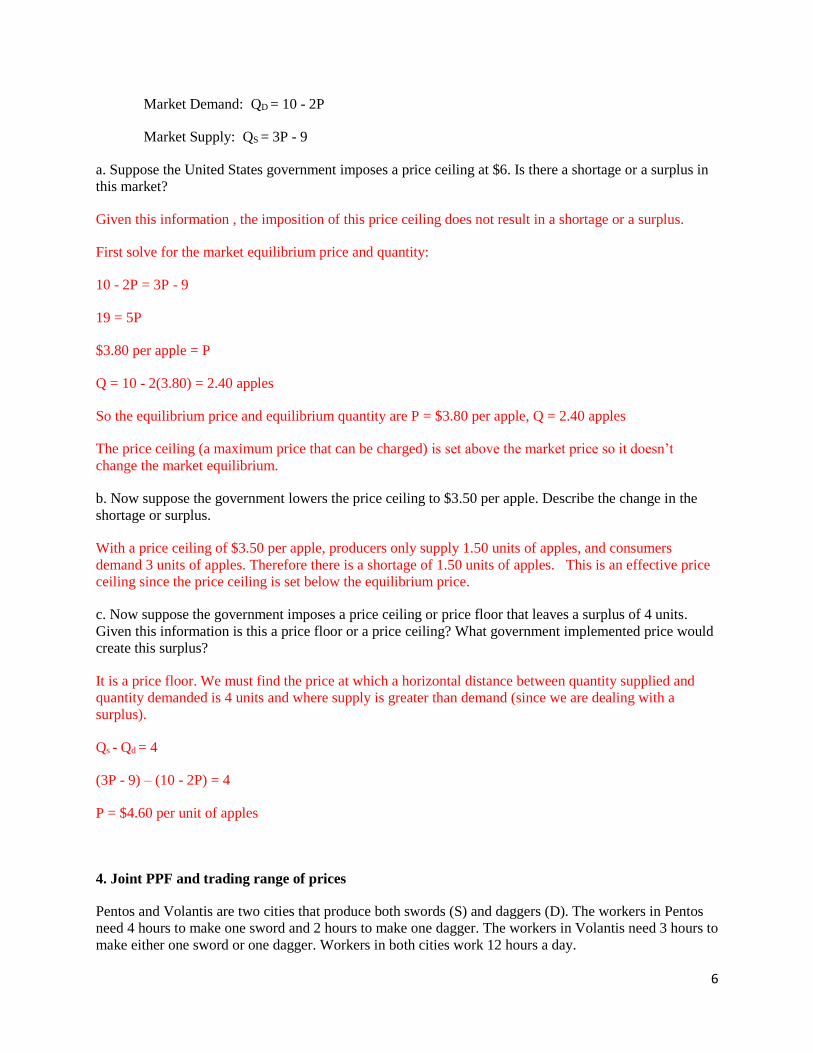
Again, the Japanese government wants to raise the domestic price to a level such that the difference
between the quantity demanded and the quantity supplied is 75 million. We know from the previous
question that the domestic price level needed is ¥300. So the government simply adds a ¥200 tariff to
the world price of ¥100. The area labeled "government revenue" is the area that represents the revenue
the government gets when it imposes an import tariff.
Notice that consumer and producer surpluses remain the same as they were with the import quota. The
only thing that changes from the quota scenario is that the importer’s profit is replaced by the
government’s revenue from the tariff. The deadweight loss remains ¥15,000 million, the same as before.
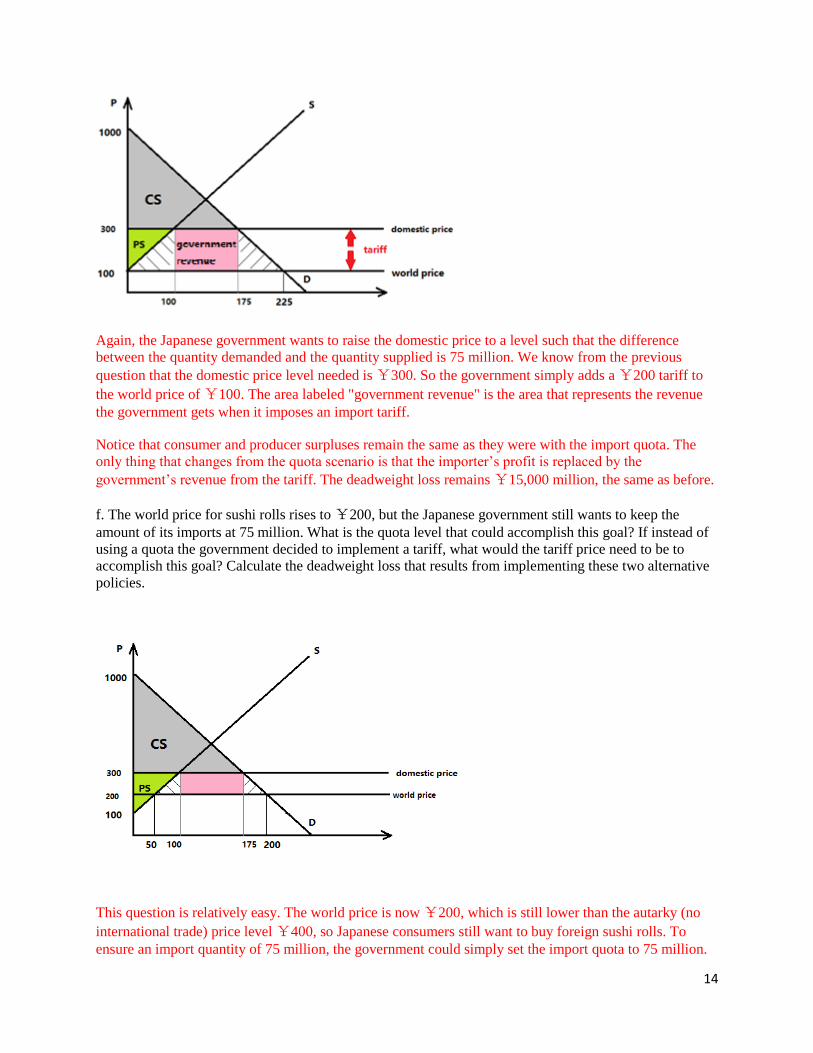
f. The world price for sushi rolls rises to ¥200, but the Japanese government still wants to keep the
amount of its imports at 75 million. What is the quota level that could accomplish this goal? If instead of
using a quota the government decided to implement a tariff, what would the tariff price need to be to
accomplish this goal? Calculate the deadweight loss that results from implementing these two alternative
policies.
This question is relatively easy. The world price is now ¥200, which is still lower than the autarky (no
international trade) price level ¥400, so Japanese consumers still want to buy foreign sushi rolls. To
ensure an import quantity of 75 million, the government could simply set the import quota to 75 million.
Page 15
15
Otherwise, it could charge a tariff of ¥100 per imported sushi roll, which is the difference between the
world price ¥200, and the domestic price ¥300 that leads to an excess demand and thus import of 75
million sushi rolls. The price with the tariff per sushi roll would need to be ¥300 which reflects a tariff of
¥100 per imported sushi roll.
The deadweight loss is represented by the striped areas. The total area is (300 – 200)*(100 - 50)/2 + (300-
200)*(200 - 175)/2 = ¥3,750 million.
g. Now, return to the scenario where world price equals ¥100. Find all the possible tariff levels that
maximize dead weight loss, then find all the possible tariff levels that minimize it.
To maximize dead weight loss, the Japanese government should forbid import altogether and return the
country to autarky. To accomplish that, the tariff should be sufficiently high, such that paying (world
price + tariff) is more expansive than just paying the autarky price. Any tariff higher or equal to 400 – 100
= ¥300 could fulfill this purpose.
To minimize dead weight loss, the Japanese government should allow free trade and set the domestic
price equal to the world price. The only tariff that could accomplish that is a tariff of zero.
h. Now, return to the scenario where world price equals ¥100. Find all the possible quota levels that
maximize the consumer surplus, then find all the possible quota levels that maximize the producer
surplus.
Consumer surplus is maximized under free trade, when consumers are allowed to freely purchase sushi
rolls at the cheap price of ¥100. Therefore, any quota that does not restrict free trade maximizes
consumer surplus. Under free trade, Japanese consumers want to import 225 million sushi rolls, so any
quota larger than 225 million is non-binding and thus maximizes consumer surplus.
Producer surplus is maximized under autarky, when domestic producers are shielded from foreign
competition and could sell at the high price of ¥400. To achieve autarky, the government must impose a
quota of zero. So only a quota of zero could maximize producer surplus. Notice that here is a conflict of
interest between Japanese consumers and Japanese producers.
i. (Challenging!) Find the tariff level that maximizes government revenue. What is the maximum revenue
the government can get from imposing a tariff in this market?
Government revenue = tariff * import quantity. Suppose that the amount of the tariff is T. The domestic
price is thus (100 + T). Plug this price into the supply and demand equations, and you could solve for the
quantity supplied and demanded.
Quantity supplied = T/2
Quantity demanded = (900 - T)/4
Page 16
16
The import quantity is thus (900 - T)/4 – T/2 = 225 – (3/4)T.
Government revenue = T*(225 – (3/4)T) = 225T – (3/4)T2. This is a quadratic function, and there are
several ways to find the T that maximizes it.
- You can find the derivative with regard to T and set it to zero:
225 – (3/2)T = 0. You then get T = 150.
- You can also draw a graph for the quadratic function.
Notice that the curve intersects the horizon axis at T = 0 and T = 300. It achieves its highest
value at the midpoint T = 150.
The government revenue when maximized can be calculated as:
Government Revenue = 225(150) - (3/4)(150)(150)
Government Revenue = 33,750 million - 16,875 million
Government Revenue = ¥16,875 million
6. Price support and price guarantee
During the Great Depression, cow farms in the U.S. were often forced to dump fresh milk into the rivers,
because the price for milk was too low for the farms to stay profitable. Theoretically, multiple
government policies could help dairy farmers in this situation by keeping milk prices high.
a. Suppose that the supply and demand for milk are given by the following equations where Q is the
quantity in units of milk and P is the price per unit of milk:
Supply of Milk: Q = (1/2)P – 3
Demand for Milk: Q = 27 - (1/3)P
What are the equilibrium price and quantity in the milk market without government intervention?
Illustrate your answer with a well labeled graph.
First, we rewrite the supply and demand equations in the price-intercept form:
Page 17
17
Supply: P = 2Q + 6
Demand: P = 81- 3Q
Set them equal to each other, and you get Q = 15 units of milk, P = $36 per unit of milk.
b. The government tries to raise milk prices using a price support program. It sets the price at $54 per unit
of milk, and commits to buy any leftover milk. Given this program, how much milk do consumers buy?
How much milk does the government buy? What is the cost of the program to the government?
Plug P = 54 into the demand curve and the supply curve respectively, you can get the quantity demanded
= 9 units of milk and quantity supplied = 24 units of milk. The excess supply is thus 24 – 9 = 15 units of
milk, which is purchased by the government under the price support program.
Therefore, consumers buy 9 units of milk, and the government buys 15 units of milk, at the price of $54
per unit of milk. The cost to the government is 15*54 = $810.
c. Now, suppose the government still wants to keep the price of milk at $54 per unit of milk, but instead
of implementing a price support program the government decides to enact a price guarantee program that
will subsidize the milk producers. Under this scenario, how much milk will consumers buy? What is the
cost of the program to the government? Illustrate your answer with a well labeled graph.
Under a price guarantee program, the producers receive a price of $54 per unit of milk and produce 24
units of milk. The consumers will buy at a discounted price, so that they are willing to buy all 24 units of
milk. The price differential is the government subsidy per gallon of milk.
For the consumers to be willing to buy 24 units of milk, the price they pay must be – 3*24 + 81 = $9 per
unit of milk. Therefore, for each unit of milk the government must pay a subsidy of 54 – 9 = $45 per unit
of milk. Since altogether 24 units of milk are produced and sold, the total cost to the government is 45*24
= $1,080.
Page 18
18
d. Given the market and the programs described in this problem answer the following questions and
provide a rationale for your answer to each question. Which program will the consumers prefer? Which
program will the producers prefer? Which program will the government prefer?
Under the price support program, consumers buy 9 units of milk at the price of $54 per unit. Under the
price guarantee program, they could buy a larger quantity (24 units) at a lower price ($9 per unit). So
consumers will prefer the price guarantee program.
The producers get to sell 24 units of milk at the price of $54 per unit under both programs, so they are
indifferent between the programs.
Finally, the government incurs a higher cost under the price guarantee program, so it prefers the price
support program.
e. Could you think of any reason for the government to prefer the price guarantee program?
Under the price support program, the government buys a large quantity of milk and thus has to pay a
storage cost. Furthermore, milk goes bad quickly, and it might be costly for the government to get rid of
sour milk. So there is a “hidden” cost associated with the price support program.