+ All Categories
Home > Documents > BEIJING Second Quarter 2017 Financial and …-+2Q17+ER.pdf3 Gross profit for the second quarter of...

BEIJING Second Quarter 2017 Financial and …-+2Q17+ER.pdf3 Gross profit for the second quarter of...

Date post: 13-Mar-2018
Category:
Upload: dothuan
View: 216 times
Download: 3 times
Share this document with a friend
13
1 China Online Education Group Announces Second Quarter 2017 Results Net revenues increased by 97.9% year-over-year Gross billings 1 increased by 81.9% year-over-year Net operating cash flow reached RMB53.1 million BEIJING, August 25, 2017 -- China Online Education Group (“51Talk” or the “Company”) (NYSE:COE), a leading online education platform in China, with core expertise in English education, today announced its unaudited financial results for the second quarter ended June 30, 2017. Second Quarter 2017 Financial and Operational Highlights Net revenues were RMB191.8 million (US$28.3 million), a 97.9% increase from RMB96.9 million for the second quarter of 2016. Gross billings were RMB355.1 million (US$52.4 million), an 81.9% increase from RMB195.2 million for the second quarter of 2016. Gross margin was 62.9%, compared with 64.9% for the second quarter of 2016. Percentage of gross billings contributed by K-12 students was 71.9%, compared with 49.3% for the second quarter of 2016. Net cash provided by operating activities reached RMB53.1 million (US$7.8 million). Key Operating Data For the three months ended June 30, June 30, Y-o-Y 2016 2017 Change Gross billings (in RMB millions) 195.2 355.1 81.9% Gross billings contributed by K-12 students (in RMB millions) 96.3 255.3 165.2% Active students 2 (in thousands) 86.6 152.3 76.0% Mr. Jack Jiajia Huang, Founder, Director and Chief Executive Officer of 51Talk, said, “We continued to see dynamic growth in gross billings, net revenues and number of active students in the second quarter of 2017. We also saw the number of foreign teachers on our platform exceed 1 Gross billings for a specific period, which is one of the Company’s key operating data, is defined as the total amount of cash received for the sale of course packages and services in such period, net of the total amount of refunds in such period. 2 An “active student” for a specified period refers to a student who booked at least one paid lesson, and excluding those students who only attended paid live broadcasting lessons or trial lessons.
Transcript

1

China Online Education Group Announces Second Quarter 2017 Results

Net revenues increased by 97.9% year-over-year

Gross billings1 increased by 81.9% year-over-year

Net operating cash flow reached RMB53.1 million

BEIJING, August 25, 2017 -- China Online Education Group (“51Talk” or the “Company”)

(NYSE:COE), a leading online education platform in China, with core expertise in English

education, today announced its unaudited financial results for the second quarter ended June 30,

2017.

Second Quarter 2017 Financial and Operational Highlights

Net revenues were RMB191.8 million (US$28.3 million), a 97.9% increase from RMB96.9

million for the second quarter of 2016.

Gross billings were RMB355.1 million (US$52.4 million), an 81.9% increase from

RMB195.2 million for the second quarter of 2016.

Gross margin was 62.9%, compared with 64.9% for the second quarter of 2016.

Percentage of gross billings contributed by K-12 students was 71.9%, compared with 49.3%

for the second quarter of 2016.

Net cash provided by operating activities reached RMB53.1 million (US$7.8 million).

Key Operating Data

For the three months ended

June 30, June 30, Y-o-Y

2016 2017 Change

Gross billings (in RMB millions) 195.2 355.1 81.9%

Gross billings contributed by K-12 students (in RMB millions) 96.3 255.3 165.2%

Active students2 (in thousands) 86.6 152.3 76.0%

Mr. Jack Jiajia Huang, Founder, Director and Chief Executive Officer of 51Talk, said, “We

continued to see dynamic growth in gross billings, net revenues and number of active students in

the second quarter of 2017. We also saw the number of foreign teachers on our platform exceed

1 Gross billings for a specific period, which is one of the Company’s key operating data, is defined as the total amount

of cash received for the sale of course packages and services in such period, net of the total amount of refunds in such

period. 2 An “active student” for a specified period refers to a student who booked at least one paid lesson, and excluding

those students who only attended paid live broadcasting lessons or trial lessons.

2

10,000 for the first time in the Company’s history, growing to approximately 12,6003 at the end of

the second quarter. ”

Mr. Huang continued, “Quality growth remains our key theme this year. Currently, over 95% of

our active students use our proprietary, next-generation technology, which delivers superior audio

and video quality with extremely low latency. By pairing this industry-leading technology with

our dynamic curriculum, toward the end of the second quarter, we were able to successfully pilot

an exciting new lesson format for K-12 students that allows small groups of students to

simultaneously study and interact with each other and a teacher. We call this our ‘small class’

offering. We believe the new small class offering can significantly widen our existing market

reach for K-12 students. This is an exciting and significant new addition to our product portfolio

alongside our one-on-one offerings.”

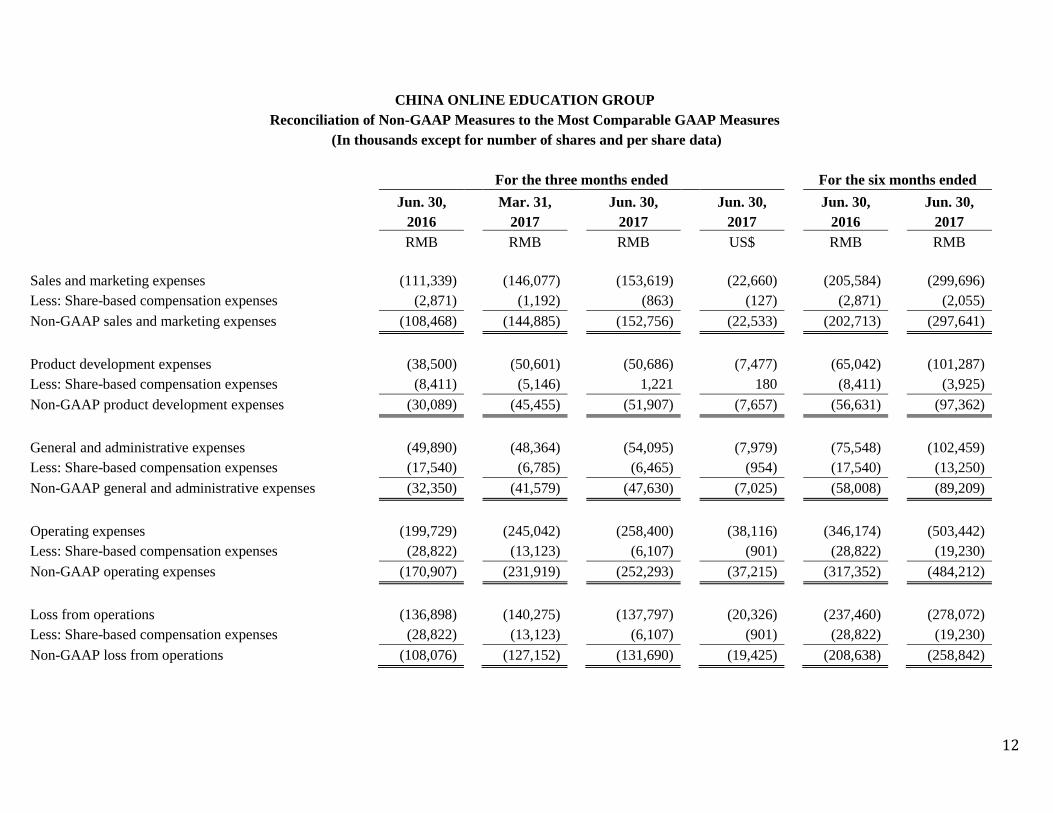
Mr. Jimmy Lai, Chief Financial Officer of 51Talk, added, “Alongside our higher-than-expected

revenue growth, our sales and marketing efficiency also continued to show improvement in the

second quarter of 2017. Non-GAAP4 sales and marketing expenses as a percentage of gross

billings fell to 43.0% from 55.6% in the same quarter last year. I am also very pleased to report

that net operating cash flow for the second quarter of 2017 reached a record high RMB53.1

million. As we look into the second half of 2017, we are optimistic about the rollout of our small

class offering as this bodes well for margin improvement, especially within our American

Academy program.”

Second Quarter 2017 Financial Results

Net Revenues

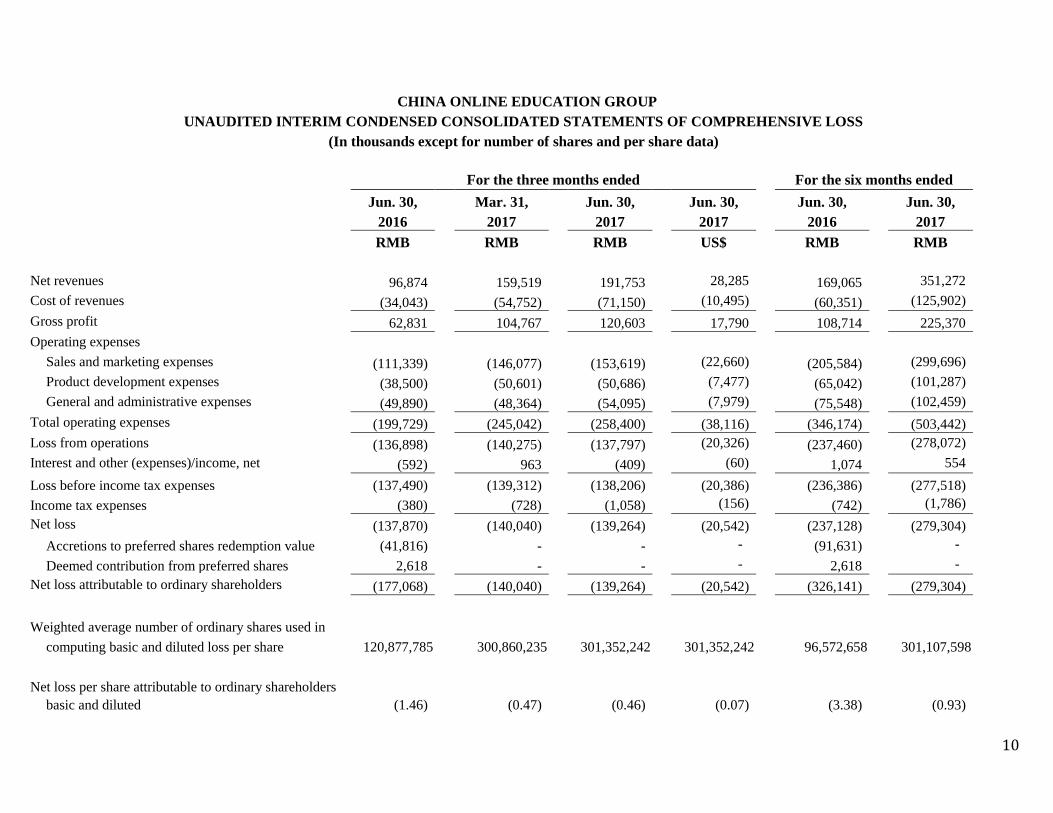
Net revenues for the second quarter of 2017 were RMB191.8 million (US$28.3 million), a 97.9%

increase from RMB96.9 million for the same quarter last year. The increase was primarily

attributed to an increase in the number of active students and, to a lesser extent, an increase in the

average revenue per active student. The number of active students was 152.3 thousand, a 76.0%

increase from 86.6 thousand for the same quarter last year.

Cost of Revenues

Cost of revenues for the second quarter of 2017 was RMB71.2 million (US$10.5 million), a 109.0%

increase from RMB34.0 million for the same quarter last year. The increase was primarily driven

by an increase in total service fees paid to teachers, due to the delivery of an increased number of

paid lessons as well as the increased cost per lesson with the expansion of western teachers.

Gross Profit and Gross Margin

3 The number of foreign teachers is defined as those who are qualified to deliver lessons on our platform as of the end

of the period, including both office-based and home-based foreign teachers. 4 Non-GAAP results exclude share-based compensation expenses. Explanation of the Company's non-GAAP financial

measures and related reconciliations to GAAP financial measures are included in the accompanying "Use of Non-

GAAP Financial Measures" and "Reconciliations of Non-GAAP Results of Operation Measures to the Comparable

GAAP Measures."

3

Gross profit for the second quarter of 2017 was RMB120.6 million (US$17.8 million), a 91.9%

increase from RMB62.8 million for the same quarter last year.

Gross margin for the second quarter of 2017 was 62.9%, compared with 64.9% for the same

quarter last year. The decrease was mainly attributable to the expansion of American Academy

program which has a lower gross profit margin.

Operating Expenses

Total operating expenses for the second quarter of 2017 were RMB258.4 million (US$38.1

million), a 29.4% increase from RMB199.7 million for the same quarter last year. The increase

was mainly the result of increases in sales and marketing, product development, and general and

administrative expenses.

Sales and marketing expenses for the second quarter of 2017 were RMB153.6 million (US$22.7

million), a 38.0% increase from RMB111.3 million for the same quarter last year. The increase

was mainly due to higher expenses related to an increase in the number of sales and marketing

personnel, as well as higher marketing and branding promotional expenses, partially offset by

lower recognized share-based compensation expenses. Excluding share-based compensation

expenses, non-GAAP sales and marketing expenses for the second quarter of 2017 were

RMB152.8 million (US$22.5 million), a 40.8% increase from RMB108.5 million for the same

quarter last year.

Product development expenses for the second quarter of 2017 were RMB50.7 million (US$7.5

million), a 31.7% increase from RMB38.5 million for the same quarter last year. The increase was

primarily the result of newly added technology and course development-related personnel to

further strengthen technology platforms and expand curriculum offerings, as well as technical

services fees, partially offset by a reversal of share-based compensation expenses recognized

related to unvested options upon departure of some technology-related personnel. Excluding share-

based compensation expenses, non-GAAP product development expenses for the second quarter of

2017 were RMB51.9 million (US$7.7 million), a 72.5% increase from RMB30.1 million for the

same quarter last year.

General and administrative expenses for the second quarter of 2017 were RMB54.1 million

(US$8.0 million), an 8.4% increase from RMB49.9 million for the same quarter last year. The

increase was primarily due to additional expenses for personnel necessary to support expanded

operations, as well as higher recruitment costs and costs related to compliance and reporting

obligations as a public company, partially offset by lower recognized share-based compensation

expenses. Excluding share-based compensation expenses, non-GAAP general and administrative

expenses for the second quarter of 2017 were RMB47.6 million (US$7.0 million), a 47.2%

increase from RMB32.4 million for the same quarter last year.

Loss from Operations

Loss from operations for the second quarter of 2017 was RMB137.8 million (US$20.3 million),

compared with RMB136.9 million for the same quarter last year.

4

Non-GAAP loss from operations for the second quarter of 2017 was RMB131.7 million (US$19.4

million), compared with RMB108.1 million for the same quarter last year.

Net Loss

Net loss for the second quarter of 2017 was RMB139.3 million (US$20.5 million), compared with

RMB137.9 million for the same quarter last year.

Non-GAAP net loss for the second quarter of 2017 was RMB133.2 million (US$19.6 million),

compared with RMB109.0 million for the same quarter last year.

Basic and diluted net loss per American depositary share (“ADS”) attributable to ordinary

shareholders for the second quarter of 2017 was RMB6.90 (US$1.05), compared with basic and

diluted net loss per ADS attributable to ordinary shareholders of RMB21.97 for the same quarter

last year. Each ADS represents 15 Class A ordinary shares.

Non-GAAP basic and diluted net loss per ADS attributable to ordinary shareholders for the second

quarter of 2017 was RMB6.60 (US$1.05), compared with non-GAAP basic and diluted net loss

per ADS attributable to ordinary shareholders of RMB18.40 for the same quarter last year.

Balance Sheet

As of June 30, 2017, the Company had total cash, cash equivalents and time deposits of

RMB701.5 million (US$103.5 million), compared with RMB647.0 million as of December 31,

2016.

The Company had deferred revenues (current and non-current) of RMB988.2 million (US$145.8

million) as of June 30, 2017, compared with RMB687.1 million as of December 31, 2016.

Outlook

For the third quarter of 2017, the Company currently expects:

- Net revenues to be between RMB220.0 million to RMB225.0 million, which would represent

an increase of approximately 82% to 86% from RMB121.0 million for the same quarter last

year; and

- Gross billings to be between RMB350.0 million to RMB360.0 million, which would represent

an increase of approximately 50% to 54% from RMB233.2 million for the same quarter last

year.

The above outlook is based on the current market conditions and reflects the Company’s current

and preliminary estimates of market and operating conditions and customer demand, which are all

subject to change.

Conference Call

The Company’s management will host an earnings conference call at 8:00 AM U.S. Eastern Time

on August 25, 2017 (8:00 PM Beijing/Hong Kong time on August 25, 2017).

5

Dial-in details for the earnings conference call are as follows:

United States (toll free): 1-888-346-8982

International: 1-412-902-4272

Hong Kong (toll free): 800-905-945

Hong Kong: 852-3018-4992

China: 400-120-1203

Participants should dial-in at least 5 minutes before the scheduled start time and ask to be

connected to the call for “China Online Education Group.”

Additionally, a live and archived webcast of the conference call will be available on the

Company’s investor relations website at http://ir.51talk.com.

A replay of the conference call will be accessible until September 1, 2017, by dialing the following

telephone numbers:

United States (toll free): 1-877-344-7529

International: 1-412-317-0088

Replay Access Code: 10111519

About China Online Education Group

China Online Education Group (NYSE: COE) is a leading online education platform in China,

with core expertise in English education. The Company’s mission is to make quality education

accessible and affordable. The Company’s online and mobile education platforms enable students

across China to take live one-on-one interactive English lessons with overseas foreign teachers, on

demand. The Company connects its students with a large pool of highly qualified foreign teachers

that it assembled using a shared economy approach, and employs student and teacher feedback and

data analytics to deliver a personalized learning experience to its students.

For more information, please visit http://ir.51talk.com.

Use of Non-GAAP Financial Measures

In evaluating its business, 51Talk considers and uses the following measures defined as non-

GAAP financial measures by the SEC as supplemental metrics to review and assess its operating

performance: non-GAAP sales and marketing expenses, non-GAAP product development

expenses, non-GAAP general and administrative expenses, non-GAAP operating expenses, non-

GAAP loss from operations, non-GAAP income tax expenses, non-GAAP net loss, non-GAAP net

loss attributable to ordinary shareholders, and non-GAAP net loss attributable to ordinary

shareholders per share and per ADS. To present each of these non-GAAP measures, the Company

excludes share-based compensation expenses. The presentation of these non-GAAP financial

measures is not intended to be considered in isolation or as a substitute for the financial

information prepared and presented in accordance with GAAP. For more information on these

non-GAAP financial measures, please see the table captioned “Reconciliations of non-GAAP

measures to the most comparable GAAP measures” set forth at the end of this press release.

6

51Talk believes that these non-GAAP financial measures provide meaningful supplemental

information regarding its performance by excluding share-based expenses that may not be

indicative of its operating performance from a cash perspective. 51Talk believes that both

management and investors benefit from these non-GAAP financial measures in assessing its

performance and when planning and forecasting future periods. These non-GAAP financial

measures also facilitate management’s internal comparisons to 51Talk’s historical performance.

51Talk computes its non-GAAP financial measures using the same consistent method from quarter

to quarter and from period to period. 51Talk believes these non-GAAP financial measures are

useful to investors in allowing for greater transparency with respect to supplemental information

used by management in its financial and operational decision-making. A limitation of using non-

GAAP measures is that these non-GAAP measures exclude share-based compensation expenses

that have been and will continue to be for the foreseeable future a significant recurring expense in

the 51Talk’s business. Management compensates for these limitations by providing specific

information regarding the GAAP amounts excluded from each non-GAAP measure. The

accompanying table at the end of this press release provides more details on the reconciliations

between GAAP financial measures that are most directly comparable to non-GAAP financial

measures.

Exchange Rate Information

This announcement contains translations of certain RMB amounts into U.S. dollars at a specified

rate solely for the convenience of the reader. Unless otherwise noted, all translations from RMB to

U.S. dollars are made at a rate of RMB6.7793 to US$1.00, the rate in effect as of June 30, 2017 as

certified for customs purposes by the Federal Reserve Bank of New York.

Safe Harbor Statement

This press release contains statements that may constitute “forward-looking” statements pursuant

to the “safe harbor” provisions of the U.S. Private Securities Litigation Reform Act of 1995. These

forward-looking statements can be identified by terminology such as “will”, “expects”,

“anticipates”, “aims”, “future”, “intends”, “plans”, “believes”, “estimates”, “likely to” and similar

statements. Among other things, 51Talk’s business outlook and quotations from management in

this announcement, as well as 51Talk’s strategic and operational plans, contain forward-looking

statements. 51Talk may also make written or oral forward-looking statements in its periodic

reports to the Securities and Exchange Commission (“SEC”), in its annual report to shareholders,

in press releases and other written materials and in oral statements made by its officers, directors

or employees to third parties. Statements that are not historical facts, including statements about

51Talk’s beliefs and expectations, are forward-looking statements. Forward-looking statements

involve inherent risks and uncertainties. A number of factors could cause actual results to differ

materially from those contained in any forward-looking statement, including but not limited to the

following: 51Talk’s goals and strategies; 51Talk’s expectations regarding demand for and market

acceptance of its brand and platform; 51Talk’s ability to retain and increase its student enrollment;

51Talk’s ability to offer new courses; 51Talk’s ability to engage, train and retain new teachers;

51Talk’s future business development, results of operations and financial condition; 51Talk’s

ability to maintain and improve infrastructure necessary to operate its education platform;

competition in the online education industry in China; the expected growth of, and trends in, the

markets for 51Talk’s course offerings in China; relevant government policies and regulations

7

relating to 51Talk’s corporate structure, business and industry; general economic and business

condition in China, the Philippines and elsewhere and assumptions underlying or related to any of

the foregoing. Further information regarding these and other risks is included in 51Talk’s filings

with the SEC. All information provided in this press release is as of the date of this press release,

and 51Talk does not undertake any obligation to update any forward-looking statement, except as

required under applicable law.

For investor and media inquiries, please contact:

China Online Education Group

Investor Relations

+86 (10) 5692-8909

[email protected]

The Piacente Group, Inc.

Brandi Piacente

+86 (10) 6535-0148

+1-212-481-2050

[email protected]

8

CHINA ONLINE EDUCATION GROUP

UNAUDITED INTERIM CONDENSED CONSOLIDATED BALANCE SHEETS

(In thousands)

As of

Dec. 31,

Jun. 30,

Jun. 30,

2016

2017

2017

RMB

RMB

US$

ASSETS

Current assets

Cash and cash equivalents

274,873

376,388

55,520

Time deposits

372,150

325,158

47,963

Prepaid expenses and other current assets

65,766

65,667

9,687

Total current assets

712,789

767,213

113,170

Non-current assets

Held to maturity

6,943

6,889

1,016

Property, plant and equipment, net

41,576

39,947

5,892

Intangible assets, net

4,629

5,703

841

Goodwill

4,223

4,223

623

Other non-current assets

5,367

7,083

1,045

Total non-current assets

62,738

63,845

9,417

Total assets

775,527

831,058

122,587

LIABILITIES

AND STOCKHOLDERS’ DEFICIT

Current liabilities

Deferred revenues

653,413

950,275

140,173

Accrued expenses and other current

liabilities

166,524

188,242

27,767

Taxes payable

18,923

23,163

3,417

Total current liabilities

838,860

1,161,680

171,357

Non-current liabilities

Deferred revenues

33,706

37,933

5,595

Deferred tax liabilities

226

175

26

Other non-current liabilities

1,918

2,082

307

Total non-current liabilities

35,850

40,190

5,928

Total liabilities

874,710

1,201,870

177,285

9

CHINA ONLINE EDUCATION GROUP

UNAUDITED INTERIM CONDENSED CONSOLIDATED BALANCE SHEETS

(In thousands)

As of

Dec. 31,

Jun. 30,

Jun. 30,

2016

2017

2017

RMB

RMB

US$

Total shareholders’ deficit

(99,183)

(370,812)

(54,698)

Total liabilities and shareholders’

deficit

775,527

831,058

122,587

10

CHINA ONLINE EDUCATION GROUP

UNAUDITED INTERIM CONDENSED CONSOLIDATED STATEMENTS OF COMPREHENSIVE LOSS

(In thousands except for number of shares and per share data)

For the three months ended

For the six months ended

Jun. 30,

Mar. 31,

Jun. 30,

Jun. 30,

Jun. 30,

Jun. 30,

2016

2017

2017

2017

2016

2017

RMB

RMB

RMB

US$

RMB

RMB

Net revenues 96,874

159,519

191,753

28,285 169,065

351,272

Cost of revenues (34,043)

(54,752)

(71,150)

(10,495) (60,351)

(125,902)

Gross profit 62,831

104,767

120,603 17,790 108,714 225,370

Operating expenses

Sales and marketing expenses (111,339)

(146,077)

(153,619)

(22,660) (205,584)

(299,696)

Product development expenses (38,500)

(50,601)

(50,686)

(7,477) (65,042)

(101,287)

General and administrative expenses (49,890)

(48,364)

(54,095)

(7,979) (75,548)

(102,459)

Total operating expenses (199,729)

(245,042)

(258,400)

(38,116)

(346,174)

(503,442)

Loss from operations (136,898)

(140,275)

(137,797)

(20,326) (237,460)

(278,072)

Interest and other (expenses)/income, net (592)

963

(409)

(60) 1,074

554

Loss before income tax expenses (137,490)

(139,312)

(138,206)

(20,386) (236,386) (277,518)

Income tax expenses (380)

(728)

(1,058)

(156) (742)

(1,786)

Net loss (137,870)

(140,040)

(139,264)

(20,542) (237,128) (279,304)

Accretions to preferred shares redemption value (41,816)

-

-

- (91,631)

-

Deemed contribution from preferred shares 2,618

-

-

- 2,618

-

Net loss attributable to ordinary shareholders (177,068)

(140,040)

(139,264)

(20,542)

(326,141)

(279,304)

Weighted average number of ordinary shares used in

computing basic and diluted loss per share 120,877,785

300,860,235

301,352,242

301,352,242 96,572,658 301,107,598

Net loss per share attributable to ordinary shareholders

basic and diluted (1.46)

(0.47)

(0.46)

(0.07)

(3.38)

(0.93)

11

CHINA ONLINE EDUCATION GROUP

UNAUDITED INTERIM CONDENSED CONSOLIDATED STATEMENTS OF COMPREHENSIVE LOSS

(In thousands except for number of shares and per share data)

For the three months ended

For the six months ended

Jun. 30,

Mar. 31,

Jun. 30,

Jun. 30,

Jun. 30,

Jun. 30,

2016

2017

2017

2017

2016

2017

RMB

RMB

RMB

US$

RMB

RMB

Net loss per ADS attributable to ordinary shareholders

basic and diluted (21.97)

(7.05)

(6.90)

(1.05)

(50.66)

(13.95)

Comprehensive loss:

Net loss (137,870)

(140,040)

(139,264)

(20,542)

(237,128)

(279,304)

Other comprehensive loss

Foreign currency translation adjustments 4,193

(6,011)

(6,064)

(894)

4,774

(12,075)

Total comprehensive loss (133,677)

(146,051)

(145,328)

(21,436)

(232,354)

(291,379)

Share-based compensation expenses are included in the operating expenses as follows:

Sales and marketing expenses (2,871)

(1,192)

(863)

(127)

(2,871)

(2,055)

Product development expenses (8,411)

(5,146)

1,221

180

(8,411)

(3,925)

General and administrative expenses (17,540)

(6,785)

(6,465)

(954)

(17,540)

(13,250)

12

CHINA ONLINE EDUCATION GROUP

Reconciliation of Non-GAAP Measures to the Most Comparable GAAP Measures

(In thousands except for number of shares and per share data)

For the three months ended

For the six months ended

Jun. 30,

Mar. 31,

Jun. 30,

Jun. 30,

Jun. 30,

Jun. 30,

2016

2017 2017

2017 2016 2017

RMB

RMB

RMB

US$

RMB

RMB

Sales and marketing expenses

(111,339)

(146,077)

(153,619)

(22,660)

(205,584)

(299,696)

Less: Share-based compensation expenses

(2,871)

(1,192)

(863)

(127)

(2,871)

(2,055)

Non-GAAP sales and marketing expenses

(108,468)

(144,885)

(152,756)

(22,533)

(202,713)

(297,641)

Product development expenses

(38,500)

(50,601)

(50,686)

(7,477)

(65,042)

(101,287)

Less: Share-based compensation expenses

(8,411)

(5,146)

1,221

180

(8,411)

(3,925)

Non-GAAP product development expenses

(30,089)

(45,455)

(51,907)

(7,657)

(56,631)

(97,362)

General and administrative expenses

(49,890)

(48,364)

(54,095)

(7,979)

(75,548)

(102,459)

Less: Share-based compensation expenses

(17,540)

(6,785)

(6,465)

(954)

(17,540)

(13,250)

Non-GAAP general and administrative expenses

(32,350)

(41,579)

(47,630)

(7,025)

(58,008)

(89,209)

Operating expenses

(199,729)

(245,042)

(258,400)

(38,116)

(346,174)

(503,442)

Less: Share-based compensation expenses

(28,822)

(13,123)

(6,107)

(901)

(28,822)

(19,230)

Non-GAAP operating expenses

(170,907)

(231,919)

(252,293)

(37,215)

(317,352)

(484,212)

Loss from operations

(136,898)

(140,275)

(137,797)

(20,326)

(237,460)

(278,072)

Less: Share-based compensation expenses

(28,822)

(13,123)

(6,107)

(901)

(28,822)

(19,230)

Non-GAAP loss from operations

(108,076)

(127,152)

(131,690)

(19,425)

(208,638)

(258,842)

13

CHINA ONLINE EDUCATION GROUP

Reconciliation of Non-GAAP Measures to the Most Comparable GAAP Measures

(In thousands except for number of shares and per share data)

For the three months ended

For the six months ended

Jun. 30,

Mar. 31,

Jun. 30,

Jun. 30,

Jun. 30,

Jun. 30,

2016

2017 2017

2017 2016 2017

RMB

RMB

RMB

US$

RMB

RMB

Income tax expenses (380)

(728)

(1,058)

(156)

(742)

(1,786)

Less: Tax impact of Share-based compensation expenses - - - - - -

Non-GAAP income tax expenses (380)

(728)

(1,058)

(156)

(742)

(1,786)

Net loss (137,870)

(140,040)

(139,264)

(20,542)

(237,128)

(279,304)

Less: Share-based compensation expenses (28,822)

(13,123)

(6,107)

(901)

(28,822)

(19,230)

Non-GAAP net loss (109,048)

(126,917)

(133,157)

(19,641)

(208,306)

(260,074)

Net loss attributable to ordinary shareholders (177,068)

(140,040)

(139,264)

(20,542)

(326,141)

(279,304)

Less: Share-based compensation expenses, net of tax (28,822)

(13,123)

(6,107)

(901)

(28,822)

(19,230)

Non-GAAP net loss attributable to ordinary shareholders (148,246)

(126,917)

(133,157)

(19,641)

(297,319)

(260,074)

Weighted average number of ordinary shares used in

computing basic and diluted loss per share 120,877,785

300,860,235

301,352,242

301,352,242

96,572,658

301,107,598

Non-GAAP net loss per share attributable to ordinary shareholders

basic and diluted (1.23)

(0.42)

(0.44)

(0.07)

(3.08)

(0.86)

Non-GAAP net loss per ADS attributable to ordinary shareholders

basic and diluted (18.40)

(6.30)

(6.60)

(1.05)

(46.18)

(12.90)


Recommended