AbstractThis paper is focused on the calibration and measurement of the geometric parameters of a bell proverthat serves as a standard of volume of gas flow. It also includes methods for monitoring the timestability of the bell prover: intra- and inter-laboratory comparison measurements, Shewhart analysisand planned evaluation of recalibration intervals.
The primary standard of gas flow - the bell prover- was established by the Slovak Institute of Metrology(SMU) during 1999 to 2002. The flow range of thisstandard is from 2 to 65 m3/h with an expandeduncertainty of 0.12 %[1,2]. This standard is listed inthe Calibration and Measurement Capability tablesof the BIPM (SK 13) [3].
2. Mathematic Model of a Bell Prover
The volumetric flow realized by a primarystandard bell prover is evaluated as follows [4]:
ρτ ρ τ
ρτ ρ τ
=
⋅ Δ ⋅= + + =
Δ ⋅Δ
⋅Δ ⋅
+ +Δ ⋅Δ
∑
c c a aVZ Vs
cn
j jj 1 3 -1a a
Vnc
[ . ]
h S VQ Q
K IV Q m h
(1)
MAPAN - Journal of Metrology Society of India, Vol. 26, No. 3, 2011; pp. 165-171ORIGINAL ARTICLE
where: hc is the length of the vertical displacement ofthe bell [m]; Sc, the cross-sectional area of the bell [m2];Va , the residual volume of air in the system [m3]; Δτ ,the time interval of measuring cycle [h]; ρc , the densityof discharged air [kg. m-3]; Δρa , the change in airdensity during the measuring cycle [kg. m-3]; QVn , thevolumetric flow through leaks [m3. h-1]; Kj , the pulsecoefficient [m3. imp-1]; and Ij, is the number of pulses[imp].
3. Calibration of the Bell Prover
Calibration includes the bell prover internalgeometric dimensions at 110 horizontal levels.Furthermore, instruments installed in the primarystandard were calibrated and their associateduncertainties were determined so they could beincluded in the uncertainty budget of Eq. (1).
3.1 Determination of Geometrical Parameters of the Bell
A special structure was manufactured forcentering of a measuring device placed inside theprimary standard frame and for attaching a measuring
Miroslava Benkova, Stefan Makovnik, Ivan Mikulecky and Vlastimil Zamecnik
166
measurements (position 9). The measurement wasperformed in an air-conditioned enclosure at(22 ± 0.1) °C. A video camera system was used tomonitor the measurements inside the bell and the videowas recorded in the control center. The measurementswere performed at fifty diameters in each of the 110horizontal planes resulting in 5 500 measurementpoints. The time interval of one cycle of measurementswas approximately 12 hours. Every cycle wasrepeated three times and data were recorded in thedatabase files [4].
The diameter was calculated according to thefollowing:
dij = 1099.99+12.0 a1,j,1-a2,j,i[mm] (2)
where: dj,j, is the measured internal diameter of thebell at an angle j, j on the height hj [mm]; a1,j,i , is thevalue given by the sensor No. 1 [mm]; a2,j,i , is the value
Fig. 1. Scheme of geometrical parameters bellmeasuring equipment
arm (Fig. 1, position 1). The platform of this structure(position 6), where the arm was clamped, wasequipped with a stepper motor (position 5) for 180°horizontal displacement. A photograph of theapparatus for the measurement of the geometricalparameters of the bell is shown in Fig. 2.
After preliminary tests, the contact method wasselected: digital micrometers with a communicationinterface (position 3), measuring range of 12 mm,resolution of 1 μm, and the possibility of remotetransmission of measured data were used. Unequalcircumferential separation of measuring points wasspecified based on the final bell manufacturing.Points separated by 50 mm distance were generallydesignated on the circumference of the inner casingbut 10 mm distance was used around the weld.Measurements in the horizontal plane were madeevery 10 mm over the 1100 mm working stroke. Avertical displacement was performed by belldisplacement, which was driven using a steppermotor for the vertical ruler movement (position 7).Location of the bell was taken using an optical ruler(position 8). Shifting in the vertical direction wascarried out when the micrometer tips were out ofcontact with the bell (to protect the tips againstabrasion). This was ensured by an assemblymechanism (position 4), that detached tips from thebell after the reading. The process of determininggeometrical parameters runs fully automatically andwas controlled from the control centre by a computerprogram designed specifically for these
Fig. 2. Apparatus for measurement of the geometricalparameters of the bell
S
aa
aa
21,j,i 1j ,i 1 j ,i
1,j,i 21, j ,i 1 1, j ,i 1, j ,i
6
rp
r r r
aa++
+
æ ö+- ÷ç ÷ç= × ÷ç ÷ç ÷+çè ø
1, j ,i 1, j ,i
1099.996
2= +-r a
Miroslava Benkova, Stefan Makovnik, Ivan Mikulecky and Vlastimil Zamecnik
168
Similarly, the area of the segment p2j,i is expressed inthe following equation:
is the given radius determined by the sensor No. 2 inthe plane j by measurement i.
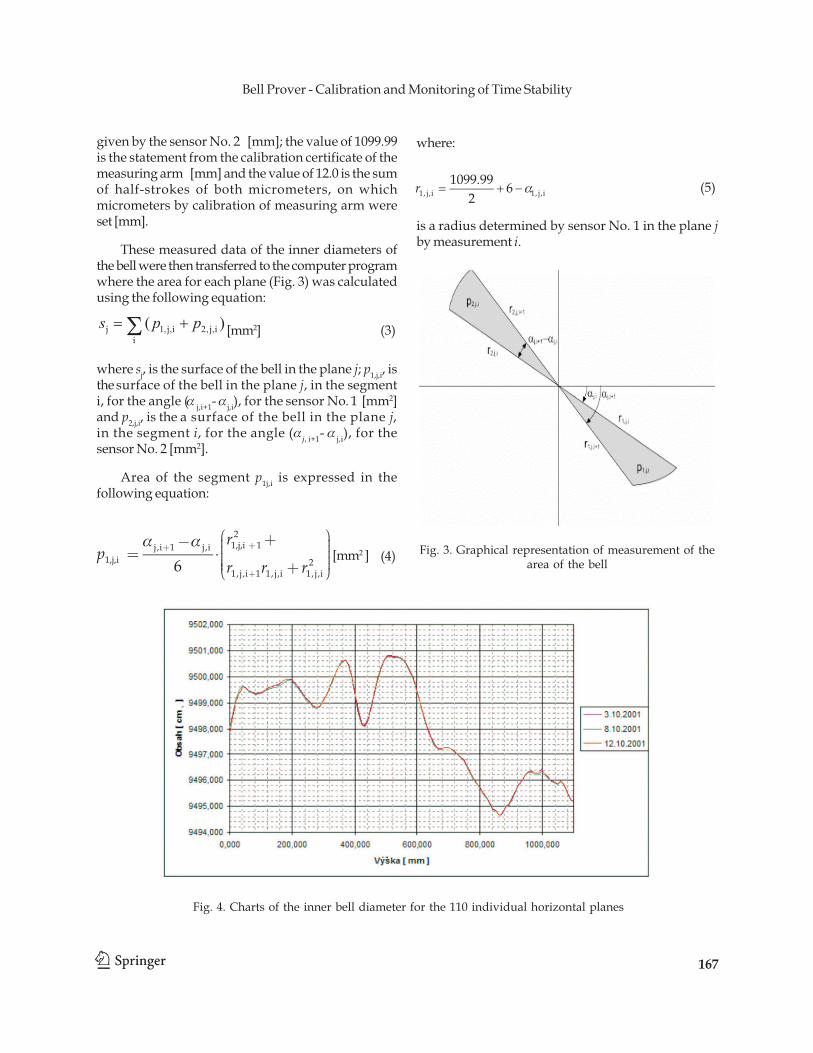
Areas of the bell in each of the cross sections werecalculated from the measured values and thecalculation entered into the database of the evaluationprogram of the bell prover. The set of calculated valuesof the inner diameter of the bell in the 110 horizontalplanes, measured on three occasions, is presented inFig. 4.
3.2 Sources of Uncertainty of Flow Measurement of the Bell Prover
4. Inter-laboratory Comparisons
The primary standard was bilaterally comparedwith the primary standard of PTB Braunschweig,Germany in 2002-2005[5]. The bell prover was declaredin 2007 as a national standard of gas flow in the SlovakRepublic [6].
The Euramet and CIPM Key comparisons ofnational (primary) standards of gas flow wereinitiated by the Slovak Institute of Metrology and theywere prepared with the co-operation of PTB for 2010-2011. The results of these comparisons will be usedby SMU for independently checking the bell provermain uncertainty contributions [7].
5. Time Stability Monitoring
Further it was necessary to have reliableinformation about the state of standard equipment inthe period between international comparisons.Therefore, the Centre of Flow of Slovak Institute ofMetrology developed a method for regularlymonitoring the bell prover measuring system timestability. The method is based on collecting a data setthat can be used for monitoring (intra-laboratorycomparisons, a set of control charts and plannedevaluation of recalibration intervals). Fixed points offlow - the critical nozzles - were used as a witnessstandard for the measuring range of flow, too.
5.1 Intra-Laboratory Comparisons
Eight intra-laboratory measurement comparisonswere performed during the years 2005 to 2009 betweenthe bell prover and the standard with the equivalentamount of liquid. The standard with the equivalentamount of liquid [2] is a part of the national standardof gas flow. Results of intra-laboratory comparisonsare given in the Fig. 5. Values of standardizeddeviation En did not exceed the value of |0,4|.
5.2 Shewhart Analysis
Shewhart regulatory diagrams [8] were chosenas a second tool for the bell prover time stabilitymonitoring. These diagrams are used for identificationof determinable causes of variability in themeasurement process during production. Themeasurements were provided by calibration of thecritical nozzles (witness standards) with the bellprover (Figs. 6-7).
Table 1Uncertainty budget of the bell prover
Source of uncertainty Relative standarduncertainty [%]
Collection volume 0.015 Bell area 0.007 Collection length 0.008 Oil film adherence 0.010Air density 0.030 Temperature 0.020 Pressure 0.010 Compressibility 0.020Collection time 0.040 Timer calibration 0.001 Timing error 0.040Residual volume 0.010Leakages 0.010Relative standard 0.058uncertainty of flowRelative expanded 0.116uncertainty of flow
169
Bell Prover - Calibration and Monitoring of Time Stability
The diagrams show the central line representingthe arithmetic mean of flow of the bell prover. Otherparallel lines to the central line are warning limits(2s) and control limits (3s), where s is the standarddeviation of measurement for a critical nozzle. Allpoints measured in 2005 - 2009 lie within the warninglimits and therefore the time stability of the bell proveris found to be statistically stable.
5.3 Planned Project of Recalibration IntervalsEvaluation
The Centre of Flow has launched a project forrecalibration interval determination for flowstandards. Special attention is paid to the gas flownational standard, and the 2001 measurement of thebell internal dimensions. Monitoring the time stability
Fig. 5. Normalized errors of intra-laboratory comparisons from 2005 to 2009 betweenthe bell prover and the standard with the equivalent volume of liquid
2005 2005 2006 2007 2007 2008 2008 2009
-1,00
-0,50
0,00
0,50
1,00
Norm
aliz
eder
rorE
n
Fig. 6. Regulatory diagram with critical nozzle JT 01-1000-99in the lower flow range (1 m3/h) -from year 2005 to 2009
Fig. 7. Regulatory diagram with critical nozzle 02-64000-99in the upper range of flow (64 m3/h) -from year 2005 to 2009
of the bell prover will continue. However, analysisand design of the recalibration interval will determinewhen it is necessary for the next measurement of the
geometrical parameters of the bell. The project is basedon the document OIML and NASA Guide [9, 10].
6. Results
Table 2Uncertainty budget of the bell prover
Monitoring tool Criteria Fulfill of criteria Note
Intra-laboratory comparison |En| <1 - 0.4 < En < 0.2 -Shewhart analysis xp - 3s < Q < xp + 3s xp - 2s < Q < xp + 2s -Recalibration intervals planned - project in year 2011
7. Conclusion
Previous periodic monitoring in 2005-2009exhibited that the standard maintained stabilitywithin specified limits. The methods described insections 4.1 and 4.2 consistently confirm the timestability of bell prover.
Acknowledgement
It is a pleasure to acknowledge the stimulatingdiscussions we have had with Roman Fira and PeterFarar (SMU).
References
[1] Š. Makovník and I. Mikulecký, Primárny etalónprietoku a prete eného objemu plynu SMU
(in slovak) (Primary Standard of Gas Flow ofSMU). Metrológia a skúšobníctvo, 9 (2004) 25 -34.
[2] Primary Standard of Flow and of DeliveredVolume of Gas, In: Centre of Flow of SMU,Bulletin for Euromet TC Flow Meeting,Bratislava, (2004). http://230.smu.sk/storage/r o o t / p d f / B u l l e t i n % 2 0 S l o v a k %20Institute%20of%20Metrology.pdf
[3] Calibration and Measurement Capabilities(CMC), Mass and Related Quantities - GasFlow, Slovakia, SMU. http://kcdb.bipm.org/a p p e n d i x C / c o u n t r y _ l i s t _ s e a r c h .asp?CountSelected=SK&sservice=M/FF.9.2
[4] S. Makovník, Národný etalón prietoku aprete eného objemu plynu: Súhrnná správa oetalóne. (in slovak) (National Standard of Gas