Problem SolvingIt’s not where you’re from; it’s where you’re going. It’s not whatyou drive; it’s what drives you. It’s not what’s on you; it’s what’sin you. It’s not what you think; it’s what you know.
GATORADE COMMERCIAL
The question really is, Do you know how to solve problems? If you arenot sure, we will help you right here, right now. As René Descartes said:“It is not enough to have a good mind. The main thing is to use it well.”How? We start this chapter by giving you a procedure that you can use tosolve any type of problem. Why?
Quite simply, students cannot solve word problems reliablybecause they are presented with inconsistent models of problemsolving that contradict the logical processes they have learned inother courses and in everyday life.*
Together, we can fix that!Our RSTUV procedure is based on a concept developed by George
Polya, a Hungarian mathematician and professor featured in this chap-ter’s Human Side of Math. Along with our procedure, we discuss animportant concept in problem solving: inductive reasoning.
The rest of the chapter is devoted to problem-solving techniques thatwill help you solve any problem: patterns (Section 1.1), estimations(Section 1.2), or a picture in the form of a graph (Section 1.3). Along theway, we will try to have some fun and remember two important ideas:
The value of a problem is not so much in coming up with theanswer as in the ideas and attempted ideas it forces on the would-be solver.
ISRAEL NATHAN HERSTEIN
Math is fun, and you can do it! IGNACIO BELLO
1
For links to Internet sites related to Chapter 1, please accesscollege.hmco.com/PIC/bello9eand click on the Online Study Center icon.
C H A P T E R
1
*Source: www.hawaii.edu/suremath/why1.html.
In leaner economic times, families areforced to adhere to more strict householdbudgets. Families must carefully allot theamount of money that they spend onnecessity and luxury items in order tolive within their means. Graphs are auseful tool for creating and analyzing abudget. In Section 1.3 you will learn howto interpret different types of graphs.
Knowledge of mathematics is power. As a student, mathematics gives you thepower to pursue many careers. As a citizen, it gives you the power to reachinformed decisions. As a nation, it gives us the power to compete in a technologi-cal world. Many students today are not prepared for the jobs of tomorrow or evenfor the jobs of today! In fact, three out of four Americans stop studying mathe-matics before completing career or job prerequisites. The mathematics you learntoday may have an impact on the job you get tomorrow. Over 75% of all jobsrequire proficiency in simple algebra and geometry, either as a prerequisite to entera training program or as part of an examination required to be licensed in a specificfield. In addition, earning a college degree requires taking at least a minimalamount of mathematics courses. Unfortunately, many students are burdened byunpleasant experiences in mathematics. They convince themselves that they can’tdo mathematics, so they won’t. They believe that they never liked mathematics, sothey don’t. Now it is time to change all that. This time try mathematics with anattitude—a positive one. The way to start is by learning how to solve problems. �
A. Problem-Solving ProcedureOne of the first problem-solving models was developed by George Polya, aHungarian-born mathematician and researcher. A problem-solving strategy isyour plan for action. First, you must choose your problem-solving strategy.What strategies did Polya recommend? Here are a few.
Look for a pattern. Make a table.Draw a picture or diagram. Use logical reasoning.Make a model. Work a simpler problem first.Use a formula. Make a list.
Polya’s original procedure as it appeared in How to Solve It (Princeton, NJ:Princeton University Press, 1973) consisted of four parts.
1. Understand the problem.
2. Devise a plan.
3. Carry out the plan.
4. Look back.
We expand this procedure so that you can use it as a model to solve any problem.Here are the five steps we shall use.
George Polyawas awarded a Ph.D. inmathematicswith a minor in physics in1912. Hismathematical output was broad andincluded papers in numbertheory, combinatorics, andvoting systems.
After a brief stay atBrown University in 1942.Polya moved to StandfordUniversity in 1942. Hepublished many articlesand books; however, hisbook How to Solve Itbecame a resoundingsuccess, selling more than1 million copies. The bookoutlined his famousproblem-solving strategy.
Polya also contributedgreatly in the classroom. Heregularly visited schoolsand inspired many studentsto pursue a career inmathematics.
GE
TT
I N G S T A R T ED
HUMAN SIDE OF MATH
Looking AheadIn this chapter we will look at theconcepts developed by GeorgePolya and use them to learn howto solve problems.
1.1
RSTUV Problem-Solving Procedure
1. Read the problem, not once or twice but until you understand it.
2. Select the unknown; that is, find out what the problem asks for.
3. Think of a plan to solve the problem.
4. Use the techniques you are studying to carry out the plan.
Look at the first letter in each sentence. To help you remember the steps, we callthem the RSTUV procedure.
Problem solving will be presented in a two-column format. Cover theanswers in the right column (a 3-by-5 index card will do), and write your ownanswers as you practice the problems. After you complete the problems, uncoverthe answers and check if your answers are correct. You will then be given asimilar example and its solution.
B. Inductive ReasoningAs we mentioned, one of the strategies used in problem solving is to find a pat-tern. Reasoning based on examining a variety of cases, discovering patterns, andforming conclusions is called inductive reasoning. For example, you want tomake sure that you have a good instructor in your next mathematics course. Youask several of your friends about different instructors. They all say that Profes-sor X is a good instructor. You conclude that Professor X is indeed a goodinstructor. This is an example of inductive reasoning, but it may be a hasty gen-eralization. Now consider this example: Suppose you become a doctor and oneof your patients comes to you and says,
It hurts when I press here (pressing his side).And when I press here (pressing his other side).
To further explore problemsolving, go to the Web sitecollege.hmco.com/PIC/bello9e,click on the Online Study Centericon, select Chapter 1 from thedrop-down menu, and then select“Web It” Links. Finally, selectChapter 1, and click on link1.1.1. Bookmark the OnlineStudy Center site for yourconvenience; you will need it toaccess all the “Web It” Links.
Hints and Tips
Our problem-solving procedure (RSTUV) contains five steps. The steps aregiven in the left column, and hints and tips in the right.
Mathematics is a language, so it is important to learn how to read it. If you donot understand or even get through reading the problem the first time, read itagain and pay attention to key words or instructions such as compute, draw,write, construct, make, show, identify, state, simplify, solve, and graph.
How can you answer a question if you do not understand the question and can-not determine the unknown? One good way to look for the unknown is to lookfor the question mark “?” and carefully read the preceding material. Try to deter-mine what information is given and what is missing from the problem.
Problem solving requires many skills and strategies. Some strategies are look fora pattern; examine a related problem; make tables, pictures, and diagrams;write an equation; work backward; and make a guess.
If you are studying a mathematical technique, use your knowledge about thetechnique to solve the given problem. Look for procedures that can be used tosolve each problem. Then carry out the plan and check each step.
Look back and check the result of the original problem. Is the answer reason-able? Can you find the answer some other way?
➊ Read the problem.
➋ Select the unknown.
➌ Think of a plan.
➍ Use the techniques you arestudying to carry out theplan.
And here (pressing his leg).And here, here, and here (pressing his other leg and both arms).
You examine the patient all over, trying to invoke your inductive powers. Whatcan you conclude? (The answer is on page 9.)
Inductive Reasoning
Inductive reasoning is the process of arriving at a general conclusion onthe basis of repeated observations of specific examples.
F I G U R E 1.1
F I G U R E 1. 2
Panel D consists of 1 � 4 � 9 � 16 � 30 squares, and panel E consists of 1 � 4 � 9 � 16 � 25 � 55 squares. The next square in the pattern (see Figure1.2) consists of 1 � 4 � 9 � 16 � 25 � 36 � 91 squares. An arrangement ofnumbers according to a pattern is called a sequence, and each number in thesequence is called a term. Thus, the sequence of the number of squares is 1, 5,14, 30, 55, and 91. Here, the first term is 1, the second term is 5, and so on.
EXAMPLE 1 � Identifying Patterns and Finding Terms
Identify the pattern in each sequence and find the next three terms.
(a) 1, 4, 7, 10, , , (b) 1, 2, 4, 8, , ,
SolutionThe strategy is to examine the difference between successive terms to discoverthe pattern.
(a) The difference between adjacent numbers is 3. Thus, the pattern is add 3.The next three terms are 10 � 3 � 13, 13 � 3 � 16, and 16 � 3 � 19.
(b) Each number after the first is 2 times the preceding number. The pattern ismultiply by 2, and the next three terms are 2 � 8 � 16, 2 � 16 � 32, and 2 � 32 � 64. �
EXAMPLE 2 � Identifying Patterns and Finding Terms
Identify the pattern in each sequence and find the next term.
(a) 4, 9, 3, 8, 2, (b) 1, 2, 8, 22, 47,
Look at panels A, B, and C of Figure 1.1. Panel A consists of 1 square. Panel Bconsists of 1 large square and 4 smaller squares. Panel C consists of 1 largesquare, 4 medium squares, and 9 smaller squares. How many squares are therein panels D and E? Draw the next figure in the pattern and write an expressionfor the total number of squares.
Thus, the term after 2 is 7 and the term after 7 is 1 .
Another way of looking at this pattern is to concentrate on the alternateterms, 4, 3, 2, and 9, 8, , as shown. The answer is the same!
�1 �1 �1
4 9 3 8 2
�1 �1
Moral: There may be more than one way to identify patterns!
(b) Examine the differences between successive terms.
17
??
Solution
(a) Examine the differences between successive terms.
4 9 3 8 2
� 5 � 6 � 5 � 6
1 2 8 22 47 Æ
�1 �6 �14 �25 Æ 39 1st differences
(no pattern!)�5 �8 �11 Æ 14 2nd differences
(no pattern!)3 3 3 3rd differences
ÆÆ
Æ
Now, follow the red arrows to get 3 � 11 � 14, 14 � 25 � 39, and 39 � 47 � . Do you see that there is a quicker way of doing this? Sim-ply add 3 � 11 � 25 � 47 and you get the . The technique here is toget the first differences, second differences, third differences, and so on,until you get a constant, and then add up the diagonal as shown. �
A Word of Warning: Some sequences follow more than one pattern. Thus, thenext three terms in the sequence
8686
1 2 4
�1 �2
are 7, 11, and 16 if the pattern is add 1, add 2, add 3, and so on. On the otherhand, if you view the sequence 1, 2, 4 as doubling the preceding number, the nextthree terms in the sequence are 8, 16, and 32! Sometimes it is necessary to exam-ine a large number of cases before realizing that the conjectured pattern does not
continue, as the next example shows. If there is just one case in which the con-jecture does not work, you have a counterexample and the conjecture is false.
EXAMPLE 3 � Predicting the Number of Regions
Choose points on a circle and connect them to form distinct, nonoverlappingregions as shown in Figure 1.3. Two points determine 2 � 21 regions, threepoints determine 4 � 2 � 2 � 22 regions, and four points determine a total of 8� 2 � 2 � 2 � 23 regions. These results are entered in the table. How manyregions would you predict for
(a) five points? (b) six points?
6 1 Problem Solving
F I G U R E 1. 3
Solution
(a) 16 � 2 � 2 � 2 � 2 � 24 regions, as shown in Figure 1.3.
(b) The formula predicts 25 � 32. However, if you choose six unequally spacedpoints on the circle and count the regions correctly, you get only 31 regions.How many regions do you get if the points are equally spaced? Try it!
�
What would happen for the seventh point? As it turns out, adding a seventh pointwould yield 57 regions. The pattern is
1, 2, 4, 8, 16, 31, 57
and the formula to find the number of regions is
How do we know that this is right? We can test it by substituting n � 2, n � 3,and so on. We can also use a grapher, as shown in the margin. However, we can-not be sure about a conjecture until a general formula or pattern is provedbecause just one counterexample can make the conjecture false. Unfortunately,we are not in a position to prove or disprove this formula because the result usescombinatorics, which will be discussed in Chapter 10. (See the Research Ques-tions at the end of this section for further information.) The next example illus-trates the use of inductive as well as deductive reasoning, the process of provinga conclusion from one or more general statements.
n4 � 6n3 � 23n2 � 18n � 2424
Number of Points
Number of Regions
2 3 4 5 6
2 � 21 4 � 22 8 � 23 16 � 24 ?
G R A P H I T
In order to find the number of regions using a grapher, let y1be the number of regions. Then go to and enter the formula
y1 �
using x’s instead of n’s, pressing the key to enterexponents, and insertingparentheses as shown. Nowpress TABLE, and thevalues for the number ofpoints and the correspondingnumber of regions appear asshown.
Since we have to make a conjecture relating the original number and the finalresult, let us look at the original numbers and the final results.
5 10 21 10015 30 63 300
Do you see the pattern? Using inductive reasoning, our conjecture is that thefinal result is three times the original number. But can we prove it? Let us go topart (b) and repeat the process using n as the original number.
(b) Select a number. nMultiply the number by 9. 9 � nAdd 6 to the product. 9n � 6
Divide the sum by 3. � 3n � 2
Subtract 2 from the quotient. 3n � 2 � 2 � 3n
The final result 3n is indeed three times the original number n; this proves ouroriginal conjecture. �
Here is one that will amaze your friends. Try it with your own age and theamount of change in your pocket and make a conjecture about what the finalresult means. For example, if your final result is 2015, what does that mean?
1. Take your age.2. Multiply it by 2.3. Add 5.4. Multiply this sum by 50.5. Subtract 365.
9n � 63 It gets a little tricky here.
You have to divide 9n by3 and get 3n and 6 by 3and get 2.
6. Add the amount of loose change in your pocket.(Must be less than $1!)
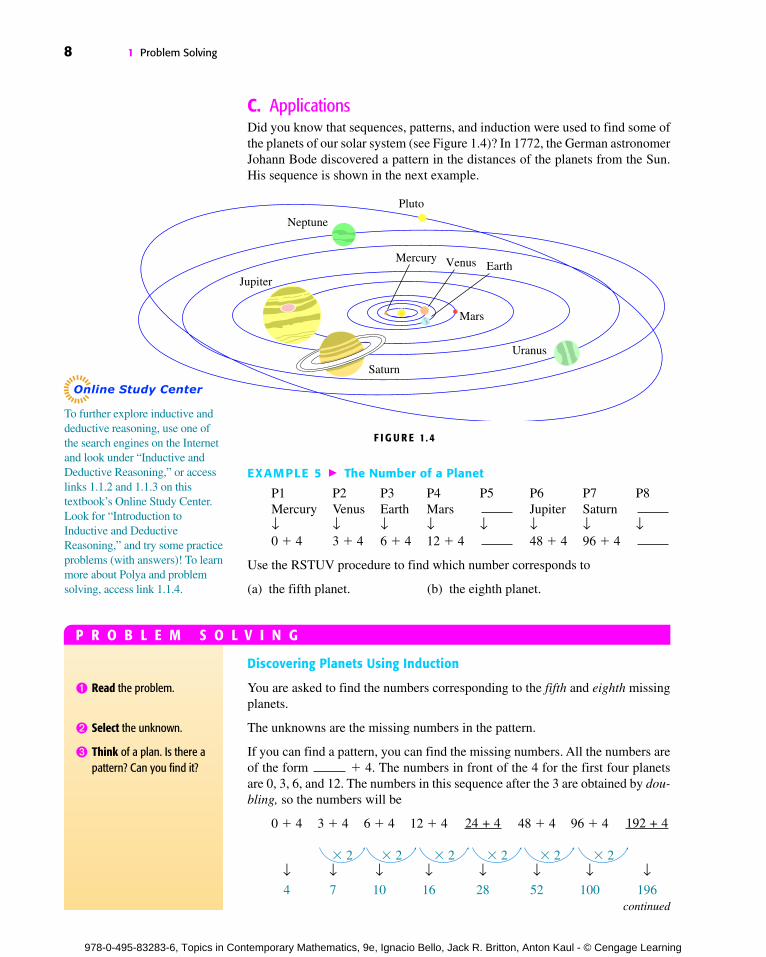
C. ApplicationsDid you know that sequences, patterns, and induction were used to find some ofthe planets of our solar system (see Figure 1.4)? In 1772, the German astronomerJohann Bode discovered a pattern in the distances of the planets from the Sun.His sequence is shown in the next example.
Use the RSTUV procedure to find which number corresponds to
(a) the fifth planet. (b) the eighth planet.
Discovering Planets Using Induction
You are asked to find the numbers corresponding to the fifth and eighth missingplanets.
The unknowns are the missing numbers in the pattern.
If you can find a pattern, you can find the missing numbers. All the numbers areof the form � 4. The numbers in front of the 4 for the first four planetsare 0, 3, 6, and 12. The numbers in this sequence after the 3 are obtained by dou-bling, so the numbers will be
➌ Think of a plan. Is there apattern? Can you find it?
P R O B L E M S O L V I N G
To further explore inductive anddeductive reasoning, use one ofthe search engines on the Internetand look under “Inductive andDeductive Reasoning,” or accesslinks 1.1.2 and 1.1.3 on thistextbook’s Online Study Center.Look for “Introduction toInductive and DeductiveReasoning,” and try some practiceproblems (with answers)! To learnmore about Polya and problemsolving, access link 1.1.4.
The numbers in this sequence—4, 7, 10, 16, and so on—are very importantbecause they correspond to 10 times the distance of the planets from the Sunmeasured in astronomical units, where 1 astronomical unit is the average dis-tance of the Earth from the Sun. �
What about the answer to the doctor question on page 4? There are many, buthere is one: The patient had a broken finger!
(a) The number for the fifth planet should be 2 � 12 � 4 � 28. (This “planet”is really Ceres, a planetoid or asteroid.)
(b) The number for the eighth planet is 2 � 96 � 4 � 196. (This corresponds toUranus, discovered by William Herschel in 1781.)
The differences between successive terms in the sequence follow the doublingpattern shown below.
4 7 10 16 28 52 100 196
3 3 6 12 24 48 96
Cover the solution, write your own solution, and then check your work.
➍ Use inductive reasoning tofind the pattern.
➎ Verify the solution.
A Problem-Solving Procedure
1. What are the four steps in Polya’s problem-solving procedure?
2. What do the letters in the RSTUV procedure standfor?
3. When solving a problem, what is the first thingyou should try to determine?
The first step in the RSTUV procedure is to Read theproblem: Read the following information and do prob-lems 4–10.
Many search engines or “Web crawlers” on the Inter-net or the World Wide Web (WWW) can help you findinformation. One such service is illustrated here.
E X E R C I S E S 1 . 1
Occasional
Light Use
Standard
Free
$1.95
$9.95
0
10
100
20 cents
15 cents
10 cents
Plan Monthly Fee Free Inquiries/Month Transaction Fee
WebQueryWebQuery is a research service that makes finding information easy and fast. You can searchWWW pages, online newspapers, magazines, press releases, medical and health information,several databases, and much more. To enroll, select one of our membership plans:
4. What is WebQuery? How many membershipplans are available for a customer?
5. If you are in the Occasional Plan and make 15transactions in a given month, what is your totalcost for the month?
6. If you are in the Light Use Plan and make 15 trans-actions in a given month, what is your total costfor the month?
7. On the basis of your answers to problems 5 and 6,if you are planning to make about 15 transactionsper month, which plan should you select?
8. What is the maximum number of calls you canmake in the Occasional Plan and come out spend-ing less than in the Light Use Plan?
9. After how many calls would it save you money tochange from a Light Use Plan to a Standard Plan?
10. If you expect to have 50 transactions in a month,which plan should you select?
B Inductive Reasoning
In problems 11–20, identify the pattern and find thenext three terms.
11. 1, 2, 4, 7, , ,
12. 2, 5, 10, 17, , ,
13. 1, 5, 1, 10, 1, 15, , ,
14. 3, 32, 34, 38, , ,
15.
16.
17. 1, , , , , ,
18. , , , , , , ,
19. 1, 5, 2, 6, 3, , ,
20. 6, 1, 9, 5, 12, 9, 15, , ,
21. The figures represent the triangular numbers.
110
17
112
19
114
18
14
12
a. Draw the next triangular number.b. Describe the pattern and list the next three tri-
angular numbers.c. What is the tenth triangular number?
22. The first 10 triangular numbers are
1 3 6 10 15 21 28 36 45 55
a. Find the difference between adjacent triangu-lar numbers. For example, 3 � 1 � 2 and 6 � 3 � 3. What numbers do you get?
b. Find the sum between adjacent triangle num-bers. For example, 1 � 3 � 4. What numbersdo you get?
c. Follow the pattern and find the sum of theninth and tenth triangular numbers.
d. Find the sum of the fourteenth and fifteenthtriangular numbers.
23. The fourth triangular number is 10 and the sum 1 � 2 � 3 � 4 � 10.a. What is the eighth triangular number?b. What is 1 � 2 � 3 � 4 � 5 � 6 � 7 � 8?c. What is the twelfth triangular number?d. What is 1 � 2 � 3 � . . . � 12?e. Make a conjecture regarding the nth triangular
number and the sum of the first n countingnumbers.
f. Carl Friedrich Gauss, a German mathemati-cian born in 1777, was confronted with a simi-lar problem when he was seven years old. Histeacher wanted Gauss to find the sum
1 � 2 � 3 � � � � � 99 � 100
Gauss noticed that 1 � 100 � 101, 2 � 99 �101, 3 � 98 � 101, . . . ; thus, you have 50pairs of numbers, each pair summing to 101.What is the result? Use the idea in parts (a)–(e).
24. The figures represent the square numbers.
a. Draw the next square number.b. Describe the pattern and list the next three
square numbers.c. What is the twelfth square number?
25. The numbers in problems 21 and 24 are examplesof figurate numbers. Another type of figuratenumber is the pentagonal number, shown below.
a. Draw the next pentagonal number.b. Describe the pattern.c. What is the sixth pentagonal number?
26. The figures below show the number of line seg-ments that can be drawn between two points andbetween three, four, and five noncollinear points.How many line segments can be drawn betweena. six noncollinear points?b. nine noncollinear points?
27. The figures below show all the diagonals that canbe drawn from one vertex of a quadrilateral (foursides), pentagon (five sides), hexagon (six sides),and heptagon (seven sides). How many diagonalscan be drawn from one vertex of a decagon (tensides)?
28. Follow this procedure.
Select a number.Add 7 to it.Multiply the sum by 3.Subtract 6 from the product.Divide by 3.Subtract 5 from the quotient.
a. Follow the procedure above for four differentnumbers and make a conjecture about the rela-tionship between the original number and thefinal result.
b. Represent the original number by n and provethe conjecture in part (a).
29. Follow this procedure.
Select a number.Add 7 to it.Multiply the sum by 3.Subtract 6 from the product.Divide by 3.Subtract the original number from the quotient.
a. Follow the procedure above for four differentnumbers and make a conjecture about the rela-tionship between the original number and thefinal result.
b. Represent the original number by n and provethe conjecture in part (a).
30. Follow this procedure.
Select a number.Add 5 to it.Multiply the sum by 4.Divide the product by 2.Subtract 10 from the quotient.
a. Follow the procedure above for four differentnumbers and make a conjecture about the rela-tionship between the original number and thefinal result.
b. Represent the original number by n and provethe conjecture in part (a).
31. Follow this procedure.
Select a number.Add 5 to it.Multiply the sum by 4.Divide the product by 2Subtract twice the original number from the
quotient.
a. Follow the procedure above for four differentnumbers and make a conjecture about the rela-tionship between the original number and thefinal result.
b. Represent the original number by n and provethe conjecture in part (a).
32. Pick a number and follow this pattern.1. If the number is even, divide by 2.2. If the number is odd, multiply by 3, then add 1.Whatever answer you get, follow rules 1 and 2again and proceed until you get a 1. For example,start with 13 for good luck. Here is the pattern.
a. Pick a different number and follow the pattern.What is the last number in the pattern?
b. Can you explain why this works?
34. Consider the pattern
a. What are the next three lines in this pattern?b. The pattern suggests that if you add the first
two odd numbers, you get 22; if you add thefirst three odd numbers, you get 32; and so on.What would the answer be if you added thefirst 10 odd numbers?
35. Consider the pattern
a. What are the next three lines in this pattern?b. What does this pattern suggest?
36. Consider the pattern
32 � 42 � 2
33 � 43 � 53 � 3
a. What do you think is the next line in thispattern?
b. Is the result you get in part (a) a true statement?
(1 � 2 � 3)2� 13 � 23 � 33
(1 � 2)2� 13 � 23
12� 13
1 � 3 � 5 � 7� 42
1 � 3 � 5� 32
1 � 3� 22
1� 12
C Applications
37. At the age of 19, Galileo Galilei, an Italianastronomer, mathematician, and physicist, madediscoveries that led to the invention of the pendu-lum clock. The following table lists the lengths ofa series of pendulums having different swingtimes. Find the pattern that relates the length of thependulum to the time of the swing.
38. There is a pattern relating length of foot and shoesize. For men, the pattern is
a. Fill in the table with the appropriate numbers.b. Matthew McGrory has an 18-in.-long foot. (He
is in the Guinness Book of Records.) Followthe pattern and find his shoe size.
39. The pattern relating foot length and shoe size forwomen is
a. Fill in the table with the appropriate numbers.b. Suppose a woman wears size 8 shoes. What is
the length of her foot?
40. According to the Health Insurance Association ofAmerica, the average daily room charge by U.S.hospitals is as shown in the following table:
a. Fill in the table with the appropriate numbers.b. What is the pattern?c. Do you think the pattern will continue after
41. Use a dictionary to find the definition of deductionand then explain in your own words the differencebetween inductive and deductive reasoning.
42. Explain in your own words the definition of theword problem.
43. Briefly describe an instance in which you usedinduction as a problem-solving strategy to solve aproblem.
Using Your Knowledge
Leonardo Fibonacci, an Italian mathematician, wrote abook dealing with arithmetic and algebra in which heproposed the following problem: A pair of rabbits 1month old is too young to produce more rabbits, but sup-pose that each month from its second month on, it pro-duces a new pair of rabbits. If each pair produces a pairof rabbits and none of the rabbits die, how many pairs ofrabbits will there be at the beginning of each month?
To further explore drawing, access link 1.1.5 on thistextbook’s Online Study Center.
The resulting sequence 1, 1, 2, 3, 5, and so on, in whichthe first two terms are 1s and each succeeding term isthe sum of the previous two terms, is called theFibonacci sequence. Use your knowledge of patternsto do the following problems.
44. Write the first 12 terms of the Fibonacci sequence.
45. Find the sum of the first five terms of thesequence. How does this sum compare with theseventh term of the sequence?
46. Find the sum of the first eight terms of thesequence. How does this sum compare with thetenth term of the sequence?
47. Use induction to predict the sum of the first 12terms.
Collaborative Learning
The Fibonacci numbers are related to the number ofpetals in certain flowers, the leaf arrangements in cer-tain plants, the number of spirals in pine cones, and thearrangement of seeds on flower heads.
1. Have each student select one of the examples listed,examine it, and report to the rest of the class on hisor her findings.
A bee colony consists of the queen �, worker bees(females who produce no eggs), and drone bees �(males who do no work). Male bees are produced bythe queen’s unfertilized eggs, so male bees have amother but no father! All the females are producedwhen the queen mates with a male, so females havetwo parents. The family tree of a female bee and thatof a male drone bee are shown in the figures.
2. Have one of the students in the class draw the nextgeneration for a male bee, starting with the familytree of a male bee shown in the diagram. Then haveanother student draw the next generation, and soon.
3. Count the number of bees in the first generation (1),the second generation (1), the third generation (2),and so on. Compare the numbers you get with theFibonacci numbers. What is your conclusion?
4. Here are the first 15 Fibonacci numbers.
1 1 2 3 5 8 13 21 34 5589 144 233 377 610
Note: Every third Fibonacci number
2, 8, 34, 144, 610
is a multiple of 2.
a. Have a member of the class examine all the mul-tiples of 3 in the list. Is there a similar conclusionregarding multiples of 3?
b. Have another member of the class examine allthe multiples of 5 in the list. What conclusioncan be reached regarding multiples of 5?
c. Have another member of the class examine allthe multiples of 8 in the list. What conclusioncan be reached regarding multiples of 8?On the basis of the observations made by the
members of the class, what could be a general ruleregarding the numbers in the Fibonacci sequenceand their multiplicity?
14 1 Problem Solving
Research Questions
1. The formula
used in Example 3 to obtain the number of regions into which the interior ofa circle is divided by a family of lines is discussed in the January 1988 issueof the Mathematics Teacher in an article entitled “Counting Pizza Piecesand Other Combinatorial Problems.” Describe the techniques the authorsused and how they arrived at the formula.
2. Galileo Galilei (mentioned in problem 37) is so well known that RiceUniversity devotes a complete Web page to his life. Access link 1.1.6 onthis textbook’s Online Study Center and answer the following questions:a. When and where was Galileo born?b. According to legend, the inspiration for the discovery of the pendulum
came to Galileo while in the Cathedral of Pisa. Describe the events andcircumstances that led to the discovery of the pendulum, and state the yearin which he made “his most notable discovery about the pendulum.”
c. Name one more invention made by Galileo.
3. Another famous Italian mathematician was Leonardo Fibonacci (seeCollaborative Learning).a. What was Fibonacci’s real name, where was he born, and where did he
die?b. Access link 1.1.7 on this textbook’s Online Study Center, and name
several instances in which the Fibonacci numbers appear in nature.
n4 � 6n3 � 23n2 � 18n � 2424
A model of Galileo’sescapement andpendulum made in 1883 following a designgiven by Galileo. Theinvention of thependulum is generallycredited to Galileo.
Have you attended a football game or other sporting event lately? How does theevent staff estimate attendance? Does it matter? Read on and see.
The Million Man March took place on Monday, October 16, 1995, alongthe Mall in Washington, D.C. The National Park Service announced that400,000 people took part in the event. The Nation of Islam, organizers ofthe march, vehemently objected, called it a gross underestimate of whatwas counted on-site to be a crowd 1.5 to 2 million strong, and threatenedto sue the National Park Service. (Source: www.eomonline.com/Common/Archives/February96/baz.htm.)
How was the controversy settled? Here are the problem-solving steps they used.
1. Ten color photographs of the crowd were collected.
2. The area of the mall in the photos was divided into square grids.
3. The crowd density was estimated on the basis of different degrees of packingin each square meter, ranging from six people per square meter to one personper five square meters.
4. The number of people per square meter was multiplied by the number ofsquare meters (grids), and an estimate of 878,587 was reached, with an esti-mated error margin of 25% (about 219,647).
5. Therefore, the Million Man March had between 658,940 and 1,098,234 par-ticipants. Why?
Here are some more facts that would result in a better estimate. At what timewere the photos taken (peak attendance was between 12 and 2 P.M.)? Some areaswere more densely populated (six people per square meter) than others (one per-son per 10 square meters). What was the exact area of the mall? To see theanswers to some of these questions and a revised crowd estimate, read the arti-cle cited in the photo credits at the end of this book. �
1.2G
ET
T
I N G S T A R T ED
The crowd at the Million ManMarch and estimates of thenumber of persons in severaldifferent areas.
A. EstimationAs you can see from Getting Started, an important step in solving problems is tobe able to estimate to make sure the answer you arrive at makes sense. One wayto estimate, or approximate, an answer is to use round numbers. For example,suppose you want to buy 2 soft drinks (at $.99 each) and 2 bags of popcorn at$1.75 each. To estimate the cost of the items, you can round like this.
$.99 Æ $1 So the drinks are about 2 � $1 � $2.$1.75 Æ $2 So the popcorn is about 2 � $2 � $4.Your total purchase is about $6.
Some people prefer to write the procedure using the symbol � to indicate anapproximation. Thus, we can also write
$.99 cents � $1 So the drinks are about $2.$1.75 � $2 So the popcorn is about $4.The total purchase is still about $6.
Below is the procedure we use to round off numbers (left) with a worked outexample on the right.
16 1 Problem Solving
EXAMPLE 1 � Estimating the Amount of a Purchase
A student bought perfume for $7.99, nail enamel for $2.29, candy for $3.79,adhesive paper for $1.89, a curling iron for $8.69, and sunglasses for $7.19. Finda reasonable estimate of the total amount spent.
SolutionIf we round each of the amounts to the nearest dollar, we have
Your grapher can round num-bers for you; however, youhave to know how to tell itwhat to do. Suppose you want to round the answer$31.84 of Example 1 to thenearest dollar. Tell the grapheryou want to do math with anumber by pressing
2. Enter the 31.84 and tell the grapher you wantno decimals by entering a 0.Press . You get 32!(See below.)
ENTER
,➤
MATH
Rule for Rounding Numbers
Rule
1. Underline the place to whichyou are rounding.
2. If the first number to the right ofthe underlined place is 5 ormore, add one to the underlinednumber. Otherwise, do notchange the underlined number.
3. Change all the numbers to theright of the underlined numberto zeros.
Example:Round 258.34 to the nearest hundred.
1. Underline the 2: 258.34.
2. The first number to the right of 2is 5, so we add 1 to the under-lined digit 2 to get 3.
3. Change all the digits to the rightof 3 to zeros, obtaining 300.00or 300. Note that if you count byhundreds (100, 200, and so on),258.34 is closer to 300 than to200. The procedure is written as
Since 8 � 2 � 4 � 2 � 9 � 7 � 32, a reasonable estimate for the total amountspent is $32. �
Note that in Example 1 we could have decided to round to the nearest dime,obtaining $8 � $2.30 � $3.80 � $1.90 � $8.70 � $7.20, or $31.90. This is abetter estimate because the true cost is $31.84. However, estimates are not sup-posed to give exact answers but rather tell us if the answers we are getting arereasonable. Next, we look at a specialized type of rounding: electric meters.
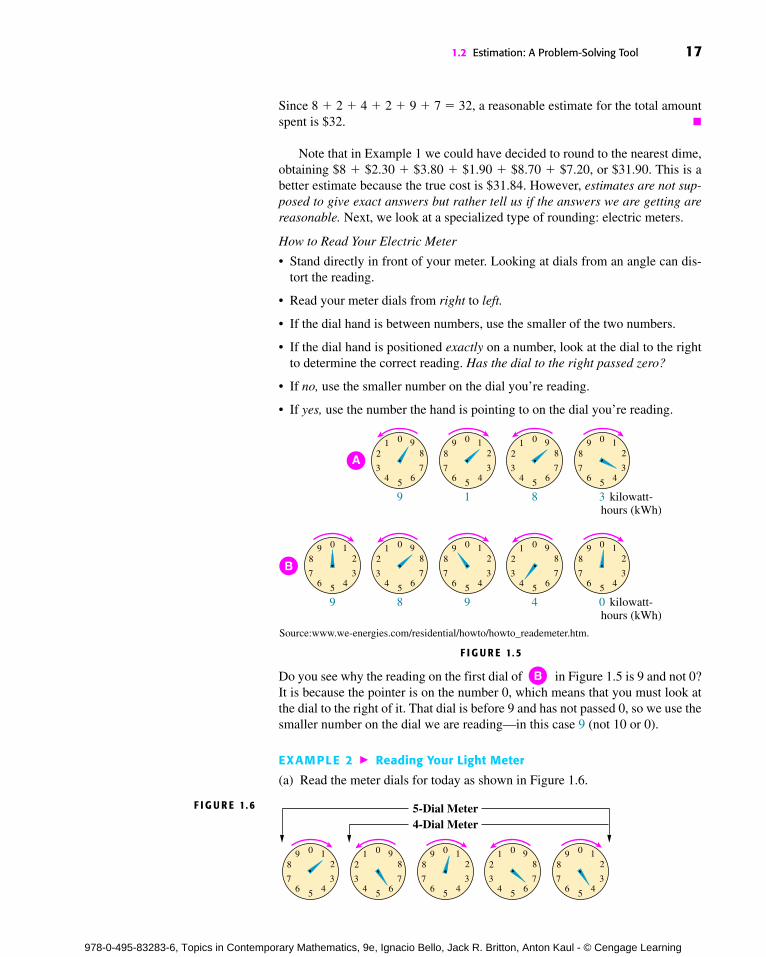
How to Read Your Electric Meter
• Stand directly in front of your meter. Looking at dials from an angle can dis-tort the reading.
• Read your meter dials from right to left.
• If the dial hand is between numbers, use the smaller of the two numbers.
• If the dial hand is positioned exactly on a number, look at the dial to the rightto determine the correct reading. Has the dial to the right passed zero?
• If no, use the smaller number on the dial you’re reading.
• If yes, use the number the hand is pointing to on the dial you’re reading.
Do you see why the reading on the first dial of in Figure 1.5 is 9 and not 0?It is because the pointer is on the number 0, which means that you must look atthe dial to the right of it. That dial is before 9 and has not passed 0, so we use thesmaller number on the dial we are reading—in this case 9 (not 10 or 0).
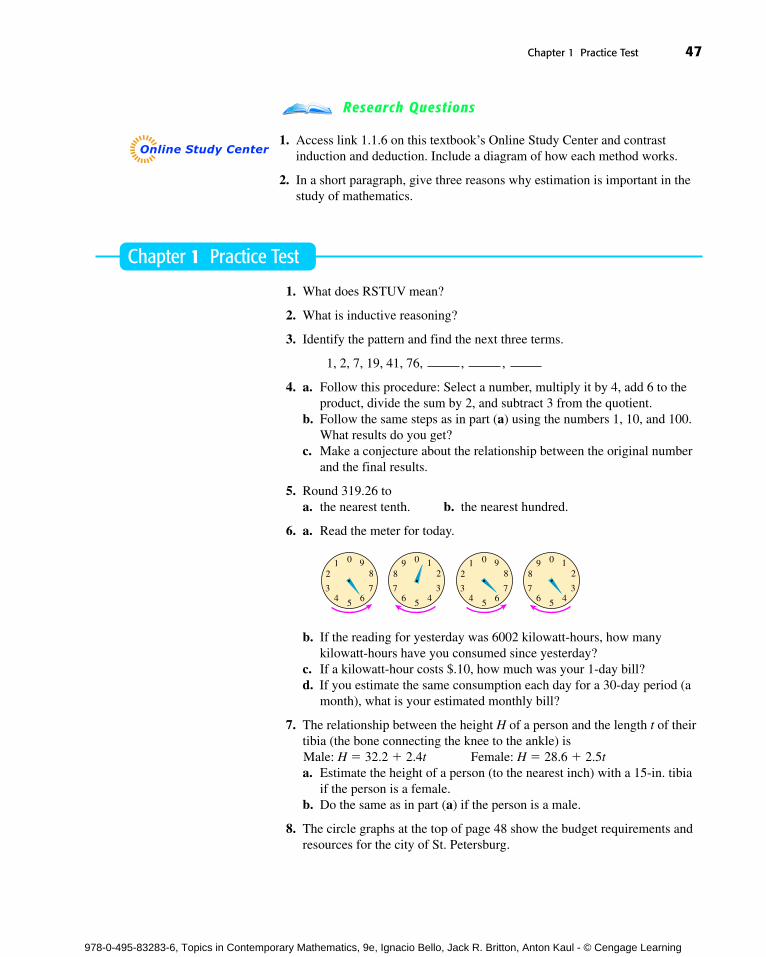
EXAMPLE 2 � Reading Your Light Meter
(a) Read the meter dials for today as shown in Figure 1.6.
(b) If the reading yesterday was 16,003 kWh, how many kilowatt-hours havebeen consumed since yesterday?
(c) If a kilowatt-hour costs $.08, how much is your 1-day bill?
(d) If you estimate the same consumption each day for a 30-day period, what isyour estimated monthly electricity bill?
Solution
(a) The reading is 1 6 0 6 4.
(b) The reading today is 1 6 0 6 4, and yesterday it was 1 6 0 0 3, so we haveconsumed 16,064 � 16,003 � 61 kWh.
(c) Your 1-day bill is 0.08 � 61 � $4.88.
(d) For 30 days it would be 30 � 4.88 � $146.40 because your 1-day bill is$4.88. �
One of the most important estimations you can make is the estimation of yourtaxes. This estimation depends on your earnings and marital status. Let us useour problem-solving procedure to see how it works.
EXAMPLE 3 � Estimating Taxable Income
Suppose you are single and estimate that the taxable income on line 5 of your taxreturn is $30,000. How much would you estimate your taxes to be?
SolutionWe are going to use our problem-solving procedure to find the answer.
18 1 Problem Solving
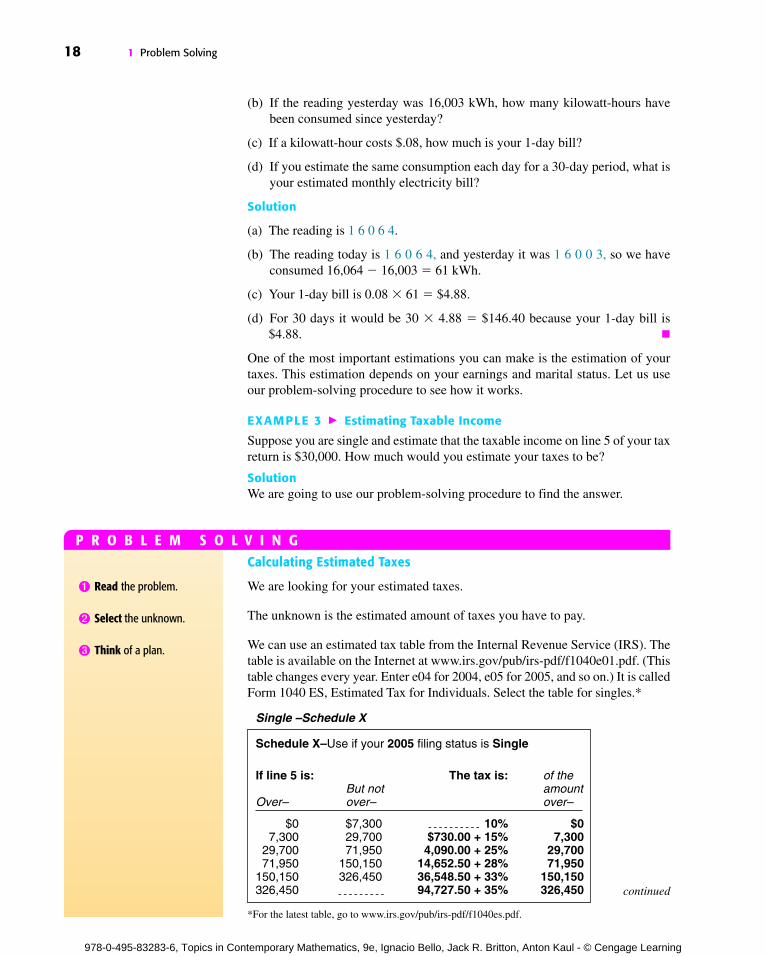
Calculating Estimated Taxes
We are looking for your estimated taxes.
The unknown is the estimated amount of taxes you have to pay.
We can use an estimated tax table from the Internal Revenue Service (IRS). Thetable is available on the Internet at www.irs.gov/pub/irs-pdf/f1040e01.pdf. (Thistable changes every year. Enter e04 for 2004, e05 for 2005, and so on.) It is calledForm 1040 ES, Estimated Tax for Individuals. Select the table for singles.*
➊ Read the problem.
➋ Select the unknown.
➌ Think of a plan.
P R O B L E M S O L V I N G
continued
*For the latest table, go to www.irs.gov/pub/irs-pdf/f1040es.pdf.
Schedule X–Use if your 2005 filing status is Single
Can you estimate the height of a person with only a bone as a clue? Anthropo-logical detectives do! Suppose a detective finds a 17.9-in. femur bone (that is theone connecting the hip bone to the knee bone) from a male. To find the height Hof its owner, use the formula H � 1.88f � 32, where f is the length of the femurbone. If the bone is 17.9 in. long, the owner’s height H (to the nearest inch) musthave been H � 1.88(17.9) � 32 � 66 in. (� means “approximately equal to”).
EXAMPLE 4 � Estimating Height from Femur Length
A detective found a 17.9-in. femur bone. He is looking for a missing female 66 in. tall. The formula indicating the relationship between the femur of a femaleand her height is H � 1.94f � 28.
(a) Determine if the femur could belong to the missing female.
(b) Estimate a person’s height (to the nearest inch) with a 17.9-in. femur bone.
(c) How much difference would there be in the height if you round off the mea-surements in the original formulas to the nearest whole number?
Solution
(a) Substituting 17.9 in H � 1.94 f � 28, we obtain
H � 1.94(17.9) � 28
� 63 in.
(b) The height of a person depends on whether the person is a male or a female.
If the person is a male, use H � 1.88(17.9) � 32 � 66 in.
If the person is a female, use H � 1.94(17.9) � 28 � 63 in.
(c) When rounded to the nearest whole numbers, the formulas would be:
Male: H � 2f � 32 � 2(17.9) � 32 � 68 in.Female: H � 2f � 28 � 2(17.9) � 28 � 64 in.
Thus, the difference in the male’s height with the new formula is 2 in. (68 insteadof 66) and for the female is 1 in. (64 instead of 63). �
The problem says that line 5 is $30,000, which is over $29,700 but not over$71,950 (second row). This means that the tax is $4090 � 25% of the amountover $29,700.
Since your taxable income is $30,000, the amount over $29,700 is $30,000 � $29,700 � $300.
Thus, your tax is $4090 � 0.25($300)
� $4090 � $75
� $4165
You can use an online calculator to verify this. (Caution: The $30,000 figurealready includes a deduction for singles.)
Cover the solution, write your own solution, and then check your work.
➍ Use the techniques you arestudying to carry out theplan.
➎ Verify the answer.
To further explore inferringheight from bone lengths forvarious races and in the metricsystem, access link 1.2.1 on thistextbook’s Online Study Center.
Now that we know that there is a relationship between the length of your bonesand your height, is there a relationship between the length of your bones andyour weight? Of course there is! However, a better measurement for your healthyweight is your body mass index (BMI). According to the National Heart, Lungand Blood Institute, you can figure out your BMI using this formula.
BMI �
where W is your weight (in pounds) and H is your height (in inches). In order tointerpret your BMI, you use the following table.
705W
H 2
20 1 Problem Solving
If Your BMI Is You Are
18 or below Underweight19–24 Normal25–29 Overweight30 or more Obese
EXAMPLE 5 � Estimating Your Body Mass Index
Suppose you weigh 162 lb and are 69 in. tall.
(a) Find your BMI to two decimal places.
(b) Refer to the table and interpret the results.
(c) Round the height, weight, and answer to the nearest 10, and use the formula
BMI �
to estimate your BMI.
Solution
(a) BMI � , where W � 162 and H � 69.
� � 23.99
(b) According to the table, if your BMI is between 19 and 24, your weight is“normal” for your height.
(c) When the height and weight are rounded to the nearest 10, 162 Æ 160 and69 Æ 70 and
BMI �
which is still “normal” (see the table). �
We have examined the weight of humans based on their BMI, but what is the“normal” weight for a horse? First, we have to figure out how to weigh a horse!According to Lon Lewis, author of Feeding and Care of the Horse,
The importance of accurate equine weight estimates is unquestionable.Veterinarians, equine management facilities, stables, and individualhorse owners rely on accurate weight information to determine proper
medication dosage, feed and nutrition considerations, racing perfor-mance, and transportation requirements.
Here is the formula you use to estimate the weight of a horse.
where G (inches) is the horse’s girth, the circumference of the horse’s body about4 in. behind its front legs, and L (inches) is its length (see Figure 1.7).
EXAMPLE 6 � Estimating the Weight of a Horse
(a) Estimate the weight of a 65-in.-long horse with a 70-in. girth.
(b) A horse requires about 0.6 gal of water, 1 lb of hay, and lb of grain for each100 lb of body weight daily. Estimate how much water, hay, and grain thishorse needs.
Solution
(a) Substitute 70 for G and 65 for L in
obtaining
Check this with a horse-weight calculator at link 1.2.2 on this textbook’sOnline Study Center.
(b) We have to estimate how many 100 lb of body weight the horse has. It isabout � 9.65. We can approximate the 9.65 to 10 to be safe. Thus, ourhorse needs 0.6 gal of water for every 100 lb of body weight; that is, 10 � 0.6 � 6 gal per day. The horse also needs 1 lb of hay for each 100 lbof body weight—that is, 10 � 1 � 10 lb of hay per day—and, finally, itneeds lb of grain for each 100 lb of body weight—that is, 10 � � 5 lb ofgrain per day. �
To further explore horse feeding,access links 1.2.3 and 1.2.4 onthis textbook’s Online StudyCenter.
A Estimation
1. An investor owns 416.38 shares of a mutual fundvalued at $30.28 per share. Find a reasonable esti-mate of the value of the investor’s stock (to thenearest hundred dollars) by rounding 416.38 to thenearest 100 and $30.28 to the nearest dollar.
2. Water is sold in thousand-gallon units. If a unit ofwater costs $1.88 and 50.439 units were used, finda reasonable estimate of the bill to the nearest hun-dred dollars.
3. A student bought artichokes for $7.80, cucumbersfor $2.29, lettuce for $3.75, tomatoes for $1.85,and broccoli for $2.90. Find a reasonable estimateof the total amount the student spent on vegetablesby rounding each price to the nearest dollar.
4. A student bought a towel for $8.99, soap for $2.39,toothpaste for $3.79, shampoo for $1.79, a pair ofshorts for $8.79, and a hat for $9.99. Find a rea-sonable estimate of the total purchases by round-ing each quantity to the nearest dollar.
5. A herbicide is to be applied at the rate of 5.75 galper acre. Find, to the nearest hundred gallons, areasonable estimate for the amount of herbicideneeded for 154 acres.
6. A bag of bahia grass covers 1.75 acres. What is areasonable estimate of the number of acres thatcould be covered with 158 bags of seed? Answerto the nearest hundred acres.
7. To find the batting average A of a player (to threedecimal places), divide the number of hits H bythe number of times the player has been at bat(AB). Pete Rose holds the record for most careerhits with 4256 in 14,053 at bats.a. What is Rose’s career batting average?b. Estimate his average by rounding 4256 and
14,053 to the nearest hundred.
8. The highest batting average for a season belongsto Hugh Duffy, who played for Boston. He had236 hits in 539 at bats.a. What was Duffy’s batting average?b. Estimate his batting average by rounding the
hits and the at bats to the nearest ten.
9. The Guinness Book of Records reports that thelowest earned run average (ERA) for a seasonbelongs to Ferdinand M. Schupp, who in 1916pitched 140 innings (IP) for New York and onlyallowed 14 earned runs (ER). If
what was Schupp’s ERA rounded to three decimalplaces?
10. In 1914, Hubert “Dutch” Leonard of the BostonRed Sox gave up 25 earned runs in 222 innings.Find Leonard’s ERA rounded to three decimalplaces. Is it lower than Schupp’s?
The following information, from cooking.com, will beused in problems 11–16. As a rough average, onemedium-sized, medium-hungry person could consumewhat is listed below.
4 to 8 hors d’oeuvres lb vegetables
1 cup soup lb rice, beans, etc.
head of lettuce lb raw pasta
lb boneless meat or fish cup gravy14
13
14
14
13
14
23
ERA �9 � ER
IP
12
12
Suppose you are planning a banquet for 100 people.
11. Estimate how many hors d’oeuvres you will needfor the banquet.
12. Estimate how many cups of soup you will need forthe banquet. If 1 gal is 16 cups, how many gallonsof soup do you need?
13. Estimate how many pounds (to the nearest pound)of boneless meat or fish you will need for thebanquet.
14. Estimate how many pounds (to the nearest pound)of rice, beans, and so on you will need for thebanquet.
15. Estimate how many pounds of raw pasta you willneed for the banquet.
16. Estimate how many cups of gravy you will needfor the banquet. How many gallons is that?
17. a. Read the meter for today.b. If the reading yesterday was 5102, how many
kilowatt-hours have been used?c. If electricity costs 8 cents per kilowatt-hour,
how much is your 1-day bill?d. If you estimate the same consumption each day
for a 30-day period, what is your estimatedmonthly electricity bill?
18. a. Read the meter for today.b. If the reading yesterday was 5501, how many
kilowatt-hours have been used?c. If electricity costs 8 cents per kilowatt-hour,
how much is your 1-day bill?d. If you estimate the same consumption each day
for a 30-day period, what is your estimatedmonthly electricity bill?
19. a. Read the meter for today.b. If the reading yesterday was 6951, how many
c. If electricity costs 8 cents per kilowatt-hour,how much is your 1-day bill?
d. If you estimate the same consumption each dayfor a 30-day period, what is your estimatedmonthly electricity bill?
20. a. Read the meter for today.b. If the reading yesterday was 6100, how many
kilowatt-hours have been used?c. If electricity costs 8 cents per kilowatt hour,
how much is your 1-day bill?d. If you estimate the same consumption each day
for a 30-day period, what is your estimatedmonthly electricity bill?
21. On the basis of the table in Example 3, what wouldyour estimated tax be if your taxable income were$40,000?
22. On the basis of the table in Example 3, what wouldyour estimated tax be if your taxable income were$50,000?
Use the following information in problems 23–24.
The relationship between the length h of a humerusbone (the one connecting your shoulder to your elbow)and the height H of a person is given by
Male: H � 2.89h � 27.81Female: H � 2.75h � 28.14
23. A detective found a 15-in. humerus bone belong-ing to a male.a. How tall was the male?b. What would the difference in height be if you
rounded the measurements in the original for-mula to the nearest whole number?
24. Suppose the 15-in. humerus bone belonged to afemale.a. How tall was she?b. What would the difference in height be if you
rounded the measurements in the original for-mula to the nearest whole number?
0 12
3456
7
890 1
2
3456
7
890 9
8
7654
3
21 0 9
8
7654
3
21
0 12
3456
7
890 1
2
3456
7
890 9
8
7654
3
21 0 9
8
7654
3
21
25. Use the information in Example 5 to find the BMIfor a person 68 in. tall and weighing 150 lb. Whatcan you conclude from your answer?
26. Repeat problem 25 if the person is 70 in. tall andweighs 170 lb.
27. Use the information in Example 6 to estimate theweight of a 66-in.-long horse with a 70-in. girth.How much hay, grain, and water should this horseconsume daily?
28. Repeat problem 27 for a 70-in.-long horse with a70-in. girth. How much hay, grain, and watershould this horse consume daily? Answers to thenearest whole number.
29. The Ohio Turnpike estimates that the annual costC of routine maintenance per lane-mile is given byC � 596 � 0.0019V � 21.7A, where C is theannual cost of routine maintenance per lane-mile(in 1967 dollars), V is the volume of traffic on theroadway (measured in equivalent standard axleloads, ESAL, so that a heavy truck is representedas equivalent to many automobiles), and A is theage of the pavement in years since the last resur-facing. Estimate C (to the nearest dollar) when V � 500,300 ESAL and A � 5 years.
30. Repeat problem 29 for V � 500,000 and A � 10years.
31. Can you estimate the age of your dog? One way todo it is to assume that if your dog is 1 year old, itwould be the equivalent of 15 years old in humanyears. If your dog is 2 years old, it would be theequivalent of 24 years old in human years. Afterthe second year, you add 4 dog-years for everyactual year.a. Estimate the equivalent human age of a 5-year-
old dog.b. Estimate the equivalent human age of a 10-
32. What about cats? According to the Daily Cat, hereis the conversion:
After the third year, add 4 cat years for everyactual year.a. Estimate the equivalent human age of a 5-year-
old cat.b. Estimate the equivalent human age of a 10-
year-old cat.
You can estimate the distance between two points on amap by using a scale. In the accompanying map, eachinch represents approximately 15 mi. Thus, the dis-tance from the beginning of Interstate 90 to its inter-section with Route 128 (about 1 in. on the map) repre-sents an actual distance of 15 mi.
33. Estimate the distance between the intersection of90 and 128 and the intersection of 90 and 495.
34. Estimate the distance between the intersection of90 and 495 and the intersection of 90 and 290.
35. Estimate the distance between the intersection of90 and 290 and the intersection of 90 and 86.
36. Estimate the distance between the intersection of90 and 86 and the intersection of 90 and 32.
37. Estimate the distance between the intersection of90 and 32 and the intersection of 90 and 91.
Use the following assumptions in problems 38–42.Your car makes about 20 mi/gal, and gasoline costsabout $2.40/gal.
38. How much does it cost to travel the distance inproblem 33?
39. How much does it cost to travel the distance inproblem 34?
40. How much does it cost to travel the distance inproblem 35?
41. How much does it cost to travel the distance inproblem 36?
42. How much does it cost to travel the distance inproblem 37?
43. A gray whale eats about 268,000 lbs of amphipods(a marine crustacean) per month. In a month with30 days, estimate how many pounds of amphipodsa gray whale consumes in a day.
44. If the average weight of an amphipod is 0.004 oz,estimate how many amphipods a gray whalemight eat in a day.
45. A 12,000-lb killer whale might eat as much as14,000 lb of herring per month. In a month with 30days, estimate to the nearest hundredth how manypounds of herring a killer whale would eat in a day.
46. If the average weight of a herring is 3.2 oz, esti-mate how many herring a killer whale would eat in a day. (Source: Oregon Coast Aquarium:www.aquarium.org/.)
Use the following information for problems 47–48.Your basal metabolic rate (BMR) is the amount ofenergy your body needs to maintain body temperature,breathe, and make your heart beat. To estimate theBMR, use the following formulas:
Male Multiply the body weight by 10;add twice the body weight to thisvalue.
Female Multiply body weight by 10; addthe body weight to this value.
47. What is the BMR for a 150-lb male?
48. What is the BMR for a 120-lb female?
In Other Words
49. Write the procedure that you use to round thenumber 157 to the nearest hundred.
50. Explain, in your own words why the reading onthe first dial is 9 and not 0.
Using Your Knowledge
In Getting Started, we discussed how the number ofparticipants in the Million Man March was estimated.How does the event staff estimate the number of peo-ple in the Tournament of Roses Parade? Below is themethod Robert Gillette, a reporter for the Los AngelesTimes, uses to calculate the number of people in a spe-cific area.
He measures the depth of the standing-room area,which is 23 ft. Then he multiplies by the 5.5-mi paraderoute and doubles the amount because there arespectators on both sides of the street, obtaining 23 ft � 5.5 mi � 2. Unfortunately, the answer will be infeet � miles. 1 mi � 5280 ft.
51. Find 23 ft � 5.5 � 5280 ft � 2.
52. Assume that each spectator occupies 2 ft2 of space(2 ft thick and 1 ft wide). How many spectators fitin the space you obtained in problem 51? That’sthe estimate Mr. Gillette provides!
0 98
7654
3
21
8
0 12
3456
7
89
9
Research Questions
1. We have mentioned the estimation of crowds in relation to the Million ManMarch and the Tournament of Roses Parade. But there is another way ofestimating crowds. Looking at the garbage they leave behind! To furtherexplore how to estimate a crowd, access link 1.2.5 on this textbook’s OnlineStudy Center. Then list the top five “garbage” parades of all time in NewYork, according to Casey Kasem.
2. How many people are there in the United States for each square kilometer?Outline how to answer this question. To learn how to make the outline,access link 1.2.6 on this textbook’s Online Study Center.
How many fish in the lake? How many deer in the for-est? We cannot let you go fishing, capture every fish inthe lake, and count them, let alone catch deer in theforest. In this Collaborative Learning, we will discussan estimation method called capture-recapture andsimulate the fishing and hunting. You need severalbags of lima beans, one for each group (1-lb bags areideal), and a nontoxic washable marker. In this inves-tigation, the bag of beans represents the lake or the for-est. The objective is to find out the total number ofbeans (fish or deer) in the bag. Here are the steps foreach group:
Step 1 Reach into the lake, remove T fish, and tagthem by marking them with the marker.Return the fish to the lake (meaning: putbeans back in the bag!).
Step 2 Allow the fish to mingle (shake the bag!),remove a handful of fish H and count them.Count the number of tagged (marked) fish Min the handful.
Step 3 Make a table like the one below.
The method assumes that the ratio of the actual popu-lation P to the sample size T is the same as the ratio ofthe number of marked fish H to the number marked inthe recapture sample M; hence, PM � TH. Thus, theformula for the population is
Population �
This method of estimation is called the Lincoln Index.If you marked the beans with a nontoxic marker, you may reuse them; otherwise, don’t eat the beans.
You can calculate your percent of error by counting thebeans in the bag (B), recording by how many beansyour count is off (O), and calculating the percent O/B.
To further explore sampling, access link 1.2.7 on thistextbook’s Online Study Center.
THM
Number (T) Number (H)Group of Tagged in Handful
12...
Graph Interpretation: A Problem-Solving Tool
Do you have a budget? What are your main expenses? The circle graph (piechart) on the next page (Figure 1.8) gives general guidelines to establish yourbudget. In a circle graph, a circle is divided into sectors (wedges) that are pro-portional to the size of the category. The information can also be presented usinga bar graph (Figure 1.9), in which the size of the categories is proportional tothe length of the bars.
Now, which category in the budget above is the main expense? From either thecircle or the bar graph, you can see that the greatest percentage of the money willgo toward housing. What about the category that receives the least percentage ofthe money? There are four of them. Can you name them?
In this section we will concentrate on solving problems that involve the inter-pretation of different graphs: circle (pie), bar, and line. �
A. Interpreting Circle Graphs (Pie Charts)Can you predict the weather using a circle graph? The Bureau of Meteorologydoes this in Australia! The following charts (Figure 1.10) tell us how often Aus-tralia will have low (dry), normal, or high (wet) weather, depending on the typeof year (El Niño, Normal, or La Niña). Now, if you know that you are having anEl Niño year, what can you say about rainfall? The probability that it will be dryis about 50% (half the circle), wet 17%, and normal 33%. Can you predict whatwill happen if you know that you are having a La Niña year?
HousingUtilitiesTransportationFoodClothingSavingsHealth careDebt (credit cards, personal loans)Other expenses
The two circle graphs (Figure 1.11) show the ethnic makeup of schools in California for fiscal years 1981–1982 and 2003–2004.
F I G U R E 1.11
(a) Which category has grown the most?
(b) Which category has grown the least?
(c) Which category has decreased the most?
(d) If you were in charge of the English as a Second Language (ESL) or Englishfor Academic Purposes (EAP) program, which type of language proficiencywould you look for in your teachers? (Source: www.cde.ca.gov/re/pn/fb/documents/factbook2005.pdf.)
SolutionRemember, you can follow the RSTUV procedure, so Read carefully, and Selectthe unknowns, which are certain types of categories. The plan is to inspect the chart.
(a) Hispanic or Latino has grown the most (from 26% to 46%).
(b) American Indian or Alaska Native (American Indians were 1% in 1981 andAmerican Indians plus Alaska Natives are still 1%, so it can be inferred thatAmerican Indians grew less than 1%. See how you can use deduction!).
(c) White (56% to 33%).
(d) You should look for teachers proficient in Spanish. �
B. Interpreting Bar GraphsSometimes bar graphs show categories that you want to compare by drawing thebars side by side. Did your family save money for your college education? Howmuch? Figure 1.12, the bar graph at the top of page 29, shows three differenthousehold categories:
Saved less than $5000 Saved $5000 to $19,999 Saved $20,000 or more
Which is your household category? What is the percent difference between thehouseholds that saved less than $5000 and those that saved $20,000 or more?
WhiteHispanic or LatinoAfrican American
Asian orPacific IslanderFilipinoAmerican Indian
White (not Hispanic)Hispanic or LatinoAfrican American Asian
FilipinoAmerican Indian orAlaska NativePacific Islander
1.3 Graph Interpretation: A Problem-Solving Tool 29
What is the percent difference between the households that saved the most andthose that saved the least?
Let us interpret more bar graphs. Does drinking shorten your life span? A12-year-long study of over 200,000 men found that subjects who had consumedalcohol in moderation were less likely to die than those who abstained from alco-hol. Let us see how this can be deduced.
EXAMPLE 2 � Interpreting the Risk of Mortality
The bar graph (Figure 1.13) shows the relative risk of mortality for 200,000 men.
(a) Which group has the lowest mortality rate, and what is this mortality rate?
(b) Which group has the highest mortality rate, and what is this mortality rate?
(c) What is the numerical difference between the lowest and highest relative riskof mortality?
SolutionWe will use the RSTUV method. Read the problem carefully, and then Select theunknown. We are looking for lowest or highest mortality rates, so we are look-ing for the longest or shortest bars. The plan: Look at the graph.
(a) The lowest mortality rate (shortest bar) corresponds to the third category, the men having 1 drink per day (1/day). The mortality rate for this group was 0.84.
(b) The highest mortality rate (longest bar) corresponds to the fifth category, the men having 3 drinks per day (3/day). The mortality rate for this groupwas 1.02.
(c) The numerical difference between the lowest (0.84) and highest (1.02) rela-tive risk of mortality is 1.02 � 0.84 � 0.18. �
Can bar graphs save you money? Suppose you have a $1000 credit card balancethat charges 18% interest and you only make the minimum $25 payment eachmonth. It will take you forever (well, actually 5 years) to pay it off. If you decideto pay the balance off in 12 months, how much will your payments be? The bargraph (Figure 1.14) tells you, provided you know how to read it!
First, start at the 0 point and move right horizontally until you get to the cat-egory labeled 12 months (blue arrow), and then go up vertically to the end of thebar (red arrow). According to the vertical scale labeled Monthly payment, thearrow is 92 units long, which means that the monthly payment will be $92 permonth. How much money will you save? In 60 months, making the minimum$25 payment, your total payments would be 60 � $25 � $1500. In 12 months,making $92 payments, you will pay 12 � 92 � $1104. Thus, the savings are$1500 � $1104, or $396.
EXAMPLE 3 � Estimating Savings on Your Credit Card
Find the savings if you decide to pay the balance in 24 months.
1.3 Graph Interpretation: A Problem-Solving Tool 31
SolutionReview Figure 1.15 to find the savings! To find the payment corresponding to 24months on the horizontal axis, move right to the category labeled 24 months andthen vertically to the end of the bar. According to the vertical scale, the monthlypayment will be $50. If you pay $50 for 24 months, you would pay 24 � $50 �$1200 and have savings of $300 ($1500 � $1200). Remember, when paying offany debts, the faster you pay, the more interest you save! �
C. Interpreting Line GraphsWe have already discussed how to interpret circle and bar graphs. Now we willlearn how to interpret line graphs. Look at the graph in Figure 1.16.
F I G U R E 1.15
$100
90
80
70
60
50
40
10
0
30
20
Mon
thly
pay
men
t
Months12 6024 36 48
92
F I G U R E 1.16
Percentage Believing Women Have Equal JobOpportunities with Men, by Gender
Men Women
Jan 2
6–Feb
5, 19
87
Dec 18
–21,
1989
Aug 23
–25,
1993
Sep 14
–17,
1995
Jun 1
2–18,
2003
Jun 3
–9, 2
002
Jun 1
1–17
, 200
1
Jun 6
–25,
2005
48% 46%50%
38%
53% 54% 55%61%
45%43%39%
30% 32%30%37%35%
Do women have equal job opportunities? It depends on who you ask and when!For example, in 1987, not even 50% of men or women thought so, but in 2005,61% of the men and 45% of the women did.
EXAMPLE 4 � Interpreting Equal Opportunity
(a) In what year did the largest percent of women believe that they had achievedequality of opportunity? What about men?
(b) In what year did the smallest percent of women believe that they hadachieved equality of opportunity? What about men?
(c) In what year was the difference of opinion greatest? smallest?
(d) Which gender (men or women) is more likely to believe that women haveachieved equality of opportunity in the work force?
Source: The Gallup Organization, “Gender Difference in Views of Job Oppor-tunities,” by Jeffrey Jones.
Solution
(a) First, note that the graph for women is at the bottom in black. Follow theblack line until you encounter the largest percent, which is 45%. The 45% isover the date June 6–25, 2005. Thus, the year in which the largest percent ofwomen believed that they had achieved equality of opportunity is 2005. Formen, you have to follow the green line. The largest percent on the green lineis 61%, also occurring in 2005.
(b) Follow the same procedure as in part (a), except we are looking for the small-est percent on the black line, which is 30% (occurring in 1993 and 1995).For men (green line), the smallest percent is 38% in 1995.
(c) Now we are looking for the greatest gap (distance) between the black andgreen lines. This occurs in 2001. You can make this precise by looking at thepercent difference at each date. For 2001, the difference is 53% � 32%, or21 percentage points. The smallest difference occurs in 1995 (38% � 30%,or 8 percentage points).
(d) Men are more likely to believe that women have achieved equality of oppor-tunity in the work force. The green line (representing men) is always higherthan the black line (representing women), so the percentage of males withthis belief is always higher. �
EXAMPLE 5 � Chil l Out!
Figure 1.17 shows the new wind-chill temperatures (top, yellow) and the oldwind-chill temperatures (bottom, white) for different wind speeds.
1.3 Graph Interpretation: A Problem-Solving Tool 33
(a) If the wind speed is 90 mph, what is the approximate new wind-chill factor?
(b) If the wind speed is 90 mph, what is the approximate old wind-chill factor?
(c) When the wind is 90 mph, what is the wind-chill temperature differencebetween the new and the old?
Solution
(a) Go to 90 on the horizontal axis and up vertically until you meet the yellowgraph. This occurs at about �30°F.
(b) The old wind chill is slightly under �40°F (be careful here, the numbers gofrom �40°F to �50°F), so we estimate the answer as �42°F.
(c) The difference between the two is about 12°F (from �30°F to �42°F). �
A Interpreting Circle Graphs (Pie Charts)
In problems 1–10, answer the questions about the cir-cle graph.
1. Do you have a job? Which method of transporta-tion do you use to get to work? The chart showsthe different modes of transportation used by peo-ple going to work in England.
a. What is the most preferred mode of transporta-tion?
b. What is the least preferred mode of transporta-tion?
c. In Dallas–Fort Worth, about 91% of the peopledrive to work. What is the percent differencebetween people driving to work in Dallas–FortWorth and in England?
1.3 Graph Interpretation: A Problem-Solving Tool 35
a. What fraction of the pizza is crust?b. What fraction of the pizza is cheese?c. Which ingredient makes the smallest part of
the pizza by weight?d. If you estimated that a pizza weighs 4 lb, how
many pounds would be crust and how manypounds cheese?
e. If you were to make 100 of these 4-lb pizzas,how many pounds of cheese would you need?
7. Have you looked in your trash lately? You have anaverage trash can if your trash divides into thesame percents as those shown.
a. What is the most prevalent item in averagetrash?
b. Which is the second most prevalent item inaverage trash?
c. If you have an average trash load weighing 50 lb, how many pounds of paper would it con-tain? How many pounds of yard trimmings?Actually, you probably recycle and do not haveas much paper!
8. What is your favorite sport to watch? The chartsshow the results of a Gallup Poll comparing view-ership in December 2004 and November 1998.
a. stay the same?b. increase? By what percent?c. decrease? By what percent?d. If you were the programming director of a
sports network and each percent of increase ordecrease in viewership was worth $1 millionwhen renewing contracts, how much would thecontract of each of the sports change?
9. The circle graph shows the breakdown of how theworld produces its energy.
a. Which energy source produces the most energy?b. Which energy source produces the least energy?c. Fossil fuels (coal, oil, and natural gas) emit
greenhouse gases when burned. Which of thethree fossil fuels produces the least energy?
10. Suppose you paid $10,000 in federal incometaxes. The chart shows where the money went!
a. Where did most of the money go?b. What percent of the money went to health?c. How much money went to health?d. Which category received the least money?e. How much money went to education?f. What is the difference between the amount of
money spent for military and defense and theamount of money spent for education?
B Interpreting Bar Graphs
In problems 11–22, answer the questions about the bargraphs.
11. Can moderate alcohol consumption (yes, we saidmoderate) reduce blood pressure? Judge for your-self by examining the bar graph that illustrates the
average systolic blood pressure among youngadults. Find the average systolic blood pressurefor young adults consuminga. no drinks per day.b. less than 1 drink per day (�1/day).c. at least 1 but less than 2 drinks per day
(1–�2/day).d. Which category has the lowest blood pressure?
What is the measure of the blood pressure?e. Which category has the highest blood pressure?
What is the measure of the blood pressure?
12. People who abstain from drinking have double therisk of a stroke as drinkers. How can we deducethis from the bar graph? Look at the vertical scale(0 to 3.5).
a. What is the risk of stroke for current drinkingmen?
b. What is the risk of stroke for men who abstain?c. Estimate how many more times the risk of
stroke is for abstaining men than for currentdrinking men?
d. What is the risk of stroke for current drinkingwomen?
e. What is the risk of stroke for abstaining women?f. Estimate how many more times is the risk of
stroke for abstaining women than for currentdrinking women.
1.3 Graph Interpretation: A Problem-Solving Tool 37
13. The bar graph shows the number of traffic acci-dent victims who died at the scene of the accidentand the blood alcohol level (BAL) of the driver.
a. What was the number of fatalities with a nega-tive (no) blood alcohol level?
b. In many states, a person is legally drunk if hisor her BAL is 0.10 or more. How many peoplewere legally drunk? (In some states, 0.08 ormore is legally drunk.)
c. What was the most prevalent BAL range forthe people who were legally drunk? How manypersons had that BAL?
14. At what time do fatal accidents occur? Refer to thegraph below.
a. Find the number of fatalities between 12:01and 3:00 A.M.
b. Find the number of fatalities between 3:01 and6:00 A.M.
c. What is the most likely time period for a fataltraffic accident to occur?
d. Aside from “unknown,” what is the least likelytime period for a fatal traffic accident to occur?
15. The graph at the top of page 38 indicates the num-ber of traffic fatalities and age of the decedent. a. In which age group are most of the fatalities?b. Which age group has the least (nonzero) fatal-
ities? Why do you think that is?c. Are there more fatalities involving people who
are less than 50 years old or more than 50 yearsold?
16. Do you have a computer at home? The bar graphbelow shows the percent of U.S. households witha computer in 1998 and in 2000.
a. Which ethnic group had the most householdswith a computer? In what year?
b. Which ethnic group had the fewest householdswith a computer? In what year?
c. If you were the marketing director for a com-puter manufacturer, to which ethnic groupwould you direct your advertisements?
Source: www.ntia.doc.gov/ntiahome/fttn00/chartI-13.htm#f13. NTIA and ESA, U.S. Department of Commerce, usingU.S. Bureau of the Census Current Population Survey supplement.
Perc
ent o
f U
.S. h
ouse
hold
sw
ith a
com
pute
r
70
60
50
40
30
20
10
AfricanAmerican
AsianAmerican
20001998
White Hispanic0
55.7
23.2
32.6
55
65.6
25.5
33.7
46.6
17. The graph below shows the percent of U.S. house-holds with Internet access by income in thousands.
a. Which income group had the highest percentof households with Internet access? What per-cent of that group had Internet access in 2000?In 1998?
b. Which income group had the lowest percent ofhouseholds with Internet access? What percentof that group had Internet access in 2000? In1998?
1.3 Graph Interpretation: A Problem-Solving Tool 39
c. What was the difference in income (in thou-sands) between the category with the highestpercent of U.S. households with Internetaccess and the category with the lowest percentof U.S. households with Internet access?
18. Which has more calories, ice cream or yogurt?The graph shows the number of calories for cupof ice cream or yogurt.
a. How many calories are in the Cherry Garciaice cream?
b. How many calories are in the Cherry Garciayogurt?
c. How many calories are in the Cookie Doughice cream?
d. How many calories are in the Cookie Doughyogurt?
e. Which is the product with the least calories?f. Which is the product with the most calories?
19. Refer to the graph in problem 18.a. How many calories would you save if you ate
a whole cup of the product with the least calo-ries instead of a cup of the product with themost calories?
b. How many extra calories would you consumewhen you have a pint of the product with themost calories in the graph instead of the prod-uct with the least calories? Hint: 2 cups �1 pint.
20. What is the most popular spectator sport in Japan?A survey of 3000 Japanese aged 20 or older saysthat it is baseball! The bar graph for the survey isshown below.a. What is the second most popular sport? What
percent of the respondents said they preferredhigh school baseball?
b. What was the least popular spectator sport inthe survey? What percent of the people pre-ferred this sport?
c. Name the three sports that enjoyed about thesame popularity in the survey.
d. How many more people preferred Japaneseprofessional baseball than major league base-ball?
1.3 Graph Interpretation: A Problem-Solving Tool 41
C Interpreting Line Graphs
In problems 23–36, answer the questions about the linegraph.
23. Are you poor? If you are a family of one, the U.S.Department of Health and Human Services saysthat you are poor (below poverty level) if yourannual income is less than $8350. The graphshows the percent of persons below the povertylevel.
a. Which group has the highest percent of per-sons below the poverty level?
b. Which group has the lowest percent of personsbelow the poverty level?
c. Estimate the percent difference between thehighest and lowest percents for persons belowthe poverty level in 1980. In 1999.
d. By examining the graph, are the poverty levelsgetting better or worse? Why?
24. The graph shows the annual percent change inconsumer price indexes.
Source: U.S. Census Bureau.
Ann
ual p
erce
nt c
hang
ein
con
sum
er p
rice
inde
xes
1990 1992 1994 19981996 2000
40
30
60
50
20
10
0
−10
−20
Medical care
All items
Fuel oil
Source: U.S. Census Bureau.
Perc
ent o
f pe
rson
sbe
low
pov
erty
leve
l
1980 1985 1990 1995 2000
35
30
25
20
15
10
5
African American
Hispanic*
*Persons of Hispanic origin may be of any race.
Total(All races)
White
a. Which item has the highest percent change inthe year 2000? What is the percent change?
b. Estimate the percent decline in medical carefrom 1990 to 2000.
25. The graph shows the years of school completed bypersons 25 years old and over.
a. What percent of the people had 4 years of highschool or more in 1940? In 2000? What is thepercent difference?
b. What percent of the people had 4 or more yearsof college in 1940? In 2000? What is the per-cent difference?
c. What are the trends for each of the three cate-gories shown in the graph?
26. Do you want to be a teacher? The graph shows theaverage annual salary for public elementary andsecondary school teachers.
a. What was the average salary (current dollars)in 1970–1971? In 2006–2007? What is thedollar difference?
b. What was the average salary (constant dollars)in 1970–1971? In 2006–2007? What is thedollar difference?
27. According to the Census Bureau, a family of oneis poor if it makes less than $10,000 a year. Thechart shows the poverty rate by age.
a. Which age group had the highest percent ofpoor in 2004?
b. Which age group had the lowest percent ofpoor in 2004?
c. What percent of people 65 years of age andolder were poor in 1966?
d. From 1966 to 2004, which age group showed adecrease in their poverty rate?
e. From 1966 to 2004, which age group showedan increase in their poverty rate?
f. From 1966 to 2004, which age group stayedabout the same in their poverty rate?
28. The graph shows the evolution of VCRs, DVDplayers, and DVD recorders for 2000–2006.
Notes: M = Matshushita estimates; IA = Industry average esti-mates. MMIS data posted January 2004; graph 2004-DVDV-100.Source: http://mmislueck.com/Archives/011204.htm.
1725
38
49
20
42
0
10
20
30
40
50
60
70
80
2000 2001 2002 2003
Years
2004 2005 2006
Mill
ions
of u
nits
ship
ped
34 27
59
513
7570
49
0.07 0.251.3 13.6
42
22.6
4.40.05 0.25
1.1 7.8
30
163.7
DVD-Recorder (M)
DVD-Recorder (IA)
VHS-VCR
DVD-Player
Note: The data points are placed at the midpoints of the respectiveyears. Data for people 18 to 64 and 65 and older are not availablefrom 1960 to 1965.Source: U.S. Census Bureau, Current Population Survey:1960–2005 Annual Social and Economic Supplements.
Recession
9.8%11.3%17.8%
Perc
ent
50
65 years and older
18 to 64 years
Under 18 years
40
30
20
10
01959 1970 2000 200419901980
Poverty Rates by Age: 1959 to 2004
a. What was the peak and lowest years for VCRplayer sales?
b. What about for DVD player sales?c. What was the difference in units shipped
between DVD and VCR players in 2006?d. What was the difference in units shipped
between M and IA estimates in 2006?
29. How old is your dog? The graph gives the rela-tionship between a dog’s age (in human years) anda dog’s age in dog years. Thus, if a dog is 1 year inhuman years, it is about 12 years in dog years.
a. If a dog is 9 years old in human years, how oldis it in dog years?
b. If retirement age is 65 for humans, what is theequivalent retirement age for dogs in humanyears? (Answer to the nearest whole number.)
c. If the drinking age for humans is 21, what isthe equivalent drinking age for dogs in humanyears? (Answer to the nearest whole number.)
30. We need equal time for cats! The graph gives therelationship between a cat’s age (in human years)and a cat’s age in cat years.
1.3 Graph Interpretation: A Problem-Solving Tool 43
a. If a cat is 6 years old in human years, how oldis it in cat years?
b. If retirement age is 65 for humans, what is theequivalent retirement age for cats in humanyears? (Answer to the nearest whole number.)
c. If the drinking age for humans is 21, what isthe equivalent drinking age for cats in humanyears? (Answer to the nearest whole number.)
d. Comparing your answers to problem 29, whowould retire first (in human years), a cat or adog?
31. Do you know what a badger is? It is a smallburrowing animal that looks like a weasel.
a. To the nearest kilogram, how much does abadger weigh when it is 4 months old? (1 kg �2.2 lb)
b. To the nearest kilogram, how much does abadger weigh when it is 8 months old?
c. At approximately what age do badgers stopgrowing?
Use the following graph for problems 32–36. Thegraph shows the amount owed on a $1000 debt at an18% interest rate when the minimum $25 payment is
Source: www.knockonthedoor.com.
Wei
ght (
kg)*
62 4
10
8
6
4
2
00 108
Badger age (months)*1 kilogram ≈ 2.2 lb
made (blue) or when a new monthly payment of $92 ismade (red). Thus, at the current monthly payment of$25, it will take 60 months to pay off the $1000 bal-ance. On the other hand, with a new $92 monthly pay-ment, you pay off the $1000 balance in 12 months.
32. What is your balance after 6 months if you arepaying $25 a month?
33. What is your balance after 6 months if you arepaying $92 per month?
34. What is your balance after 18 months if you arepaying $25 a month?
35. What is your balance after 48 months if you arepaying $25 a month?
36. What is your balance after 60 months if you arepaying $25 a month?
In Other Words
37. Describe in your own words a circle, a bar, and aline graph.
38. Write in your own words situations in which it ismore advantageous to use one type of graph(circle, bar, or line) than another.
39. What type of graph would you use if you had toshowa. a relationship between groups that do not
affect each other?b. continuing data?c. how parts of a whole relate to each other?d. In each case, discuss why you would use the
type of graph you indicated.
Source: www.dinkytown.net/java/PayoffCC.html.D
olla
rs
186 12
1000
800
600
400
200
0
900
700
500
300
100
0 3024 5442 4836 60Months
Current monthly payment of $25New monthly payment of $92
The most popular prescription for relieving the effects of menopause has more risks than benefits, and the6 million women in the United States who take the estrogen-plus-progestin preparation should consult their doctors right away, a national study determined. The research found these numbers of illnesses per 10,000 women annually:
HORMONE REPLACEMENT THERAPY
Estrogen Plus Progestin
Colorectalcancer
Heartattacks
Bloodclots
Breastcancer
Strokes Hipfractures
Endometrialcancer
Deaths
50
40
30
20
10
0
Placebo
Risks Benefits Neutral
40. A recent milestone study regarding hormonereplacement therapy for relieving the effects ofmenopause showed that there were more risksthan benefits in the treatment. How did they per-suade doctors to stop the experiments? By study-ing the statistics using bar and line graphs. Look atthe bar graphs on the left. The red bars show thenumber of women (per 10,000) suffering heartattacks, strokes, breast cancer, and blood clotswhen taking the estrogen plus progestin (medi-cine), while the blue bars show the comparablenumbers for women taking a placebo (fakemedicine).a. Estimate the total number of women (per
10,000) who had heart attacks, strokes, breastcancer, and blood clots while taking the estro-gen-plus-progestin medicine
b. Estimate the total number of women (per10,000) who had heart attacks, strokes, breastcancer, and blood clots while taking theplacebo.
c. Estimate the numerical difference in the totalnumber (per 10,000) of women taking theestrogen-plus-progestin medicine, havingheart attacks, strokes, breast cancer, and bloodclots as compared with the number (per thou-sand) taking the placebo.
d. There were some benefits associated with tak-ing the medicine. What were those benefits andhow could you measure them?
e. There were some areas that were neutral (notmuch difference between taking the medicineand taking the placebo). Which were those areas?
41. The four line graphs relate the risk of some ill-nesses (vertical scale, from 0 to 0.03) and thelength of time the women have taken the medicine(horizontal scale, from 0 to 7 years). Study thegraphs and determine in which years (to the near-est year) the placebo group (blue) hada. fewer heart attacks than the medicine group
(red).b. fewer strokes than the medicine group.c. fewer blood clots than the medicine group.d. less breast cancer than the medicine group.e. In what year and from what condition was the
difference between taking medicine and takinga placebo greatest? What was the numericaldifference in the risk?
The Tampa Tribune graphic. Sources: Knight Ridder/Tribune,Journal of the American Medical Association.
1.1 RSTUV A five-step problem-solving Read the problem.procedure Select the unknown.
Think of a plan.Use a strategy tocarry out the plan.Verify your answer.
1.1 Inductive The process of arriving at a The pattern 1, 3, 6, 10, . . .reasoning general conclusion on the basis is obtained by adding 2,
of repeated observations of adding 3, adding 4, and specific examples so on.
1.1 Sequence An arrangement of numbers 1, 3, 6, 10, . . . is a sequence.according to a pattern
1.1 Term Each number or item in a 1, 3, 6, 10, and so on, are terms sequence in the sequence 1, 3, 6, 10, . . . .
1.2 Estimation The process of arriving at anapproximate answer to a question
1.2 Rounding The process by which numbers To round the number 46.27 to oneare approximated to a certain decimal or the nearest unit, writelevel of precision 46.27 Æ 46.3
46.27 Æ 46
Chapter 1 Summary
f. Which was the only condition in which thepatients taking the medicine fared better thanthe ones taking the placebo? In which years
were the patients with this condition and takingthe medicine better off than the ones taking theplacebo?
Research Questions
1. List three different verbs you can use to indicate changes on a graph andexplain what meaning they would have if you were referring to a line graph.For help, access link 1.3.2 on this textbook’s Online Study Center.a. Explain the meaning of the verbs if you are referring to a circle graph.b. Explain the meaning of the verbs if you are referring to a bar graph.
2. List at least three ways in which you can portray misleading informationusing a graph. Try looking up “How to Lie with Statistics” on the Internet.For help, access link 1.3.2 on this textbook’s Online Study Center.
1.3A Circle (pie) A circle (pie) chart is a circle chart graph divided into sectors, each
displaying the size of some related piece of information.
The circle graph shows the revenuesources of the federal government.Source: http://cstl.syr.edu/fipse/TabBar/ReadCirc/REVCIRCL.HTM.
1.3B Bar graph Bar graphs consist of an axis with horizontal or vertical bars that represent different values for each bar. The set of numbers along a side of the bar graph is called the scale.
The bar graph represents the enrollmentin different courses at a university.Source: http://cstl.syr.edu/fipse/TabBar/RevBar/REVBAR.HTM.
1.3C Line graph A line graph is a tool used to represent information and summarize how the information is related and varies, depending on one another.
The graph shows how Web site sales andinside sales compare to each other.Source: www.visualmining.com/examples/styles/line-graphs.html.
3. Identify the pattern and find the next three terms.
1, 2, 7, 19, 41, 76, , ,
4. a. Follow this procedure: Select a number, multiply it by 4, add 6 to theproduct, divide the sum by 2, and subtract 3 from the quotient.
b. Follow the same steps as in part (a) using the numbers 1, 10, and 100.What results do you get?
c. Make a conjecture about the relationship between the original numberand the final results.
5. Round 319.26 toa. the nearest tenth. b. the nearest hundred.
6. a. Read the meter for today.
b. If the reading for yesterday was 6002 kilowatt-hours, how manykilowatt-hours have you consumed since yesterday?
c. If a kilowatt-hour costs $.10, how much was your 1-day bill?d. If you estimate the same consumption each day for a 30-day period (a
month), what is your estimated monthly bill?
7. The relationship between the height H of a person and the length t of theirtibia (the bone connecting the knee to the ankle) isMale: H � 32.2 � 2.4t Female: H � 28.6 � 2.5ta. Estimate the height of a person (to the nearest inch) with a 15-in. tibia
if the person is a female.b. Do the same as in part (a) if the person is a male.
8. The circle graphs at the top of page 48 show the budget requirements andresources for the city of St. Petersburg.
0 12
3456
7
890 1
2
3456
7
890 9
8
7654
3
21 0 9
8
7654
3
21
Chapter 1 Practice Test
Research Questions
1. Access link 1.1.6 on this textbook’s Online Study Center and contrastinduction and deduction. Include a diagram of how each method works.
2. In a short paragraph, give three reasons why estimation is important in thestudy of mathematics.
a. What is the biggest category in the requirements chart?b. About what fraction of the requirements is for public safety?c. What is the smallest category in the resources chart?
9. The bar graph shows the property tax (orange) versus police and fireexpenses (green) for the city of St. Petersburg.
Source: www.stpete.org/2002charts.htm.
a. How much were the property taxes in 1990?b. What were the police and fire expenses in 1990?c. Estimate the police and fire expenses for 2002.d. Estimate the property taxes for 2002.e. What is the difference in property taxes in 1998 and in 2002?
10. The line graph shows the 30-year fixed mortgage rates on different dates.a. What was the rate on 5/15? b. What was the rate on 6/5?c. What was the difference in rates between 5/15 and 6/5?d. What seems to be the trend for 30-year fixed-rate mortgages?