Page 1
Benchmarking Energy Efficiency of
Commercial Office Buildings in Kampala
Nelson Isaiah Mukwaya, and Peter Okidi-Lating
Abstract---Building energy efficiency benchmarks are
representative values against which a similar building’s actual
efficiency can be compared and realistic opportunities for improving
efficiency unveiled. This paper explains the development of an
energy efficiency benchmarking system for commercial office
buildings in Kampala. A multiple regression model defining the
relationship between the Energy Use Intensities (EUIs) and the
significant energy use related building factors was developed. The
EUIs were normalized by removing the effect of deviance in the
explanatory factors. The normalized EUIs for the buildings were
computed. An energy efficiency benchmark table (table of
percentiles) of the EUIs was then computed. Using the benchmarks,
the energy performance of each of the sample buildings ranked.
Analysis of the energy efficiency of similar buildings follows the
same procedure. Buildings with EUIs within the lower percentile of
the benchmark table are considered to be more energy efficient than
similar buildings, and vice versa.
Keywords----Benchmarking, commercial building, energy use
intensity, efficiency.
I. INTRODUCTION
A. Background
GANDA experienced electrical energy shortage until the
end of 2011 despite the fact that Independent Power
Producers operating thermal plants were supplementing the
hydropower facilities [1]. The demand for electricity in
Uganda is growing at an average rate of seven per cent per
annum [1]. Energy consumption in buildings represents up to
40 percent of the total energy use [2]. In large cities, building
energy use can account for up to 80 percent of carbon
emissions [3]. Energy efficient buildings cost less to operate
and have better internal environments for occupants, leading
to healthier buildings that contribute to mitigating climate
change [4]. To date, activities on energy conservation have
been limited to preliminary energy audits by the Ministry of
Energy and Mineral Development (MEMD) in industries and
hotels as well as efforts to increase awareness among all
stakeholders [5].
Nelson Mukwaya is an MSc Renewable Energy graduate of Makerere University, Kampala, Uganda. He is an electrical engineer with GEM
Engineering Co. Ltd, Kampala, Uganda (phone: +256 782 488 999; email:
[email protected] ) Peter Okidi-Lating is an Associate Professor, College of Engineering,
Design, Art and Technology, Makerere University, Kampala, Uganda (e-mail:
[email protected] / [email protected] )
Energy-efficiency benchmarking can be used to monitor
changes in energy efficiency. Benchmarking is preceded by
development of the energy-efficiency indicators. The
indicators can be obtained by normalizing the energy use with
floor area and/or operational hours. For instance, [6] the
author used a sample of energy consumption data and the floor
area to calculate the Energy Use Intensity (EUI) for school
buildings in central Argentina. The calculated EUIs were then
ranked as a benchmark table [7]. The Singapore e-Energy
Benchmark System [8] and [9] used a similar method.
However, this method has limitations. Other factors such as a
Heating, Ventilation and Air-conditioning (HVAC) may cause
the energy use in specific buildings to differ from that in their
peers [10]. A simple normalized EUI is not good enough for a
credible energy-consumption performance rating [11]. To
account for the other factors that affect energy consumption,
benchmarks were developed using a multivariate linear-
regression approach to correlate other factors representing
some important characteristics of buildings with EUI [8].
In this research, an EUI benchmarking process for
commercial office buildings was developed. The resulting
benchmark table constitutes a set of estimated percentiles of
the distribution of normalized EUIs.
B. Problem Statement
In Uganda, there are no documented energy efficiency
benchmarks upon which the energy efficiency of commercial
office buildings can be analyzed. Moreover, such benchmarks
present a powerful tool to both the government and the private
sector in managing energy consumption. These benchmarks
would also unveil realistic targets and means of improving
energy efficiency.
In this research, an energy efficiency benchmarking process
applicable to commercial office buildings in Kampala has
been developed using multivariate linear regression analysis.
C. Objectives
C.1 Main Objective
To develop an energy efficiency benchmarking system for
commercial office buildings in Kampala
C.2 Specific Objectives
i) To analyze the selected energy efficiency indicator and
the building characteristics that affect this indicator
ii) To formulate a regression model for discovering the
relationship between the efficiency indicator and the
significant factors corresponding to the building
U
2nd Intl' Conference on Advances in Engineering Sciences and Applied Mathematics (ICAESAM’2014) May 4-5, 2014 Istanbul (Turkey)
http://dx.doi.org/10.15242/IIE.E0514065 108
Page 2
characteristics and to normalize the indicator for the
significant factors
iii) To develop the energy efficiency benchmarking table
from the normalized model
iv) To rank the energy efficiency of selected commercial
office buildings in Kampala
II. METHODOLOGY
A. Research Design
The research was based on a survey of 25 randomly
selected commercial office buildings in Kampala to study the
energy use pattern and the energy use related factors. A
statistical association between the buildings’ energy use and
the respective energy use related building factors was
analyzed.
B. Research Approach
The research took on a quantitative approach. The
relationship between EUI, the energy efficiency indicator and
the significant factors indicating the building characteristics
was determined by means of multiple linear regression
analysis, forming a benchmarking model.
C. Data Collection
The daily temperature record for Kampala, for the 20 year
period from January 01, 1993 to December 31, 2012 was
obtained from the Department of Meteorology, Ministry of
Water and Environment. The information below was obtained
during the survey of buildings:
i) The month and year the building was commissioned for
occupancy or last retrofitted
ii) Total building internal floor area
iii) Total number of computers in the building
iv) Indoor temperature set point of the air conditioners in
hot weather
v) HVAC type of equipment
vi) Lighting type of equipment
vii) Number of lift stops
viii) Total kilogram carrying capacity of each of the
installed lift equipment
ix) Annual utility energy bills
x) Annual standby generator fuel consumption
xi) Landlord’s operations and maintenance practices.
xii) Occupants’ operations or maintenance practices.
D. Initial Data Analysis
The EUIs (dependant variable) were computed and then
climate adjusted while the building factors and building
occupants factors (independent variables) were computed and
standardized as explained below.
D.1 Computation of the Energy Use Intensities
The building EUIs were computed as a ratio of the total
electrical energy consumed by the building in the year 2012
and the total internal floor area of the building.
D.2 Climate Adjustment of the Energy Use Intensities
The observed energy consumption of the buildings was
adjusted according to the weather in 2012. The total cooling
degree-days in 2012, CDDbuilding and the 20 years average
(1993 to 2012) for annual cooling degree-days, CDD20years
were computed, with a base temperature of 18.5OC[12].
The climate adjusted EUIs were computed, as in (1) [8].
CDD
CDDEUIEUI
Building
years
adj
20*
(1)
Where EUIadj is the climate adjusted EUI
D.3 Computation of the independent variables
The independent variables were computed as discussed
below:
Building Age: The building age denoted X1 is the time in
months elapsed from the month the building was
commissioned for occupancy upon completion of the
construction or upon completion of the most recent major
retrofit works as of 31st December 2012.
Floor Area: The building floor area denoted X2 is the total
internal floor area in square meters on the floors
accommodating the offices.
HVAC Efficiency Factor: The HVAC efficiency factor
denoted X3 is the weighted efficiency of the installed HVAC
system. This is computed using (2).
T
ii
ni
i
WA
NW *1
(2)
Where, W is the weighted efficiency factor and,
iW - Total input power in watts for each installed air
conditioning outdoor unit
iN - Total number of air conditioning outdoor unit
input power iW
TA - Total internal floor area in square meters
n - Number of installed air conditioning unit types
Lighting Efficiency Factor: The lighting efficiency factor
denoted X4 is the weighted efficiency of the installed lighting
system. This is computed using (3).
T
ii
ni
i
WA
NW *1
(3)
Where, W is the Weighted efficiency factor and,
iW - Input power in watts for each individual
installed lighting fitting
iN - Number of lighting fittings of input power iW
TA - Total internal floor area in square meters
n - Number of installed lighting fittings types
Lift Capacity: The lift capacity denoted X5 is the aggregated
capacity in kilogram-stops of the installed passenger lift(s)
system. This is computed using (4).
2nd Intl' Conference on Advances in Engineering Sciences and Applied Mathematics (ICAESAM’2014) May 4-5, 2014 Istanbul (Turkey)
http://dx.doi.org/10.15242/IIE.E0514065 109
Page 3
T
ii
ni
i
A
SMC
*1
(4)
Where, C is the Lift capacity and,
iM - Kilogram capacity of each individual installed
lift car
iS - Number of floor stops made by each individual
installed lift car
n - Number of installed lift cars
TA - Total internal floor area in square meters
Percentage Occupancy: The percentage occupancy
denoted X6 is the percentage of the total office space that was
actually occupied in the year 2012. This is computed using
(5).
T
O
A
AP
(5)
Where, P is the Percentage occupancy and,
OA - Total office space actually occupied in 2012
TA - Total internal floor area in square meters
Number of Computers: Number of computers denoted X7 is
the total number of computers and laptops used in the
building. This is computed using (6).
i
ki
i nN
1 (6)
Where, N is the total number of computers in the building
in is the number of computers on a building floor
k is the number of building floors
Indoor Temperature: The indoor temperature denoted X8 is
the average indoor set temperature in OC as observed from the
sampled office spaces. This is computed using (7).
n
tT i
ni
i
1 (7)
Where, T is the Indoor temperature and,
it - Sample indoor temperature
n - Number of indoor temperature samples
Occupants’ Behavior and Maintenance Practice: The
occupants’ behavior and maintenance factor denoted X9 is a
subjective rating score, out of ten. The score assigned to the
selected “good occupants’ operations or maintenance
practices” is computed in (8).
XXXXXXX 6959493929199
XXXX 1099979 89
(8)
Where,
X 19 is the 1 if building occupants turn off lights not in use,
otherwise 0 and,
X 29 is 1 if building occupants switch off the air
conditioners not in use, otherwise 0
X 39 is 1 if building occupants switch off appliances not in
use, otherwise 0
X 49 is 1 if energy audits have been conducted and
recommendations implemented, otherwise 0
X 59 is 1 if regular maintenance of the lighting system is
conducted to ensure continued efficiency with a proper
guidance manual, otherwise 0
X 69 is 1 if regular maintenance of the air conditioning
system is conducted to ensure continued efficiency
with a proper guidance manual, otherwise 0
X 79 is 1 if regular maintenance of the other installed
building services is conducted to ensure continued
efficiency with a proper guidance manual, otherwise 0
X 89 is 1 if a time switch / photocell is installed for the
external lights, otherwise 0
X 99 is 1 if a time switch is installed for the air
conditioning system, otherwise 0
X 109 is 1 if lifts are switched off after working hours,
otherwise 0
E. Multiple Linear Regression Analysis
With the climate adjusted EUIs as the dependent variables
and the building and occupant’s related factors as the
independent variables, the multiple regression model given in
(9) [8] was formulated using the International Business
Machine (IBM) Corp. registered SPSS software.
xxaS
xxaEUI kk
i
ii
i
k
i
**11
_
1...)(
(9)
where a is the intercept; βi,… , βk are the estimated
regression coefficients; Si and
_
xi are the standard deviation
and mean values of significant factor i respectively, x*1 ,…,
xk* , k ≤ p are the significant standardized factors.
The significance of the regression model was tested, at a
5% significance level, by testing the hypothesis below:
H0: β1 = β2 = … = βk = 0, where β1, β2,…, βk are the
regression coefficients
H1: βj ≠ 0 for at least one j
If H0: β1 = β2 = … = βk = 0 is not rejected, then at least one of
the regressor variables contributes significantly to the model.
Next, by backward elimination the insignificant explanatory
variables were removed from the regression model. The
significance of each of the regression coefficients, βj was
tested, at a 5% significance level using the hypothesis (10):
H0: βj = 0
H1: βj ≠ 0 (10)
If H0: βj = 0 is not rejected for any regressor variables, then
the regressor with the smallest t value is deleted from the
model.
Hypothesis (10) was tested again, for the remaining
regressor variables, and the process was repeated if the
hypothesis was not rejected. This was done, repeatedly, until
the hypothesis was rejected. The final regression model
contains only the significant determinant factors.
2nd Intl' Conference on Advances in Engineering Sciences and Applied Mathematics (ICAESAM’2014) May 4-5, 2014 Istanbul (Turkey)
http://dx.doi.org/10.15242/IIE.E0514065 110
Page 4
The adjusted coefficient of multiple determination, Radj2
for
the resultant regression model was computed to establish its
goodness-of-fit.
Using (11) [8] and the final multiple linear regression
model, the EUIs were then normalized for the significant
factors.
xxEUIEUI kkonorm**
11...
(11)
Where, EUIo is the observed EUI and,
x*1 , …, xk
* are the observed standardized factors
F. Benchmarking the EUIs of the Buildings
The percentile estimates were obtained by using the
bootstrapping function in the statistical software IBM SSPS.
The bootstrapped values of normalized EUI were used in
establishing the energy performance benchmarks. The
respective buildings’ EUIs were then ranked using the
formulated benchmarks.
III. RESULTS
This chapter presents and discusses the results of the
research.
A. The Survey Results
The summarized statistics of the survey results is given in
Table I.
The average EUI for office buildings in Kampala is 156.0
kWh/m2/year. This is lower than that of USA at 293.0
kWh/m2/year [13], United Kingdom at 281.4 kWh/m
2/year,
Australia at 272.5 kWh/m2/year, Hong Kong at 264.7
kWh/m2/year and New Zealand at 246.7 kWh/m
2/year [14]. A
related study in Cape Town, South Africa based on 41 office
buildings for the twelve month period from October 2006 to
September 2007 yielded 188 kWh/m2/year [15].
TABLE I
SUMMARY STATISTICS OF THE SURVEY RESULTS
B. Partial Regression Plots
Scatter plots of EUI versus the significant factors are
presented in fig. 1 to fig. 5.
The scattering of the building internal floor area is due to
some buildings having basement parking area, with only
lighting while others have only office floor spaces with
lighting, HVAC and plug in appliances.
Fig. 1 EUI versus building internal floor area
Fig. 2 EUI versus HVAC efficiency factor
Fig. 3 EUI versus lighting efficiency factor
Fig. 4 EUI versus percentage building occupancy
Item Min Max Mean ( X i) SD (Xi)
Building Age 14 184 56 50
Floor area 1,840 15,000 5,274 3,218
HVAC efficiency factor 0.6 67.9 33.6 24.2
Lighting efficiency factor 5.9 16.0 8.8 2.4
Lift capacity 1.4 3.5 2.5 0.8
Percentage occupancy 65 100 92 13
No. of Computers 120 970 334 239
Indoor temperature 21 25 23 1
Behavior & Maintenance 4 8 6 1
EUI in kwh / m2 / year 103.4 230.4 156.0 36
EUIadj in kwh / m2 / year 95.1 212.0 143.5 33
2nd Intl' Conference on Advances in Engineering Sciences and Applied Mathematics (ICAESAM’2014) May 4-5, 2014 Istanbul (Turkey)
http://dx.doi.org/10.15242/IIE.E0514065 111
Page 5
Fig. 5 EUI versus the total number of computers
The scattering of the building percentage occupancy is
because this factor varied throughout the year for some
buildings while others had fixed occupancy.
The scattering of the number of computers is because in
some buildings some computers are operated for 24 hours
such as the servers. Also, some buildings had bigger
proportions of laptops at workstations than desktops yet they
consume less energy than the desktops.
C. The Multiple Regression Analysis Results
A multivariate regression model relating the climate
adjusted EUI and the building related factors for commercial
office buildings in Kampala was formulated. The initial
regression model with all the building factors included and the
final regression model with only the significant factors are
discussed below.
C.1 The Initial Multiple Linear Regression Model
The initial regression model relates the climate adjusted
EUI to the building age, internal floor area, HVAC efficiency,
lighting efficiency, lift capacity, building occupancy, number
of computers, indoor temperature set point and the occupants’
behavior and maintenance practice. The regression
coefficients for the model are given in table II.
TABLE II REGRESSION COEFFICIENT STATISTICS FOR THE ORIGINAL MODEL
Model
Unstandardized Coefficients
Standardized Coefficients
t Sig. B Std. Error Beta
(Constant) 143.524 2.052 69.933 0.000
Building Age 0.667 3.746 0.020 0.178 0.861
Floor Area -30.330 8.693 -0.928 -3.489 0.003
HVAC
Factor 9.319 7.641 0.285 1.220 0.241
Lighting Factor 10.944 6.359 0.335 1.721 0.106
Lifts
Capacity 1.684 3.971 0.052 0.424 0.678
Percentage Occupancy 3.881 3.338 0.119 1.163 0.263
Number of
Computers 27.058 10.297 0.828 2.628 0.019
Indoor
Temperature -5.936 7.015 -0.182 -0.846 0.411
Occupants’
Behavior -0.607 2.596 -0.019 -0.234 0.818
The initial regression model is thus given in (12).
)2.24
6.33(*319.9)
218,3
274,5(*330.30)
50
56(*667.052.143 321 xxx
EUI adj
)13
92(*881.3)
8.0
5.2(*684.1)
4.2
8.8(*944.10 654 xxx
)6(*607.0)23(*936.5)
239
334(*058.27
98
7
xxx (12)
This model highly fits the collected data with an adjusted
coefficient of multiple determination of 0.901. The model
predicts 90.1% of the climate adjusted EUI of the buildings.
Increased internal floor area results in reduced Energy Use
Intensity due to scale of operation. For example while the
smaller buildings have external car parking the bigger
buildings have some parking within basement floors. The
basement areas have much lower specific energy use as
compared to the office floor spaces.
The lighting and the HVAC efficiency factors contribute
positively to the energy use because higher input power rating
and particular illuminance, and higher cooling power
respectively increase the energy consumption. High efficacy
lighting systems provide the same illumination levels for less
energy consumption. Also, the buildings with total HVAC
coverage such as building A consume more energy in air
conditioning than those with partial HVAC coverage such as
building B.
Increased lift capacity increases energy consumption
because it represents mechanical work done by the lift
equipment and consequently the electrical energy input. This
factor can be reduced by setting the lifts to cover fewer
building floors leaving out say the lowest and highest levels,
which can then be reached using the staircases. That way,
some energy would be conserved. This practice was evidenced
in buildings D, J, L and N.
Increased occupancy of a building increases its energy
consumption because more electrical appliances such as
computers are used, and more systems are operated such as the
HVAC and lighting. Also, physical operational activity of the
occupants dissipates heat requiring higher cooling energy; the
lifts are operated more often, more intensely resulting in more
energy use.
As expected, the number of computers in the building
increases energy use. Lower indoor air conditioning set
temperature necessitates higher cooling energy from the
HVAC equipment.
Lastly, occupant behavior and maintenance works geared
towards energy conservation would reduce energy use in the
building. With an average score of 6.0, it was realized that
more could be done to reduce energy consumption. For
example most buildings have never conducted energy audits,
one certain way to identify energy efficiency opportunities.
C.2 The Final Multiple Linear Regression Model
2nd Intl' Conference on Advances in Engineering Sciences and Applied Mathematics (ICAESAM’2014) May 4-5, 2014 Istanbul (Turkey)
http://dx.doi.org/10.15242/IIE.E0514065 112
Page 6
Through backward elimination, the insignificant
explanatory variables of the initial regression model that were
eliminated are listed below in the order of removal.
i) Building age
ii) Occupants’ behavior and maintenance factor
iii) Lifts capacity
iv) Average indoor air conditioner set temperature
The best fitting model is achieved after the third stage of
backward elimination when the least significant factors
namely the building age, occupants’ behavior and
maintenance factor and lifts capacity are removed. At this
stage the model predicts 91.6% of the climate adjusted EUIs
of the buildings. This is the recommended model for
predicting the climate adjusted EUI of the buildings.
The final regression model is achieved after the fourth stage
of elimination when the last insignificant factor that is average
indoor air conditioner set temperature is eliminated. This stage
reduces the adjusted coefficient of multiple determination to
0.915. The final model thus predicts 91.5% of the climate
adjusted EUIs of the buildings. Though the final model is less
cumbersome to use, having less factors to consider after the
removal of the average indoor air conditioner set temperature
factor, there is a trade-off in reduced accuracy.
The coefficients for the retained (significant) variables are
presented in table III.
TABLE III
REGRESSION COEFFICIENT STATISTICS FOR THE FINAL MODEL
Model
Unstandardized
Coefficients
Standardized
Coefficients
t Sig. B Std. Error Beta
(Constant) 143.525 1.911 75.123 0.000
Floor Area -31.668 7.658 -0.969 -4.135 0.001
HVAC Factor 14.821 3.293 0.453 4.501 0.000
Lighting
Factor 10.544 4.631 0.323 2.277 0.035
Lifts Capacity 1.684 3.971 0.052 0.424 0.678
Percentage
Occupancy 5.709 2.339 0.175 2.441 0.025
Number of Computers 30.471 8.747 0.932 3.484 0.002
The final regression model is thus given in (13).
))2.24
6.33(*821.14)
218,3
274,5(*668.3153.143 32 xx
EUI adj
)239
334(*471.30)
13
92(*709.5
4.2
8.8(*544.10 764
xxx (13)
The summary of the regression model through the stages of
backward elimination is given in table IV.
Building age, occupants’ behavior and maintenance factor,
lifts capacity and average indoor air conditioner set
temperature were found to be the less significant factors as
compared to the other factors and thus the final regression
equation excludes them. Chung et al. in a similar study of
supermarkets in Hong Kong eliminated the indoor set
temperature, HVAC equipment, lighting system, occupants’
behavior and number of customers [8].
TABLE IV
MODEL SUMMARY
Model Factor removed R
R
Square
Adjusted R
Square
1 None 0.969 0.938 0.901
2 Building age 0.969 0.938 0.907
3
Occupants behavior and
maintenance factor 0.969 0.938 0.913
4 Lifts capacity 0.968 0.937 0.916
5
Average indoor air
conditioner set temperature 0.966 0.932 0.915
D. The Normalized Buildings’ EUIs
The final regression model was then adjusted to remove the
effect of the significant factors using (11) to give (14), the
normalized EUI equation.
)2.24
6.33(*8.14)
218,3
274,5(*7.31 32 xx
EUIEUI Onorm
)239
334(*5.30)
13
92(*7.5)
4.2
8.8(*5.10 764
xxx (14)
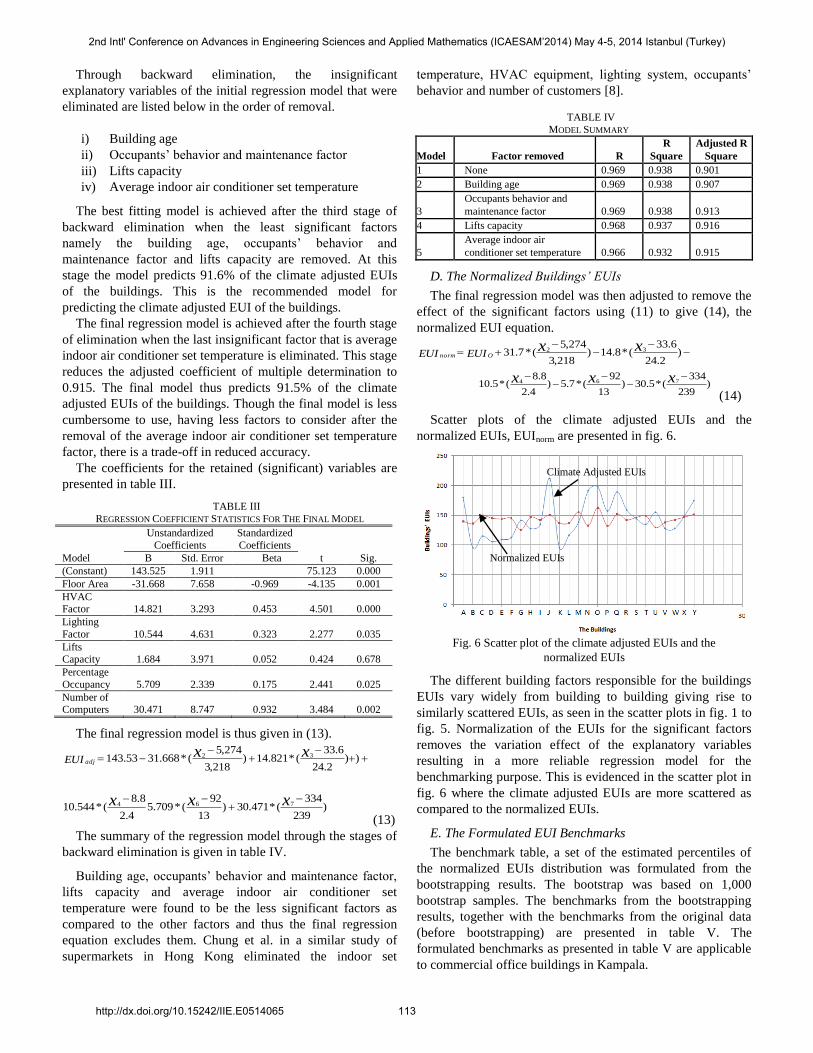
Scatter plots of the climate adjusted EUIs and the
normalized EUIs, EUInorm are presented in fig. 6.
Fig. 6 Scatter plot of the climate adjusted EUIs and the
normalized EUIs
The different building factors responsible for the buildings
EUIs vary widely from building to building giving rise to
similarly scattered EUIs, as seen in the scatter plots in fig. 1 to
fig. 5. Normalization of the EUIs for the significant factors
removes the variation effect of the explanatory variables
resulting in a more reliable regression model for the
benchmarking purpose. This is evidenced in the scatter plot in
fig. 6 where the climate adjusted EUIs are more scattered as
compared to the normalized EUIs.
E. The Formulated EUI Benchmarks
The benchmark table, a set of the estimated percentiles of
the normalized EUIs distribution was formulated from the
bootstrapping results. The bootstrap was based on 1,000
bootstrap samples. The benchmarks from the bootstrapping
results, together with the benchmarks from the original data
(before bootstrapping) are presented in table V. The
formulated benchmarks as presented in table V are applicable
to commercial office buildings in Kampala.
Climate Adjusted EUIs
Normalized EUIs
2nd Intl' Conference on Advances in Engineering Sciences and Applied Mathematics (ICAESAM’2014) May 4-5, 2014 Istanbul (Turkey)
http://dx.doi.org/10.15242/IIE.E0514065 113
Page 7
To rank the energy efficiency of a particular office building,
the normalized EUI, EUInorm is computed using (14).
TABLE V
BENCHMARKS OF THE EUIS FOR COMMERCIAL OFFICE BUILDINGS IN
KAMPALA
Percentile EUInorm
(from sample data)
EUInorm
(from bootstrapping results)
10 131.5 132.6
20 136.6 137.6
30 138.4 138.6
40 142.8 142.7
50 144.1 144.1
60 146.1 146.7
70 147.7 147.3
80 150.4 149.7
90 153.7 152.3
F. Ranking of the Normalized EUIs for the Sample
Buildings
The computed EUI value is then ranked using the
benchmark table. If the EUI lies within the lower 30th
percentile, the building is considered to be energy efficient
compared to similar buildings in Kampala and vice versa. If
the EUI lies within the central 40th
percentile, the building is
considered to be of average energy efficiency.
Using the benchmarks presented in table V, the normalized
EUIs of the respective sample building were ranked as
presented in table VI.
TABLE VI RANKING OF THE BUILDINGS NORMALIZED EUIS
Since buildings B, G, K, L, N, P, U and V lie in the lower
30th
percentile, they are considered to be more energy efficient
as compared to similar buildings in Kampala. Similarly,
because buildings T, C, J, M, O, Q and Y lie in the upper 30th
percentile, they are considered to be less energy efficient as
compared to similar buildings in Kampala with potential for
improvement.
The average values of the explanatory values of the
explanatory factors of these two sets of buildings are presented
in table VII. TABLE VII
COMPARISON OF EXPLANATORY FACTORS AVERAGE VALUES FOR BUILDINGS
IN THE LOWER AND UPPER 30TH PERCENTILES
Factor Buildings G, U, P, N,
B, L, K & V
Buildings T, C, J,
Y, Q, M & O
Floor Area / m2 5,087.38 5604.86
HVAC 28.05 30.79
Lighting 10.35 10.36
Occupancy 93.13 95.71
Number of Computers 303.13 350.14
Buildings T, C, J, M, O, Q and Y consume more energy
than the other buildings because they have less energy
efficient HVAC and lighting systems, as well as higher
occupancy and more computers. The rest of the buildings lie
within the central 40th
percentile and are considered to be of
average energy efficiency. Opportunities for increasing the
energy efficiency of a particular building can be identified by
improving the score of individual explanatory variables. For
example, a score of 10.0 for the lighting efficiency factor is
higher than the average of 8.8. By replacing the lighting
fittings with more energy efficient lighting, providing the
same illuminance at reduced electrical power input, the energy
use would be reduced.
IV. CONCLUSIONS
A. Conclusions
In this research, an energy efficiency benchmarking system
for commercial office buildings in Kampala was developed
using multiple linear regression analysis. The regression
model developed defines the relationship between EUI, the
energy efficiency indicator and the significant factors namely
building internal floor area, installed lighting system, and
installed HVAC system, building occupancy and computers in
the building. The objectives of this research have been
achieved as discussed hereunder:
The measured EUIs were adjusted to cater for climate
change in the past 20 years prior to regression analysis. The
adjusted EUIs average for Kampala is lower than that of USA,
United Kingdom, Australia, Hong Kong, New Zealand and
Cape Town (South Africa). The building factors too were
standardized before the regression analysis.
Multiple regression analysis was then done to establish the
relationship between the climate-adjusted EUIs and the
standardized building factors. By backward elimination, the
initial regression model was simplified to include only the
significant building factors. The building factors most
significant to energy efficiency in the office buildings were
thus identified to be the building total internal floor area, the
installed HVAC equipment, the installed lighting system, the
building occupancy and the total number of computers in the
building. The other factors with effect on energy efficiency
included building age or time since the most recent
renovations, installed passenger lift (s) capacity, indoor set
temperature and occupants’ behavior.
No. Building Normalized EUI Percentile
1 G 125.816 10
2 U 129.785 10
3 P 132.58 10
4 N 133.209 20
5 B 136.281 20
6 L 137.512 20
7 K 137.543 20
8 V 138.536 30
9 A 140.186 40
10 R 142.696 40
11 W 142.878 50
12 I 142.978 50
13 E 144.096 50
14 D 145.172 60
15 F 145.265 60
16 S 146.652 60
17 H 147.124 70
18 X 147.23 70
19 T 149.27 80
20 C 149.694 80
21 J 150.529 90
22 Y 151.94 90
23 Q 152.207 90
24 M 155.84 100
25 O 163.092 100
2nd Intl' Conference on Advances in Engineering Sciences and Applied Mathematics (ICAESAM’2014) May 4-5, 2014 Istanbul (Turkey)
http://dx.doi.org/10.15242/IIE.E0514065 114
Page 8
Using the final regression equation, the dependence of the
climate adjusted EUIs on the significant standardized building
factors was removed hence normalizing the indicator for the
significant factors yielding a normalized regression model.
Using the normalized regression model, a table of energy
efficiency percentiles of the climate adjusted EUIs was
formulated yielding the energy efficiency benchmarking table.
This table is a basis upon which the energy efficiency
performance of similar commercial office buildings in
Kampala can be measured and a means for identifying realistic
targets for improving the energy performance of such
buildings.
Using this benchmarking table, the energy efficiency of the
selected commercial office building was ranked.
B. Recommendations
Awareness of the energy consumption in key infrastructure
of Uganda is important for improved energy efficiency. The
regression model formulated in this research has many useful
applications. It should be used by building owners and
managers to identify opportunities for improving energy
efficiency in particular buildings. For example, through
retrofitting, low efficiency lighting and HVAC systems can be
replaced with modern advanced systems reducing the energy
use intensity of the building. Also, energy saving behaviors
such as switching off lights, HVAC and appliances not in use
as well as conducting energy audits and implementing the
recommendations should be done.
The government should use benchmarking tools to set
performance targets and baselines to be adhered to by energy
end users. The Government of Kenya, through the Energy
Regulatory Commission mandated by the Energy Act 2006
developed Energy Management Regulations 2012 that require
energy efficiency and conservation measures to be put in place
across facilities in all sectors. Taking 2010 as the baseline year
and using various standard and industry specific energy
performance indicators, a study was conducted to establish
benchmarks that would be used to measure the performance of
different facilities [16]. South Africa has set ambitious targets
for improvements in energy-efficiency, aiming for a 15%
improvement by 2015 [15]. The rest of the world has made
advanced efforts to achieve similar improvements for example
the United Kingdom through good practice benchmarks
disseminated by Action Energy, the United States through
Energy Star / Commercial Buildings Energy Consumption
Survey (CBECS) programs run by the United States Energy
Information Administration [17], New Zealand through
Energy Efficiency and Conservation Authority energy audit
database, Hong Kong through Hong Kong University office
energy benchmarking tool and Australia through the
Australian Building Codes Board [14]. The CBECS data
collection exercise is conducted every four years and the data
collection for the year 2012 began in the week of April 15,
2013 and will last approximately six months [15].
C. Limitations of the Study
This study was based on sample buildings of a somewhat
varied grading by virtue of the widely varying building age,
air conditioning coverage, finishing and so on. A
benchmarking system should be developed for each particular
grade of office buildings. Some of the office buildings such as
building A also accommodate other activities such as banking
and cafeterias of much longer working hours and more energy
demands than average offices. Such buildings are of mixed
purpose and should not be compared to wholly office
buildings.
Numerous challenges were encountered in conducting this
study. They included finances, logistics, authorization and
cooperation from research participants.
Financially, failure to obtain funding for this research
required me to devise cost cutting means. For example, instead
of an assisting technician, I worked with the respective
buildings management personnel during the building surveys.
While the daunting exercise of surveying all the buildings
would have taken perhaps almost a year, I scheduled the
research activities to ensure that every single day was used
optimally with flexibility to late hours and weekends when the
situation required.
Gaining authorization to study some buildings was a long,
difficult and largely bureaucratic process lasting up to months.
Usually, much longer time was taken obtaining the permission
than conducting the actual survey.
Information on energy consumption data was not readily
available in most organizations. Many organizations do not
keep centralized records of all their energy consumption. In
some cases, information was possessed by different people
within the organization thus making the reconciliation process
lengthy and bureaucratic.
The limitations notwithstanding, the study was successfully
concluded.
D. Further Research
Further study should be done to develop the other three
types of benchmarks for the different types of buildings, that
is, the points-based rating systems, the simulation model-
based benchmarks and, the hierarchal and end-use metrics as
alternative and complementary options.
Benchmarking the energy efficiency of the major private
and public facilities such as residences, hotels, hospitals,
schools, offices, jails, factories, banks, super markets,
shopping malls and warehouses appropriately categorized
should be carried out under the stewardship of the MEMD,
energy utility companies and leading educational institutions
such as Makerere University. Energy use data pertaining to
each of these buildings should be collected periodically, for
example after every five years, and cooperation from the
building owners and occupants should be made mandatory and
all inclusive, just like the population censuses are conducted.
The survey results are kept in a data base and availed for
reference by researchers both in physical and online libraries.
This research has set precedence in studies already ongoing
2nd Intl' Conference on Advances in Engineering Sciences and Applied Mathematics (ICAESAM’2014) May 4-5, 2014 Istanbul (Turkey)
http://dx.doi.org/10.15242/IIE.E0514065 115
Page 9
around the world and now in East Africa (Kenya) [16] but yet
to be done in Uganda.
REFERENCES
[1] MEMD. (2006). Saving Energy in Uganda's Hotel Industry.
Kampala.
[2] D. van Dirk, and E. E. Khalil, Energy efficiency in buildings. ISO
Focus, 22, 2009.
[3] Clinton Climate Initiative. Building Retrofit. Retrieved from the
Clinton Foundation website:
http://www.clintonfoundation.org/files/cci/cci_overview_buildingr
etrofit _201103.pdf, 2011
[4] J. I. Scrace.. Curbing the growth in UK commercial energy
consumption. Building Research and Information, 29 (1), 51-61,
2001.
[5] Uganda Cleaner Production Center. Uganda’s Initiative in
Promoting Energy Efficiency. Retrieved from the Division for
Sustainable Development, United Nations website:
http://www.un.org/esa/sustdev/csd/casestudies/ e3 _uganda. pdf,
2005, December 6.
[6] C. Filippin, C. Benchmarking the energy efficiency and
greenhouse-gases emissions of school buildings in central
Argentina. Building and Environment, 35 (5), 407–414, 2000.
[7] L. Wen-Shing, and L. Kuei-Peng. Benchmarking the performance
of building energy management using data envelopment analysis.
Applied Thermal Engineering.
doi:10.1016/j.applthermaleng.2008.02.034, 2008.
[8] W. Chung,, Y. V. Hui, and Y.M. Lam. Benchmarking the energy
efficiency of commercial buildings. Applied Energy, 83, 1-14,
2004.
[9] A. B. Birtles, and P. Grigg, P. Energy efficiency of buildings:
simple appraisal method. Building Services Engineering Research
& Technology, 18 (2), 109-114, 1997.
[10] J. K. Monts, and M. Blisset, M. Assessing energy efficiency and
energy-conservation potential among commercial buildings: a
statistical approach. Energy, 7 (10), 861-869, 1982.
[11] Sharp, T. (1996). Energy benchmarking in commercial-office
buildings. Retrieved from
http://www.energy.ca.gov/greenbuilding/documents/background/1
3-ORNL_COM_BLDG_ BENCHMARKING.PDF.
[12] F. Nshemereirwe. Mushroom Cultivation in Uganda. Kampala:
Uganda National Council of Science and Technology, 2004.
[13] L. Perez-Lombard, J. Ortiz, and C. Pout. A review of buildings
energy consumption information. Energy and Buildings, 40 (3),
394-398, 2008.
[14] P. Bannister. Australian Building Codes Board: Class 5
Benchmarking. Belconnen, Canberra, Australia, 2004, July 20)
[15] C. Martin. Generating low-cost national energy benchmarks: A
case study in commercial buildings in Cape Town, South Africa.
Energy and Buildings, 64, 26-31, 2013. [16] Ecocare International Ltd. (2013, February). Energy Performance
Baselines and Benchmarks & the Designation of Industrial,
Commercial and Institutional Energy Users in Kenya. Mombasa,
Kenya.
[17] U.S. EIA. . CBECS. Retrieved August 1, 2013, from U.S. EIA
website: http://www.eia.gov/consumption/ commercial/, ccc 2013
Nelson Mukwaya concluded an MSc in
Renewable Energy from Makerere University,
Kampala, Uganda. He holds a BSc in Electrical
Engineering from the same university. He became
a Graduate Member of the Uganda Institution of
Professional Engineers in 2009, and a Provisional
Corporate Member in 2013.
He is an Electrical Engineering consultant
with GEM Engineering Company Limited,
Kampala, with six years experience in Building
Services in the sectors of commerce, health, education, recreation, and
residence for the government ministries and parastatals, private entities and
non-government organization. He holds a Class B Electrical Installations
permit with the Electricity Regulatory Authority with authority to design and
supervise electrical installation works of heavy low voltage and simple high
voltage connection. He presented a paper titled “Evaluating the Role of
Engineering in Reducing Post Harvest Losses” at the 18th National
Technology Conference under the theme “Engineering and Food Security”.
Peter Okidi-Lating is an Associate Professor,
College of Engineering, Design, Art and
Technology, Makerere University, Kampala,
Uganda. He has Doctorate degrees in
Technology (Makerere University), and
Techno-Science studies (BTH). He is currently
teaching in the Department of Electrical and
Computer Engineering, Makerere University.
His research interests are in Techno science
studies, engineering mathematics, and Innovation Systems and Cluster
Development.
2nd Intl' Conference on Advances in Engineering Sciences and Applied Mathematics (ICAESAM’2014) May 4-5, 2014 Istanbul (Turkey)
http://dx.doi.org/10.15242/IIE.E0514065 116