Operational performance benchmarking for commercial buildings by using text analytics on work order logs and tenant survey data by Saptak Dutta, B.Eng A thesis submitted to the Faculty of Graduate and Postdoctoral Affairs in partial fulfillment of the requirements for the degree of Master of Applied Science in Environmental Engineering Ottawa-Carleton Institute for Environmental Engineering Department of Civil and Environmental Engineering Carleton University Ottawa, Ontario March, 2020 Copyright Saptak Dutta, 2020
Transcript
Operational performance benchmarking for
commercial buildings by using text analytics on
work order logs and tenant survey data
by
Saptak Dutta, B.Eng
A thesis submitted to theFaculty of Graduate and Postdoctoral Affairs
in partial fulfillment of the requirements for the degree of
Master of Applied Science in Environmental Engineering
Ottawa-Carleton Institute for Environmental EngineeringDepartment of Civil and Environmental Engineering
(e.g., hot/cold complaints); (5) complaint type (e.g., lighting complaints); (6) building
floor number; (7) suite number; (8) short description; (9) detailed description; (10)
technician comments; (11) work-order priority; and (12) tenant name.
The ideal scenario for this data would be CMMS records without any entry errors
(e.g., un entered complaint completion dates/creation dates, time stamps which are
reasonable, completed technician comment fields etc). However, as with all datasets a
fraction of the entries were unsuitable for analysis and were excluded from the study.
A majority of these were fields where the complaint creation/completion dates were
not properly entered.
2.2.2 Analysis approach
Complaint creation and completion dates were read as strings by R and converted to
date numbers. By using R packages anytime and lubridate, the response time to a
complaint was calculated as the number of hours from beginning to the completion
of the request. Overall, five different metrics were computed by using the response
time data: overall response time, response time to lighting complaints, response
time to thermal and air quality complaints, response time to janitorial complaints
(e.g., washing carpets, cleaning washrooms, replacing soap) and response time to
maintenance complaints. The complement of the empirical cumulative distribution
was computed to build survival models predicting the likelihood of observing a
period without any complaints. This process was first carried out for all complaints,
and then individually for the four complaint types (i.e., lighting, thermal and air
quality, janitorial and maintenance). Further, the complaints were separated by date
and complaint type (lighting, thermal and air quality, janitorial and maintenance).
The sum of all complaint types between the years 2014 and 2017 was calculated
CHAPTER 2. EXTRACTING PERFORMANCE METRICS USING CMMS 19
and divided by the floor area of the building in order to determine the complaint
intensity normalized by the floor area. The overall complaint intensity per floor area
was derived by adding the complaint intensities of different categories within an
entire year. By using the R package ggplot2, this is demonstrated over a four-year
span using a stacked line chart to show trends in the data.
By using the R package dplyr, thermal (hot/cold) complaints were extracted from the
dataset in order to study the effects of temporal changes on complaint frequency. The
temporal categories used to divide the complaints were as follows: weekdays (Monday
to Friday) and weekends (Saturday and Sunday), Summer (May to August), Winter
(November to February), Shoulder (March, April, September, and October) seasons,
and mornings (before 12 pm) and afternoons (after 12 pm). Probability distribution
functions were then calculated for each categorical split and the mean and standard
deviation were calculated in order to ascertain whether the differences observed in
the temporal effects had empirical significance. Anomalies found while exploring the
thermal and air quality complaints were further investigated by studying the indoor
temperature records extracted from the building automation system. The effects
of outdoor temperature alongside the previous temporal categories on complaint
intensity were studied using decision trees. Daily outdoor temperature data for a
period of four years was obtained from a local weather station and appended to the
complaints. These categories were used to train two decision trees through a binary
recursive partitioning algorithm (using the R package rpart) for hot complaints and
cold complaints, respectively. For verification, multiple trees were built through
repeated random sampling from the complete dataset – i.e., cross-validation.
The complaints were grouped in four categories and all complaints not belonging to
one of the four categories were grouped in as a new category called “other”. Recall
CHAPTER 2. EXTRACTING PERFORMANCE METRICS USING CMMS 20
that these four categories were thermal and air quality, lighting, maintenance, and
janitorial. A matrix of the per floor complaints and their categorical breakdowns
were used to build a Sankey diagram (using the R package networkD3 ). Thicker
Sankey branches indicate greater numbers of complaints. This visualization is
intended to pinpoint problematic areas where there are anomalous complaint rates.
Note that the Sankey diagrams included in this study are static diagrams; while
interactive Sankey diagrams could provide further details.
Text analytics was used on the three text-based data fields containing uncategorized
data. The R packages tm and SnowballC were used to remove punctuation marks,
stop words, suffixes and prefixes. Numbers were removed from the dataset and all
letters were converted to lowercase. A document term matrix is then created from
the processed data for further analysis. The rows of the document term matrix
contain the work-order number and the columns contain all the words used within
the studied document. Words that were very sparse were filtered out and removed.
The document term matrix was used to generate a bar graph of the top 15 words used
in lighting, thermal and air quality, janitorial and maintenance related work-orders.
The ARM method – which is a text mining technique to identify frequent itemsets
within a dataset by using the Apriori algorithm was then employed. In this study,
we employed ARM to identify word combination patterns that were repeatedly
used in describing the work-orders. The most important parameters while dealing
with ARM are support, confidence and lift. Support is defined as a measure of
the proportion of instances in a dataset that an itemset appears (e.g., fraction of
work-orders in which several terms co-exist). A high support value for a rule is an
indication that the rule exists among multiple entries in the dataset. The second
metric confidence represents the proportion of work-orders with the word X where
the word Y also exists. A high confidence value indicates the level of confidence that
CHAPTER 2. EXTRACTING PERFORMANCE METRICS USING CMMS 21
an itemset does not exist based on pure coincidence. Hence, it is favourable to find
itemsets with high support and confidence levels. The third metric lift is a measure
of the probability of a rule appearing together in a dataset divided by the product
of the individual probability that each word making the rule appears separately.
A lift value greater than one suggests that there is a positive correlation between
words X and Y. A value of one suggests no correlation and a value between zero
and one suggests that there exists a negative correlation between the words. The
Apriori algorithm was used to generate a list of word coexistences with pre-defined
support and confidence thresholds (by using the R package arules). Association
node network graphs were built presenting the top rules highlighting top word
combinations in the dataset by support, confidence, and lift. Due to the variation
in the size and complexity of the datasets from individual buildings, the support,
confidence and sparsity thresholds used by the ARM algorithm were manually tuned
for each building. Additionally, words which were unique to the dataset such as the
building manager names, and names of janitorial staff were removed through manual
inspection. Note that while other facilities may have different CMMS work-order and
complaint categories, lighting, thermal and air quality, janitorial, and maintenance
were the only categories available in the CMMS data used in this study. Figure 2.1
demonstrates the workflow that was followed
CHAPTER 2. EXTRACTING PERFORMANCE METRICS USING CMMS 22
Figure 2.1: An overview of the workflow employed in this chapter.
2.3 Results and discussion
In order to derive insights from the data, the extracted complaint logs were analyzed
based on their type and temporospatial distribution. Techniques to analyze and
visualize the complaints were examined. Seven metrics to monitor complaint patterns
and to detect and isolate anomalies were developed. Five of these metrics were
derived from the complaint logs: fraction of complaints unaddressed in a given time
interval, complaint intensity per floor area, temporal distributions of thermal and
air quality complaints, decision tree driven complaint frequencies, and categorical
and spatial breakdown of the complaints per area. Two of them were derived from
operator descriptions while addressing the work-order requests: frequency of key
terms and association node networks.
CHAPTER 2. EXTRACTING PERFORMANCE METRICS USING CMMS 23
2.3.1 Analysis of the complaint logs
Fraction of complaints unaddressed in a given time interval
The survival models shown in Figure 2.1 demonstrate the performance of a building
with respect to how quickly complaints are addressed. For example, the thermal
and air quality and janitorial complaints in buildings four and two took longer to
address compared to the other buildings in the dataset. They had a 75% and 90%
unaddressed rate at the 10-hour mark compared to all the other buildings having
an unaddressed rate of below 50% for those two parameters within the same time
frame. The two buildings underperforming regarding addressing lighting issues
were buildings one and four. They had 78% and 75% of their respective lighting
complaints unaddressed within 15 hours compared to the rest of the buildings having
under 65% of their complaints unaddressed. While building four was an anomaly,
lighting performance issues were expected for building one as the building was going
through a lighting retrofit and many clients had problems with the newly installed
lighting fixtures. The survival curve addressing thermal and air quality complaints
in building four showed that 55% of the complaints went unaddressed within a
10-hour period. This compared unfavourably to the rest of the studied buildings
which had less than 40% of their thermal and air quality complaints unaddressed
in the same time span. One would anticipate that the time taken to address a
work-order should correlate to its severity. Yet the priority of the work-orders field
was not routinely maintained to test this hypothesis. The priority of the work-orders
field contained only two options: high and low priority; and most of the work-orders
were categorized as high priority despite many of them being basic actions. Future
research should investigate the effect of work-order priority on this metric whereby
the severity of the work-orders is better structured. Table 2.2 records the model
CHAPTER 2. EXTRACTING PERFORMANCE METRICS USING CMMS 24
parameters of the ECDF functions for the overall complaints category for all four
buildings.
Figure 2.2: The fraction of unaddressed complaints sorted by category in the build-ings using four years worth of data between 2014 and 2017.
CHAPTER 2. EXTRACTING PERFORMANCE METRICS USING CMMS 25
Building Minimum 1st Quarter Median Mean 3rd Quarter Maximum
1 0.0003 1.0126 2.3081 5.3295 5.3158 24
2 0.0003 0.1883 0.7417 3.0310 2.6103 24
3 0.0006 0.3581 0.7874 1.9550 1.8871 24
4 0.0017 0.5150 1.2842 3.8254 3.5918 24
Table 2.2: An overview of the ECDF model parameters for the overall complaintpatterns in all four buildings.
Complaint intensity per floor area
Stacked line charts are useful for demonstrating the change in complaint intensity
per square meter for a building. As shown in Figure 2.2, interesting observations
for building one include an overall decrease in lighting complaints per square meter
by around 57% between 2014 and 2017. In contrast, janitorial complaints increased
by around 27% in that same time frame. The buildings two and four showed
clear reductions in the number of complaints per square meter at 71% and 77%,
respectively. The largest reductions in complaint intensity observed for building
two were in thermal and air quality and janitorial complaints at 60% and 56%,
respectively. For building three, the most notable reductions were in janitorial and
maintenance complaints at a 54% and 58% decrease, respectively. 2014 was an
outlier for building four as the number of complaints reported was only 24% of the
total 2017 value. The trends in building 1 indicate that facilities management team
were successful in improving their workflows between 2014 and 2016. However, in
2018 there was a major renovation which could have led to disruptions in previ-
ously established maintenance routines causing the increase in complaint intensity.
Further research must be done into the specific causes for the reduction in complaints.
CHAPTER 2. EXTRACTING PERFORMANCE METRICS USING CMMS 26
Figure 2.3: An overview of complaint intensity per floor area sorted by category inthe buildings.
Temporal distributions of too hot/too cold complaints
Probability density functions were used to visualize the temporal variations in the
frequency at which too hot or too cold complaints were logged in building one.
Figure 2.3 shows how the hot and cold complaints vary during the different seasons.
The peak complaint probability for all the categories appeared to be around 10
am. The probability density functions for heating, cooling and shoulder seasons
shared similar structures for both hot and cold complaints. When the shapes
of the density functions for the hot and cold complaints were compared to each
other, they appeared distinct. The hot complaints had a secondary peak which
may have been caused due to overheating of the space because of solar heat gains.
Figure 2.4 presents the probability density functions for the thermal and air quality
complaints throughout the year in order to demonstrate the variation in density
function patterns between the four studied buildings. Building three appeared to
CHAPTER 2. EXTRACTING PERFORMANCE METRICS USING CMMS 27
have the earliest peak in thermal and air quality complaints (approximately 9 am),
indicating that the building may be inadequately conditioned in the mornings as
tenants enter the space. Additionally, it has the most prominent secondary peak for
hot complaints indicating possible overheating during the afternoon. The mean cold
complaint time for building two is at 12:30 pm with a lag of 30-minutes compared
to the other buildings. The mean hot complaint time for building one is at 2 pm
with a three-hour deviation from the means of the other buildings. Building one is
also observed to have the largest standard deviations for the hot and cold complaint
categories. The temporal complaint distribution curves can give building staff the
ability to spot irregularities in patterns such as secondary complaint peaks and tailor
the schedules and setpoints of their HVAC systems accordingly.
Figure 2.4: A breakdown of the temporal variations in the frequency of a) coldcomplaints b) hot complaints and c) the hot complaints compared to the coldcomplaints in building one. The mean and standard deviation are annotatedwith the symbols σ and µ, respectively.
CHAPTER 2. EXTRACTING PERFORMANCE METRICS USING CMMS 28
Figure 2.5: A breakdown of the temporal variations in the frequency of a) too coldcomplaints b) too hot complaints between the four studied buildings. The meanand standard deviation are annotated with the symbols σ and µ, respectively
Inspection of the temporal hot complaint distributions
The anomalies discovered while visualizing the temporal trends found on the
probability density functions in building four were further explored by visualizing
the trend of the average floor temperature for 24 hours over a period of 31 days
in January 2019. Figure 2.5 shows the density distribution alongside the floor
temperatures to compare the timing of the secondary peak in complaint frequency
with the indoor temperature. It can be observed that the secondary peak coincided
in time with the highest average indoor temperature (approximately 22.5°C). This
was a possible indication of an overheating issue within the space causing occupant
discomfort at 2 pm, leading to an uptick in the complaint frequency. The increase in
temperature may be attributed to solar heat gains. The timing of the temperature
increase (during the afternoon) supports this hypothesis as the increasing solar
gains would cause a temperature peak in the space in the afternoon. Ideally, the
hypothesis that the space was overheating would be investigated by exploring the
zone level temperature data on a per floor basis on multiple floors. Unfortunately,
at the time of verification, the inspection was only done on one of the floors because
CHAPTER 2. EXTRACTING PERFORMANCE METRICS USING CMMS 29
temperature data from the rest of the floors were not available. The addition of data
collection capabilities to store the data at the zone-level can be useful for future
analysis. There is also a possibility of non thermal factors causing an irregularity in
the complaint curve. The decrease in complaints at 12:00pm could be attributable
to tenants leaving the office for lunch, and the secondary peak being lower than the
primary peak at the 9 pm- 10 pm time interval could be due to a reduced willingness
to complain as most occupans would leave the space in a short time (approximately
3-4 hours). A second source of uncertainty is the lack of occupancy data in these
floors. Ideally complaints would be normalized by occupancy to account for days
with a lower number of tenants.
Figure 2.6: Visualizations of a) density distribution of hot complaints during thewinter in building four and b) the average temperature on a floor of buildingfour for 24 hours during January 2019
CHAPTER 2. EXTRACTING PERFORMANCE METRICS USING CMMS 30
Decision tree driven complaint frequencies
Decision trees present the effects of temporospatial factors on the number of
hot and cold complaints that are logged in a day. The decision trees shown in
Figure 2.6 were constructed using CMMS complaint data from building one. The
two decision tree models were developed for hot and cold complaints taking into
account four years of complaint logs. The variable n within each tree refers to
the number of 12-hour timesteps in a bin within the dataset. The decision tree
consists of nodes (squares) and leaves (circles). The nodes of the tree quantify
statistically significant splits within the dataset while the leaves demonstrate the
average number of complaints that would occur within a 12-hour timespan. The
three most significant splits found for both the hot and cold decision trees were
days of the week (weekdays/weekends), outdoor temperature and the time of day
(mornings/evenings). Only one hot complaint and three cold complaints were logged
during the four-year study period during weekends. The seasonal effect on the
number of complaints (winter/summer/fall) was found to be significant only when
considering cold complaints. The highest complaint frequency for the cold complaints
tree occurred during summer mornings when the outdoor temperature was less than
10°C, indicating that the space was being over cooled. The two highest complaint
frequencies occurred only during the summer months with the tree splitting the
winter and shoulder season cold complaints separately. The highest average rate
of too hot complaints occurred on weekdays when the outdoor temperature was
greater than 22.5°C. This can be interpreted as building one struggling to provide
the adequate cooling on warmer days. It should be noted that the highest average
number of complaints were located in bins which only have a small number of time
intervals. Ideally the decision trees would be developed on datasets with a larger
number of data points for a more representative spread of data. The decision trees
CHAPTER 2. EXTRACTING PERFORMANCE METRICS USING CMMS 31
provide insights regarding conditions associated with high hot/cold complaint rates,
which can be used to inform seasonal and daily changes in the operating schedules
and setpoints of the building HVAC systems. Considering that building one has a
modern BAS, these insights could easily be used in making such operational decisions.
Figure 2.7: Decision trees demonstrating average complaints per 12 hour timespancreated for a) hot complaints and b) cold complaints trained using temporalvariations e.g. weekdays/weekends, mornings/evenings and outdoor tempera-tures. The term Tout (°C) stands for the outdoor temperature.
Categorical and spatial breakdown of the complaints per area
Sankey diagrams provide a visualization for the categorical and spatial breakdown of
the complaints. For example, often only a few floors and complaint categories account
for a large fraction of the complaints. Presenting a per floor and category breakdown
CHAPTER 2. EXTRACTING PERFORMANCE METRICS USING CMMS 32
of the complaints provides insights into areas where problems are expected and areas
where key operational improvements can be made to improve tenant satisfaction.
For example, the largest category of complaints originating from the third floor of
building two was related to lighting (see Figure 2.7). The most frequent action in
response to these lighting-related complaints was changing the ballasts. This is
expected as the studied buildings had been retrofitted with new fluorescent lighting
fixtures. A common reason for lighting failures is due to the old ballasts being used
on new fluorescent lighting fixtures despite being incompatible. The two prevalent
issues under the janitorial complaints category were the requests for cleaning carpets
and removing the garbage. Having a more frequent maintenance schedule for carpet
cleaning and waste management would address these common issues and could have
a positive impact on tenant satisfaction and comfort. Table 2.2 lists all floors with
irregularities found through the exploration of Sankey diagrams for all four buildings.
Figure 2.8: Example of a categorical and spatial breakdown of complaints in buildingtwo.
CHAPTER 2. EXTRACTING PERFORMANCE METRICS USING CMMS 33
Table 2.3: A Summary of floors with noted irregularities in the dataset.
BuildingFloors
with irregular numbers of complaints
Irregularity
description
One
3 89% more complaints than floor average
1279% more complaints than
floor average
640% more complaints than
floor average
568% lighting
complaints
1354% lighting
complaints
Two2
38% thermal and air
quality complaints
326% lighting
complaints
ThreeMain
32% maintenance
complaints
1223% janitorial
complaints
Four4
35% janitorial
complaints
821% thermal and air
quality complaints
CHAPTER 2. EXTRACTING PERFORMANCE METRICS USING CMMS 34
2.3.2 Analysis of the work-order logs
Frequency of key terms
Terms in the dataset appearing with the greatest frequency can help pinpoint
key trends/problems that operators face when they resolve complaints. Bar
graphs were used to present the top 15 words used in the order of frequency in
the dataset. Notably, the top issues the building operators encounter in each
of the four complaint categories are replacing ballasts, adjusting temperature
setpoints, assigning technicians, and unplugging toilets. Figure 2.8 represents the
top 15 terms used by building operators when responding to complaints of the
four studied categories for building one. The results from the frequency graphs
display terms which are expected to be used for the corresponding complaint
categories. For example, the most repeated words in the context of thermal and
air quality complaints were “adjust”, “thermostat”, “air” and “vav”. There does
exist some overlap in terminology between complaint categories such as the term
“toilet” being used commonly for both maintenance and janitorial complaints.
However, it is important to look into the context of these words – maintenance com-
plaints regarding toilets also have the terms change, replace, leak and repair as the
top terms while janitorial complaints have the terms unplug, replace, clean and paper.
CHAPTER 2. EXTRACTING PERFORMANCE METRICS USING CMMS 35
Figure 2.9: The top 15 terms used for a) thermal and air quality b) lighting c)maintenance and d) janitorial complaints.
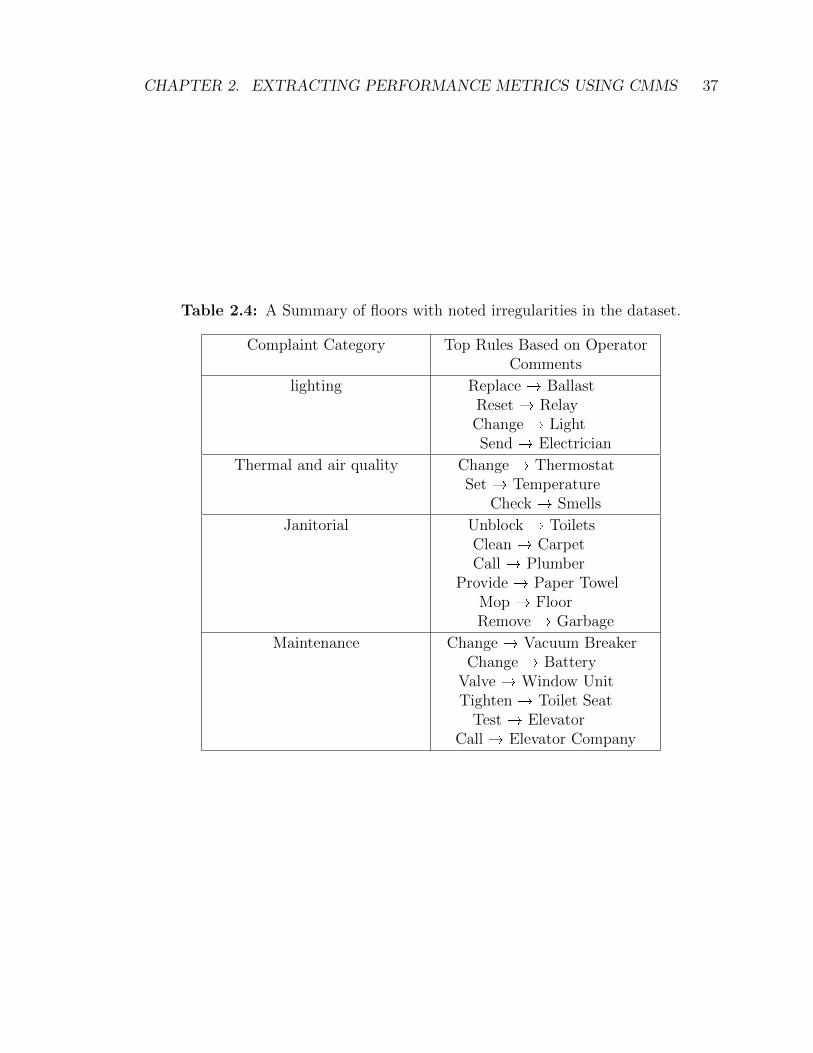
Association node networks
Association node networks allow for the easy interpretation of the top rules identified
by the ARM technique using the support/lift/confidence parameters. Larger nodes
indicate a greater term frequency within the analyzed dataset. Darker nodes
signify rules with a greater lift. Table 2.3 contains a list of the most prominent
rules discovered when exploring the data sorted by complaint category for the
entire dataset. Interesting rules which were observed included changing the toilet
vacuum breaker mechanism and repairing the valve for perimeter heating units
(window units) for maintenance-related complaints. Figure 2.9 shows a graphical
representation of the rules that were discovered when exploring the irregularities
found in maintenance related complaints on floor 12 of building one. This is a
subset of the maintenance-related rules found in the maintenance category of Table
CHAPTER 2. EXTRACTING PERFORMANCE METRICS USING CMMS 36
2.3. It is evident that looking at the maintenance-related complaints in building
one that operators are frequently changing the batteries on vacuum breakers
(inside toilets), replacing the valves on the window unit heaters and tightening
toilet seats. Repetitive use of these algorithms is required on real world datasets
in combination with a theoretical understanding of their back end in order to
generate meaningful insights. Often colloquialisms are not included within the pre
filtering process which may make the first several runs of this algorithm generate
rules which are not meaningful. Additionally, there is a trial and error compo-
nent to optimizing the algorithm parameters such that insightful results are obtained.
Figure 2.10: Association rules for maintenance related complaints in floor 12 ofbuilding one.
CHAPTER 2. EXTRACTING PERFORMANCE METRICS USING CMMS 37
Table 2.4: A Summary of floors with noted irregularities in the dataset.
Complaint Category Top Rules Based on OperatorComments
CHAPTER 2. EXTRACTING PERFORMANCE METRICS USING CMMS 38
2.3.3 Unresolved issues and future work
The CMMS analytics method presented in this study has several limitations that
need to be addressed as future work:
� The method consolidates a large underutilized data source (i.e., complaint and
work-order logs) to a form that is suitable for human interpretation. We en-
vision that metrics derived by this method can be used to understand how
operational resources are used, to identify abnormal floors, equipment, and
work-order categories, and to improve operational performance. However, we
did not investigate how facility managers use these metrics in practice. As fu-
ture work, we will design a survey and conduct interviews with operators and
facility managers to better understand how they use operational performance
metrics.
� The availability of CMMS data in existing buildings differ substantially. For
example, severity of the work-orders was not a routinely maintained field in the
buildings of this study. In other facilities, operator work-order descriptions can
be more or less detailed which may hinder the transferability of the method
to other buildings. Future research is needed to standardize the CMMS fields
and operational data collection practices in large commercial and institutional
buildings.
� An issue that is yet to be resolved is the definition of the ARM parameters
when the Apriori algorithm is applied to datasets of different characteristics.
Currently, the support, confidence and lift parameters for each building and
floor need to be tuned manually to generate meaningful rules and association
node networks. A future study is needed to assess the viability of automating
this process such that the users do not need to tune the hyperparameters of
CHAPTER 2. EXTRACTING PERFORMANCE METRICS USING CMMS 39
the algorithm to every new dataset it is applied to. A future implementation of
these metrics in a commercial environment would have preset parameters which
could be used by facilities management teams without the need for expertise in
text mining.
� The use of multiple terms by different operators in explaining the same issue
introduces inaccuracies to text mining algorithms. In the future, the appropri-
ateness of natural language processing algorithms should be examined so that
synonymous terminology can be detected.
� Text mining using ARM is only one way to gather insights from the dataset
of work-orders. Methods such as topic modelling (using Latent Dirichlet Al-
location and Non-negative Matrix Factorization) can be used to find naturally
occurring subtopics within the work-orders and natural language processing
(using lexicon and classifier based sentiment analysis) can potentially allow for
complaints to be categorized into a hierarchy of severity using pretrained com-
plaint data. Future work will build on the methods used in this study and
integrate new techniques to extract further information from CMMS data.
� This study presents a methodology and a workflow by which CMMS data can be
extracted and analyzed in order to draw conclusions about tenant satisfaction
and building performance. The metrics that are developed require significant
knowledge of programming in order to reproduce. Future work will include the
development of a software toolkit for text mining and visualization of CMMS
data using the R package Shiny. The prototype software tool will be used to
present these metrics to an operator or building manager with a simplistic user
interface. The software tool will be deployed over a local server so that any
employee with access to the building network will be able to view these metrics
CHAPTER 2. EXTRACTING PERFORMANCE METRICS USING CMMS 40
through an online browser-based system. A limitation of this study is the lack
of feedback from building operators. Building operators were not interviewed
prior to the release of this study in order to discuss their feedback of the metrics.
Interviews with operators will be carried out after the software tool development
phase and iterative improvements will be made to both the software tool and
the metrics.
� Another potential limitation for the transferability of the findings of this study
is the absence of a CMMS in other buildings. The study was feasible on the
four selected buildings due to the availability of a CMMS with four years of
complaint and work-order logs. Even though such systems are common in large
commercial and institutional buildings, some commercial buildings may not
have them. In the future, the adoption of CMMS will allow metrics like the
ones developed in this study to be applied to a broader range of buildings.
2.4 Conclusions
This study demonstrates how complaint logs and operator comments stored within
computerized maintenance management systems can be used to extract operational
performance metrics. A categorical and spatial breakdown of the complaints shows
that complaints are concentrated around only a few floors of a building. Furthermore,
a detailed analysis of the floor-level complaints shows that only certain complaint cat-
egories contribute to a majority of the recorded complaints. Temporal breakdowns
demonstrated that all four buildings experienced a peak complaint frequency for both
hot and cold complaints around 12 pm. A detailed analysis of the thermal and air
quality complaints for the buildings varying with seasonal changes demonstrated that
CHAPTER 2. EXTRACTING PERFORMANCE METRICS USING CMMS 41
the hot and cold complaints had distinctive frequency distributions, with hot com-
plaints featuring a prominent secondary peak in complaint intensity. A decision tree
trained using temporal and thermal variations found that the highest probability of
thermal and air quality complaints occurred on only a very small number of days
during the shoulder season. Following these findings, further insights were devel-
oped by systematically extracting information through a text mining algorithm to
explain the root-causes of the floor-level anomalies. Text mining building-level op-
erator work-orders with a per category breakdown also reveals several key areas of
repeated complaints that are common to all the floors of a studied building.
The use of ARM technique provides facility managers a more detailed insight into
the work that operators undertake by creating dependencies among terms likely to
be related to each other in the dataset. The Apriori algorithm was used to create the
association rules needed three tuning parameters: support, confidence and lift. These
parameters had to be individually tuned for each building in order to create mean-
ingful rules. The most frequent issues that operators faced were replacing ballasts,
changing zone temperature setpoints, unblocking toilets, and changing the vacuum
breakers in washrooms, respectively. The rules indicating the co-dependencies were
graphically represented by using association node networks. This resulted in an intu-
itive way for non-technical personnel to interpret the insights revealed by the ARM
algorithm.
This study contributes to the literature by developing a method for extracting op-
erational performance metrics from CMMS data using established text mining and
visualization techniques such as the ARM, survival curves, stacked line curves, Sankey
diagrams and decision trees. Previously, only a few studies have explored the viability
of using CMMS to benchmark operational performance of buildings. However, this
CHAPTER 2. EXTRACTING PERFORMANCE METRICS USING CMMS 42
study is unique in applying innovative techniques to develop a suite of operational
performance metrics from common CMMS data categories.
Chapter 3
Insight extraction using tenant surveys
3.1 Introduction
Occupant satisfaction is a critical parameter for facility managers and surveys are
powerful tools which allow managers to obtain valuable data and insights from
their tenants [25]. Energy managers often seek to implement energy efficiency
measures, but the impacts of those measures on tenant comfort and satisfaction
must be quantifiable. This is because while the priority for an energy manager
may be energy savings; tenants are usually more concerned for their comfort. For
example, occupant surveys for Green Star rated buildings in Australia were used to
demonstrate that there were differences in the perceived benefits of green workspaces
between management and employees [26]. It was found that certain energy saving
measures implemented by the management led to tenant dissatisfaction and could
be counterintuitive to management’s perception of the implementation of green
building programs. Recognizing such areas of dissatisfaction from tenants should be
an important goal for energy managers as well, since occupant behavior has been
shown to have significant impacts on the energy consumption of a facility [27].
The traditional mechanism to assess occupant satisfaction with the indoor envi-
ronment is to conduct tenant surveys [9]. Tenant survey datasets contain valuable
43
CHAPTER 3. INSIGHT EXTRACTION USING TENANT SURVEYS 44
information to benchmark building operational performance and identify anomalies
but the traditional process of hiring employees to read through survey data and
extract insightful information can be time consuming and labour-intensive – this
is specifically applicable to survey data from large commercial institutions which
may span over several years and may contain thousands of entries. Advances in
text mining techniques such as sentiment analysis, topic modelling and association
rule mining play an important part in the feasibility of incorporating text analytics
as a factor in analyzing the effectiveness of building operations and maintenance.
The importance of monitoring occupant satisfaction and workplace productivity is
critical for facilities management teams, and it is recognized by today’s building
standards. For example, WELL standard recognizes the importance of monitoring
occupant comfort and recommends occupant comfort surveys in buildings with 10
or more occupants with a participation rate of at least 30% once per year [28]. If
survey results are to play a key role in the way operators and facilities managers
use tenant feedback to modify their workflows, new analytical workflows must be
developed from existing techniques that allow them to extract insights from free text
in an efficient and intuitive manner.
3.2 Literature review
The potential of using occupant-centric benchmarks at a high resolution has been
a popular topic of research. Free-text occupant survey responses are a source of
occupant centric data; however, they can be too large and unstructured for manual
interpretation. Alternative data sources have been utilized by researchers in order
to gain insights into occupant satisfaction. One of these alternative data sources
CHAPTER 3. INSIGHT EXTRACTION USING TENANT SURVEYS 45
is human resources databases. For example, Newsham et al. carried out data
analytics on a large corporate human resources database to extract metrics such
as absenteeism, sick days and employee job satisfaction and performance [13, 29].
They compared these occupant satisfaction metrics in 46 buildings – 13 of which
were LEED certified; and demonstrated that manager assessed job performance
was slightly greater in the LEED certified buildings than the rest. Despite these
case studies demonstrating the use of human resources data to extract metrics for
occupant satisfaction, due to privacy and security concerns it may be difficult for
facility managers to gain access to these datasets.
Computerized maintenance management system data may also be used as a proxy
to monitor occupant comfort levels as well as operator workflows and schedules.
Advances in the CMMS technology have led to it being commonly used in most
large commercial buildings. The rise in popularity of scripting languages such as R
and Python have also made these large databases simpler to analyze [30]. A few
studies have made use of CMMS data in building performance analysis in order
to classify building-level work orders [21], analyze and model thermal complaint
frequencies [23,31], and calculate component-level fault-frequency rates [33]. CMMS
data have also been utilized in order to create high resolution temporal and spatial
performance metrics for large commercial buildings as well as to predict thermal
complaint rates given temporal categorical variables (e.g., time of day, day of week)
and outdoor temperature-based parameters [34]. In a recent study, two years of
CMMS data from a variety of buildings (offices, schools, laboratories, etc.) have
been text mined in order to extract common maintenance requests and the most
common work order types and user complaint categories were documented [24]. In
another study, historical work order data have been analyzed in order to explore
the trends in frequent maintenance activities in educational institutions showing
CHAPTER 3. INSIGHT EXTRACTION USING TENANT SURVEYS 46
that the majority of work orders are related to HVAC, electrical, and maintenance
activities [35]. Interestingly, the analysis does not indicate that older buildings have
a higher number of work orders and concludes that there needs to be more research
to better understand the work order frequencies in different building types. They
also recommended better subcategorization of data stored within the CMMSs – e.g.,
electrical work orders can be categorized as lighting and switch issues.
The ability to control indoor temperature is known to improve perceived com-
fort [25, 36]; and, occupants in many modern office buildings are offered a limited
thermostat override capability (e.g., ±2°C from a default setpoint). Thermostat over-
rides provide insights into the frequency of thermal discomfort instances (discomfort
enough to trigger a setpoint change) and their zone-level breakdown as well as indoor
conditions that trigger these events [37]. For example, Gunay et al. developed models
to predict the frequency of setpoint change requests at different indoor and outdoor
temperatures and explored the potential of applying setpoints which minimize the
thermostat interactions [38]. However, the hypothesis that indoor conditions that
minimize the frequency of adaptive actions are the personalized comfort conditions
has yet to be proven [39]. Researchers need to demonstrate the viability of treating
adaptive behaviours as a proxy to comfort.
Mobile applications (e.g., cozie) for smartwatches and phones can be used to
facilitate the collection of comfort data. For example, in a case study, Jayathissa et
al. collected 1460 responses from 15 occupants over a month by using a smartwatch
application [40]. Tenants were prompted to provide thermal comfort feedback at
five intervals during a workday. The insight from the resulting comfort feedback
data was used in conjunction with the temperature data to separate tenants into
four groups based on their likelihood of being satisfied based on a cooler or warmer
CHAPTER 3. INSIGHT EXTRACTION USING TENANT SURVEYS 47
setpoint. The results indicated four separate groups of users: those which are
satisfied in cooler environments, those that are sometimes satisfied regardless of the
temperature, those that are always satisfied, and those that are comfortable most of
the time. The results of this analysis can be used in making operational decisions
such as recommending different zones for occupants who belong to different comfort
profiles and developing energy saving opportunities through personalized controls.
Because it is often more difficult to apply data analytics and machine learning
techniques on text-based data compared to traditional numerical data sources,
surveys commonly ask occupants to rate their comfort or satisfaction levels regarding
a certain issue on a numerical scale. However, the downside of this method compared
to free text surveys is the gap that exists between the survey creator and the survey
respondent. Respondents may not get to fully express the underlying issues in a
survey where they have no control over the fields of input. Free text surveys, however,
are difficult to manually analyze (especially in large commercial and institutional
buildings with many tenants / occupants) and require time and effort to interpret.
Manual interpretation of text-based data to extract operational performance metrics
can be impractical. This disparity grows larger with datasets of larger sizes. If
we aim to incorporate text-based tenant surveys as performance indicators for
tenant satisfaction and workplace productivity, more robust tools must be developed
to either automate or significantly reduce the time and effort required to draw
quantitative observations from these highly unstructured data sources. In this study,
we are developing a text mining method to analyze the information contained within
free text surveys and demonstrating the functionality of sentiment analysis and topic
modelling algorithms on survey data from a commercial building in Ottawa, Canada.
Text analytics is a process by which large bodies of textual data are analyzed
CHAPTER 3. INSIGHT EXTRACTION USING TENANT SURVEYS 48
to derive insights and identify patterns. It is generally comprised of three steps:
preprocessing, text mining, and postprocessing. Text mining operations are the
most significant aspect of text analysis and include techniques such as association
rule mining (ARM), clustering, and pattern discovery. Text mining represents an
untapped opportunity to extract insights from a survey dataset. Several studies have
shown the value of having free text comments integrated within non-linear survey
questions regarding comfort distributed among tenants, as these provide venues for
tenants to provide their own perspective to the facilities management team [41].
However, textual data tend to be overlooked in the field of building performance as
their analysis requires tools which till recently were not widely available [42]. To this
end, this study presents a natural language processing-based text mining method to
extract operational insights from tenant surveys. The method is demonstrated in a
case study building. The effectiveness of several text mining techniques is examined,
their shortcomings are identified, and future work recommendations are developed.
3.3 Methodology
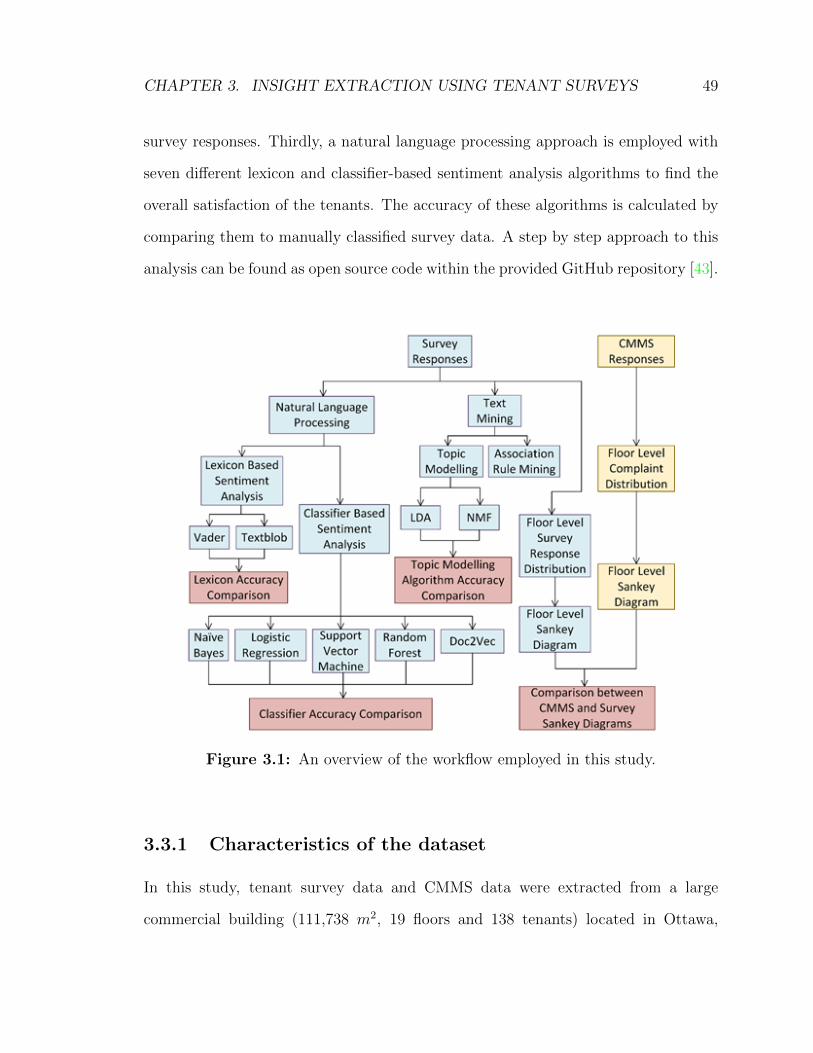
As illustrated in Figure 3.1, The methodology involves three separate approaches to
analyze survey responses. First, a visual approach is employed to compare the survey-
based floor-level complaint distributions to the service requests recorded in a CMMS.
This is intended to ascertain if the complaint patterns within a solicited source of
feedback (surveys) would be representative of the complaint patterns. Secondly, a
text mining approach is employed using ARM and two different topic modelling
algorithms: Latent Dirichlet Allocation (LDA) and Non-Negative Matrix Factoriza-
tion (NMF). This is intended to extract key terms and topics found throughout the
CHAPTER 3. INSIGHT EXTRACTION USING TENANT SURVEYS 49
survey responses. Thirdly, a natural language processing approach is employed with
seven different lexicon and classifier-based sentiment analysis algorithms to find the
overall satisfaction of the tenants. The accuracy of these algorithms is calculated by
comparing them to manually classified survey data. A step by step approach to this
analysis can be found as open source code within the provided GitHub repository [43].
Figure 3.1: An overview of the workflow employed in this study.
3.3.1 Characteristics of the dataset
In this study, tenant survey data and CMMS data were extracted from a large
commercial building (111,738 m2, 19 floors and 138 tenants) located in Ottawa,
CHAPTER 3. INSIGHT EXTRACTION USING TENANT SURVEYS 50
Canada. Survey response data is a form of solicited feedback (i.e. the tenants
are prompted for feedback on their comfort) whereas CMMS data is a source of
unsolicited feedback (i.e. the tenants log complaints themselves without any request
from the facility managers). CMMS data was obtained from servers hosted by a
third-party provider hired by the facility managers to catalogue tenant complaints,
whereas surveys were completed by individual tenants at the end of a year to give
them an opportunity to share their opinions with the facility. Tenants have the
option to contact the third-party CMMS service through a phone call or online. Once
a tenant logs a complaint, the CMMS operators generate a work order to address the
issue. Building technicians are then asked to address the complaint and enter the
description of the methodology they undertook to resolve the tenant’s complaint.
There were 215 survey entries, with each survey entry prompting the tenant for
feedback on thermal and maintenance related concerns. Hence, the total dataset
had 430 surveys responses for analysis. The floor number corresponding to the
rented space for each respondent in the survey was present alongside their survey
response entry. These responses are samples of solicited feedback whereby the facility
managers received suggestions. The two data fields used to compare similarities
between the CMMS and the survey data are the complaint type (e.g. thermal
complaints, maintenance complaints) and the floor number. The survey responses
were typed out in the appropriate fields by individual tenants in the building through
an online form. The results from that form were made available to the authors for
research purposes by the facility managers. It is important to note the difference
between the survey and CMMS datasets. While the latter has highly structured data
entries allowing for easy data extraction and analysis, the survey responses provide
only a high-level complaint category (thermal / maintenance), floor number, and the
free form text which is more challenging to analyze than simple numerical entries.
CHAPTER 3. INSIGHT EXTRACTION USING TENANT SURVEYS 51
The ideal free text dataset would contain text based data relevant to the survey
categories, with the text being non repetitive, brief and descriptive with a high
number of key words and a lack of colloquialisms. Unfortunately such well structured
text based data is rarely found in real world datasets and processing of the data is
required before insights can be extracted from it. The following section contains a
detailed description of the pre processing steps which were utilized in order to make
the data suitable for analysis.
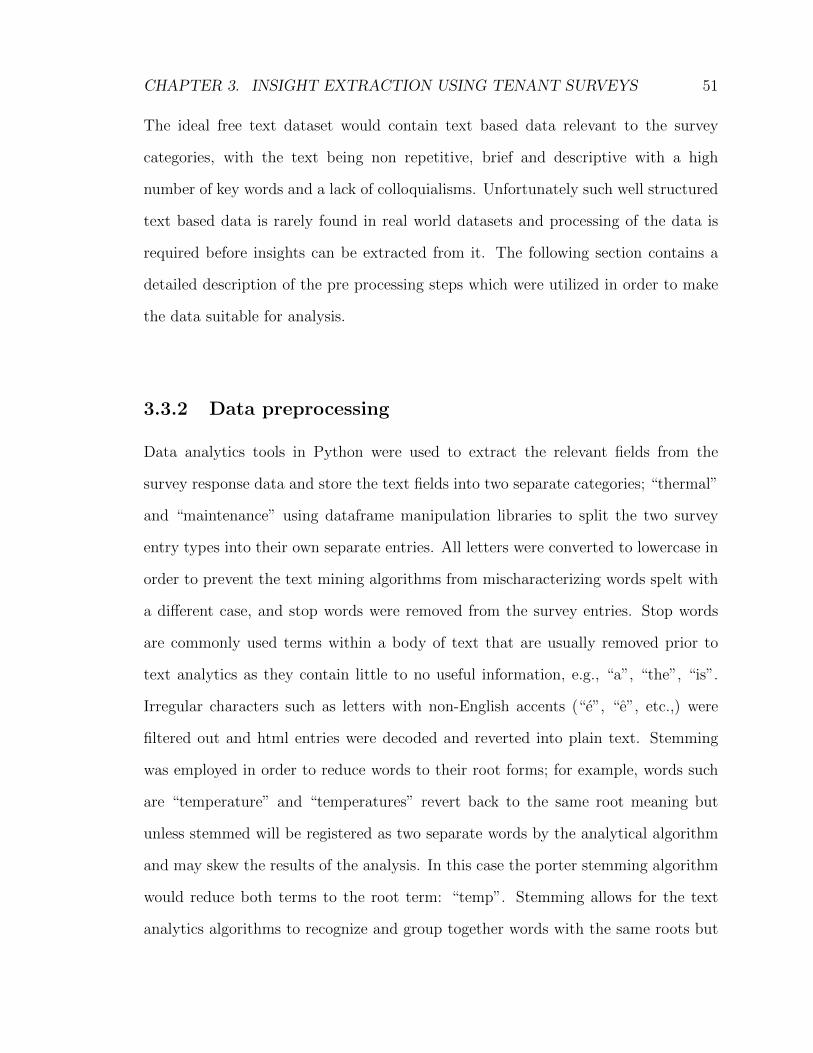
3.3.2 Data preprocessing
Data analytics tools in Python were used to extract the relevant fields from the
survey response data and store the text fields into two separate categories; “thermal”
and “maintenance” using dataframe manipulation libraries to split the two survey
entry types into their own separate entries. All letters were converted to lowercase in
order to prevent the text mining algorithms from mischaracterizing words spelt with
a different case, and stop words were removed from the survey entries. Stop words
are commonly used terms within a body of text that are usually removed prior to
text analytics as they contain little to no useful information, e.g., “a”, “the”, “is”.
Irregular characters such as letters with non-English accents (“e”, “e”, etc.,) were
filtered out and html entries were decoded and reverted into plain text. Stemming
was employed in order to reduce words to their root forms; for example, words such
are “temperature” and “temperatures” revert back to the same root meaning but
unless stemmed will be registered as two separate words by the analytical algorithm
and may skew the results of the analysis. In this case the porter stemming algorithm
would reduce both terms to the root term: “temp”. Stemming allows for the text
analytics algorithms to recognize and group together words with the same roots but
CHAPTER 3. INSIGHT EXTRACTION USING TENANT SURVEYS 52
different suffixes.
The text preprocessing stage is critical to an accurate analysis as the presence of
stop words and similar words with mismatching cases can detrimentally affect the
performance of ARM and topic modelling algorithms. CMMS data were analyzed in
order to group the thermal and maintenance complaints on a per floor basis. The
data were read and incomplete entries in the database (i.e., mislabelled categories,
floors etc.) were removed from the dataset. The complaints belonging to the
categories “Thermal” and “Maintenance” were filtered out into a new data frame
and a matrix of the per floor complaint distributions for the complaint categories
“Thermal” and “Maintenance” were created. The matrix was used to build a Sankey
diagram for the unsolicited complaint distribution demonstrating the spatial and
categorical patterns in the distributions of the complaints. An identical methodology
was followed with the tenant survey dataset and a similar spatial and categorical
Sankey diagram was generated using it. The top five floors where the highest
numbers of complaints were recorded and compared between both datasets.
3.3.3 Text mining algorithms
Text mining algorithms were employed on the tenant surveys in order to discover
hidden semantics using unsupervised learning techniques. ARM is a text mining
technique to identify frequent item sets within a dataset by using the Apriori algo-
rithm. In this study, we employed the ARM technique to identify word combination
patterns that were repeatedly used in describing work orders. The most important
parameters while dealing with ARM are the support, confidence and lift of the
association rules. Support is defined as a measure of the proportion of instances
CHAPTER 3. INSIGHT EXTRACTION USING TENANT SURVEYS 53
in a dataset that an itemset appears (e.g. fraction of work orders in which several
terms co-exist). A high support value for a rule is an indication that the rule exists
among multiple entries in the dataset. The second metric confidence represents the
proportion of work orders with the word X where the word Y also exists. A high
confidence value indicates the level of confidence that an itemset does not exist
based on pure coincidence. Hence, it is favourable to find itemsets with high support
and confidence levels. The third metric lift is a measure of the probability of a rule
appearing together in a dataset divided by the product of the probability that the
terms making the rule appear separately. A lift value greater than one suggests that
occurrences of words X and Y are dependent on each other. The Apriori algorithm
was used to generate a list of word coexistences with pre-defined support and
confidence thresholds. The ARM method is applied on the tenant survey responses,
and the frequently co-occurring terms for the thermal and maintenance-related
comments are graphed and highlighted.
Topic modelling is an unsupervised approach to discovering repetitive “topics” or
“themes” which occur frequently in bodies of text. LDA is used to model topics in
a document. Documents with similar topics use similar groups of words. Latent
topics are discovered by groups of words in a text corpus that occur together within
documents. While a simple bag of words model focuses on word frequencies, LDA
uses probability distributions. LDA creates a statistical model for discovering
abstract topics occurring in a collection of documents [44] allowing for the extraction
of key features and information from an otherwise difficult to analyze data medium.
NMF is a feature extraction algorithm which separates out contextual patterns
within a body of text. NMF takes in a document term matrix (DTM) as input where
each column represents a document, each row of the column indicates the weight
of a word contained in the document. It creates a set of topics based on weighted
CHAPTER 3. INSIGHT EXTRACTION USING TENANT SURVEYS 54
sets of co-occurring terms by breaking down the original DTM and contributing the
attributes until contextual features are found. For example, the terms hot and cold
may appear in a document related to complaints about washrooms in relation to
complaints regarding the temperature of the tap water as well as in complaints about
heating and cooling setpoints causing thermal discomfort. Each of these would be
recognized by NMF as a separate context and the separate topics would be created.
Both the NMF and LDA algorithms are applied to each set of tenant complaints.
After a sensitivity analysis process assessing the interpretability of the topic outputs
as a greater number of topics were added to the algorithm, it was determined that
six topics were optimal for the analysis.
A lexicon-based sentiment analysis algorithm consults a standard database of
commonly used words. Each word carries a positive or negative connotation and
contributed to the overall polarity (positivity / negativity) of a body of text.
Searches for negations are added to lexicon-based sentiment analysis algorithms
which allow for a sentiment to be reversed if a negation such as “not” is placed
before an adjective contributing to overall polarity [45]. Lexicon based sentiment
analysis methods are computationally less intensive and can be useful in deciphering
polarity for shorter bodies of text. They also do not require manual training which
decreases the amount of effort put into the analysis of a textual dataset. The
disadvantage of this method is the dependence on standard dictionaries of words to
carry out sentiment analysis. While this method may be applicable for analysis on
generic comments, terminology specific to HVAC systems in buildings may not be
recognized and their contributions to the overall polarity of a sentence can be lost. It
is possible in most algorithm libraries to manually add specific terminologies in order
to obtain a more accurate sentiment, however, doing to adds time to the analytical
workflow. For the purposes of this study, we employed two lexicon-based sentiment
CHAPTER 3. INSIGHT EXTRACTION USING TENANT SURVEYS 55
analysis packages (Vader and TextBlob) available in Python. Textblob and Vader
were chosen for the purpose of this analysis since they are commonly used libraries
and are two of the most widely established and used lexicon-based sentiment analysis
approaches used in the field of text mining. The accuracy of both algorithms with
respect to identifying negative and positive comments was compared to each other
and to other sentiment analysis methods. In order to evaluate the accuracy of the
lexicon-based sentiment analysis algorithms, the dataset was manually classified into
a binary score (neutral / negative) and the polarity score output from the survey
comments was converted to a similar binary score. The binary classification was
defined from neutral to negative as only an insignificant fraction of the comments
within the dataset (less than 1%) were found to be positive. This was expected as
tenants completing these surveys are usually making their concerns associated with
the building heard, and not reporting their positive experiences. All polarity values
zero or less were considered to be negative while the polarity values greater than
zero were considered to be neutral. The output from the lexicon algorithms was then
compared to the manual classification and a percent accuracy for the derived classes
was calculated.
Classifier based sentiment analysis techniques make use of supervised machine
learning. The dataset is divided into two predefined fractions: training and val-
idation. A pipeline of operations is defined where each entry within the dataset
(containing text-based survey responses) is first vectorized and then turned into a
term frequency-inverse document frequency (TF-IDF) format. The training set is
classified binomially (neutral / negative) and used to train the classifiers. The trained
classifier is used on the validation set in order to obtain insights on the dataset.
The advantage of a classification-based approach to sentiment analysis is that the
classifier can be trained to identify specific terminology for specific datasets such as
CHAPTER 3. INSIGHT EXTRACTION USING TENANT SURVEYS 56
thermal and lighting complaints in a building. This lends to a specialized solution
for sentiment analysis compared to a lexicon-based approach. The disadvantage
of classifiers is that they take time and effort to train compared to lexicon-based
approaches. Six different classifiers were trained and validated on the dataset: naıve
Bayes, logistic regression, decision tree and random forest, support vector machines,
and Doc2Vec classifiers.
The naıve Bayes classifiers (Python: sklearn, MultinomialNB) use the Bayes’ theorem
which defines the probability that an event will occur, given prior knowledge of
the conditions that may be related to the occurrence of the event. A naıve Bayes
classifier will split up all the words of a survey response in the training set and assign
a probability for each word contributing to the outcome of the survey response being
positive or not being positive. The per sentence probability for being either negative
or neutral is then computed and the decision with the highest probability is selected
as the class which the sentence belongs to. In this way, we assume that each term
found within the sentence is a feature and the presence of these features is what
dictates the outcome (classification) of being negative or neutral. The naıve Bayes
algorithm, however, has the downside of assuming that the features being used to
predict the class are unrelated to each other and so does not take into account the
possibility that the features themselves may depend on the existence of others. Since
it is a very well established algorithm, it is often used as a baseline for classifier
accuracy when studies are performed with multiple classification techniques in order
to study the validity of other classification algorithms [46].
Logistic regression (Python: sklearn, LogisticRegression) allows for a binary outcome
prediction given multiple independent variables or features that determine the out-
come. Logistic regression will determine the relationship between these independent
CHAPTER 3. INSIGHT EXTRACTION USING TENANT SURVEYS 57
features and the output variable through the use of a sigmoid function to estimate
the probability of the outcome belonging to one of the two binary classes. Logistic
regression also fits coefficients to each of the independent features which allow for
the interpretation of relative importance that each input has for the model.
Support Vector Machines (SVM) are supervised machine learning algorithms which
are often applied to classification and categorization problems [47]. A hyperplane is a
divider between two sets of data points. A support vector machine (Python: sklearn,
SGDClassifier) is an algorithm which segregates the two classes using hyperplanes.
Support vector machine algorithms will try to maximize the margin between data
points and the hyperplane to find the most suitable areas where these planes can
be inserted. Hyperplanes can be linear, nonlinear or three dimensional. In order
to use a support vector machine for classification, the documents must be turned
into vectors. This is done on a per sentence basis where a TF-IDF is generated.
The dataset is then mapped into a space where a hyperplane is drawn between the
vectors separating them into two distinct classes.
Decision tree classifiers used in this study are classification trees as they predict the
likelihood of a comment belonging to one of two binary classes. Decision trees split
into nodes, each of which correspond to various factors influencing the outcome and
leaves which are the outcomes themselves (binary neutral / negative in this case).
The nodes keep creating splits until externally applied stopping criteria are reached.
The downside of a decision tree is that it is easy to overfit the data and create non
representative models. A random forest classifier works in a very similar fashion to
a decision tree; however, it generates several trees from randomly selected subsets of
data and averages the results in order to have a more representative fit of the entire
dataset. This usually results in a much better model which does not as easily overfit.
CHAPTER 3. INSIGHT EXTRACTION USING TENANT SURVEYS 58
Doc2Vec (Python: Genism, Doc2Vec) is a supervised classification algorithm that
builds on the Gensim Word2Vec package. Word2Vec is based on an algorithm called
“skip gram” which represents words in training sentences as vectors and predicts
the probability of surrounding words given a central term [48]. By expanding this
concept out to have an additional vector involved in a per document basis called
the document vector, sentences can be trained for semantic context (positivity
/ negativity) as well. It is a neural network trained to recognize the impact on
document polarity caused by the presence of certain words.
3.4 Results
3.4.1 Comparison of solicited and unsolicited complaint fre-
quencies
Both surveys and CMMS entries contain complaints. They are differentiated in their
means of collection. Whereas CMMS complaint entries are collected continuously
throughout the year, survey responses are collected at the end of the year. As shown
in Figure 3.2, a visualization of the complaint and survey response distributions per
floor demonstrates that three of the five floors with the highest rate of complaint
rates from survey responses and CMMS were identical. This can be considered a
preliminary evidence for the usability of unsolicited data (CMMS) in lieu of solicited
data (surveys). Future research is needed to explore the use of unsolicited occupant
feedback (thermal complaints logged in a CMMS or thermostat interactions logged in
a building automation system) instead of surveys to infer occupant preferences and
satisfaction. An additional observation is that tenants that seem to be more willing
CHAPTER 3. INSIGHT EXTRACTION USING TENANT SURVEYS 59
to write about thermal issues in surveys but rarely complain about them in the
CMMS dataset where only a very small fraction of the complaints are about thermal
issues. The results may be an indicator that tenants have different thresholds to
complain via CMMS and surveys. In surveys, tenants are more likely to provide a
holistic view of their thermal comfort and maintenance related issues. This is in
contrast to tenants issuing complaint calls at more severe discomfort levels which
may be more frequent for maintenance related issues compared to thermal issues.
Figure 3.2: A comparison between the per floor breakdown of thermal and mainte-nance complaints from (a) CMMS and (b) survey responses.
3.4.2 Text mining algorithms
Association rule mining
Association node networks allow for the easy interpretation of the top rules identified
by the ARM algorithm, see Figure 3.3. Larger nodes indicate a greater term
frequency within the analyzed dataset. Darker nodes signify rules with a greater lift.
The ARM algorithm was applied to the thermal and maintenance-related survey
CHAPTER 3. INSIGHT EXTRACTION USING TENANT SURVEYS 60
responses and the most frequent rules that were derived were displayed. Interesting
observations include that tenants were concerned about air quality, heating on
Mondays, thermostats, and having greater control over the thermostats in the winter
in their thermal survey responses while they were concerned about a lack of water
in the washroom taps, empty soap dispensers and a lack of car parking in the
maintenance survey responses. A downside of free text surveys can be observed
here, as tenants frequently reported being cold within the maintenance section of
the survey; resulting in the ARM algorithm picking that group of complaints up in a
section where it should be irrelevant. Inaccuracies in these algorithms usually stem
from terms which are irrelevant to insight extraction such as names of staff being
included within the dataset and not being part of the pre-processing methodology.
Therefore, it is often required to run these algorithms multiple times and extract
irrelevant terms which the pre-processing steps initially failed to remove manually.
CHAPTER 3. INSIGHT EXTRACTION USING TENANT SURVEYS 61
Figure 3.3: Association node graphs built using ARM. The figure contains rulesderived for (a) thermal and (b) maintenance-related survey responses. Ruleswhich co-occurred frequently are grouped together and the total number ofoccurrences for each rule group is denoted by n.
Topic modelling
Topic modelling algorithms LDA and NMF are employed in order to use an
unsupervised learning approach towards finding groups of similar complaint topics.
The top six topics are selected for each of the categories (thermal, maintenance) and
results from both algorithms are presented in Table 3.1. There is a balance involved
in the generation of topics through LDA and NMF. A high number of topics has
the potential to cover a wider range of topics contained within the dataset, but
distinctness between groups decreases as the topics are increased. In other words,
if too many topics are created for the model to derive, there is an overlap between
word groups of different topics making the interpretation of the results difficult.
Iteratively generating topic models with three to ten topics demonstrated a lack of
interpretability for more than six topics using the dataset. Examples of complaints
represented by each topic for both survey categories and algorithms are represented
CHAPTER 3. INSIGHT EXTRACTION USING TENANT SURVEYS 62
in Tables 3.2 and 3.3. It was found that certain topics (heating on Mondays, air
circulation, lack of washroom soap, parking issues) found from this analysis were in
line with those identified by the ARM technique. Further interesting observations
include feedback regarding tenants desiring access to stairs, better control of ther-
mostats, a high frequency of elevator breakdowns, a desire for better food options,
complaints due to a nearby subway construction and issues regarding revolving doors.
CHAPTER 3. INSIGHT EXTRACTION USING TENANT SURVEYS 63
Table 3.1: The six topics derived from the thermal and maintenance survey re-sponses using the LDA and NMF algorithms.
LDA Thermal Surveys
Topic 0 Topic 1 Topic 2 Topic 3 Topic 4 Topic 5
think know sure think turn control
air don’t temperature office heat air
probably air really yet cold temperature
circulation heating don’t window idea floor
better conditioning know sure think would
LDA Maintenance Surveys
Topic 0 Topic 1 Topic 2 Topic 3 Topic 4 Topic 5
elevators people building paper soap often
floor stuck could can’t would would
slow cleaners cold washrooms like floor
need clean would people floor work
one elevators revolving floors elevators time
NMF Thermal Surveys
Topic 0 Topic 1 Topic 2 Topic 3 Topic 4 Topic 5
know turn cold think air sure
don’t heat ac temperature conditioning operates
really ac make control circulation rectify
reason sooner warm building needs difficult
idea fall really would summer reasons
NMF Maintenance Surveys
Topic 0 Topic 1 Topic 2 Topic 3 Topic 4 Topic 5
floor elevators going stairs cold would
soap slow people can’t water nice
bathrooms stuck building use sometimes food
often get construction go temperature like
washrooms people lrt floors always building
CHAPTER 3. INSIGHT EXTRACTION USING TENANT SURVEYS 64
Table 3.2: Examples of thermal-related tenant survey responses.
Survey response LDA Topic NMF Topic
I’m guessing it’s because of the thermostat, it’s just on high
of a temperature or too much humidity. It’s quite a bit of a difference
coming in from outside to inside.
0 5
I think there is poor circulation and it would be better if
there were more fans or air filtering.5 1
Generally, it should be regulated more with what is going on
outside but when the temperature is cooler maybe it changes but we are
wrapped up in wraps and I just took my wool wrap off.
4 0
I think it’s just finding a balance between the temperatures
especially in fall and in spring when it’s hard to find that balance. I guess
just playing around with temperature controls.
5 0
It would be good to have a little bit more control over your
area. Where I am, I don’t have any controls, I don’t have a thermostat in my
area.
2 4
CHAPTER 3. INSIGHT EXTRACTION USING TENANT SURVEYS 65
Table 3.3: Examples of maintenance-related tenant survey responses.
Survey response LDA Topic NMF Topic
Just because this building is energy efficient doesn’t mean that
it has any type of sustainability for the outside environment. There is no
consideration for the birds hitting the windows and there is no consideration
for the amount of traffic congestion and the amount of emissions that are
emitted from the cars going up and down Bank Street that people are exposed
to. So, this building while it may be green, or LEED certified it’s really
not.
4 5
I think the biggest thing I notice is the lights and I can’t
believe how much are on the weekends when I come in and all the lights are on
in the entire office when nobody is there. I’m just wondering how we can
possibly be a Green building when that’s happening and there are many other
buildings that do have models that we might want to look into, because all
the lights on the weekends when nobody is around makes no sense.
0 5
The washrooms on the 2nd floor, the women’s washroom
especially is used by a lot of the public not just the tenants so a lot of
the times the cleanliness of the washrooms is questionable. The replenishment
of toilet paper or paper towels sometimes is not as good as it should be.
5 0
The men’s bathroom on the 13th floor that have
malfunctioning taps and soap dispensers. During the day the bathrooms are not
always very clean. I don’t have anywhere to park, so I have to take the bus.
0 0
We can’t go between floors using the stairs, we have to use the
elevator. I have to use the elevator and I’d rather walk.3 1
CHAPTER 3. INSIGHT EXTRACTION USING TENANT SURVEYS 66
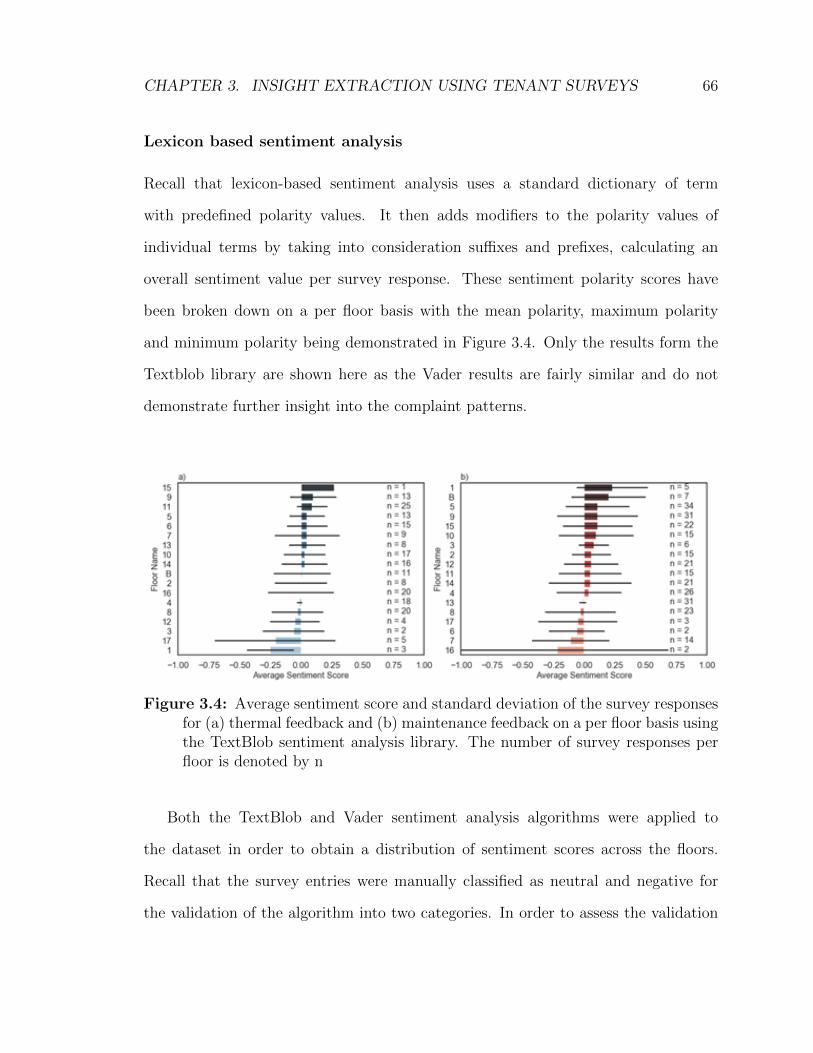
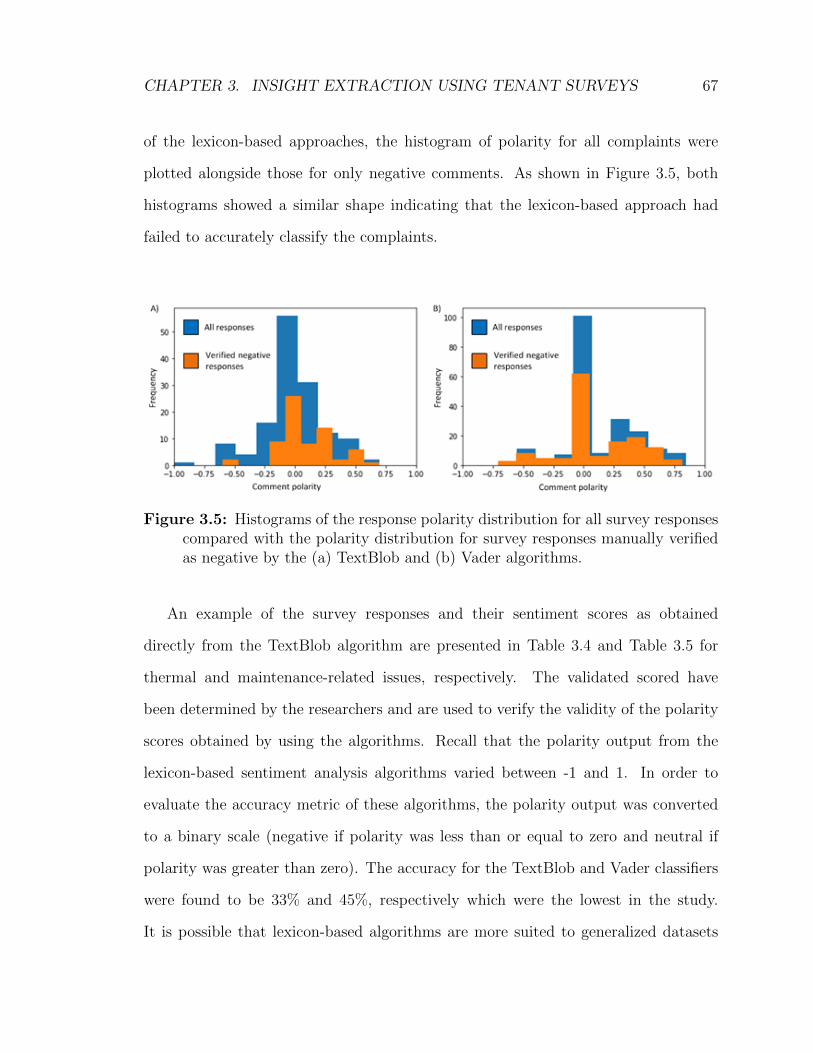
Lexicon based sentiment analysis
Recall that lexicon-based sentiment analysis uses a standard dictionary of term
with predefined polarity values. It then adds modifiers to the polarity values of
individual terms by taking into consideration suffixes and prefixes, calculating an
overall sentiment value per survey response. These sentiment polarity scores have
been broken down on a per floor basis with the mean polarity, maximum polarity
and minimum polarity being demonstrated in Figure 3.4. Only the results form the
Textblob library are shown here as the Vader results are fairly similar and do not
demonstrate further insight into the complaint patterns.
Figure 3.4: Average sentiment score and standard deviation of the survey responsesfor (a) thermal feedback and (b) maintenance feedback on a per floor basis usingthe TextBlob sentiment analysis library. The number of survey responses perfloor is denoted by n
Both the TextBlob and Vader sentiment analysis algorithms were applied to
the dataset in order to obtain a distribution of sentiment scores across the floors.
Recall that the survey entries were manually classified as neutral and negative for
the validation of the algorithm into two categories. In order to assess the validation
CHAPTER 3. INSIGHT EXTRACTION USING TENANT SURVEYS 67
of the lexicon-based approaches, the histogram of polarity for all complaints were
plotted alongside those for only negative comments. As shown in Figure 3.5, both
histograms showed a similar shape indicating that the lexicon-based approach had
failed to accurately classify the complaints.
Figure 3.5: Histograms of the response polarity distribution for all survey responsescompared with the polarity distribution for survey responses manually verifiedas negative by the (a) TextBlob and (b) Vader algorithms.
An example of the survey responses and their sentiment scores as obtained
directly from the TextBlob algorithm are presented in Table 3.4 and Table 3.5 for
thermal and maintenance-related issues, respectively. The validated scored have
been determined by the researchers and are used to verify the validity of the polarity
scores obtained by using the algorithms. Recall that the polarity output from the
lexicon-based sentiment analysis algorithms varied between -1 and 1. In order to
evaluate the accuracy metric of these algorithms, the polarity output was converted
to a binary scale (negative if polarity was less than or equal to zero and neutral if
polarity was greater than zero). The accuracy for the TextBlob and Vader classifiers
were found to be 33% and 45%, respectively which were the lowest in the study.
It is possible that lexicon-based algorithms are more suited to generalized datasets
CHAPTER 3. INSIGHT EXTRACTION USING TENANT SURVEYS 68
instead of domain specific ones regarding HVAC and maintenance-related complaints.
Table 3.4: Examples of survey responses to thermal issues and their polarity.
Survey Response
(What are the thermal
issues in your space?)
Textblob Score Vader Score Validated Score
I’m not an engineer but
I think there is an issue with the control of the temperature between seasons
and once the season changes it’s under control. The air quality is terrible
and maybe it’s because we are on the 17th floor. There is mold
because I can see it from the ceiling.
-1 -0.6 -1
They set it for men
wearing suits when we are not wearing suits and are not men.0 0.3 -1
Good question, I’m not
sure.0.5 0.7 0
Table 3.5: Examples of survey responses to maintenance issues and their polarity.
Survey Response
(What are the maintenance issues in your space?)TextBlob Score Vader Score Validated Score
I
have seen people get stuck in the rotating doors. The door is awful. I like
the renovations that have been done here.
-1 -0.8 -1
I
would hope that there would be another restaurant and more options for food
in the building.
0 -0.2 0
Her
name xxx and she is awesome, she works with the cleaning company and
she’s great. She is personable and she is really great at what she does, and
she is really sweet.
0.7 0.9 0
Binomial classifiers
Recall that binary classification uses a supervised approach to machine learning in
order to make a binary prediction about the class a response belongs to (in this case
the classes are negative and neutral). Here the approach is to have a training and
validation set where 70% of all the data is used for training and 30% is used in the
CHAPTER 3. INSIGHT EXTRACTION USING TENANT SURVEYS 69
validation approach, see Figure 3.6. A higher fraction of the dataset was used for
the training set (70%) compared to the validation set (30%) than the usual approach
in training models. This approach was used as when experimental training was
performed on 30% of the dataset and validation on 70% it was found that the models
were highly prone to overfitting due to the limited dataset size and a large negative
bias of the data. Free text data from the tenant surveys were extracted, preprocessed
and the sentiments of the survey responses were classified manually into a binary
(neutral / negative) group. 70% of the data was used to train a variety of classifiers
(naıve Bayes, Logistic Regression, Support Vector Machine, Doc2Vec, RNN). Once
trained, the validation survey comments were applied to the classifier and the classifi-
cation results were compared to the manual classification. A percentage accuracy was
calculated for each classifier in order to assess its performance. It should be noted
that the methodology used in this study is not proposed as a guide to a workflow for
using these methodologies. It is meant to be a quantitative assessment of a holistic
range of methods that can be deployed in order to extract meaningful insights from
unstructured text-based data. It is up to the reader to assess which techniques are
suitable to their own analytical purposes. The objective of this study is to demon-
strate the potential of a wide range of text mining methods on text-based survey data.
CHAPTER 3. INSIGHT EXTRACTION USING TENANT SURVEYS 70
Figure 3.6: An overview of the operations pipeline during binomial classification.
CHAPTER 3. INSIGHT EXTRACTION USING TENANT SURVEYS 71
Figure 3.7: A comparison of the confusion matrices obtained from applying the A)Naıve Bayes, B) Logistic Regression C) Support Vector Machine D) Doc2VecE) Decision Tree F) Random Forest classifiers on the thermal survey responses.
CHAPTER 3. INSIGHT EXTRACTION USING TENANT SURVEYS 72
The six different binary classification algorithms used in this study were naıve
Bayes, Logistic Regression, Support Vector Machines, Doc2Vec, Decision Tree and
Random Forest. The accuracy of the classification results from each algorithm is
shown using a confusion matrix in Figure 3.7. Darker squares on the confusion
matrix indicate a higher proportion of true negatives / neutrals while lighter squares
demonstrate a higher proportion of false negatives / neutrals. It should be noted
that the lowest accuracy achieved through the use of binary classification algorithms
resulted in superior results compared to those obtained from the lexicon-based
classification approaches. Doc2Vec was found to have the lowest overall percentage
accuracy in classifying the tenant sentiments but still achieved a 67% accuracy
compared to 45% for Vader. Despite Doc2Vec having a lower classification accuracy
compared to the rest of the studied classifiers, it was able to correctly classify a
superior fraction of the neutral comments compared to the other tested classifiers.
The naıve Bayes classifier had the highest correctly predicted fraction of true
negatives. However, it fared worse than every other algorithm that was tested while
attempting to classify neutral comments. This is possibly due to the dataset having
a large bias towards negative comments. Logistic Regression and Random Forest
Classifiers were observed to perform the best with this dataset with both achieving
an 80% classification rate. Logistic Regression was found to be more effective while
identifying true neutrals while Random Forest Classifiers were found to be more
effective at classifying true negatives. Decision Tree Classifiers were unable to match
the performance of Random Forest Classifiers with correct classification of both true
positives and neutrals.
CHAPTER 3. INSIGHT EXTRACTION USING TENANT SURVEYS 73
Table 3.6: Classifiers used and their percent classification accuracy (for negativesand neutrals combined).
Classifier Type Accuracy (%)
Naıve Bayes 70
Logistic Regression 79
Support Vector Machine 73
Doc2Vec (skip-gram) 67
Decision Tree 76
Random Forest 79
3.5 Discussion and conclusions
A combination of data visualization, text mining and natural language processing
techniques were successfully employed in this study in order to extract operational
performance metrics from text-based survey data. Comparisons between survey data
(solicited data source) and CMMS data (unsolicited data source) were made; and it
was observed that floor-level breakdown of thermal and maintenance complaints were
overall similar.
Text mining algorithms were also used on the survey data. The association rule
mining method revealed common tenant comments regarding air quality, heating on
Mondays, thermostat control in the offices, need for having increased control over
floor heating in the winters, issues regarding washroom faucets, soap dispensers, and
parking. The topic modelling algorithms reinforced the findings from the association
rule mining method by demonstrating distinct topic groups for complaints regarding
heating on Mondays, better air circulation, empty soap dispensers, parking and cold
summer temperatures. Furthermore, these algorithms allowed for more detailed in-
terpretation of the complaints contained in the dataset including the tenants’ desire
for access to staircases, high frequency of elevator breakdowns, a desire for better
food options within the building and issues regarding revolving doors on the ground
CHAPTER 3. INSIGHT EXTRACTION USING TENANT SURVEYS 74
floor. Topic modelling was found useful for gaining insights into text-based tenant
responses.
Sentiment analysis techniques were used in order to quantify overall tenant satisfac-
tion in the survey responses. The survey results were manually classified as negative
or neutral as a check for the accuracy of each sentiment analysis algorithm. Lexicon-
based algorithms were found to have the worst accuracy in the study. It is possible
that these methods are less effective when applied to domain specific datasets (HVAC
/ maintenance). The development of domain specific dictionaries may have the po-
tential to create gains in accuracy for these algorithms. Classifier-based algorithms
had a better accuracy but require a split in the dataset in order to train the algo-
rithm, and a time-consuming manual training process. However, the benefit is that
they allow for more accurate models to be developed; training a random forest or
logistic regression classifiers allowed for a sentiment analysis accuracy of up to 80%
compared to 45% for the lexicon-based methods.
The methodology and visualizations obtained through this study have not been used
by the industry partner as of yet. However, the results from this analysis should be
useful in their operational and maintenance workflows. Based on the results of this
study, the primary recommendations with respect to operations changes in order to
please tenants would be increased attention on the following issues: a) an availability
of soap and running water in washrooms, b) an increase in the scheduled maintenance
of the elevators and c) a greater amount of control given to occupants regarding their
floor temperatures. This could be in the form of an online tool where they would
be able to make thermal changes or an accessible thermostat on the floor whereas
currently the thermostats are only accessible by building technicians. The study
also points out the three floors with the highest frequency of survey responses and
CHAPTER 3. INSIGHT EXTRACTION USING TENANT SURVEYS 75
demonstrated that the floors which seemed to log more unsolicited feedback (CMMS
complaints) and those more likely to respond when solicited for information (tenant
surveys). Each of these analytical insights is obtained through the methodology pro-
posed in this study and show the capability of extracting actionable insights from
these traditionally overlooked data sources.
The study concludes that free text data contains valuable insights that can trans-
late to improvements in workflow for operators, reduction in tenant complaints which
can lead to improvements in their performance indicators and valuable analytics to
support data gathered from a word of mouth basis through operators. Despite the
difficulty in getting insights from this data source and the push to use various prox-
ies for tenant comfort (IoT devices like smartwatch interactions, CMMS databases,
and thermostat interactions), there remains value to using direct text-based feedback
from tenants in the analysis of comfort metrics. Techniques which allow for effective
text analytics and natural language processing already exist within standard Python
libraries and are easily accessible to researchers. The following points were recognized
as unresolved issues and are opportunities for future work regarding the topic:
� A greater resolution for performance indicators can be achieved by using room
level data to calculate tenant level performance. This data is currently available
within the dataset, but it is critical to have a strong understanding of tenant
space occupancy as certain tenants within the building occupy multiple floors
and rooms across floors.
� A larger dataset needs to be used to show the robustness of these methods.
The current dataset has only 431 entries and is very skewed towards negative
responses which caused some algorithms like naıve Bayes to have a large bias
towards one class during classification.
CHAPTER 3. INSIGHT EXTRACTION USING TENANT SURVEYS 76
� Methods must be developed to lower the rate of misclassification for the neutral
comments. Currently even the best algorithm for this purpose (Doc2Vec) only
gives us a 71% accuracy in this parameter.
� Improvements in the accuracy of the sentiment analysis process can be gained
by using deep neural networks like RNNs for classification. The popularity of
high level interfaces interacting with deep neural network libraries such as the
Keras API used with TensorFlow, may allow for more accessibility to these
techniques and improve classification accuracy. Early experimentation using
a Recurrent Neural Network (RNN) shows very promising results which could
indicate that the rate of identification of neutral comments is greatly improved.
� Follow-up interviews with the survey participants were not conducted to verify
the results of this study. More collaboration is required as well as a follow up
study to demonstrate that building operators can use these survey analytics
techniques to help them address tenant complaints.
Chapter 4
Development of a graphical interface tool
4.1 Introduction
Tenant complaints from work-order data and operator log entries in CMMS rep-
resent an untapped potential to extract detailed performance metrics for building
managers and operators. Despite data mining techniques becoming more accessible
to researchers through the popularity of languages such as R, non-technical groups
(building operators and managers) with an interest in building performance bench-
marking must often depend on third parties such as researchers to gain insights into
the data generated from their buildings. There remains a gap in the current building
management and maintenance field where powerful analytics tools are supplied
to building operators and managers who can then visualize the provided building
performance metrics at any time.
Research in the field of CMMS analytics has shown that impactful insights can be
drawn from both tenant work-orders and operator log entries. Dutta et al., employed
association rule mining (ARM) on CMMS data from four buildings to identify
building, system, and floor-level work-order taxonomies and common failures [34].
Gunay et al., also used the ARM method to calculate component level fault-frequency
rates [8]. Besiktepe et al., analyzed historical work-order data in order to examine
77
CHAPTER 4. DEVELOPMENT OF A GRAPHICAL INTERFACE TOOL 78
if there were insightful trends in the types of maintenance activities carried out in
educational institutions [35]. However, all these studies require an analyst to be
comfortable in programming an analytics workflow in a programming language. It
remains to be seen if the powerful analytical techniques used in these studies can be
made available to a third party with little or no background on programming and
data mining using an intuitive graphical user interface (GUI).
The key challenge regarding development of custom analytical applications for
users in an office environment remains the limitations inherent within the corporate
structures. Building managers and operators usually work on company owned
computers which have carefully moderated software installed on them. This is
necessary for offices due to the inherent security threats that are present with
running unauthorized and unknown programs on computers. Due to the large
volume of potentially sensitive data that may be present in each computer system,
IT departments often consider unauthorized programs to be an unacceptable risk.
It is impractical for researchers to implement experimental and in-development
programs in offices as every change made to the software would have to be vetted
by the IT department and cost them working hours. In order to avoid this issue,
analytics programs can be written for these offices using pre-approved software such
as Visual Basic for Applications (VBA) for Microsoft Excel, but the opportunity
cost associated with taking this approach is the current availability of mature, robust
and well established libraries for data and text analytics within the R ecosystem.
In this article, a prototype software tool to extract operational performance metrics
from work-order logs of large commercial and institutional buildings is developed
with established text and data analytics techniques running on the back end and
an intuitive GUI on the front end. The goal of this tool is to create an interface
CHAPTER 4. DEVELOPMENT OF A GRAPHICAL INTERFACE TOOL 79
where non-technical building staff can have access to complex yet powerful data
analytics techniques like survival curves, stacked line curves, Sankey diagrams and
association node networks in order to draw insights on building performance and
work-order taxonomies without having to refer to a researcher or specialist in data
analytics. The shortcomings of the methodology are identified through interactions
with operations staff; and future research needs are discussed regarding operational
data collection, analytics, and visualisation.
4.2 Methods
The source code for the performance metrics used in this project was obtained from
the open source documentation provided by Dutta et al [43]. The R language for
statistical computing was utilized for the development of this software tool. R is an
open source language with powerful third-party packages which allows data analysts
to clean, process, analyze and visualize data. R contains the package shiny which
allows for the creation of applications with a GUI using code originally written for
statistical analysis. Non-technical users can take advantage of an intuitive GUI to
obtain analytical insights using data and text mining techniques built into the back
end of the application without any prior knowledge of programming. The second
advantageous feature of shiny applications are their ability to run on cloud instances.
Instead of having the application installed on a number of local computers, building
managers can simply choose to have the application run on a hosting server. Employ-
ees interested in analyzing the building data can then simply access the application
through their browser by connecting to the server. Benchmarking data will be up-
loaded to the server in the form of a comma-separated values file that building staff
CHAPTER 4. DEVELOPMENT OF A GRAPHICAL INTERFACE TOOL 80
can access from their CMMS system.
The advantages of a cloud-based approach to an application are numerous. The pri-
mary advantage is the ease of version control and bug testing; developers need to
update the application on one server only rather than pushing updates to multiple
local computers. Any bugs within the application are also easier to find and patch due
to the application running on a single known system. It also eliminates the need for
developers to consider the hardware capabilities of each user as the computing power
required is managed by the cloud instance. Finally, recall that one of the challenges
for deploying in development tools for offices is the need for IT departments to vali-
date individual programs as secure before they are deployed on a local system. The
use of a cloud-based application which uses an uploaded file for benchmarking allows
for this challenge to be bypassed. Researchers can create updates to the application
and have them provided to building staff much faster without having to go through
another level of verification in between. The five building parameters that were ana-
lyzed in the prototype tool were the “per category work-order resolution time”, “per
category work-order intensity”, “work-order per floor distribution”, “top ten operator
word frequency” and “operator term usage patterns”. The techniques used to derive
these benchmarks and their significance to building operations are discussed below.
CHAPTER 4. DEVELOPMENT OF A GRAPHICAL INTERFACE TOOL 81
4.2.1 Per category work-order resolution time
Figure 4.1: Work-order resolution time benchmarking using survival curves.
Survival curves are used in order to demonstrate the performance of a building
with respect to how quickly work-orders are addressed. For example, the janitorial,
lighting and maintenance work-orders in the building in Figure 4.1 took longer to ad-
dress compared to the temperature-related work-orders. Within the studied dataset,
only 30% of temperature-related work-orders were unaddressed at the 20-hour mark
whereas 75% of janitorial and maintenance and 56% of lighting work-orders remained
unresolved. At the 40-hour mark, 28% of lighting-related work-orders remained un-
resolved while 43% and 48% of janitorial- and maintenance-related work-orders were
unaddressed, respectively. In this scenario, a conclusion the building managers could
draw is that there is an opportunity for the building staff to improve on their response
times regarding janitorial and maintenance work-orders.
CHAPTER 4. DEVELOPMENT OF A GRAPHICAL INTERFACE TOOL 82
4.2.2 Per category work-order intensity
Figure 4.2: Complaint intensity normalized by floor area using service requestcounts.
Stacked line charts are useful for demonstrating the change in complaint intensity
normalized by floor area of a building. As shown in Figure 4.2, interesting obser-
vations for the building include an overall decrease in temperature and janitorial
work-orders per square meter by 64% and 57% between 2014 and 2017, respectively.
This is a strong indication that the facilities management team were successful in
improving their workflows regarding thermal work-orders and janitorial work-orders
significantly between 2014 and 2017. In contrast to the reduction in complaint in-
tensity witnessed with the previous categories, lighting and maintenance work-orders
saw no reduction in complaint intensity and hence there may be an opportunity for
improving performance regarding those types of work-orders.
CHAPTER 4. DEVELOPMENT OF A GRAPHICAL INTERFACE TOOL 83
4.2.3 Work-order per floor distribution
Figure 4.3: A per floor and per type breakdown of tenant service requests.
Sankey diagrams provide insight into categorical and spatial breakdown of the
work-orders within a building. It is often observed that only a few areas of a build-
ing (i.e. floors, rooms) are associated with disproportionate numbers of work-orders
which are often of a certain type (thermal, lighting etc.). Presenting a per floor
and a per category breakdown of the work-orders provides insight into areas where
disproportionate numbers of work-orders are generated. This is an efficient way of
increasing tenant satisfaction by efficiently identifying and addressing problems at a
high resolution. For example, the category of work-orders from which the highest
volume of work-orders was observed on the third floor was lighting. Additionally, a
disproportionate number of work-orders regarding temperature were observed on the
second floor. This data would ideally be used by a building manager to start a more
detailed investigation into any underlying causes that may have led to the generation
CHAPTER 4. DEVELOPMENT OF A GRAPHICAL INTERFACE TOOL 84
of a disproportionate number of work-orders.
4.2.4 Top 10 operator word frequency
Figure 4.4: Word frequencies of operator log entries for lighting related servicerequests.
Frequently occurring terms within the operator logs in the CMMS database can
help building managers pinpoint key trends/problems that operators face as they
resolve complaints. Bar graphs were used to demonstrate the top ten words used
by operators while responding to work-orders. Notably, the most frequent words
the building operators use while addressing maintenance complaints categories are
replace, tenant, satisfy and material.
CHAPTER 4. DEVELOPMENT OF A GRAPHICAL INTERFACE TOOL 85
4.2.5 Operator term usage patterns
Figure 4.5: Word frequencies of operator log entries for lighting related servicerequests.
Association node networks allow for the easy interpretation of the top rules
identified by the ARM technique which identifies frequently co-occurring words
within a dataset. For example, if the word “tstat” appears frequently alongside the
word “change” in the dataset, the inference is that operators frequently are called
up to readjust temperatures in spaces.
Larger nodes indicate a greater term frequency within the analyzed dataset while
darker nodes signify terms with a greater probability of occurring together. Figure
4.5 shows a graphical representation of the rules that were discovered when ex-
ploring the irregularities found in maintenance-related complaints on the building
work-order entries. It is evident that looking at the maintenance-related complaints
in this building that operators are frequently installing switches and adjusting the
thermostats.
CHAPTER 4. DEVELOPMENT OF A GRAPHICAL INTERFACE TOOL 86
4.3 Future performance metrics and visualization
Additional performance metrics are planned as additions to the ones already dis-
cussed. Since these metrics have not been implemented in the application as of this
point, a non-functional graphical user interface has been developed with the proposed
functionality of the performance metrics integrated within. The non-functional inter-
face is a representation of what the finalized product is envisioned to resemble.
4.3.1 Temporal distribution of complaints
Figure 4.6: Temporal distributions of complaints over a 24-hour period.
Temporal distributions of complaints throughout a workday (24 hours) are vi-
sualized using probability density functions for up to four uploaded buildings. Hot
and cold complaints are separated as categories in order to differentiate between the
CHAPTER 4. DEVELOPMENT OF A GRAPHICAL INTERFACE TOOL 87
trends they show. Temporal differences in the complaints are displayed using three
bins to break down the complaint trends for the summer, winter and shoulder seasons
as shown in Figure 4.6. The detailed temporal complaint distributions can be studied
from building to building by selecting one of the uploaded building datasets. A com-
parison of the temporal complaint distribution between the four uploaded buildings
is also provided. Of interest to building managers from this visualization would be
the peaks in the density functions; these would correspond with the peak complaint
times. For the example dataset, this appeared to be around 10:00 AM. The shape of
the complaint probability function also alerts managers to irregular patterns which
may signal operations issues. In the example dataset, several buildings demonstrated
secondary peaks for hot complaints at around 2:00 PM during the workday. This is a
possible indication of solar heat gains causing an overheating issue in the space later
on during the workday.
CHAPTER 4. DEVELOPMENT OF A GRAPHICAL INTERFACE TOOL 88
4.3.2 Average 12 hour complaint trees
Figure 4.7: Decision trees demonstrating the effect of outdoor temporal and spatialfactors on average complaint rates over a 12h period.
Decision trees present the effects of temporospatial factors on the number of hot
and cold complaints that are logged in a day. The decision trees shown in Figure
4.7 were constructed using CMMS complaint data from a sample building. The two
decision tree models were developed for hot and cold complaints using four years of
data collected from complaint logs. The variable n within each tree refers to the
number of 12-hour timesteps in a bin within the dataset. The decision tree consists
of nodes (squares) and leaves (circles). The nodes of the tree quantify statistically
significant splits within the dataset while the leaves predict the number of complaints
that would occur within a 12-hour timespan. This allows building operators and
managers to statistically predict the conditions under which complaints would be
CHAPTER 4. DEVELOPMENT OF A GRAPHICAL INTERFACE TOOL 89
maximized. As an example, managers for the studied building could expect the
maximum rate of cold complaints during summer when the outdoor temperature
was less than 10 degrees Celsius outdoors. This could indicate an AHU schedule
which runs on a fixed schedule and turns on the cooling regardless of the outdoor
temperature during the summer season. Creating better HVAC schedules in this
case would serve to both save the building managers money and increase tenant
satisfaction.
4.4 Future application features and development
goals
The application as is presented in this chapter is still at a stage of ongoing develop-
ment. Future plans for the application include:
1. Compare performance metrics between up to four buildings normalized by floor
area;
2. Custom user defined time periods for building performance analysis;
3. Choice of the complaint categories (e.g., thermal, lighting, maintenance etc.)
for the word frequency charts of operator log entries;
4. User control of the number of top words included within the charts;
5. Association node network graphs based on user preference of support, lift and
confidence for the apriori algorithm and the ability to vary the values of those
parameters as required;
CHAPTER 4. DEVELOPMENT OF A GRAPHICAL INTERFACE TOOL 90
4.5 Feedback and concluding remarks
Preliminary feedback from building managers, building operators and developers in-
dicates a desire to have increased control over the application than is granted to the
user in its present state. The building managers noted that a vital part of their
workflow regarding the performance metrics they obtain from the application would
be to compare them between buildings. For example, there was a strong demand for
having the ability to compare work-order resolution benchmarks between buildings
and compare components of that benchmark (e.g., lighting or thermal work-order
resolution performance) between buildings under the same management team. There
is also a request for greater documentation of the performance metrics explaining
what each metric represents and how building management factors could tie into the
trends operators and managers observe from the application.
The application demonstrates a proof of concept that insights derived from analyti-
cal tools requiring knowledge of complex programming languages can be brought to
non-technical users through a GUI. The application allows building operators and
managers to obtain continuous on-site, real time performance metrics as opposed
to sending data to third parties for annual/bi-annual analysis. Additionally, non-
technical building staff can make use of the application without having any prior
programming knowledge and deploy it on their system without having to certify it
with their IT departments. More work needs to be done on the usability of the app
lication and the metrics it presents. It is also imperative to add in features that allow
the user more control such as the ability to compare metrics from multiple buildings
and the ability to infer insights from multiple types of complaints (thermal, lighting
etc.). Future development of this application will address the concerns that have been
raised as it is aimed at being an ongoing project.
Chapter 5
Conclusions
5.1 Summary
Innovative data mining, analytical and visualization techniques were employed in this
research in order to develop performance metrics for buildings using CMMS and free
text survey datasets. A summary of the conclusions from Chapters 2-4 of this research
is outlined as follows.
5.1.1 Extracting performance metrics with work-order data
Chapter 2 demonstrated the potential of complaint logs and operator comments stored
within computerized maintenance management systems in developing operational per-
formance metrics for buildings. The methodology for analysis was to break complaints
down (per floor, per category, per building etc.) in order to explore temporospatial
trends and create building level benchmarks that are intuitive to understand for op-
erators. The major conclusions derived from this research are:
� only certain complaint categories contribute to a majority of the recorded com-
plaints.
� all four buildings experienced a peak complaint frequency for both hot and cold
91
CHAPTER 5. CONCLUSIONS 92
complaints around 12 pm.
� hot and cold complaints had distinctive frequency distributions, with hot com-
plaints featuring a prominent secondary peak in complaint intensity.
� analysis showed that the highest probability of thermal and air quality com-
plaints occurred on only a very small number of days during the shoulder sea-
son.
� text mining operator work-orders reveals key operational procedures which
are repeated several times, highlighting trends in operational and maintenance
workflows.
5.1.2 Insight extraction from tenant surveys using text min-
ing
In Chapter 3, well established data visualization, text mining and natural language
processing algorithms were used in order to extract operational performance metrics
from text-based survey data. A methodology was developed in order to automate
the process of insight extraction from text based data and the effectiveness of several
well established algorithms in providing interpretable results was evaluated. Sankey
diagrams were used to compare the complaint patterns between solicited (surveys) and
unsolicited (CMMS) complaint sources, association rule mining was used to establish
trends within the terms used in tenant complaints, topic modelling was employed in
order to isolate groups of issues that tenants frequently mentioned and the feasibility
of multiple, well established sentiment analysis methods were assessed in order to
predict their effectiveness in establishing tenant satisfaction. The major conclusions
CHAPTER 5. CONCLUSIONS 93
derived from this research were:
� floor-level breakdown of thermal and maintenance complaints were similar when
comparing solicited (surveys) and unsolicited (CMMS) complaint data.
� the association rule mining method revealed common tenant comments regard-
ing air quality, thermostat control in the offices, issues regarding washroom
faucets and soap dispensers.
� the results from the topic modelling algorithms reinforced the results found
through association rule mining.
� topic modelling allowed for more detailed interpretation of the complaints con-
tained in the dataset including desire for access to staircases, high frequency of
elevator breakdowns and issues regarding revolving doors on the ground floor.
� lexicon-based algorithms with a generic dictionary were found to have the worst
accuracy among the studied methods. It is possible that these methods are less
effective when applied to domain specific datasets (HVAC / maintenance).
� classifier based sentiment analysis algorithms allow for more accurate models
to be developed at the cost of more time involvement in the training process.
� results from insight extraction using multiple methods (ARM and topic
modelling) converged into similar insights.
5.1.3 A software tool for conducting data analytics
In Chapter 4, a functional application is developed with a graphical user interface.
The performance metrics which are developed from Chapters 2 and 3 of the study
CHAPTER 5. CONCLUSIONS 94
are integrated within the back end of the application. An intuitive front end is
developed in order to allow building managers an opportunity to obtain on demand
performance data from the developed benchmarking tools. The application is built to
be deployable on a cloud platform for optimal scalability and development efficiency.
A roadmap for future development is laid out.
5.1.4 Envisioned commercial usage
The work as presented in this thesis is envisioned to be deployed in a commercial
setting under a facilities management company with several buildings under their
portfolio. Ideally these buildings would have reserves of CMMS and tenant survey
data which they would like to draw insights from. A commercial deployment of this
study would be done through the developed application (either locally or the cloud)
and building operators and managers would be able to upload data they want analyzed
through a CSV file. Depending on the data type they would then be presented
with a visual benchmark suite that consists of survival curves, sankey diagrams,
decision trees, association node networks, topic modeling insight etc. Furthermore,
the tool could be directly automated with the servers storing the CMMS and survey
data to provide automatic monthly/weekly reports containing detailed insights into
operations/faults which would otherwise be very difficult to detect using simple energy
use analysis.
CHAPTER 5. CONCLUSIONS 95
5.1.5 Contributions
The following are the research contributions of this work:
� Developed a methodology for developing performance metrics from tenant com-
plaint entries and operator service logs in CMMS.
� Created operational performance metrics and text mining workflows for detailed
insight extraction from tenant survey datasets.
� Developed a prototype software application and open source library of functions
for future work on CMMS systems and free text survey datasets.
5.2 Recommendations for future work
This section discusses the overall recommendations for future work as it pertains to the
body of research within this thesis. The three recommended segments of future work
are improvements on the text analytics methodology, future application development
and commercial deployment of the application.
5.2.1 Improvements on the text analytics methodology
Although novel approaches were used in order to extract performance insight from
text based survey datasets, there are several steps that can be undertaken to further
refine the methodology.
� larger datasets located across differnt climate zones must be evaluated in order
to test the performance of the workflow on more data, and data that is not as
skewed in distribution as the one used in this study.
CHAPTER 5. CONCLUSIONS 96
� further research must be undertaken to improve the classification of survey
responses with a neutral polarity.
� research must be conducted into the application of deep neural networks (CNNs)
for text classification.
� lexicon based sentiment analysis techniques must be reassessed using domain
specific dictionaries to improve classification performance.
� the accuracy of the developed classifier models must be tested on tenant survey
datasets from other buildings to test their transferability.
� better structured text based survey formats can be designed such that tenant
responses have less variance and focus on a few key issues of interest to building
operators.
5.2.2 Roadmap for application development
The custom building benchmarking application is still in its infancy. A few initial
features have been implemented within it as a prototype. However, a number of fea-
tures must be added to it so that a robust set of benchmarking tools are available
to building managers. The application must also be tested with multiple databases
to account for the differences in storage formats of computerized maintenance man-
agement systems. Some of the future development goals towards the application are
listed below:
� user control of temporal factors within the benchmarks.
� comparison of multiple buildings for a performance metric.
CHAPTER 5. CONCLUSIONS 97
� integration of text mining algorithms (topic modelling, classification etc.) into
the application.
� application bug testing and performance metric validation.
� initial feedback about the GUI and operational metrics from building managers
and operators.
� deployment on the cloud for industry use and continued development based on
feedback.
List of References
[1] L. Perez-Lombard, J. Ortiz, R. Gonzalez, and I. R. Maestre, “A review of bench-
marking, rating and labelling concepts within the framework of building energy
certification schemes,” Energy and Buildings, vol. 41, no. 3, pp. 272–278, 2009.
[2] W. Kim and S. Katipamula, “A review of fault detection and diagnostics methods
for building systems,” Science and Technology for the Built Environment, vol. 24,
no. 1, pp. 3–21, 2018.
[3] M. Deru and P. Torcellini, “Performance Metrics Research Project - Final Re-
port,” no. October, 2005.
[4] T. Hong, L. Yang, D. Hill, and W. Feng, “Data and analytics to inform energy
retrofit of high performance buildings,” Applied Energy, vol. 126, pp. 90–106,
2014.
[5] M. T. Paulus, D. E. Claridge, and C. Culp, “Algorithm for automating the
selection of a temperature dependent change point model,” Energy and Buildings,
vol. 87, no. November, pp. 95–104, 2015.
[6] Z. Li, Y. Han, and P. Xu, “Methods for benchmarking building energy consump-
tion against its past or intended performance: An overview,” Applied Energy,
vol. 124, pp. 325–334, 2014.
[7] Z. Wang and R. S. Srinivasan, “A review of artificial intelligence based building
energy use prediction: Contrasting the capabilities of single and ensemble predic-
tion models,” Renewable and Sustainable Energy Reviews, vol. 75, pp. 796–808,
2017.
[8] H. B. Gunay, W. Shen, and C. Yang, “Text-mining building maintenance work or-
ders for component fault frequency,” Building Research and Information, vol. 47,
pp. 518-533, 2019.
[9] Y. Geng, W. Ji, Z. Wang, B. Lin, and Y. Zhu, “A review of operating performance
in green buildings: Energy use, indoor environmental quality and occupant sat-
isfaction,” Energy and Buildings, vol. 183, pp. 500–514, 2019.
98
99
[10] K. Y. Teichman, A. K. Persily, and S. J. Emmerich, “Indoor air quality in high-
performing building case studies: Got data?,” Science and Technology for the
Built Environment, vol. 21, no. 1, pp. 91–98, 2015.
[11] K. W. Tham, P. Wargocki, and Y. F. Tan, “Indoor environmental quality, occu-
pant perception, prevalence of sick building syndrome symptoms, and sick leave
in a Green Mark Platinum-rated versus a non-Green Mark-rated building: A
case study,” Science and Technology for the Built Environment, vol. 21, no. 1,
pp. 35–44, 2015.
[12] G. R. Newsham, B. J. Birt, C. Arsenault, A. J. Thompson, J. A. Veitch,
S. Mancini, A. D. Galasiu, B. N. Gover, I. A. MacDonald, and G. J. Burns,
“Do green buildings have better indoor environments? New evidence,” Building
Research and Information, vol. 41, no. 4, pp. 415–434, 2013.
[13] G. R. Newsham, J. A. Veitch, and Y. V. Hu, “Effect of green building certifica-
tion on organizational productivity metrics,” Building Research and Information,
vol. 46, no. 7, pp. 755–766, 2018.
[14] T. Sood, M. Quintana, P. Jayathissa, M. Abdelrahman, and C. Miller, “The
SDE4 Learning Trail: Crowdsourcing occupant comfort feedback at a net-zero
energy building,” Journal of Physics: Conference Series, vol. 1343, no. 1, 2019.
[15] H. B. Gunay, W. Shen, G. Newsham, and A. Ashouri, “Modelling and analysis
of unsolicited temperature setpoint change requests in office buildings,” Building
and Environment, 2018.
[16] W. O’Brien, I. Gaetani, S. Carlucci, P. J. Hoes, and J. L. Hensen, “On occupant-
centric building performance metrics,” Building and Environment, vol. 122,
pp. 373–385, 2017.
[17] M. M. Ouf, W. O’Brien, and B. Gunay, “On quantifying building perfor-
mance adaptability to variable occupancy,” Building and Environment, vol. 155,
no. February, pp. 257–267, 2019.
[18] D. Hammond, J. J. Dempsey, F. Szigeti, and G. Davis, “Integrating a
performance-based approach into practice: A case study,” Building Research
and Information, vol. 33, no. 2, pp. 128–141, 2005.
[19] J. Goins and M. Moezzi, “Linking occupant complaints to building performance,”
in Building Research and Information,vol. 42, no. 3, pp. 362–372, 2013.
100
[20] M. Moezzi and J. Goins, “Text mining for occupant perspectives on the physical
workplace,” Building Research and Information, vol. 39, no. 2, pp. 169–182, 2011.
[21] J. J. McArthur, N. Shahbazi, R. Fok, C. Raghubar, B. Bortoluzzi, and A. An,
“Machine learning and BIM visualization for maintenance issue classification and
enhanced data collection,” Advanced Engineering Informatics, vol. 38, no. Octo-
ber 2017, pp. 101–112, 2018.
[22] C. C. Federspiel, “Predicting the frequency and cost of hot and cold complaints
in buildings,” HVAC&R Research, vol. 6, no. 1, pp. 289–305, 2001.
[23] D. Wang, C. C. Federspiel, and E. Arens, “Correlation between temperature
satisfaction and unsolicited complaint rates in commercial buildings,” Indoor
Air, vol. 15, no. 1, pp. 13–18, 2005.
[24] R. Bortolini and N. Forcada, “Analysis of building maintenance requests using
a text mining approach: building services evaluation,” Building Research and
Information, vol. 48, no. 2, pp. 207–217, 2019.
[25] B. Bordass, R. Cohen, M. Standeven, and A. Leaman, “Assessing building perfor-
mance in use 2: technical performance of the probe buildings,” Building Research
& Information, vol. 29, no. 2, pp. 103–113, 2001.
[26] H. Kato, L. Too, and A. Rask, “Occupier perceptions of green workplace envi-
ronment: The Australian experience,” Journal of Corporate Real Estate, vol. 11,
no. 3, pp. 183–195, 2009.
[27] A. Keyvanfar, A. Shafaghat, M. Z. A. Majid, H. Lamit, and K. N. Ali, “Correla-
tion study on user satisfaction from adaptive behavior and energy consumption
in office buildings,” Jurnal Teknologi, vol. 70, no. 7, pp. 89–97, 2014.
[28] “The Well Building Standard, ” url: https://a.storyblok.com/f/52232/x/406c235c09/well-
v1-with-q4-2019-addenda.pdf, 2019.
[29] G. R. Newsham, B. J. Birt, C. Arsenault, A. J. Thompson, J. A. Veitch,
S. Mancini, A. D. Galasiu, B. N. Gover, I. A. MacDonald, and G. J. Burns,
“Do green buildings have better indoor environments? New evidence,” Building
Research and Information, vol. 41, no. 4, pp. 415–434,2:01 PM 2020-03-22 2013.
[30] H. Burak Gunay, W. Shen, and G. Newsham, “Data analytics to improve building
performance: A critical review,” Automation in Construction, vol. 97, no. June
2018, pp. 96–109, 2019.
101
[31] C. C. Federspiel, “Predicting the Frequency and Cost of Hot and Cold Com-
plaints in Buildings,” in ASHRAE Winter Meeting CD, Technical and Sympo-
sium Papers, 2001.
[32] D. Wang, C. C. Federspiel, and E. Arens, “Correlation between temperature
satisfaction and unsolicited complaint rates in commercial buildings,” Indoor
Air, vol. 15, no. 1, pp. 13–18, 2005.
[33] H. B. Gunay, W. Shen, and C. Yang, “Text-mining building maintenance work
orders for component fault frequency, vol. 47, no. 5, pp. 518–533, 2018.
[34] S. Dutta, H. B. Gunay, and S. Bucking, “A method for extracting performance
metrics using work-order data A method for extracting performance metrics
using work- order data,” Science and Technology for the Built Environment,
vol. 0, no. 0, pp. 1–12, 2019.
[35] D. Besiktepe, M. E. Ozbek, and R. A. Atadero, “Analysis of the maintenance
work order data in educational institutions,” ISEC 2019 - 10th International
Structural Engineering and Construction Conference, no. May, 2019.
[36] A. Leaman and B. Bordass, “Productivity in buildings: the ‘killer’ variables,”
Building Research & Information, vol. 27, no. 1, pp. 4–19, 1999.
[37] S. Karjalainen, “Thermal comfort and use of thermostats in Finnish homes and
offices,” Building and Environment, vol. 44, no. 6, pp. 1237 – 1245, 2009.
[38] H. B. Gunay, W. O’Brien, I. Beausoleil-Morrison, and J. Bursill, “Development
and implementation of a thermostat learning algorithm,” Science and Technology
for the Built Environment, vol. 24, no. 1, pp. 43–56, 2018.
[39] T. Peffer, M. Pritoni, A. Meier, C. Aragon, and D. Perry, “How people use
thermostats in homes: A review,” Building and Environment, vol. 46, no. 12,
pp. 2529–2541, 2011.
[40] P. Jayathissa, M. Quintana, T. Sood, N. Narzarian, and C. Miller, “Is your clock-
face cozie ? A smartwatch methodology for the in-situ collection of occupant
comfort data,” CISBAT2019 Climate Resilient Buildings - Energy Efficiency &
Renewables in the Digital Era, 2019.
[41] J. Goins and M. Moezzi, “Links between occupant complaint handling and build-
ing performance, vol. 42, no. 3, pp. 362–372, 2012.
102
[42] M. Moezzi and J. Goins, “Text mining for occupant perspectives on the physical
workplace,” Building Research and Information, vol. 42, no. 3, pp. 362–372, 2011.
[43] S. Dutta, “Comparison of Sentiment Analysis Methods,” url: