40
The Inner Workings of Accounting and Finance BENCHMARKING THE FINANCE FUNCTION
The Inner Workings of Accounting and Finance
201
3BENCHMARKINGThe FInAnce FuncTIon
Benchmarking the Finance Function: 2013Robert Half • Financial Executives Research Foundation 2
Benchmarking the Finance Function: 2013 The Inner Workings of Accounting and Finance
Developed in collaboration with Robert Half
Thomas Thompson Jr. Senior Associate, Research
Financial Executives Research Foundation
Paul McDonald Senior Executive Director
Robert Half
the source for financial solutions
1250 Headquarters Plaza West Tower, 7th Floor Morristown, NJ 07960 www.ferf.org
2884 Sand Hill Road Menlo Park, CA 94025 650-234-6000 www.roberthalf.com
Benchmarking the Finance Function: 2013Robert Half • Financial Executives Research Foundation 3
Table of Contents
Executive Summary . . . . . . . . . . . . . . . . . . . . . . . . . . . . . . . . . . . . . . . . . . . . . . . . . . . . . . . 4
Research Methodology and Respondent Demographics . . . . . . . . . . . . . . . . . . . . 6
Workforce Management . . . . . . . . . . . . . . . . . . . . . . . . . . . . . . . . . . . . . . . . . . . . . . . . . .11
Accounting Operations . . . . . . . . . . . . . . . . . . . . . . . . . . . . . . . . . . . . . . . . . . . . . . . . . . .16
Financial Systems . . . . . . . . . . . . . . . . . . . . . . . . . . . . . . . . . . . . . . . . . . . . . . . . . . . . . . . .20
Sourcing . . . . . . . . . . . . . . . . . . . . . . . . . . . . . . . . . . . . . . . . . . . . . . . . . . . . . . . . . . . . . . . . .25
Internal Controls . . . . . . . . . . . . . . . . . . . . . . . . . . . . . . . . . . . . . . . . . . . . . . . . . . . . . . . . .29
Compliance . . . . . . . . . . . . . . . . . . . . . . . . . . . . . . . . . . . . . . . . . . . . . . . . . . . . . . . . . . . . . .32
Summary: Putting the Data to Work . . . . . . . . . . . . . . . . . . . . . . . . . . . . . . . . . . . . . . .36
Acknowledgments . . . . . . . . . . . . . . . . . . . . . . . . . . . . . . . . . . . . . . . . . . . . . . . . . . . . . . .37
About the Authors . . . . . . . . . . . . . . . . . . . . . . . . . . . . . . . . . . . . . . . . . . . . . . . . . . . . . . . .37
About Robert Half . . . . . . . . . . . . . . . . . . . . . . . . . . . . . . . . . . . . . . . . . . . . . . . . . . . . . . .38
About Financial Executives Research Foundation . . . . . . . . . . . . . . . . . . . . . . . . .38
Benchmarking the Finance Function: 2013Robert Half • Financial Executives Research Foundation 4
Increasingly, accounting and finance professionals are serving as strategic business partners to managers throughout the firm. A company’s accounting and finance departments, often referred to collectively as the finance function, have traditionally ensured the precision, accuracy and integrity of transactional processing, consolidation, reconciliation and financial statement reporting.
These critical responsibilities are still the chief function of the finance team, but the level of involvement varies depending on the organization. In the case of a U.S. company expanding globally, for example, the role of the finance executive may include developing the infrastructure and expertise to operate in foreign jurisdictions with accounting standards that differ from U.S. generally accepted accounting principles (GAAP). In the case of a private equity-owned business, senior finance leaders may be asked to recommend efficiencies that will help to balance the long-term outlook of the company with the short-term interests of investors. Other areas where finance professionals may be called upon for their advice include mergers and acquisitions, IT spending, and software or hardware upgrades.
Becoming a strategic business partner requires having a solid understanding of existing capabilities and challenges, as well as a point of reference. Benchmarks and standards make it possible for departments to judge whether a) they have sufficient staff to meet goals, b) their processes are friction-free and c) they are observing industry best practices.
To provide industry professionals with these important yardsticks, Financial Executives Research Foundation (FERF) and Robert Half are pleased to present the fourth annual Benchmarking the Finance Function report. Information in the report is based on surveys of executives in the finance departments of approximately 200 public, private, government and nonprofit firms that range in size from less than $25 million in revenue (revenue based on local currency) to more than $5 billion. Survey respondents were primarily from the United States and Canada. In addition, follow-up interviews were conducted with several of the respondents to gain a deeper understanding of the data. While many of these executives were named within the report, others requested to remain anonymous, yet offered valuable insight. Respondents considered part of the “finance function” included professionals in accounts payable (A/P), accounts receivable (A/R), budget and analysis, cost accounting, credit and collections, finance, financial reporting, international accounting, payroll, internal controls, tax, and treasury.
Executive Summary
Benchmarking the Finance Function: 2013Robert Half • Financial Executives Research Foundation 5
Key FinDings
• U.S. management-level accounting and finance employees work an average of 48 hours in a standard week; non-management staff work an average of 42 hours. In Canada, the weekly hours worked by managers and staff are 44 and 39 hours, respectively. Where these hours regularly exceed the standard workweek, staff are being supplemented — especially during peak workload periods — with the use of skilled project professionals.
• Despite ongoing growth in the number of general ledger accounts, nearly two-thirds (65 percent) of U.S. companies still reconcile accounts manually, placing a strain on staff and resources. Many companies are seeking solutions for automating the process of closing the books.
• Eighty percent of U.S. companies and 86 percent of companies in Canada use an enterprise resource planning (ERP) system. The use of on-demand software, or Software as a Service (SaaS), such as ADP, also is increasing.
• Microsoft Dynamics GP is the ERP system of choice for companies with less than $100 million in revenue; Oracle/PeopleSoft ERP is the top application among companies with revenue from $500 million to $4.9 billion.
• Payroll is the single most outsourced function, on average, for all respondent companies, followed by tax. Accounts payable is emerging as a possible candidate for additional outsourcing.
• Larger companies are more likely to have an internal audit function responsible for compliance activities. At smaller firms, the compliance function most often resides with the financial reporting or general accounting departments.
• Some 95 percent of U.S. executives and 92 percent of executives in Canada expect their compliance burden to either increase or, at a minimum, not diminish over time. More streamlined regulations could one day play a part in easing these concerns.
How To Use THis RePoRT
Benchmarking the Finance Function: 2013 is divided into six sections: Workforce Management, Accounting Operations, Financial Systems, Sourcing, Internal Controls and Compliance.
Each section offers:
• Key Findings — An overview of major trends identified in the survey and in follow-up interviews with executives
• Discussion and Analysis — Breakdowns of actual survey results, accompanied by charts and tables
• Points of View — Real examples taken from interviews with executives
• Takeaways — Executive insights
• Questions to Consider — Actionable steps for finance leaders
Survey results also are available online and can be searched using Financial Executives Research Foundation’s (FERF’s) online benchmarking tool, FinanceFunctionCheck. This tool is available to FEI members and nonmembers who have purchased the report on the FERF website (www.ferf.org), under products and services.

Benchmarking the Finance Function: 2013Robert Half • Financial Executives Research Foundation 6
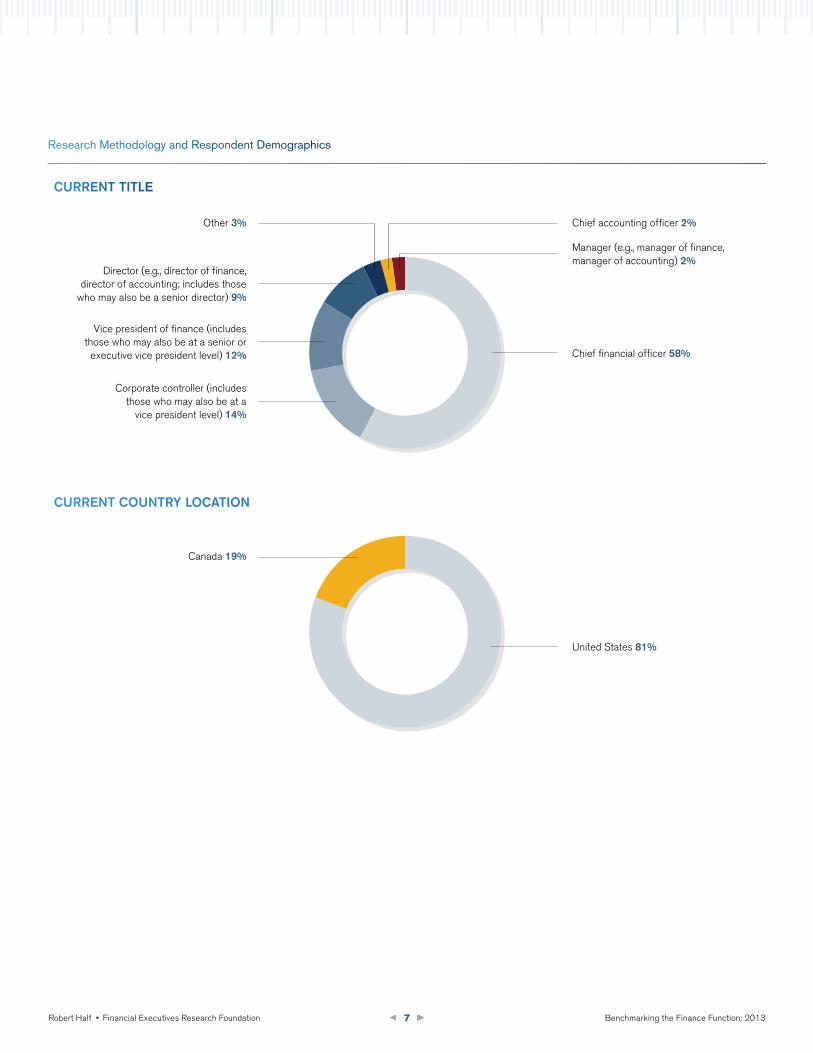
In November 2012, FERF and Robert Half conducted their fourth annual benchmarking survey of finance departments at 192 public and private companies, mainly in the United States and Canada. The data contained within this report were compiled from responses to a 48-question online survey. More than half (58 percent) of the respondents identified themselves as chief financial officers (CFOs), and the majority (81 percent) were located in the United States, while 19 percent were located in Canada.
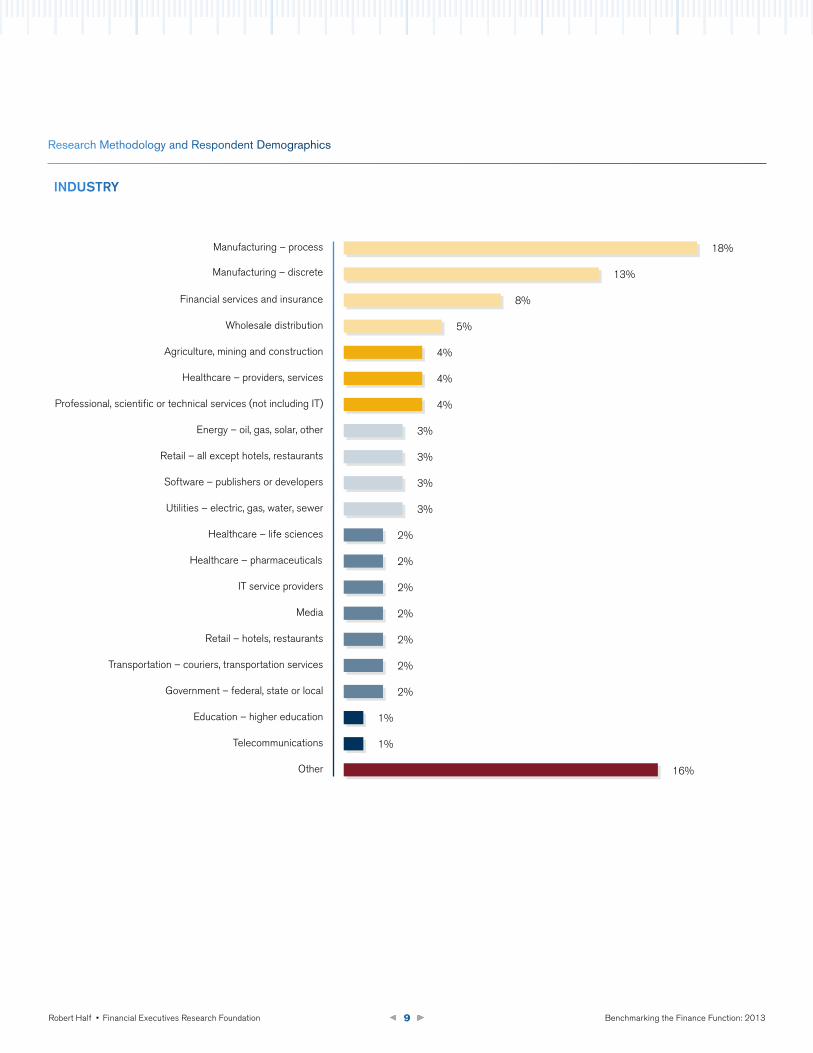
Manufacturing was the most represented industry, with 18 percent identifying their company as a process manufacturer and 13 percent identifying their company as a discrete manufacturer. In addition, the survey looked at the number of business divisions/units within respondent companies, whether they have centralized or decentralized finance functions, and where their finance and accounting operations are based. The charts and graphs that follow represent the demographic profile of respondents.
Although not stated in every instance, all commentary presented in this report reflects the opinions of executives interviewed by FERF and Robert Half. Many trends, however, may have implications on a broader scale.
Throughout this report, there are tables referring to the top and bottom quartiles, as well as the median. These quartiles and median represent the three points that divide the total response rate for a given question into four groups. Each group represents a fourth of the sample group. Therefore, a response or value that is equal to or above the top 25 percent figure would be considered in the top or upper quartile.
Research Methodology and Respondent Demographics
Benchmarking the Finance Function: 2013Robert Half • Financial Executives Research Foundation 7
Manager (e.g., manager of finance, manager of accounting) 2%
Chief financial officer 58%
Vice president of finance (includes those who may also be at a senior or
executive vice president level) 12%
Corporate controller (includes those who may also be at a
vice president level) 14%
Director (e.g., director of finance, director of accounting; includes those
who may also be a senior director) 9%
Other 3% Chief accounting officer 2%
CURRenT TiTle
Canada 19%
United States 81%
CURRenT CoUnTRy loCATion
Research Methodology and Respondent Demographics
Benchmarking the Finance Function: 2013Robert Half • Financial Executives Research Foundation 8
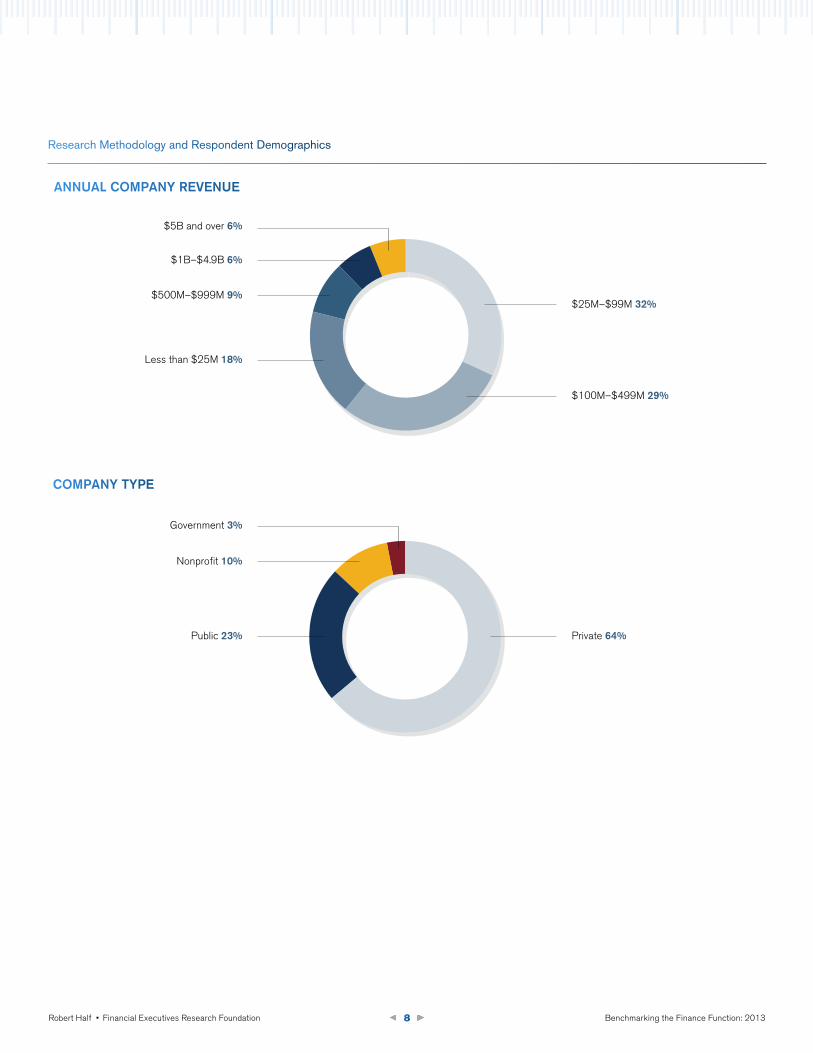
AnnUAl CoMPAny ReVenUe
CoMPAny TyPe
Public 23%
Government 3%
$5B and over 6%
$1B–$4.9B 6%
$500M–$999M 9%
Less than $25M 18%
Nonprofit 10%
Private 64%
$25M–$99M 32%
$100M–$499M 29%
Research Methodology and Respondent Demographics
Benchmarking the Finance Function: 2013Robert Half • Financial Executives Research Foundation 9
inDUsTRy
Wholesale distribution
Healthcare – providers, services
IT service providers
Media
Retail – hotels, restaurants
Transportation – couriers, transportation services
Government – federal, state or local
Education – higher education
Financial services and insurance
Manufacturing – process
Manufacturing – discrete
Agriculture, mining and construction
Healthcare – pharmaceuticals
Professional, scientific or technical services (not including IT)
Energy – oil, gas, solar, other
Retail – all except hotels, restaurants
Software – publishers or developers
Utilities – electric, gas, water, sewer
Healthcare – life sciences
Other
Telecommunications
18%
13%
8%
5%
4%
4%
4%
3%
3%
3%
3%
2%
2%
2%
2%
2%
2%
2%
1%
1%
16%
Research Methodology and Respondent Demographics
Benchmarking the Finance Function: 2013Robert Half • Financial Executives Research Foundation 10
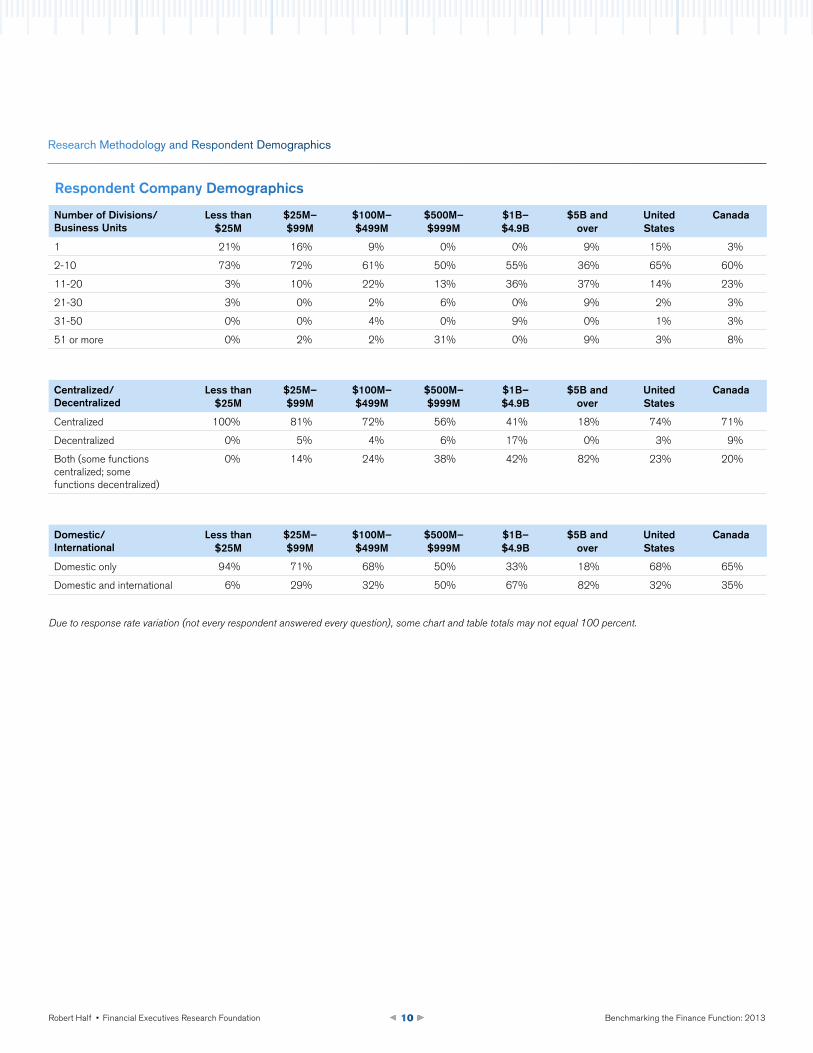
Respondent Company Demographics
number of Divisions/ Business Units
less than $25M
$25M– $99M
$100M–$499M
$500M–$999M
$1B– $4.9B
$5B and over
United states
Canada
1 21% 16% 9% 0% 0% 9% 15% 3%
2-10 73% 72% 61% 50% 55% 36% 65% 60%
11-20 3% 10% 22% 13% 36% 37% 14% 23%
21-30 3% 0% 2% 6% 0% 9% 2% 3%
31-50 0% 0% 4% 0% 9% 0% 1% 3%
51 or more 0% 2% 2% 31% 0% 9% 3% 8%
Centralized/Decentralized
less than $25M
$25M– $99M
$100M–$499M
$500M–$999M
$1B– $4.9B
$5B and over
United states
Canada
Centralized 100% 81% 72% 56% 41% 18% 74% 71%
Decentralized 0% 5% 4% 6% 17% 0% 3% 9%
Both (some functions centralized; some functions decentralized)
0% 14% 24% 38% 42% 82% 23% 20%
Domestic/ international
less than $25M
$25M– $99M
$100M–$499M
$500M–$999M
$1B– $4.9B
$5B and over
United states
Canada
Domestic only 94% 71% 68% 50% 33% 18% 68% 65%
Domestic and international 6% 29% 32% 50% 67% 82% 32% 35%
Due to response rate variation (not every respondent answered every question), some chart and table totals may not equal 100 percent.
Research Methodology and Respondent Demographics
Benchmarking the Finance Function: 2013Robert Half • Financial Executives Research Foundation 11
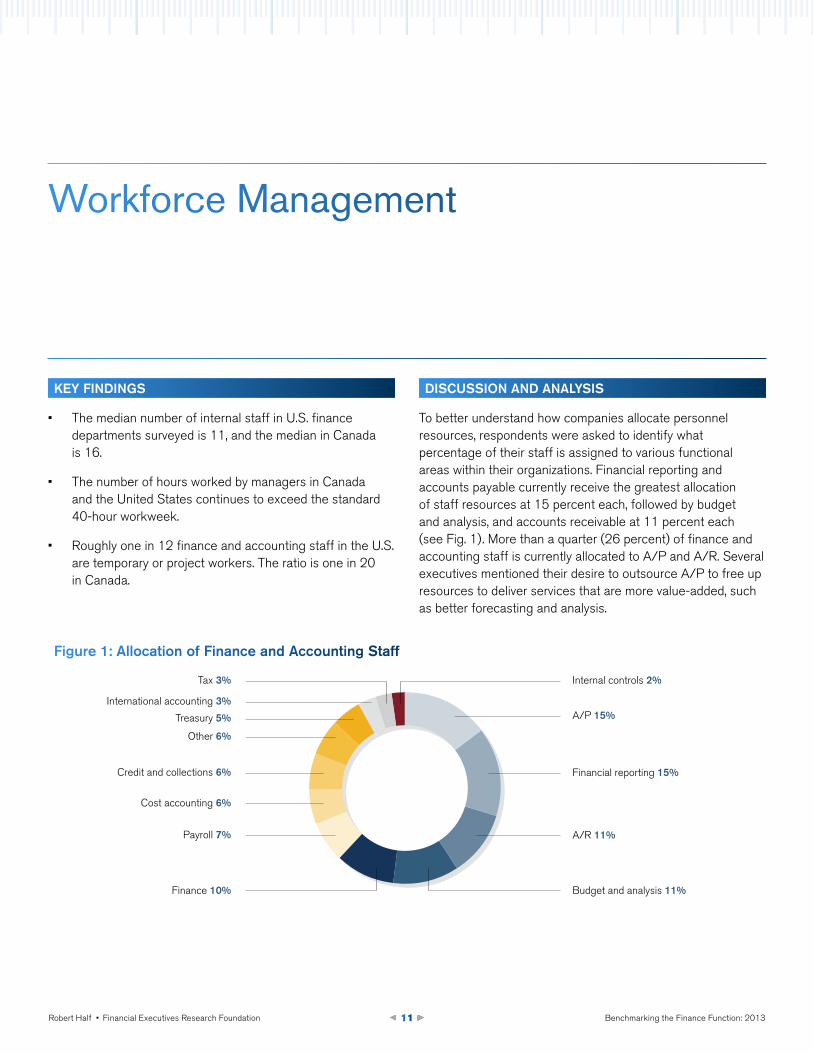
A/P 15%
Internal controls 2%
Financial reporting 15%
A/R 11%
Budget and analysis 11%Finance 10%
Payroll 7%
Cost accounting 6%
Credit and collections 6%
Other 6%
Treasury 5%
International accounting 3%
Tax 3%
Key FinDings
• The median number of internal staff in U.S. finance departments surveyed is 11, and the median in Canada is 16.
• The number of hours worked by managers in Canada and the United States continues to exceed the standard 40-hour workweek.
• Roughly one in 12 finance and accounting staff in the U.S. are temporary or project workers. The ratio is one in 20 in Canada.
DisCUssion AnD AnAlysis
To better understand how companies allocate personnel resources, respondents were asked to identify what percentage of their staff is assigned to various functional areas within their organizations. Financial reporting and accounts payable currently receive the greatest allocation of staff resources at 15 percent each, followed by budget and analysis, and accounts receivable at 11 percent each (see Fig. 1). More than a quarter (26 percent) of finance and accounting staff is currently allocated to A/P and A/R. Several executives mentioned their desire to outsource A/P to free up resources to deliver services that are more value-added, such as better forecasting and analysis.
Workforce Management
Figure 1: Allocation of Finance and Accounting staff
Benchmarking the Finance Function: 2013Robert Half • Financial Executives Research Foundation 12
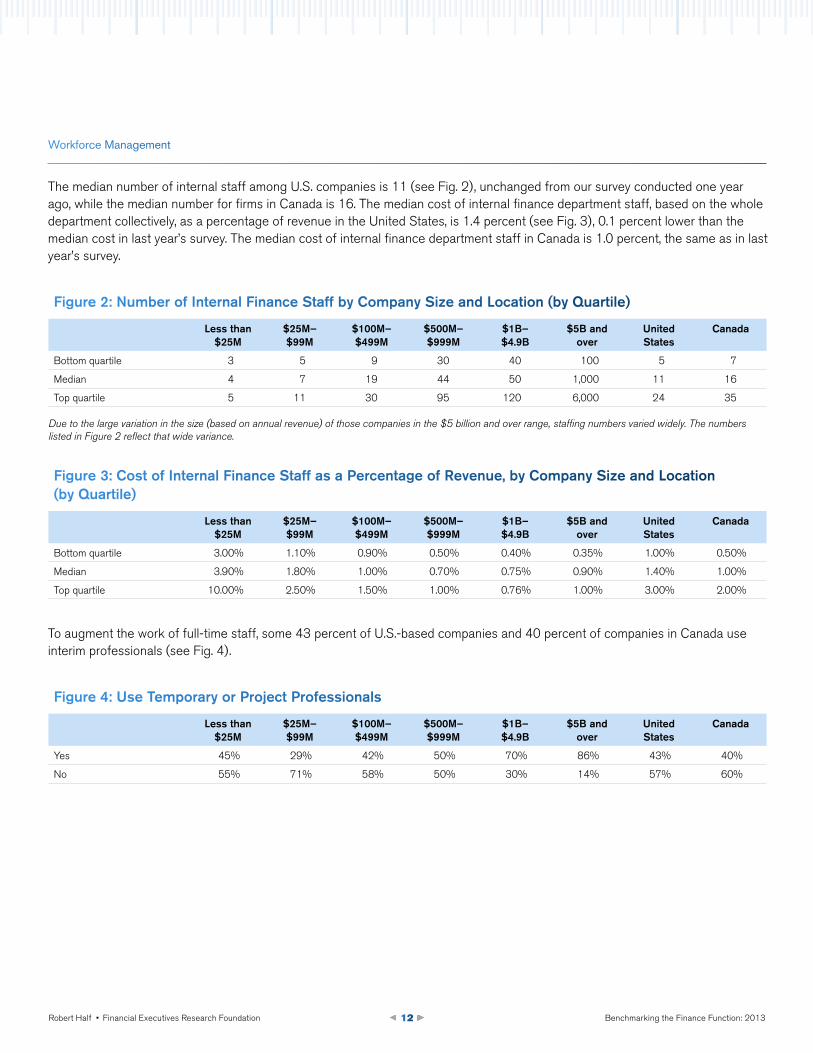
The median number of internal staff among U.S. companies is 11 (see Fig. 2), unchanged from our survey conducted one year ago, while the median number for firms in Canada is 16. The median cost of internal finance department staff, based on the whole department collectively, as a percentage of revenue in the United States, is 1.4 percent (see Fig. 3), 0.1 percent lower than the median cost in last year’s survey. The median cost of internal finance department staff in Canada is 1.0 percent, the same as in last year’s survey.
Figure 2: number of internal Finance staff by Company size and location (by Quartile)
less than $25M
$25M– $99M
$100M–$499M
$500M–$999M
$1B– $4.9B
$5B and over
United states
Canada
Bottom quartile 3 5 9 30 40 100 5 7
Median 4 7 19 44 50 1,000 11 16
Top quartile 5 11 30 95 120 6,000 24 35
Due to the large variation in the size (based on annual revenue) of those companies in the $5 billion and over range, staffing numbers varied widely. The numbers listed in Figure 2 reflect that wide variance.
Workforce Management
Figure 3: Cost of internal Finance staff as a Percentage of Revenue, by Company size and location (by Quartile)
less than $25M
$25M– $99M
$100M–$499M
$500M–$999M
$1B– $4.9B
$5B and over
United states
Canada
Bottom quartile 3.00% 1.10% 0.90% 0.50% 0.40% 0.35% 1.00% 0.50%
Median 3.90% 1.80% 1.00% 0.70% 0.75% 0.90% 1.40% 1.00%
Top quartile 10.00% 2.50% 1.50% 1.00% 0.76% 1.00% 3.00% 2.00%
Figure 4: Use Temporary or Project Professionals
less than $25M
$25M– $99M
$100M–$499M
$500M–$999M
$1B– $4.9B
$5B and over
United states
Canada
Yes 45% 29% 42% 50% 70% 86% 43% 40%
No 55% 71% 58% 50% 30% 14% 57% 60%
To augment the work of full-time staff, some 43 percent of U.S.-based companies and 40 percent of companies in Canada use interim professionals (see Fig. 4).
Benchmarking the Finance Function: 2013Robert Half • Financial Executives Research Foundation 13
Workforce Management
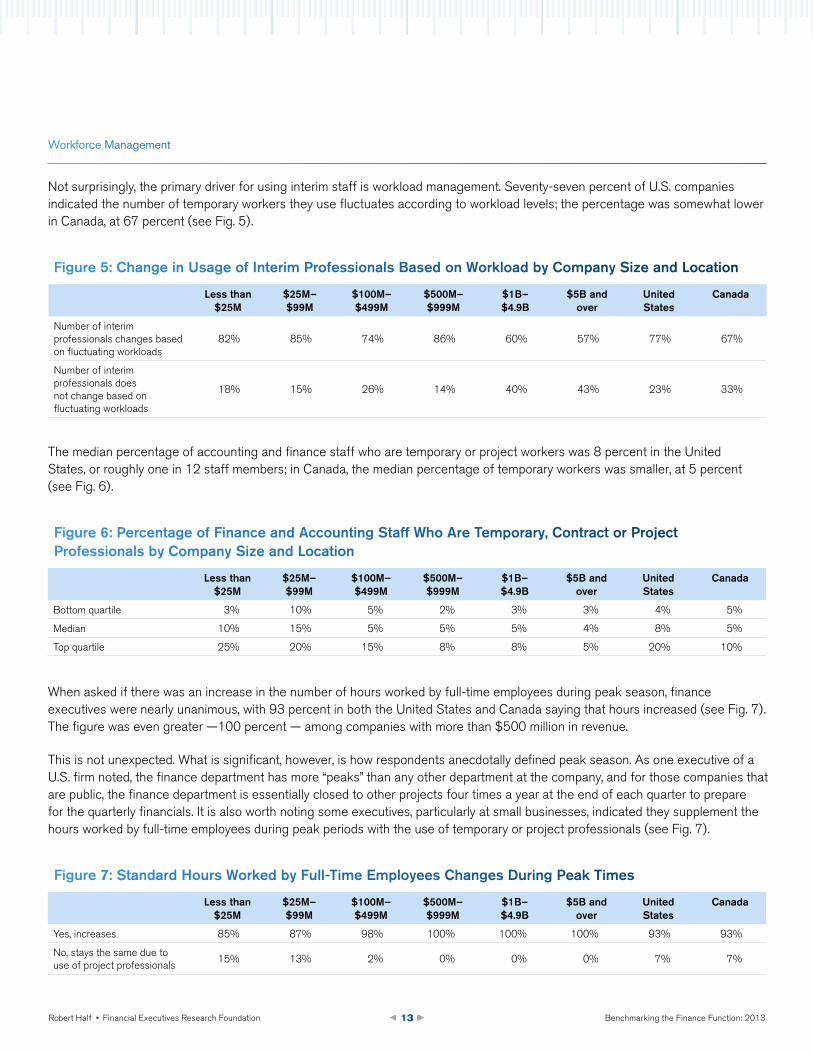
Not surprisingly, the primary driver for using interim staff is workload management. Seventy-seven percent of U.S. companies indicated the number of temporary workers they use fluctuates according to workload levels; the percentage was somewhat lower in Canada, at 67 percent (see Fig. 5).
Figure 5: Change in Usage of interim Professionals Based on workload by Company size and location
less than $25M
$25M– $99M
$100M–$499M
$500M–$999M
$1B– $4.9B
$5B and over
United states
Canada
Number of interim professionals changes based on fluctuating workloads
82% 85% 74% 86% 60% 57% 77% 67%
Number of interim professionals does not change based on fluctuating workloads
18% 15% 26% 14% 40% 43% 23% 33%
The median percentage of accounting and finance staff who are temporary or project workers was 8 percent in the United States, or roughly one in 12 staff members; in Canada, the median percentage of temporary workers was smaller, at 5 percent (see Fig. 6).
When asked if there was an increase in the number of hours worked by full-time employees during peak season, finance executives were nearly unanimous, with 93 percent in both the United States and Canada saying that hours increased (see Fig. 7). The figure was even greater —100 percent — among companies with more than $500 million in revenue.
This is not unexpected. What is significant, however, is how respondents anecdotally defined peak season. As one executive of a U.S. firm noted, the finance department has more “peaks” than any other department at the company, and for those companies that are public, the finance department is essentially closed to other projects four times a year at the end of each quarter to prepare for the quarterly financials. It is also worth noting some executives, particularly at small businesses, indicated they supplement the hours worked by full-time employees during peak periods with the use of temporary or project professionals (see Fig. 7).
Figure 6: Percentage of Finance and Accounting staff who Are Temporary, Contract or Project Professionals by Company size and location
less than $25M
$25M– $99M
$100M–$499M
$500M–$999M
$1B– $4.9B
$5B and over
United states
Canada
Bottom quartile 3% 10% 5% 2% 3% 3% 4% 5%
Median 10% 15% 5% 5% 5% 4% 8% 5%
Top quartile 25% 20% 15% 8% 8% 5% 20% 10%
Figure 7: standard Hours worked by Full-Time employees Changes During Peak Times
less than $25M
$25M– $99M
$100M–$499M
$500M–$999M
$1B– $4.9B
$5B and over
United states
Canada
Yes, increases 85% 87% 98% 100% 100% 100% 93% 93%
No, stays the same due to use of project professionals
15% 13% 2% 0% 0% 0% 7% 7%
Benchmarking the Finance Function: 2013Robert Half • Financial Executives Research Foundation 14
PoinTs oF View: woRKFoRCe CHAllenges
Filling jobs has become a more complex process for finance and accounting departments. This, to a degree, is a reflection of the tight market for skilled professionals. Organizations of all sizes increasingly seek higher-level analytical accounting and finance skills. ENMAX Corp., a $3.1 billion utility based in Calgary, Alberta, for example, wants to attract and retain individuals with highly specialized accounting skills, such as hedge and derivative-contract accounting and tax expertise. “The recruitment of financial professionals is less challenging at more junior levels. However, at the senior level there are fewer candidates,” explained Melanie Litoski, vice president of finance and controller at ENMAX.
The need for experienced, capable talent was a theme echoed by Canadian Western Bank Group Senior Vice President and Chief Accountant Carolyn Graham. “The world has become more complex,” she said. The bank, based in Edmonton, Alberta, has added staff at the senior, rather than junior, level. “We need people who can deal with complex issues and think critically about where we need to go, what we need to get there and how to provide the information to support the organization.” At the same time, she emphasized, the company seeks generalists with strong, broad-based skills, rather than a more narrow or limited expertise.
Several executives noted the unique recruiting challenges faced by smaller companies when competing for skilled candidates against larger firms. A CFO of a small, private manufacturing business in Michigan noted his firm “struggles with a little bit of a brand issue. If you’re an IBM, you can recruit people just with that name. If you’re a small company, you’re at a disadvantage when no one knows who you are. It’s not even a matter of benefits — we offer a competitive package. It’s amazing how much name recognition drives prospective employees’ decision-making.”
Commenting on the types of candidates often sought by smaller firms, the CFO added he looks for candidates who can “wear many hats.” He doesn’t have the resources to hire individuals who specialize in one area but needs employees with broader backgrounds who can tackle multiple tasks.
Comments from survey respondents paint a picture of rising demand for interim workers as organizations pursue more flexible staffing arrangements. Executives pointed to a number of reasons they frequently supplement their core full-time workforce with skilled temporary and project workers. Following are two such examples:
“We have had a hard time finding a candidate for a manager role,” said Vice President of Finance and CFO Don Tuscany of Employee Benefits Corp., a third-party administrator of financial services based in Middleton, Wis. Candidates with a strategic background, he said, often have little interest in the day-to-day work, while those willing to do the day-to-day work often are not strategists. Given these circumstances, Tuscany said the company started using project professionals to access the right blend of skills they need.
“Calgary is a hot market for all areas, finance professionals included,” said Litoski. As a result, turnover in finance roles at the company is high, running between 10 percent and 15 percent, she said, adding that rates may increase as the broader economy and job market continue to improve. To address the situation, she reported, the firm uses interim or project professionals for coverage.
Workforce Management
Benchmarking the Finance Function: 2013Robert Half • Financial Executives Research Foundation 15
TAKeAwAys
• The finance department has more “peaks” in workload than most departments in a company.
• Finance departments’ highest allocation of personnel resources is in the areas of financial reporting and accounts payable, reflecting the labor-intensive nature of both functions.
• Demand for interim workers appears to be gaining momentum as organizations look to more flexible staffing arrangements. Firms are working with temporary and project professionals to access specialized finance skills not available internally, augment core staff, support growth opportunities and evaluate potential candidates for full-time hire.
QUesTions To ConsiDeR
• Is peak or seasonal business activity causing project backlog?
• Are mission-critical projects being deferred due to internal resource limitations?
• Are staff members exhibiting signs of low morale, stress or burnout?
• How could using skilled project professionals benefit the business?
• Does the relationship with my staffing provider result in getting the most qualified resources?
Workforce Management
Benchmarking the Finance Function: 2013Robert Half • Financial Executives Research Foundation 16
Figure 8: number of Active general ledger Accounts by Company size and location
less than $25M
$25M– $99M
$100M–$499M
$500M–$999M
$1B– $4.9B
$5B and over
United states
Canada
100–500 76% 56% 47% 8% 8% 27% 49% 46%
501–1,000 10% 29% 29% 15% 8% 37% 25% 17%
1,001–3,000 10% 9% 14% 38% 25% 27% 16% 17%
3,001–5,000 4% 2% 4% 8% 8% 0% 2% 8%
5,001–10,000 0% 4% 6% 8% 43% 0% 4% 12%
More than 10,000 0% 0% 0% 23% 8% 9% 4% 0%
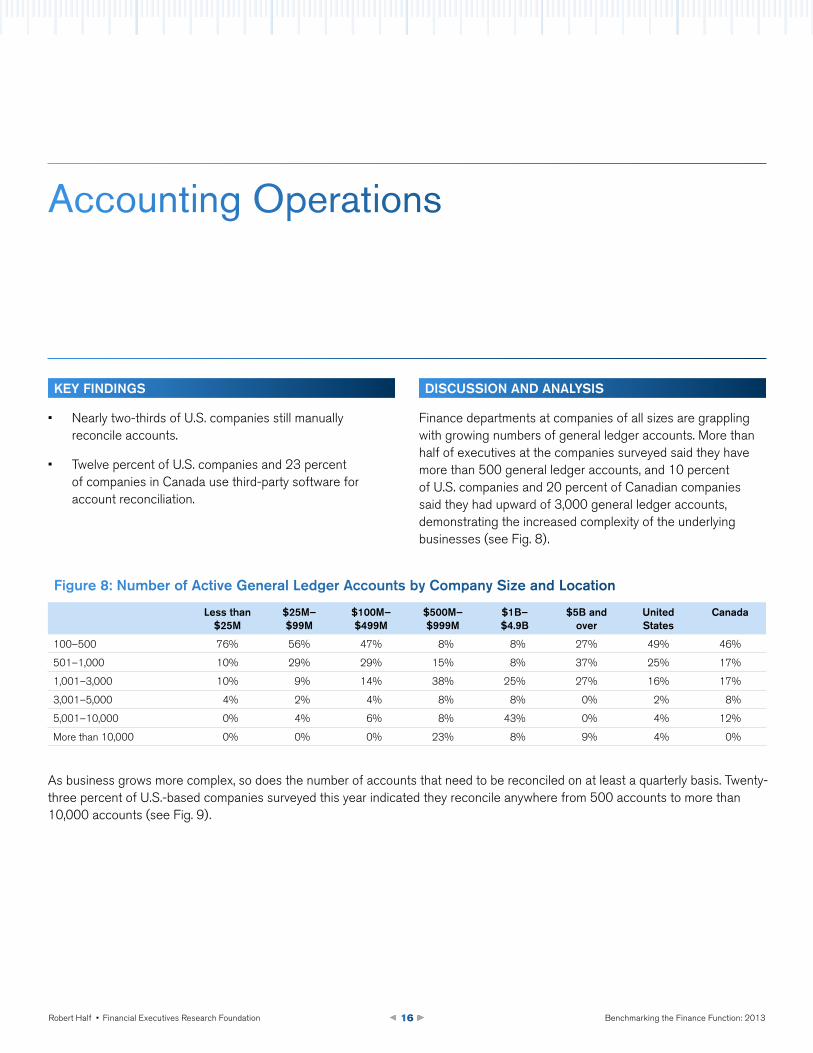
Key FinDings
• Nearly two-thirds of U.S. companies still manually reconcile accounts.
• Twelve percent of U.S. companies and 23 percent of companies in Canada use third-party software for account reconciliation.
DisCUssion AnD AnAlysis
Finance departments at companies of all sizes are grappling with growing numbers of general ledger accounts. More than half of executives at the companies surveyed said they have more than 500 general ledger accounts, and 10 percent of U.S. companies and 20 percent of Canadian companies said they had upward of 3,000 general ledger accounts, demonstrating the increased complexity of the underlying businesses (see Fig. 8).
As business grows more complex, so does the number of accounts that need to be reconciled on at least a quarterly basis. Twenty-three percent of U.S.-based companies surveyed this year indicated they reconcile anywhere from 500 accounts to more than 10,000 accounts (see Fig. 9).
Accounting Operations
23%27%
12%
23%
65%
50%
Developed internally
United States
Canada
Third-party software
Manually reconcile/
do not use a tool or system
70%
60%
50%
40%
30%
20%
10%
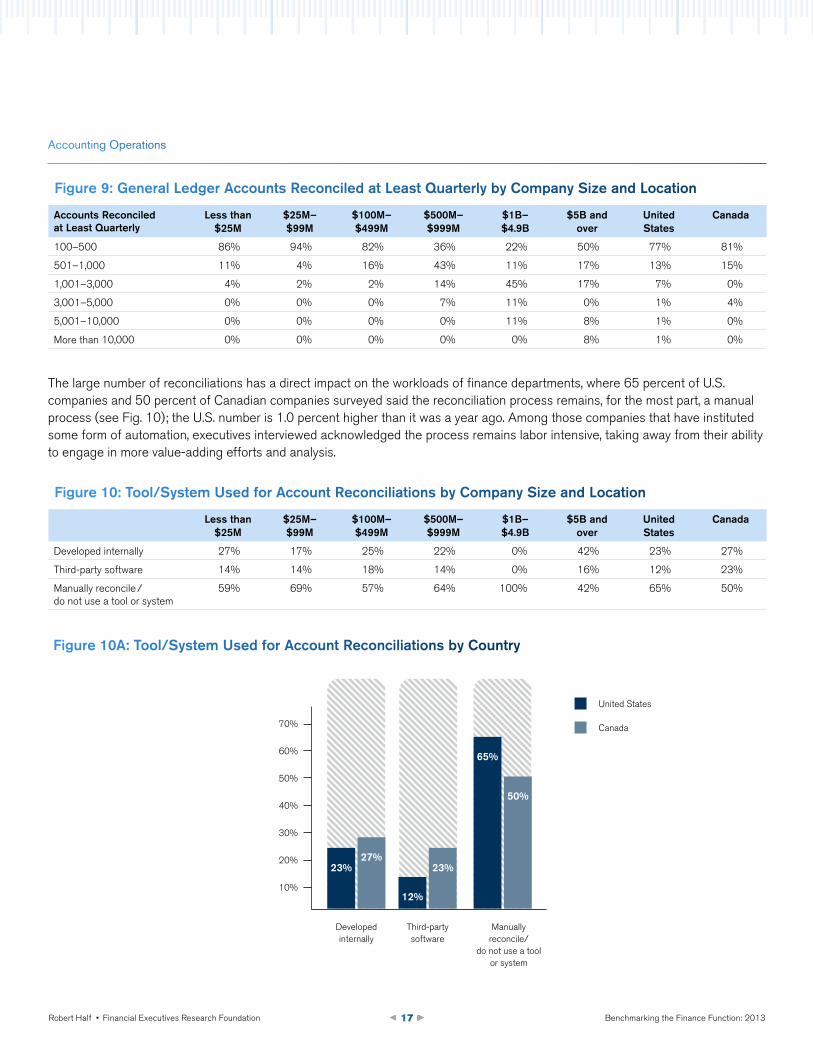
Figure 10A: Tool/system Used for Account Reconciliations by Country
Benchmarking the Finance Function: 2013Robert Half • Financial Executives Research Foundation 17
The large number of reconciliations has a direct impact on the workloads of finance departments, where 65 percent of U.S. companies and 50 percent of Canadian companies surveyed said the reconciliation process remains, for the most part, a manual process (see Fig. 10); the U.S. number is 1.0 percent higher than it was a year ago. Among those companies that have instituted some form of automation, executives interviewed acknowledged the process remains labor intensive, taking away from their ability to engage in more value-adding efforts and analysis.
Figure 9: general ledger Accounts Reconciled at least Quarterly by Company size and location
Accounts Reconciled at least Quarterly
less than $25M
$25M– $99M
$100M–$499M
$500M–$999M
$1B– $4.9B
$5B and over
United states
Canada
100–500 86% 94% 82% 36% 22% 50% 77% 81%
501–1,000 11% 4% 16% 43% 11% 17% 13% 15%
1,001–3,000 4% 2% 2% 14% 45% 17% 7% 0%
3,001–5,000 0% 0% 0% 7% 11% 0% 1% 4%
5,001–10,000 0% 0% 0% 0% 11% 8% 1% 0%
More than 10,000 0% 0% 0% 0% 0% 8% 1% 0%
Accounting Operations
Figure 10: Tool/system Used for Account Reconciliations by Company size and location
less than $25M
$25M– $99M
$100M–$499M
$500M–$999M
$1B– $4.9B
$5B and over
United states
Canada
Developed internally 27% 17% 25% 22% 0% 42% 23% 27%
Third-party software 14% 14% 18% 14% 0% 16% 12% 23%
Manually reconcile / do not use a tool or system
59% 69% 57% 64% 100% 42% 65% 50%
Benchmarking the Finance Function: 2013Robert Half • Financial Executives Research Foundation 18
PoinTs oF View: sTReAMlining THe Close
Given the challenges discussed previously, many executives advocate automating the closing of the books. Organizations able to achieve a quick, smooth close have a competitive advantage over those that become bogged down in the process, as it allows the finance department to utilize resources in higher-value activities. “It currently takes 15 days for us to produce the year-end statement, and I’d like to get that down to 11 days,” said Mike Williams, vice president of finance for Sonetics Corp., a wireless communications manufacturer in Portland, Ore. “I’m looking to maximize our opportunities and add value to our forward-looking activities.”
“We have placed greater emphasis on the reporting process and are increasingly turning to automation tools,” said Angela Riley, CFO of Northern Contours, Inc., a manufacturing firm in St. Paul, Minn. “We’ve reduced the time it takes to produce our monthly, quarterly and annual financial statements by nearly 50 percent.”
Account reconciliation is still a manual process at Employee Benefits Corp. But Tuscany said he is “pushing the company toward more automation. We are getting closer to the amount of automation I’d like to see us have.”
Some executives at smaller companies, however, are not convinced that available technology for automating the close is sufficiently tailored to their needs. They expressed concerns that their teams could end up expending more time and resources setting up a custom software package than it would take to continue with a manual process.
Indeed, using better technology may not be the only answer for streamlining the close. Process design and execution play key roles as well. When Canadian Western Bank Group instituted its new general ledger system, it implemented a more effective process to create and post entries. This process has helped reduce the number of reconciliations. “We don’t have as many intracompany reconciliations because we are able to get the entries right the first time,” said Graham.
Accounting Operations
Benchmarking the Finance Function: 2013Robert Half • Financial Executives Research Foundation 19
TAKeAwAys
• A fast, smooth close allows finance departments to reassign resources to other high-value, analytic activities.
• Smarter process design and execution can ease the financial reconciliation process.
• Re-examining the underlying posting processes may reduce the number of manual reconciliations and streamline the close.
• Some firms are using technology to help automate manual processes.
• Smaller firms may still be hesitant to invest in technology due to the cost and resources required for implementation.
QUesTions To ConsiDeR
• Are your processes and execution resulting in a fast, clean close?
• Is your firm anticipating a merger or acquisition? Do you have the necessary resources in terms of staff or technology to accommodate the potential impact to your accounting operations?
• Is your company undertaking a business transformation? Will you need to modify, adjust or upgrade your accounting operations?
• Does the company operate in multiple jurisdictions? Are your accounting operations in compliance with the rules and regulations of all locales?
• Does your accounting structure (chart of accounts, legal entities and processes) provide the stability that will allow efficiencies through automation?
Accounting Operations
Benchmarking the Finance Function: 2013Robert Half • Financial Executives Research Foundation 20
Key FinDings
• Approximately 80 percent of U.S. companies versus 86 percent of Canadian companies said they use ERP software as their primary financial planning system.
• Cloud technology, including SaaS, shows signs of gaining greater acceptance, especially among companies with a broad geographic footprint and those seeking to grow operations overseas.
• Microsoft Excel continues to serve as an important budgeting and planning tool.
DisCUssion AnD AnAlysis
To address needs such as those described in the Accounting Operations section and achieve the necessary efficiencies, finance organizations continue to embrace technology. To find out how exactly they are doing this, we asked survey respondents for details about their financial systems.
The use of ERP systems was essentially unchanged for U.S. companies compared to last year’s responses. Usage among Canadian companies increased by 10 percent compared to the year-earlier survey. More notable among this year’s findings is the growth of SaaS. Although it may be too early to judge the strength of SaaS as a trend, of interest is that 11 percent of companies in the $1 billion to $4.9 billion range use SaaS as their primary system, almost double the percentage reported in last year’s survey (see Fig. 11). SaaS achieves its efficiencies by allowing a company to lease, instead of buy, the software applications used by finance departments. Because SaaS runs on a vendor’s data center as opposed to running on servers on the company’s premises, the maintenance and support costs are built into the subscription-based pricing, providing more consistency for the organization.
Financial Systems
United States
Canada
Benchmarking the Finance Function: 2013Robert Half • Financial Executives Research Foundation 21
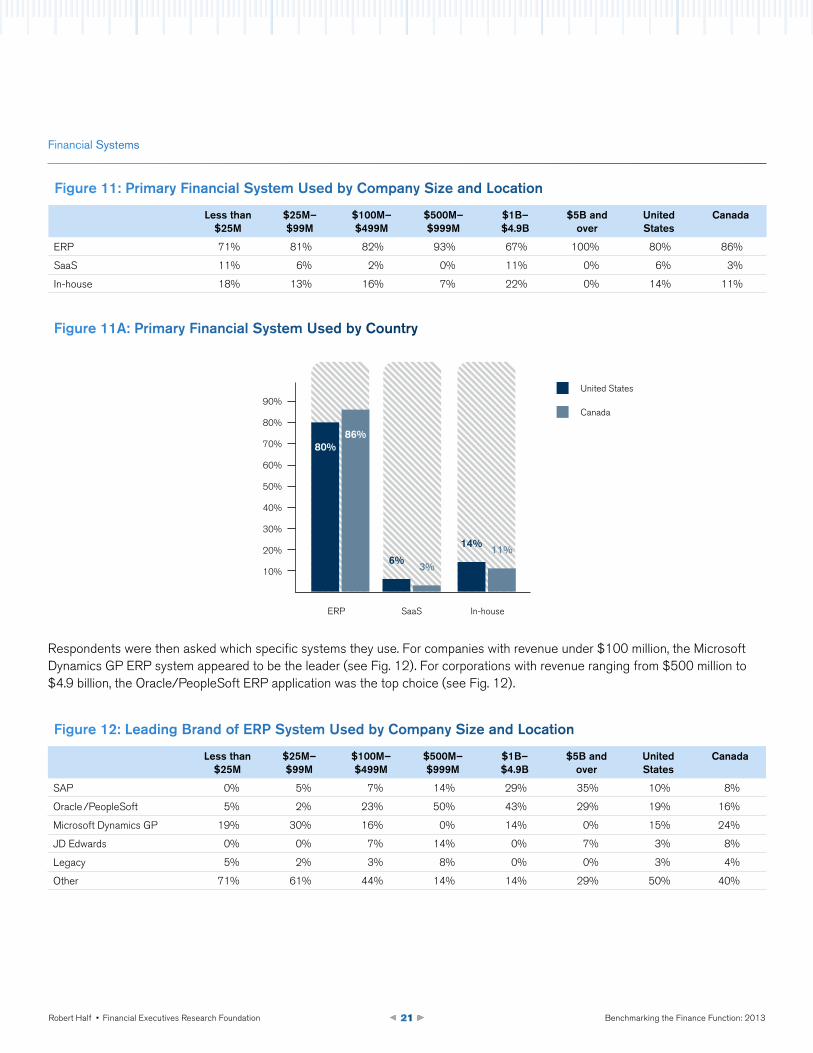
Figure 11: Primary Financial system Used by Company size and location
less than $25M
$25M– $99M
$100M–$499M
$500M–$999M
$1B– $4.9B
$5B and over
United states
Canada
ERP 71% 81% 82% 93% 67% 100% 80% 86%
SaaS 11% 6% 2% 0% 11% 0% 6% 3%
In-house 18% 13% 16% 7% 22% 0% 14% 11%
80%86%
6%3%
14%11%
25%
ERP SaaS In-house
90%
80%
70%
60%
50%
40%
30%
20%
10%
Figure 11A: Primary Financial system Used by Country
Financial Systems
Figure 12: leading Brand of eRP system Used by Company size and location
less than $25M
$25M– $99M
$100M–$499M
$500M–$999M
$1B– $4.9B
$5B and over
United states
Canada
SAP 0% 5% 7% 14% 29% 35% 10% 8%
Oracle /PeopleSoft 5% 2% 23% 50% 43% 29% 19% 16%
Microsoft Dynamics GP 19% 30% 16% 0% 14% 0% 15% 24%
JD Edwards 0% 0% 7% 14% 0% 7% 3% 8%
Legacy 5% 2% 3% 8% 0% 0% 3% 4%
Other 71% 61% 44% 14% 14% 29% 50% 40%
Respondents were then asked which specific systems they use. For companies with revenue under $100 million, the Microsoft Dynamics GP ERP system appeared to be the leader (see Fig. 12). For corporations with revenue ranging from $500 million to $4.9 billion, the Oracle/PeopleSoft ERP application was the top choice (see Fig. 12).
Benchmarking the Finance Function: 2013Robert Half • Financial Executives Research Foundation 22
Figure 13: leading Brand of saas system Used by Company size and location
less than $25M
$25M– $99M
$100M–$499M
$500M–$999M
$1B– $4.9B
$5B and over
United states
Canada
ADP 33% 25% 67% 100% 100% 0% 54% 0%
Intacct 17% 0% 0% 0% 0% 0% 8% 0%
Microsoft 0% 0% 0% 0% 0% 0% 0% 0%
NetSuite 0% 75% 0% 0% 0% 0% 23% 0%
WebEx 0% 0% 0% 0% 0% 0% 0% 0%
Other 50% 0% 33% 0% 0% 0% 15% 100%
Financial Systems
Figure 14: leading Types of Budgeting and Planning Tools Used by Company size and location
less than $25M
$25M– $99M
$100M–$499M
$500M–$999M
$1B– $4.9B
$5B and over
United states
Canada
ERP 7% 7% 5% 16% 7% 0% 6% 9%
Legacy 3% 0% 0% 0% 13% 11% 1% 3%
IBM /Cognos 0% 2% 6% 0% 7% 11% 4% 3%
Oracle /Hyperion 0% 0% 8% 21% 0% 33% 8% 9%
SAP/BPC 0% 0% 1% 0% 13% 0% 1% 3%
Excel 70% 78% 65% 42% 60% 39% 66% 61%
Other 13% 13% 15% 21% 0% 6% 13% 9%
None 7% 0% 0% 0% 0% 0% 1% 3%
Figure 15: leading Types of long-Term Planning Tools Used by Company size and location
less than $25M
$25M– $99M
$100M–$499M
$500M–$999M
$1B– $4.9B
$5B and over
United states
Canada
ERP 3% 4% 5% 10% 8% 0% 5% 6%
Legacy 3% 0% 0% 0% 8% 6% 1% 3%
IBM /Cognos 0% 0% 3% 0% 8% 6% 3% 0%
Oracle /Hyperion 0% 0% 5% 20% 0% 38% 7% 6%
SAP/BPC 0% 0% 2% 5% 0% 0% 1% 0%
Excel 74% 82% 68% 45% 59% 50% 69% 63%
Other 7% 8% 5% 10% 0% 0% 6% 6%
None 13% 6% 12% 10% 17% 0% 8% 16%
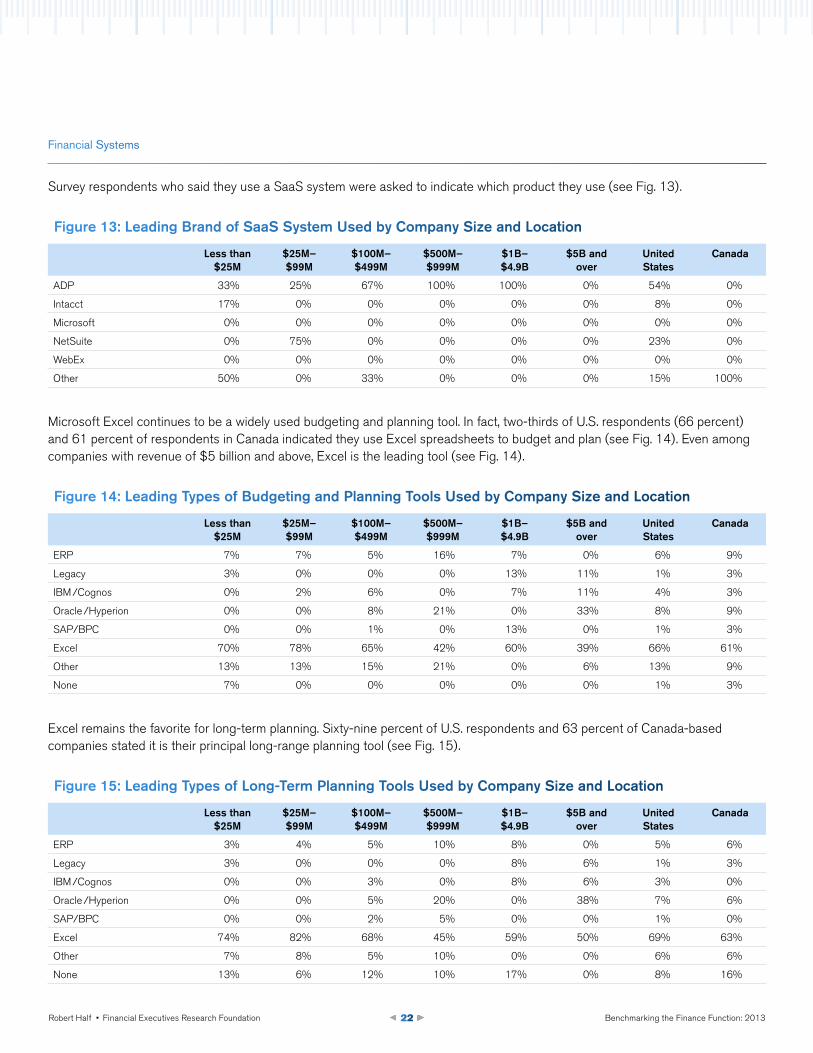
Survey respondents who said they use a SaaS system were asked to indicate which product they use (see Fig. 13).
Microsoft Excel continues to be a widely used budgeting and planning tool. In fact, two-thirds of U.S. respondents (66 percent) and 61 percent of respondents in Canada indicated they use Excel spreadsheets to budget and plan (see Fig. 14). Even among companies with revenue of $5 billion and above, Excel is the leading tool (see Fig. 14).
Excel remains the favorite for long-term planning. Sixty-nine percent of U.S. respondents and 63 percent of Canada-based companies stated it is their principal long-range planning tool (see Fig. 15).
Benchmarking the Finance Function: 2013Robert Half • Financial Executives Research Foundation 23
PoinTs oF View: inTegRATion oF FinAnCiAl sysTeMs
Microsoft Excel continues to be a widely used budgeting and planning tool, and it still plays a significant role at Employee Benefits Corp., though the company is planning to implement some changes. “We have purchased a SaaS general ledger system and plan to move some of our reporting to it,” said Tuscany, who also is considering purchasing an executive dashboard tool. “In my previous role with a much larger company, we moved away from Excel to an integrated package, and we did see improvements in efficiency and data management.”
Companies frequently end up embracing a hybrid approach that locks down key financial data in a controlled manner but lets users take data and turn it into Excel spreadsheets. Prior to undertaking its general ledger conversion in 2009, Canadian Western Bank Group found it had more than 12,000 active Excel worksheets. Instead of going with a “full-on ERP system, we found a mid-tier product that allowed us to significantly reduce our risk,” said Graham. “While the new general ledger system uses Excel for reporting, we’re able to lock down the reports. And so while you can run the report and filter it, you can’t actually change the underlying data.” Excel, she added, is used for analysis and to generate supplementary financial information.
For CFO Frank Hallowell at Logic PD Inc., a technology manufacturer based in Eden Prairie, Minn., the deployment of cloud technologies lowers costs and increases efficiencies. Much as SaaS allows a company to “rent” software applications stored in a vendor’s data center, the Cloud extends this model to other elements of a firm’s IT capability, such as data storage and networking. “Currently we operate our budget and planning, payroll, travel and expense reporting in the Cloud,” Hallowell said. He added the company’s time billing may move there as well.
Others are more cautious regarding the Cloud. ENMAX, for example, hasn’t implemented it yet. “We’re waiting for the technology to be more tested and seasoned,” said Litoski.
Financial Systems
Benchmarking the Finance Function: 2013Robert Half • Financial Executives Research Foundation 24
TAKeAwAys
• Excel remains the budgeting and planning tool of choice, particularly at smaller companies.
• Finance and accounting departments often have to spend significant time validating data in the reporting process.
• Departments are moving away from owning computing technology and toward “renting” it via the Cloud, such as SaaS, data storage and networking, and other elements of a firm’s IT capability.
• Some firms are more cautious about the Cloud and are waiting until the technology has been further tested and proven.
QUesTions To ConsiDeR
• Do you plan to upgrade or replace your existing ERP system?
• How burdensome would an ERP upgrade be to your department?
• Have you taken steps to adequately train staff on the features and functionality of the ERP system?
• Are you spending more time validating the financials and other reports? Have you considered the use of analytical technologies or systems to help streamline this process?
• Is the organization receiving the reporting it requires with a manageable amount of effort from your department?
• Do managers gather their own reports, and are they often not in agreement with the finance function’s reports?
Financial Systems

Benchmarking the Finance Function: 2013Robert Half • Financial Executives Research Foundation 25
Key FinDings
• Payroll is the single most outsourced function among the companies surveyed, followed by tax.
• A/P is another function many companies are outsourcing.
• Smaller companies may be more likely to outsource than larger ones because of staff constraints.
• Companies with a broader geographical footprint but limited personnel are more likely to seek outsourced solutions.
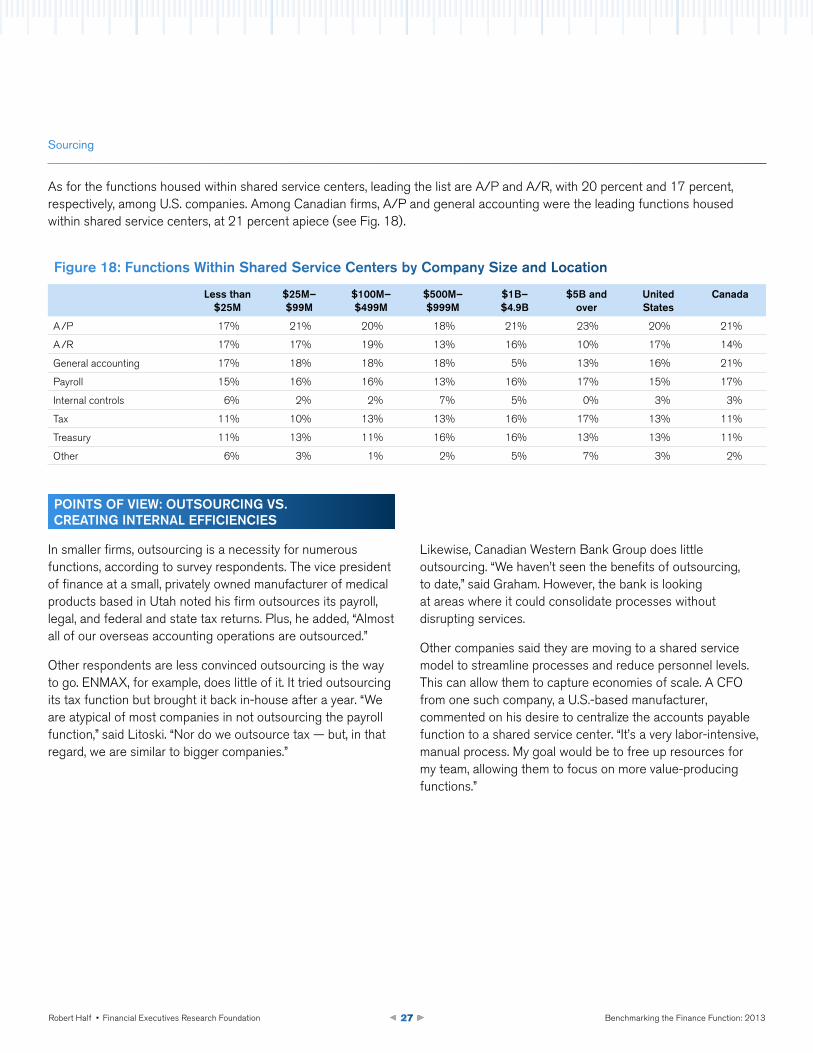
• Functions most often found in shared service centers are A/P and A/R. Twenty percent and 17 percent of respondent companies in the United States manage these functions in shared service centers, respectively. Among Canadian firms, A/P and general accounting were the leading functions managed within shared service centers, at 21 percent apiece.
DisCUssion AnD AnAlysis
Today’s financial operations are typically handled in one of three ways: in-house through traditional means, in-house through shared service centers or outsourced to external vendors.
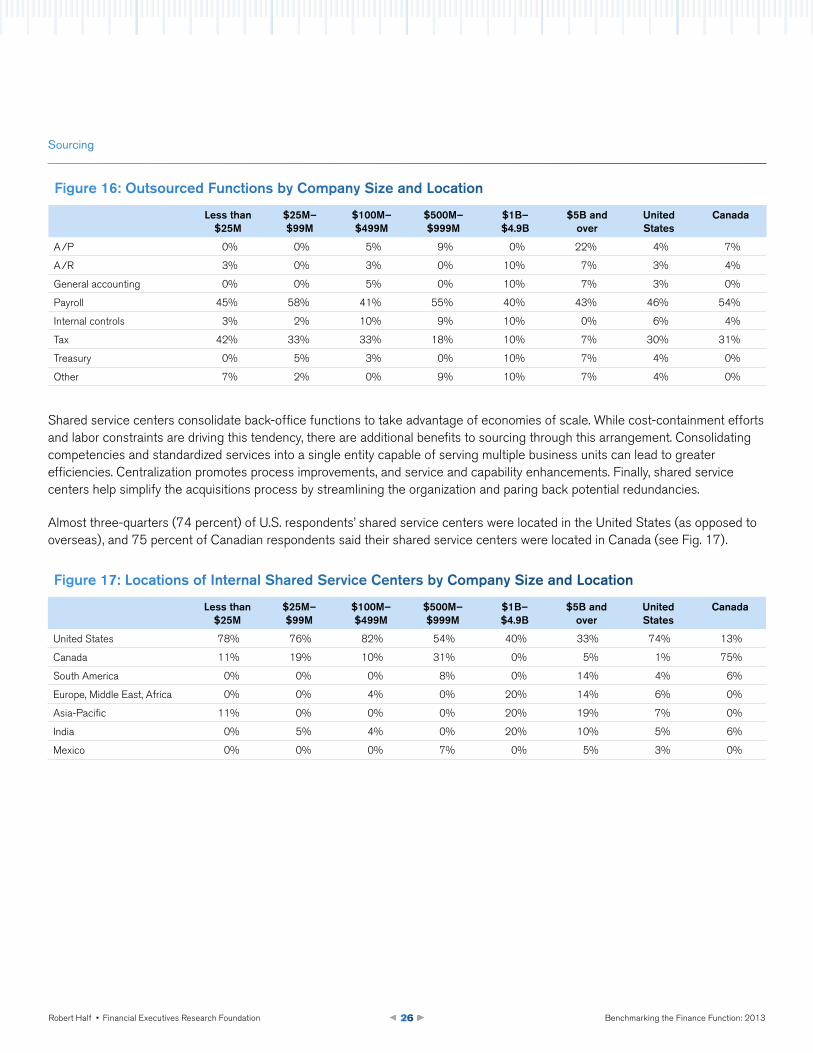
Payroll and tax remain the two leading outsourced functions in the U.S.; they’re outsourced 46 percent and 30 percent of the time, respectively (see Fig. 16). The share of Canadian companies outsourcing payroll and tax is slightly higher, at 54 percent and 31 percent, respectively (see Fig. 16). More than half (58 percent) of U.S. companies with revenue between $25 million and $99 million outsource payroll, a higher percentage than larger companies that were surveyed.
Among the largest companies, 22 percent indicated they outsource the A/P function (see Fig. 16). Moreover, numerous executives said it was a function that consumed much of their resources and took away from more value-generating activities.
Sourcing
Benchmarking the Finance Function: 2013Robert Half • Financial Executives Research Foundation 26
Figure 16: outsourced Functions by Company size and location
less than $25M
$25M– $99M
$100M–$499M
$500M–$999M
$1B– $4.9B
$5B and over
United states
Canada
A /P 0% 0% 5% 9% 0% 22% 4% 7%
A /R 3% 0% 3% 0% 10% 7% 3% 4%
General accounting 0% 0% 5% 0% 10% 7% 3% 0%
Payroll 45% 58% 41% 55% 40% 43% 46% 54%
Internal controls 3% 2% 10% 9% 10% 0% 6% 4%
Tax 42% 33% 33% 18% 10% 7% 30% 31%
Treasury 0% 5% 3% 0% 10% 7% 4% 0%
Other 7% 2% 0% 9% 10% 7% 4% 0%
25%
Sourcing
Figure 17: locations of internal shared service Centers by Company size and location
less than $25M
$25M– $99M
$100M–$499M
$500M–$999M
$1B– $4.9B
$5B and over
United states
Canada
United States 78% 76% 82% 54% 40% 33% 74% 13%
Canada 11% 19% 10% 31% 0% 5% 1% 75%
South America 0% 0% 0% 8% 0% 14% 4% 6%
Europe, Middle East, Africa 0% 0% 4% 0% 20% 14% 6% 0%
Asia-Pacific 11% 0% 0% 0% 20% 19% 7% 0%
India 0% 5% 4% 0% 20% 10% 5% 6%
Mexico 0% 0% 0% 7% 0% 5% 3% 0%
Shared service centers consolidate back-office functions to take advantage of economies of scale. While cost-containment efforts and labor constraints are driving this tendency, there are additional benefits to sourcing through this arrangement. Consolidating competencies and standardized services into a single entity capable of serving multiple business units can lead to greater efficiencies. Centralization promotes process improvements, and service and capability enhancements. Finally, shared service centers help simplify the acquisitions process by streamlining the organization and paring back potential redundancies.
Almost three-quarters (74 percent) of U.S. respondents’ shared service centers were located in the United States (as opposed to overseas), and 75 percent of Canadian respondents said their shared service centers were located in Canada (see Fig. 17).
Benchmarking the Finance Function: 2013Robert Half • Financial Executives Research Foundation 27
Figure 18: Functions within shared service Centers by Company size and location
less than $25M
$25M– $99M
$100M–$499M
$500M–$999M
$1B– $4.9B
$5B and over
United states
Canada
A /P 17% 21% 20% 18% 21% 23% 20% 21%
A /R 17% 17% 19% 13% 16% 10% 17% 14%
General accounting 17% 18% 18% 18% 5% 13% 16% 21%
Payroll 15% 16% 16% 13% 16% 17% 15% 17%
Internal controls 6% 2% 2% 7% 5% 0% 3% 3%
Tax 11% 10% 13% 13% 16% 17% 13% 11%
Treasury 11% 13% 11% 16% 16% 13% 13% 11%
Other 6% 3% 1% 2% 5% 7% 3% 2%
Sourcing
PoinTs oF View: oUTsoURCing Vs. CReATing inTeRnAl eFFiCienCies
In smaller firms, outsourcing is a necessity for numerous functions, according to survey respondents. The vice president of finance at a small, privately owned manufacturer of medical products based in Utah noted his firm outsources its payroll, legal, and federal and state tax returns. Plus, he added, “Almost all of our overseas accounting operations are outsourced.”
Other respondents are less convinced outsourcing is the way to go. ENMAX, for example, does little of it. It tried outsourcing its tax function but brought it back in-house after a year. “We are atypical of most companies in not outsourcing the payroll function,” said Litoski. “Nor do we outsource tax — but, in that regard, we are similar to bigger companies.”
Likewise, Canadian Western Bank Group does little outsourcing. “We haven’t seen the benefits of outsourcing, to date,” said Graham. However, the bank is looking at areas where it could consolidate processes without disrupting services.
Other companies said they are moving to a shared service model to streamline processes and reduce personnel levels. This can allow them to capture economies of scale. A CFO from one such company, a U.S.-based manufacturer, commented on his desire to centralize the accounts payable function to a shared service center. “It’s a very labor-intensive, manual process. My goal would be to free up resources for my team, allowing them to focus on more value-producing functions.”
As for the functions housed within shared service centers, leading the list are A/P and A/R, with 20 percent and 17 percent, respectively, among U.S. companies. Among Canadian firms, A/P and general accounting were the leading functions housed within shared service centers, at 21 percent apiece (see Fig. 18).
Benchmarking the Finance Function: 2013Robert Half • Financial Executives Research Foundation 28
TAKeAwAys
• The fact that payroll is the single most outsourced function among all companies, followed by tax, may reflect the effort by finance to reallocate resources away from repetitive and time-consuming initiatives and toward value-generating activities.
• Outsourcing the tax function is useful when operating in multiple states, provinces and countries with varying regulations.
• Companies may benefit from outsourcing labor-intensive, manual processes such as A/P.
• Shared service centers help simplify the process of acquisitions by streamlining the organization and paring back potential redundancies.
QUesTions To ConsiDeR
• Can your company consolidate processes without disrupting services?
• Can your firm capture economies of scale by centralizing or sharing services?
• Can your firm deliver higher-quality service and improved customer satisfaction by using shared services?
• Are you satisfied with your existing outsourcing partner? Do their offerings depend significantly on an offshore model?
• In an acquisition, could you absorb the new company efficiently?
Sourcing
Benchmarking the Finance Function: 2013Robert Half • Financial Executives Research Foundation 29
Key FinDings
• Not surprisingly, in larger companies, internal audit is the department most commonly responsible for internal controls.
• Internal audit is a function that sometimes presents a “segregation of duties risk” in smaller companies, given their labor constraints and limited resources. Segregation of duties essentially ensures different functions are separated, and defines authority and responsibility over transactions.
DisCUssion AnD AnAlysis
In the United States, Sarbanes-Oxley (SOX) compliance points to the growing importance of strong internal controls. Canadian companies, however, do not require SOX compliance, with the exception of those public companies that trade on the New York Stock Exchange. In Canada, publicly traded companies must comply with Bill 198, the equivalent to SOX. To avoid potential confusion between these regulations, survey respondents were asked who is responsible for key internal controls.
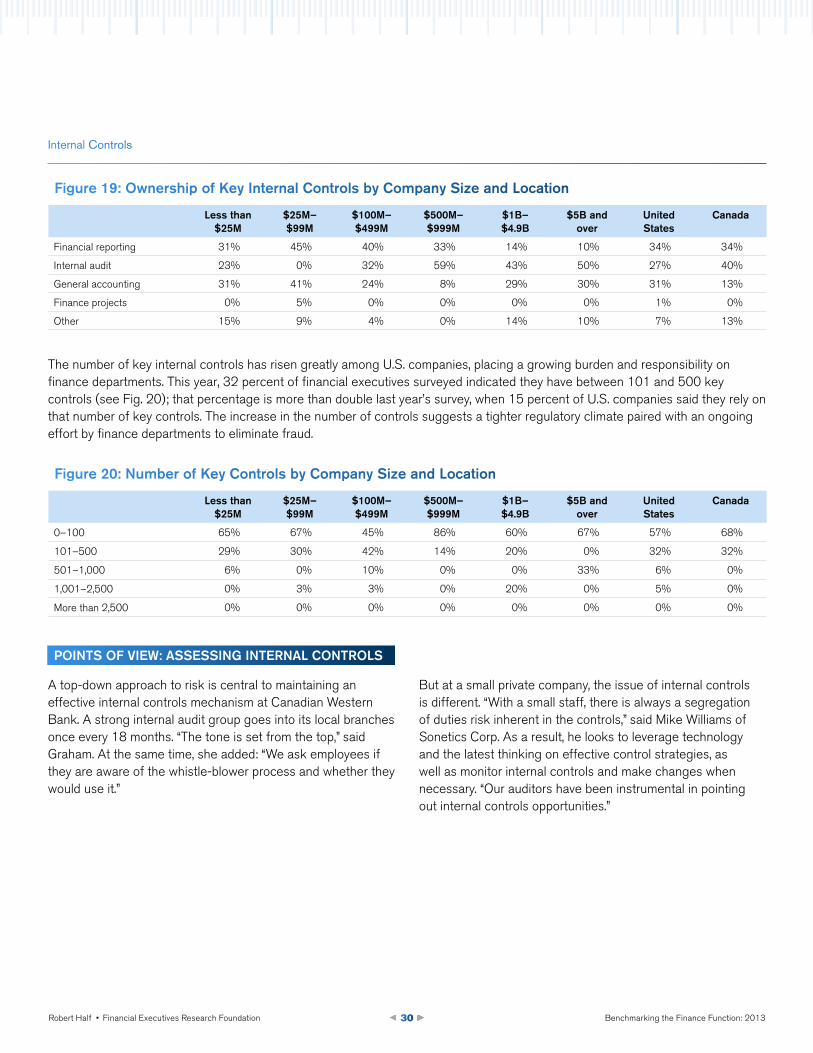
In the aftermath of the financial crisis, the need for internal controls and risk management has become even greater. The management and compliance of internal controls in the United States typically falls under the purview of the financial reporting function (34 percent), followed by general accounting (31 percent) and internal audit (27 percent) (see Fig. 19). However, as company size increases, internal controls compliance tends to be the responsibility of internal audit, and in smaller companies it typically resides with financial reporting or general accounting. This is not surprising because smaller companies often lack an internal audit department, and audit responsibilities are commonly covered by financial reporting or general accounting. In Canada, internal audit and financial reporting account for 40 percent and 34 percent, respectively, of overall internal controls compliance (see Fig. 19).
Internal Controls
Benchmarking the Finance Function: 2013Robert Half • Financial Executives Research Foundation 30
Internal Controls
PoinTs oF View: Assessing inTeRnAl ConTRols
A top-down approach to risk is central to maintaining an effective internal controls mechanism at Canadian Western Bank. A strong internal audit group goes into its local branches once every 18 months. “The tone is set from the top,” said Graham. At the same time, she added: “We ask employees if they are aware of the whistle-blower process and whether they would use it.”
But at a small private company, the issue of internal controls is different. “With a small staff, there is always a segregation of duties risk inherent in the controls,” said Mike Williams of Sonetics Corp. As a result, he looks to leverage technology and the latest thinking on effective control strategies, as well as monitor internal controls and make changes when necessary. “Our auditors have been instrumental in pointing out internal controls opportunities.”
The number of key internal controls has risen greatly among U.S. companies, placing a growing burden and responsibility on finance departments. This year, 32 percent of financial executives surveyed indicated they have between 101 and 500 key controls (see Fig. 20); that percentage is more than double last year’s survey, when 15 percent of U.S. companies said they rely on that number of key controls. The increase in the number of controls suggests a tighter regulatory climate paired with an ongoing effort by finance departments to eliminate fraud.
Figure 19: ownership of Key internal Controls by Company size and location
less than $25M
$25M– $99M
$100M–$499M
$500M–$999M
$1B– $4.9B
$5B and over
United states
Canada
Financial reporting 31% 45% 40% 33% 14% 10% 34% 34%
Internal audit 23% 0% 32% 59% 43% 50% 27% 40%
General accounting 31% 41% 24% 8% 29% 30% 31% 13%
Finance projects 0% 5% 0% 0% 0% 0% 1% 0%
Other 15% 9% 4% 0% 14% 10% 7% 13%
Figure 20: number of Key Controls by Company size and location
less than $25M
$25M– $99M
$100M–$499M
$500M–$999M
$1B– $4.9B
$5B and over
United states
Canada
0–100 65% 67% 45% 86% 60% 67% 57% 68%
101–500 29% 30% 42% 14% 20% 0% 32% 32%
501–1,000 6% 0% 10% 0% 0% 33% 6% 0%
1,001–2,500 0% 3% 3% 0% 20% 0% 5% 0%
More than 2,500 0% 0% 0% 0% 0% 0% 0% 0%
Benchmarking the Finance Function: 2013Robert Half • Financial Executives Research Foundation 31
TAKeAwAys
• A top-down, risk-based approach is critical for maintaining effective internal controls.
• An ethical culture and the desire to prevent fraud must flow from the top of the organization.
• Staff should be encouraged to identify fraudulent activities and know the proper procedures to report issues.
• Staff need to stay abreast of the latest technology and thought leadership on internal controls.
QUesTions To ConsiDeR
• How effective is your organization at preventing and detecting fraud?
• Is there a lack of effective controls, or have previous audits shown numerous errors?
• Are data backups performed frequently and kept off-site in a secure location?
• Does the company monitor internal controls and make changes to them if they aren’t working?
• Is there a top-down, risk-based approach to internal controls? Have you set the tone at the top?
• Has your company completed a thorough risk assessment, and are effective controls in place to address any potential areas of risk?
Internal Controls
Benchmarking the Finance Function: 2013Robert Half • Financial Executives Research Foundation 32
Key FinDings
• Ninety-five percent of U.S. executives and 92 percent of Canada-based executives think their compliance burden will either increase or, at a minimum, not diminish over time.
• The legacy of reform and regulations arising from the financial crisis continues to weigh on companies and their finance function.
• The number of regulation and reporting requirements are rising across the board and across all industries.
DisCUssion AnD AnAlysis
While internal controls are a main component of compliance, we are addressing other aspects of regulatory compliance, such as cost and burden, as distinct issues.
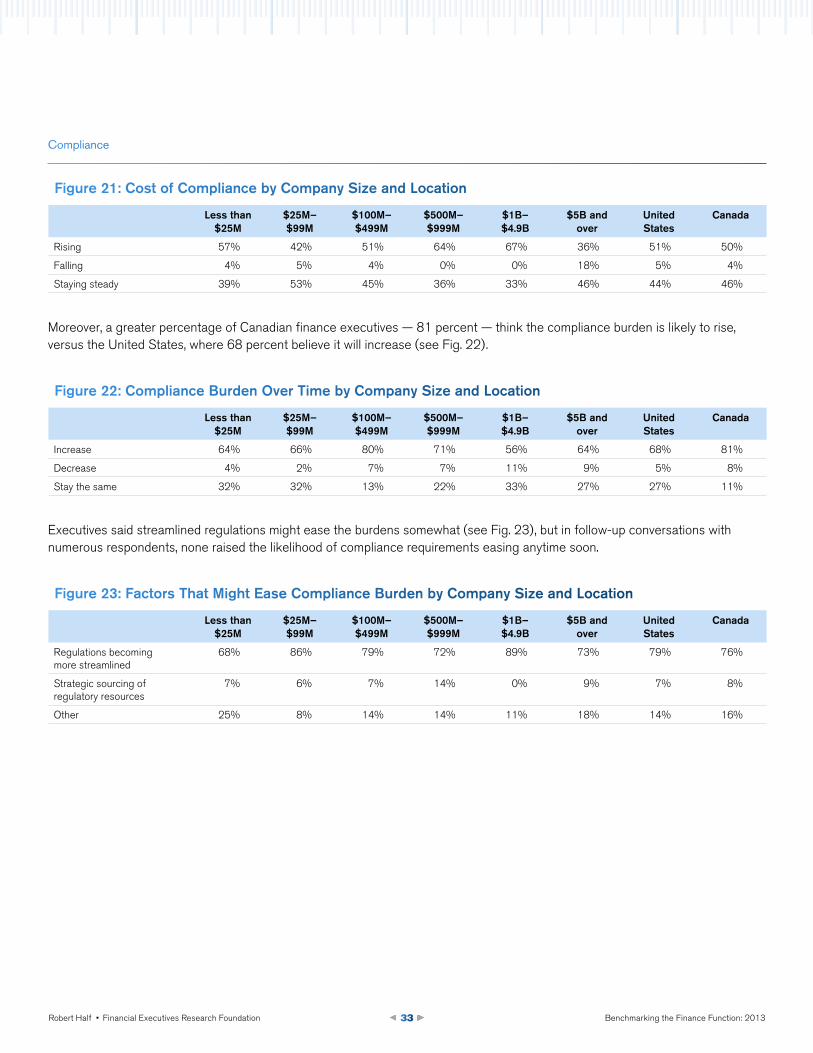
As the financial crisis recedes further into history, the legacy of reform and regulations continues to influence companies. The burden and cost of complying with new rules and regulations lies primarily with the finance department. Fifty-one percent of U.S. companies surveyed said the cost of compliance is rising for them, while 44 percent said it is unchanged — only 5 percent said costs are falling (see Fig. 21).
No company is exempt from the growing number of compliance-related issues, but they vary by company and organization. For a small nonprofit healthcare organization, the burden of complying with state and federal guidelines and fund-accounting requirements is different than the burden faced by a project-driven engineering company working on infrastructure engagements for numerous localities. Service companies face a different set of compliance requirements than manufacturers. The compliance burden is different for a public company than a private one, and so on.
Compliance
Benchmarking the Finance Function: 2013Robert Half • Financial Executives Research Foundation 33
25%
Compliance
Figure 21: Cost of Compliance by Company size and location
less than $25M
$25M– $99M
$100M–$499M
$500M–$999M
$1B– $4.9B
$5B and over
United states
Canada
Rising 57% 42% 51% 64% 67% 36% 51% 50%
Falling 4% 5% 4% 0% 0% 18% 5% 4%
Staying steady 39% 53% 45% 36% 33% 46% 44% 46%
Figure 22: Compliance Burden over Time by Company size and location
less than $25M
$25M– $99M
$100M–$499M
$500M–$999M
$1B– $4.9B
$5B and over
United states
Canada
Increase 64% 66% 80% 71% 56% 64% 68% 81%
Decrease 4% 2% 7% 7% 11% 9% 5% 8%
Stay the same 32% 32% 13% 22% 33% 27% 27% 11%
Figure 23: Factors That Might ease Compliance Burden by Company size and location
less than $25M
$25M– $99M
$100M–$499M
$500M–$999M
$1B– $4.9B
$5B and over
United states
Canada
Regulations becoming more streamlined
68% 86% 79% 72% 89% 73% 79% 76%
Strategic sourcing of regulatory resources
7% 6% 7% 14% 0% 9% 7% 8%
Other 25% 8% 14% 14% 11% 18% 14% 16%
Moreover, a greater percentage of Canadian finance executives — 81 percent — think the compliance burden is likely to rise, versus the United States, where 68 percent believe it will increase (see Fig. 22).
Executives said streamlined regulations might ease the burdens somewhat (see Fig. 23), but in follow-up conversations with numerous respondents, none raised the likelihood of compliance requirements easing anytime soon.
Benchmarking the Finance Function: 2013Robert Half • Financial Executives Research Foundation 34
PoinTs oF View: MAnAging CoMPliAnCe
No industry has been so affected by the growing compliance and regulatory burdens as banking and financial services.
“We have assessed that regulatory and compliance risk, specifically, are the fastest-rising risk factors in our group,” said Graham, senior vice president and chief accountant at Canadian Western Bank Group. The significant issue it faces is the global regulatory standard of Basel III, a framework for liquidity and capital reserves. This comes on top of compliance issues associated with being a public company. “Compliance and regulatory burden certainly take up more of my time than it once did,” said Graham, adding that she thinks this will continue to grow.
ENMAX is not required to produce quarterly reports, but it issues financial reports as if it were a public company. In addition, ENMAX had to assemble a team to comply with International Financial Reporting Standards. “Compliance requirements are everywhere,” said Litosky. “In the regulated finance group, staffing has doubled in a year.”
Several U.S. executives commented on the impending, and still somewhat uncertain, effects of the Patient Protection and Affordable Care Act, the new law signed in 2010 aimed primarily at decreasing the number of uninsured Americans and reducing the overall costs of healthcare. Don Tuscany of Employee Benefits Corp. noted, “The Affordable Care Act increases the compliance burden associated with our products; however, many of the rules have yet to be fully interpreted. We’re working hard to stay up to date.”
Compliance
Benchmarking the Finance Function: 2013Robert Half • Financial Executives Research Foundation 35
TAKeAwAys
• Identifying the challenges to meeting compliance requirements, such as a lack of resources or skilled personnel, is the first step toward managing them.
• The compliance burden is not expected to ease anytime soon.
• Training staff to address new rules is an important step in handling the changing regulatory environment.
QUesTions To ConsiDeR
• Is your firm adequately prepared to comply with any new and impending accounting pronouncements?
• Do you need to plan for additional staff training in light of new compliance issues?
• Are your company’s compliance costs rising as a result of new regulations or a need for greater efficiencies in managing compliance efforts?
Compliance
Benchmarking the Finance Function: 2013Robert Half • Financial Executives Research Foundation 36
The finance function is undergoing a transformation, moving toward becoming a full-fledged strategic business partner within the organization. Critical to achieving this goal is making certain the finance department is operating with precision. Various aspects of finance — staffing, accounting operations, financial systems, outsourcing, internal controls and compliance — should be synchronized and integrated to maximize business efficiency.
Having benchmarks and standards are important steps in the process. A benchmark allows departments to gauge whether they are executing a timely and clean close and whether their processes are friction-free. In the area of staffing, benchmarks enable firms to evaluate whether they have sufficient internal resources to achieve projects critical to the enterprise and whether peak periods of business activity are producing a backlog of work. Benchmarks in the area of technology allow departments to assess whether critical ERP systems are measuring up. Finally, benchmarks point out best practices in such areas as outsourcing, internal controls and compliance.
Benchmarking the Finance Function: 2013 is intended to be used as a tool, enabling businesses to measure their organization against their peers and competitors and to gain a better perspective on where the finance department currently is and, more importantly, where it needs to go.
Summary: Putting the Data to Work
Benchmarking the Finance Function: 2013Robert Half • Financial Executives Research Foundation 37
ACKnowleDgMenTs
FERF and Robert Half would like to thank the executives at the companies who participated in the survey and the many executives who spoke with the authors in follow-up interviews. Their firsthand experiences and comments gave us a deeper understanding and appreciation of the role of the finance department and of the opportunities and challenges that lie ahead.
ABoUT THe AUTHoRs
Paul McDonald is senior executive director with Robert Half. Robert Half’s divisions place professionals on a temporary, temporary-to-hire and full-time basis in the accounting and finance; technology; office administration; legal; and creative, marketing and design fields. McDonald joined the company in 1984 as a recruiter in Boston, following a public accounting career with Price Waterhouse. In the 1990s, he became president of the western United States, overseeing all of Robert Half’s operations, and most recently served as senior executive director of Robert Half Management Resources. Over the course of his nearly 30-year career with the company, he has spoken and written extensively on employment and management issues based on his work with thousands of client companies and job seekers.
Thomas Thompson Jr. is a senior associate, research at Financial Executives Research Foundation, the author of more than 20 published research reports and primary blogger of the FERF Research Blog. Thompson received a bachelor’s degree in economics from Rutgers University and a bachelor’s degree in psychology from Montclair State University. Prior to joining FERF, Thompson held positions in business operations and client relations at NCG Energy Solutions, AXA-Equitable and Morgan Stanley Dean Witter.
Thompson can be reached at [email protected] or (973) 765-1007.
Benchmarking the Finance Function: 2013Robert Half • Financial Executives Research Foundation 38
ABoUT RoBeRT HAlF
Founded in 1948, Robert Half is the world’s first and largest specialized staffing firm and has locations worldwide. The company’s professional staffing divisions include Accountemps®, Robert Half® Finance & Accounting and Robert Half® Management Resources, for temporary, full-time and senior-level project professionals, respectively, in the fields of accounting and finance. For more information about the specialized staffing and recruitment divisions of Robert Half, visit www.roberthalf.com. Robert Half is an Equal Opportunity Employer.
ABoUT FinAnCiAl exeCUTiVes ReseARCH FoUnDATion
Financial Executives Research Foundation (FERF) is the nonprofit 501(c)(3) research affiliate of Financial Executives International (FEI). FERF researchers identify key financial issues and develop impartial, timely research reports for FEI members and nonmembers alike, in a variety of publication formats. FERF relies primarily on voluntary tax-deductible contributions from corporations and individuals. Publications can be ordered by logging on to www.ferf.org.
The views set forth in this publication are those of the authors and do not necessarily represent those of the FERF Board as a whole, individual trustees, employees, or the members of the Advisory Committee. FERF shall be held harmless against any claims, demands, suits, damages, injuries, costs, or expenses of any kind or nature whatsoever except such liabilities as may result solely from misconduct or improper performance by FERF or any of its representatives.
Copyright © 2013 by Financial Executives Research Foundation, Inc. All rights reserved. No part of this publication may be reproduced in any form or by any means without written permission from the publisher.
International Standard Book Number 978-1-61509-113-3 Printed in the United States of America First Printing
Authorization to photocopy items for internal or personal use, or the internal or personal use of specific clients, is granted by FERF provided that an appropriate fee is paid to Copyright Clearance Center, 222 Rosewood Drive, Danvers, MA 01923. Fee inquiries can be directed to Copyright Clearance Center at 978-750-8400. For further information please check Copyright Clearance Center online at www.copyright.com.
Benchmarking the Finance Function: 2013Robert Half • Financial Executives Research Foundation 39
PlATinUM MAJoR giFT | $50,000 +
Exxon Mobil Corp. Microsoft Corp.
golD PResiDenT’s CiRCle | $10,000 - $14,999
Cisco Systems Inc.
Cummins Inc.
Dow Chemical Co.
General Electric Co.
silVeR PResiDenT’s CiRCle | $5,000 - $9,999
Apple, Inc.
The Boeing Co.
Comcast Corp.
Corning Inc.
Credit Suisse
Dell Inc.
Duke Energy Corp.
E. I. du Pont de Nemours & Co.
Eli Lilly and Co.
GM Foundation
Halliburton Co.
The Hershey Co.
IBM Corp.
Johnson & Johnson
Lockheed Martin Corp.
McDonald’s Corp.
Medtronic, Inc.
Motorola Solutions, Inc.
PepsiCo, Inc.
Pfizer Inc.
Procter & Gamble Co.
Safeway Inc.
Sony Corporation of America
Tenneco Inc.
Tyco International Management Co.
Wells Fargo & Co.
Financial Executives Research Foundation (FERF) acknowledges and thanks the following for their longstanding support and generosity.

© 2013 Robert Half International Inc. An Equal Opportunity Employer. RH-1013
Connect with Robert Half:


