16
www.pwc.com.au Real Estate Finance Function Effectiveness – How do you compare? Real Estate Finance Function Effectiveness Benchmarking Insights Report February 2016

www.pwc.com.au
Real EstateFinanceFunctionEffectiveness –How do youcompare?
Real Estate Finance
Function Effectiveness
Benchmarking Insights
Report
February 2016

Real Estate Finance Function Effectiveness Benchmarking Insights ReportPwC i
Foreword
The Australian economy has continued toexperience significant challenges over recenttimes as a result of the decline in theresources sector, GDP growth remainingbelow trend, a significant decline in thecurrency, cash rates at all-time lows and ageneral level of uncertainty in the system.The continued digitalisation and disruptionacross multiple industries has resulted incustomers demanding more at a lower cost.
In this environment, while organisations arecontinuing to look for growth in bothtraditional and new areas, throughinnovation, there is a continued focus oncost reduction and process and controloptimisation.
This economic trend has led companies tochallenge their operating model and focuson doing things differently in order toachieve a lower cost finance functionsolution that delivers enhanced value to thebusiness.
In the Real Estate sector, organisations areinvesting in technology, are focusing ontheir operating models and are looking atoffshore outsourcing arrangements in a bidto reduce their cost bases.
Our clients globally have been seekingguidance from PwC to understand how theycan create a finance function in thisenvironment that is fit-for- purpose, is costeffective yet acts as a strategic businesspartner.
To help address this we have developed aFinance Function EffectivenessBenchmarking tool which uses a standardtaxonomy to compare participants acrossthe main areas in which Finance deliversvalue to the business - Business Insight,Compliance & Control and TransactionalEfficiency.
In addition to highlights from our globalsurvey, this report contains our overallfindings across the Real Estate industry inrelation to these three areas and also the keyenablers to a successful finance function-people and technology.
In Appendix A we have included a list of keymetrics and how the top performerscompare relative to average performers.Together, these statistics allow companieswho did not participate in the survey toconsider how they compare.
The report not only discusses what defines‘excellence’ now, but how to keep ahead ofthe accelerating pace of change in relation tohow businesses compete and what theyexpect from their finance teams.
Whilst the report shows that there is arelatively large range of results across theparticipant base, it also highlights that allcompanies, even those that are leading thecharge, have an opportunity to continuouslydevelop and enhance the structure and valueof their finance function.
By doing so, the finance function has theopportunity to be elevated from acompliance function to a strategic functionthat is deeply involved in generating real-time data and analysis to influence businessdecisions – a win for the business and yourfinance team.
Authors
James Dunning+61 (2) 8266 [email protected]
Liz Stesel+61 (2) 8266 [email protected]


Disclaimer: PricewaterhouseCoopers has not verified, validated or audited the data used to preparethis benchmarking report. PricewaterhouseCoopers makes no representations or warranties withrespect to the adequacy of the information. PricewaterhouseCoopers disclaims all liability for loss ofany kind suffered by any party as a result of the use of this benchmarking report.
Real Estate Finance Function Effectiveness Benchmarking Insights ReportPwC iii
Contents
Foreword i
1 Our approach to benchmarking 1
2 Global benchmarking trends 2
3 Overall trends: what sets top Real Estate performers apart? 3
4 People & Technology: the enablers to a successful finance function 4
5 Trends in Transactional Efficiency processes 6
6 Trends in compliance and control processes 7
7 Trends in Business Insight processes 8
Appendix A Real Estate Benchmarking Participant Metrics 9

Real Estate Finance Function Effectiveness Benchmarking Insights ReportPwC 1
1 Our approach to benchmarking
As your finance function seeks to keeppace with mounting business andregulatory demands, ourbenchmarking analysis provides a clearassessment of strengths, weaknessesand areas for improvement, andestablishes a baseline from which tobuild the business case for change andmeasure progress.
The approach focuses on the criticaldata, rather than extensive datarequests, and is designed to becompleted quickly. Tools are providedto make sure that data is consistent,and to be extracted directly fromparticipant’s systems whereappropriate.
Our approach to benchmarkingcontinues to evolve, as in addition toperformance evaluation andcomparison, participants increasinglyask for insights on why they may beunderperforming and how they canimprove.
The analysis combines a qualitativeassessment and comparative metricsacross the dimensions of businessinsight, efficiency and compliance andcontrol.
Transactional efficiency analysestransactional processes using a rangeof key determinants including cost,speed, quality and process complexity.
Compliance and control examines theeffectiveness of the controlsframework, and the cost and efficiencyof controls.
Business insight focuses on finance’sability to guide the business. Thebenchmark assesses factors includingthe proportion of finance effort spentdevoted to business partnering, timespent on analysis versus datagathering, and an assessment of thequality and impact of processes such asbudgeting and forecasting.
Peer group data
In compiling the Real Estate financefunction effectiveness benchmarkingwe have obtained data from a crossindustry peer group of globalcompanies. The companies chosen aresimilar in size and complexity with thepeer group median results beingnormalised (i.e. scaled) and comparedto the top quartile results across theentire local and global population.
Whilst the majority of the peer grouphas operations which generaterevenues from underlying funds orJoint Ventures, these revenues are nottaken into account in selecting thepopulation.
How can the results be used
The benchmark results are best used toraise questions and challenge currentperformance levels rather than toprovide definitive answers. The goalsof the benchmark are to:
Provide a baseline of currentperformance against a robustframework and a set of metrics;
Understand where the financefunctions are today, what is goodpractice and use this to identifyopportunities for improvement.
80% of the population
are Real Estatecompanies whilst
20%are Investment Managers.
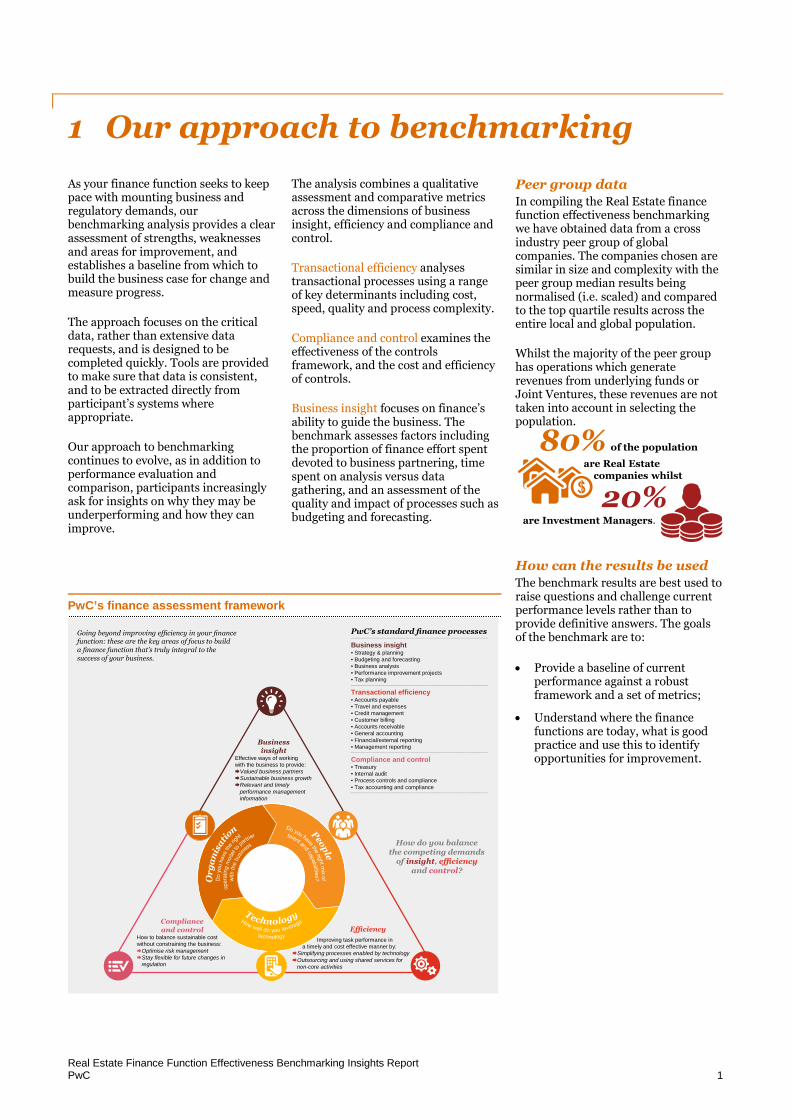
PwC’s finance assessment framework
Going beyond improving efficiency in your finance function: these are the key areas of focus to builda finance function that’s truly integral to the success of your business.
Businessinsight
Effective ways of workingwith the business to provide:Valued business partnersSustainable business growthRelevant and timely
performance managementinformation
How do you balancethe competing demands
of insight, efficiencyand control?
Complianceand control
How to balance sustainable costwithout constraining the business:Optimise risk managementStay flexible for future changes in
regulation
Improving task performance ina timely and cost effective manner by:
Simplifying processes enabled by technologyOutsourcing and using shared services for
non-core activities
PwC’s standard finance processes
Business insight• Strategy & planning• Budgeting and forecasting• Business analysis• Performance improvement projects• Tax planning
Transactional efficiency• Accounts payable• Travel and expenses• Credit management• Customer billing• Accounts receivable• General accounting• Financial/external reporting• Management reporting
Compliance and control• Treasury• Internal audit• Process controls and compliance• Tax accounting and compliance
Efficiency

Real Estate Finance Function Effectiveness Benchmarking Insights ReportPwC 2
2 Global benchmarking trends
Our global benchmark data reveals that cost-efficiency is improving across theboard, particularly within top performing finance teams whose average finance costas a percentage of revenue is continuing to decrease below pre-crisis levels.
In 2015 PwC conducted its sixth globalannual finance function effectivenessbenchmarking study. The study drawson more than 400 PwC benchmarkingengagements across a broad range ofindustry sectors. These benchmarkingengagements provide our clients with adetailed and comparative ‘health check’for their finance teams.
Taken together, these engagementsenable us to build up a comprehensive,global set of quantitative data andqualitative insight, consisting of:
5,600+ individual finance teams
In more than 100 countries
From over 400 companies
Further analysis and insight comesfrom interviews with over 100 financeleaders and PwC subject matter expertsacross the Americas, EMEA and APAC.
Opportunities exist across allindustries to enhance theeffectiveness of financefunctions
Our global findings indicate that thedemands of different industries drivethe cost of finance and necessitatecreative and targeted solutions tomoderate expenses. High transactionalvolume and low margin industries suchas retail have inherent advantages inbeing able to keep the costs of financelow.
At the other end of the spectrum,financial services organisationstypically see finance costs three to fourtimes higher than the lower costindustries as they deal with theconsequences of regulation.Importantly, however, whether a high-cost or a low-cost industry, the gapbetween average and top quartile isoften similar, and the opportunities toaddress cost are just as significant.
…There is no silver bullet
Our latest global report showscontinued progress on cost over thelast 2 years (see Figure 1 below).
Figure 1: Finance cost as apercentage of revenue
Source: PwC 2015 Global finance functioneffectiveness benchmark data
Although finance functions will alwaysrequire significant investment, the factthat top quartile costs as a whole are40% lower than average performersindicates that some organisations havebeen able to better manage financecosts relative to the populationsurveyed.
Overall, our findings indicate thatthere is no silver bullet to managingthese costs- rather top performers usea range of methods includingautomation, shared services and moreefficient use of capacity.
Figure 2: Cost of finance for selected industry sectors
Source: PwC 2015 Global finance function effectiveness benchmark dataNote: Cost of finance as a % of revenue
2013-142012-132011-1220102009
Median Top quartile
0.82%
0.54%
0.89%
0.53%
0.93%
0.56%
0.93%
0.56%
1.02%
0.61%
Power & utilities
Retail
Industrial
Technology
Financialservices 0.99% 1.32%
0.79% 1.18%
0.80% 1.11%
0.70% 0.83%
0.21% 0.34%
Top quartile Median
Real Estate Finance Function Effectiveness Benchmarking Insights ReportPwC 3
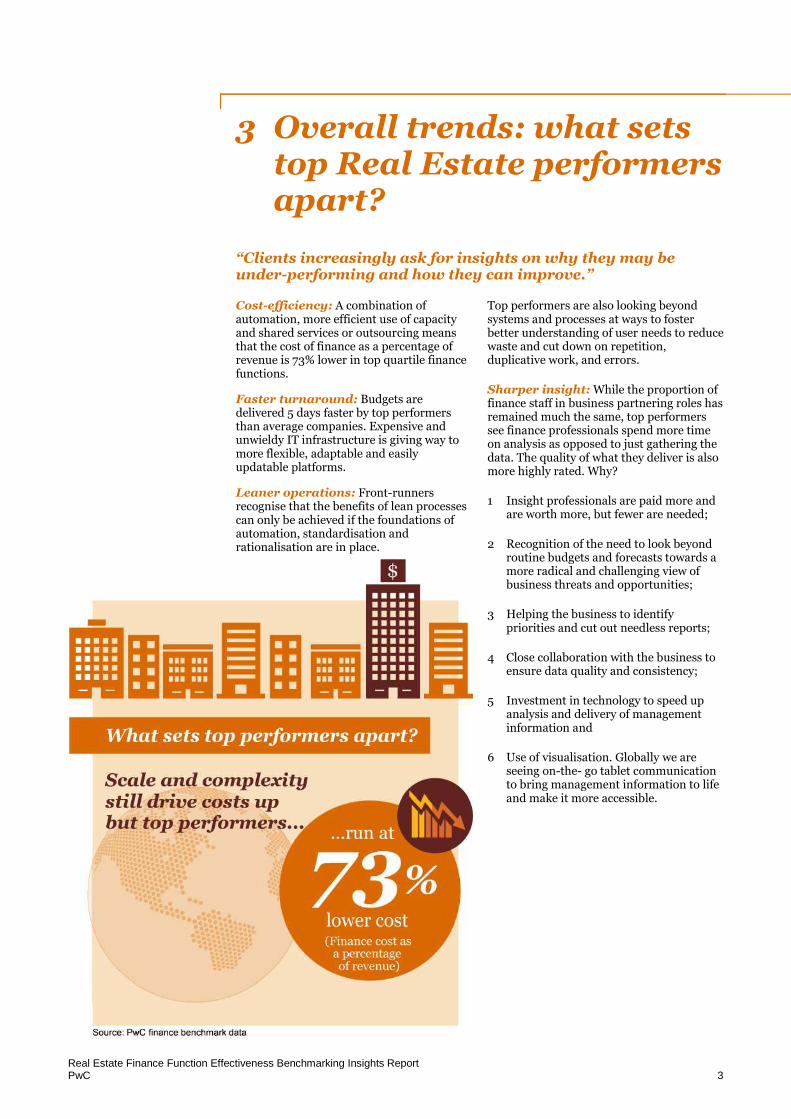
3 Overall trends: what setstop Real Estate performersapart?
“Clients increasingly ask for insights on why they may beunder-performing and how they can improve.”
Cost-efficiency: A combination ofautomation, more efficient use of capacityand shared services or outsourcing meansthat the cost of finance as a percentage ofrevenue is 73% lower in top quartile financefunctions.
Faster turnaround: Budgets aredelivered 5 days faster by top performersthan average companies. Expensive andunwieldy IT infrastructure is giving way tomore flexible, adaptable and easilyupdatable platforms.
Leaner operations: Front-runnersrecognise that the benefits of lean processescan only be achieved if the foundations ofautomation, standardisation andrationalisation are in place.
Top performers are also looking beyondsystems and processes at ways to fosterbetter understanding of user needs to reducewaste and cut down on repetition,duplicative work, and errors.
Sharper insight: While the proportion offinance staff in business partnering roles hasremained much the same, top performerssee finance professionals spend more timeon analysis as opposed to just gathering thedata. The quality of what they deliver is alsomore highly rated. Why?
1 Insight professionals are paid more andare worth more, but fewer are needed;
2 Recognition of the need to look beyondroutine budgets and forecasts towards amore radical and challenging view ofbusiness threats and opportunities;
3 Helping the business to identifypriorities and cut out needless reports;
4 Close collaboration with the business toensure data quality and consistency;
5 Investment in technology to speed upanalysis and delivery of managementinformation and
6 Use of visualisation. Globally we areseeing on-the- go tablet communicationto bring management information to lifeand make it more accessible.

Real Estate Finance Function Effectiveness Benchmarking Insights ReportPwC 4
4 People & Technology: the enablers toa successful finance function
People and technology are the keyenablers to achieving a successfulfinance function. Best in classoperators invest in both of theseareas to ensure that they have anappropriate foundation to supportthem as their business maturesthrough the cycle.
Investing in your team
Employees are the bedrock of mostorganisations with salaries and wagesoften being one of the largest costbase across most industry sectors,including the Real Estate sector.
Keeping employees engaged andfostering a culture of innovation andexcellence are common themessenior management teams deal withon a regular basis.
Employers with a strong employeebrand, active management of talentin career development andsatisfaction surveys are betterpositioned to refresh the workforceand ensure that valued employees arestimulated, loyal and performing totheir full potential.
Interestingly 33% of surveyedparticipants rarely or never performemployee satisfaction surveys- atelling sign of the quality of therelationship between seniormanagement teams and staff.
Best in class performers focus onempowering their teams andtransforming how they are managed.Focusing on these areas leads toincreased capacity, quality of workand ultimately- customersatisfaction.
Investing in your technology
81% of CEOs believe technologyadvancement is the key globalmegatrend that will transformbusinesses over the next 5 years.
Business leaders report thatinvestments in digital technologieshave created value for their businessin a range of areas includinginnovation and customer satisfaction.Figure 3 highlights that most CEOssee data and analytics technologies asgenerating the greatest return forstakeholder engagement.
The digital revolution means thatfinance technology is not onlybecoming more advanced, butcheaper to acquire and moreaccessible and interactive in its use.Leading organisations are nowunderstanding the drivers ofperformance and are identifyingbusiness opportunities that would nothave been visible previously.Businesses not doing this now will beleft behind.
Tablets and smartphones, cloudcomputing, very high-speed networkinfrastructure and onlinecollaboration, have all opened up newways for finance personnel to interactwith the data, their customers, andeach other. We now operate in adigitally immersed businessenvironment and that has importantimplications for finance functions.
Top performing finance teams aretoday using these technologies toopen up new styles of working thatare more flexible and a better fit forcertain segments of the population.Mobile computing and onlinecollaboration tools allow greaterfreedom for finance personnel towork any time, any place, rather thanbeing chained to a traditional officesetting. That flexibility in turnreduces turnover among keysegments of the finance population.
Figure 3:
Q:Select the connecting technologies youthink generate the greatest return in termsof engagement with wider stakeholders
8% turnover of staffcompared to average
14%performers who experience
Top performers experience
turnover
68%
65%
50%
33%
30%23% 21%
44%
53%
Customer relationshipmanagement systems
Data andanalytics
R&D and innovation
Social media communications
and engagement
Web-enabledcollaboration tools
Online reportingtechnologies
Personal data security
Social listening toolsInvestor
relationship tools

Real Estate Finance Function Effectiveness Benchmarking Insights ReportPwC 5
Cross functionaltransformation
The close understanding andcollaboration between finance andother functions is a key feature of topperforming finance teams.
This integration at all levels of theorganisation stretches from theefficient and timely processing offunctional information to theexploration of data-driven insightsthat move the business forward.
Increasingly, organisations areturning to finance professionals asthey consider transformationprocesses. As technology continues toadvance and businesses demandmore flexibility, efficiency andcapability from their people,transformation projects often requirethe coordination of finance, IT andHR departments to ensure theirsuccess.
In order to be successful, businesstransformations should align allsupport functions around commonorganisational goals, as well asinternal stakeholder needs. Supportfunctions need to work together,sharing information and processes.They also need to reallocate existingtasks to the most efficient locationand use the latest technologies toimprove processes, reduce costs, andmake better decisions. Financeprofessionals recognise that thenexus of improved technology,communication, and collaboration iscritical if they are all going to be moreeffective in carrying out theirfunctions (see Figure 4).
Figure 4: Which of the following do you believe would make financeprocesses more effective?
Real Estate Finance Function Effectiveness Benchmarking Insights ReportPwC 6
5 Trends in TransactionalEfficiency processes
Transactional efficiency processes are oftenreferred to as the “core but low impact”tasks associated with a finance function.Despite this, these processes are integral tothe finance function as a whole and ifperformed well and efficiently they can addto a sound foundation from which thefinance function can add significant value toyour business.
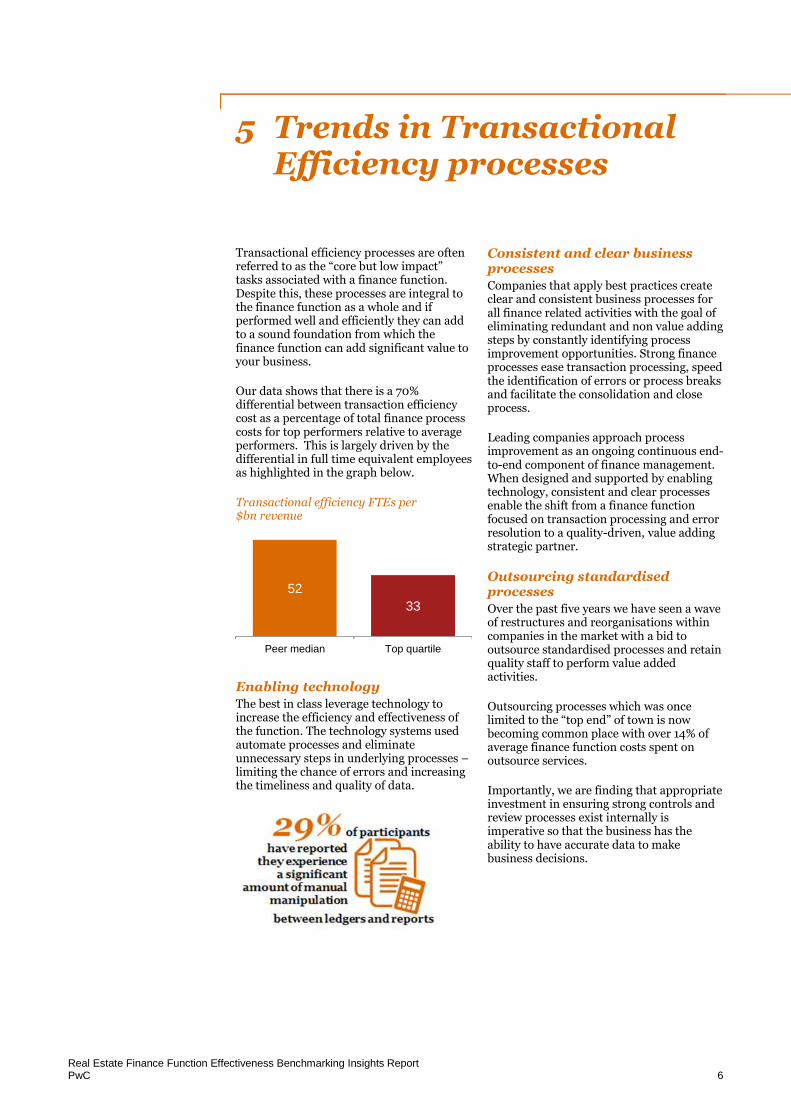
Our data shows that there is a 70%differential between transaction efficiencycost as a percentage of total finance processcosts for top performers relative to averageperformers. This is largely driven by thedifferential in full time equivalent employeesas highlighted in the graph below.
Transactional efficiency FTEs per$bn revenue
Enabling technology
The best in class leverage technology toincrease the efficiency and effectiveness ofthe function. The technology systems usedautomate processes and eliminateunnecessary steps in underlying processes –limiting the chance of errors and increasingthe timeliness and quality of data.
Consistent and clear businessprocesses
Companies that apply best practices createclear and consistent business processes forall finance related activities with the goal ofeliminating redundant and non value addingsteps by constantly identifying processimprovement opportunities. Strong financeprocesses ease transaction processing, speedthe identification of errors or process breaksand facilitate the consolidation and closeprocess.
Leading companies approach processimprovement as an ongoing continuous end-to-end component of finance management.When designed and supported by enablingtechnology, consistent and clear processesenable the shift from a finance functionfocused on transaction processing and errorresolution to a quality-driven, value addingstrategic partner.
Outsourcing standardisedprocesses
Over the past five years we have seen a waveof restructures and reorganisations withincompanies in the market with a bid tooutsource standardised processes and retainquality staff to perform value addedactivities.
Outsourcing processes which was oncelimited to the “top end” of town is nowbecoming common place with over 14% ofaverage finance function costs spent onoutsource services.
Importantly, we are finding that appropriateinvestment in ensuring strong controls andreview processes exist internally isimperative so that the business has theability to have accurate data to makebusiness decisions.
52
33
Peer median Top quartile

Real Estate Finance Function Effectiveness Benchmarking Insights ReportPwC 7
6 Trends in compliance andcontrol processes
On average, the compliance and controlfunction makes up 33% of total financefunction costs. In the context of thechanging regulatory environment theeffectiveness of the compliance and controlfunction is increasingly important.
In recent years we have seen regulators haveincreased expectations of directors andmanagement in relation to the way in whichcompliance is managed in a business.
Typically regulators look for formaldocumentation of obligations, process andcontrols to show how regulatoryrequirements are managed.
The banking industry has been on theforefront of these changes in regulations andcompanies within this sector have investedheavily to develop a relevant frameworkwithin each business to manage complianceand controls effectively.
3 Lines of Defence – effective use ofcompliance in the organisation
To help address these increasedexpectations, a number of organisations thatparticipated in the benchmarking surveyhave moved to or are considering moving toa “3 Lines of Defence” model. The 3 lines ofdefence model aims to provide assurance tothe business and the Board that the variousrisks within an organisation are beingmanaged and reported appropriately.
In its simplest form we would typically seethe following:
The lines together create a simpleframework for managing risk in anorganisation and, if adopted effectively,should result in a simple and transparentprocess which is flexible enough to quicklyincorporate changes in the business and bepicked up by new team members.
In our experience risk and complianceshould not be the role of the compliancefunction; it needs to be embedded into day-to-day business operations in order to beeffective. The 3 lines of defence model ismade effective by pushing the risk andcompliance ownership back to the business.
The compliance role should, however, notonly focus on providing oversight, rather itshould be rigorous enough to ensure thatappropriate monitoring occurs.
By redirecting the compliance team’s effortsonto monitoring and managing risk therewill be more opportunities to limit the riskof non-compliance, increase the valuegenerated from the compliance team andreduce the cost of the function overall.
Risk Management: ownedand managed by Risk & ComplianceLine 2
Risk Ownership: owned andmanaged by the businessLine 1
Risk Assurance: includingexternal vendors and internal auditLine 3

Real Estate Finance Function Effectiveness Benchmarking Insights ReportPwC 8
7 Trends in Business Insight processes
Finance functions that serve as value-adding partners have a solidunderstanding of the business andenhance the ability of leadership tounderstand and manage risks andvalue drivers.
Leading finance functions challengebusiness units and manage performersto optimise value and boost financialperformance.
Some measures of success in this areainclude:
* Number of finance staff who have anindirect reporting responsibility tobusiness units;
* Percentage of staff evaluated for theirability to create long-term value;
* Number of collaborative projects.
Our benchmarking survey shows that33% of survey participants haveresponded that finance plays no role inthe strategic planning process. Thiscreates a real opportunity forcompanies to relook at the financefunction’s purpose in this space and toredefine its role which will enable abetter outcome for the business as awhole.
Embracing technology
Interestingly we have seen that the topquartile of participants have 36% lessfull time equivalent staff working onprocesses relating to the businessinsights area relative to the averagesurveyed.
The differential is largely within thebudgeting and forecasting functionswhere there is a 34% differentialbetween the top quartile and averageperformers.
The technology infrastructuresupporting the budgeting andforecasting processes is at the core ofthe function. The graph below showsthat 43% of participants use extensivespreadsheets in performing budgetsand forecasts- increasing the need formanual manipulation of data, timespent on completing budgets andforecasts and the risk of errors.
Budgeting and forecasting technologyinfrastructure
The finance function of the future willneed to embrace technology in allfinance related processes- especially inbusiness insight functions so that realtime data can be gathered quickly inorder for business decisions to be madeeffectively.
Time spent collecting versusanalysing data
The majority of participants have ahigh reliance on forecasts withparticipants reporting some materialdifference resulting in forecastsgenerated.
There is a significant investment madein the budgeting process for allparticipants however the top quartilecomplete the budgeting process 5 daysearlier than the average performingparticipant.
As can be seen from the graph to theright, there is a significant differential,however, in the percentage of timespent collecting the data in comparisonto the time spent analysing the databetween the top and averageperformers.
% time spent data collection vs. dataanalysis
Globally, we are seeing advances inautomation, the standardisation ofdata, and innovative and low-cost dataanalytics tools are reducing the timespent on data gathering. At the sametime, we’re seeing companiesemphasising the importance of dataanalysis. These factors are allowingteams to turn greater attention andtime to analysis and generatinginsights.
0%
29%
29%
43%
Fully automated processwith consol, system or
warehouse
Limited spreadsheets,consolidate using a tool
Controlled spreadsheet,central guidelines
Extensive spreadsheets
75%
45%
25%
55%
Peer median Top quartile
Data Collection Data analysis
Real Estate Finance Function Effectiveness Benchmarking Insights ReportPwC 9
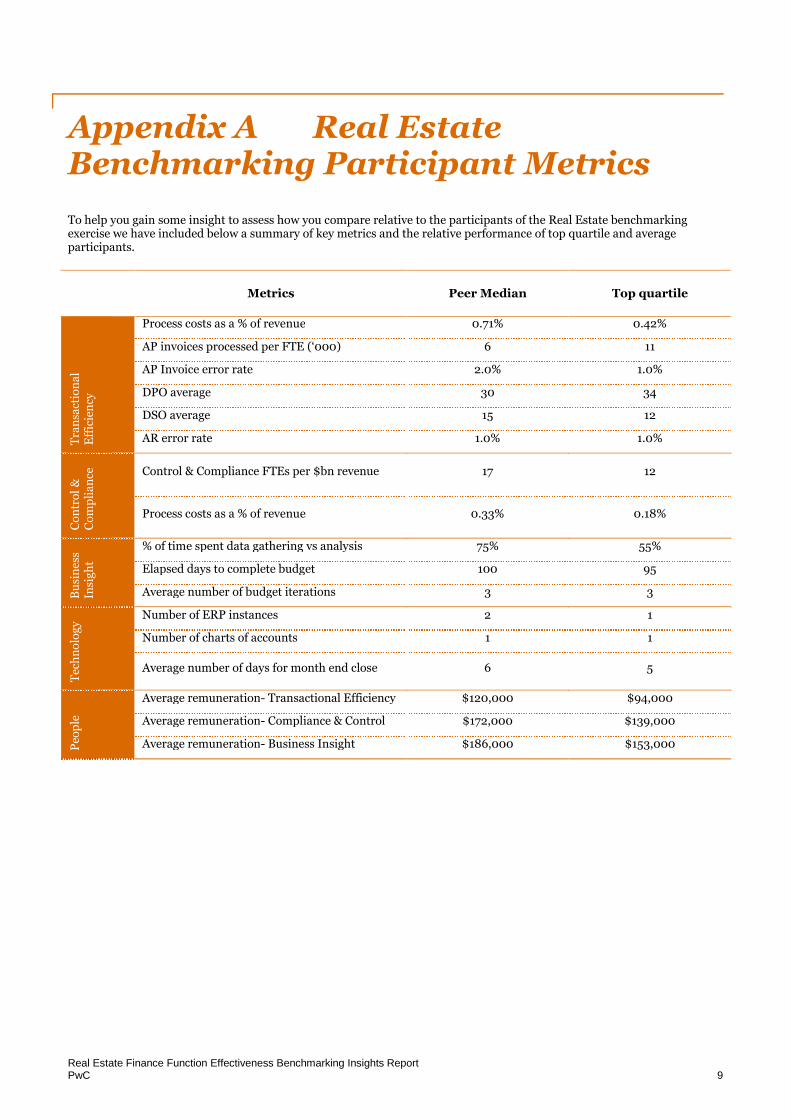
Appendix A Real EstateBenchmarking Participant Metrics
To help you gain some insight to assess how you compare relative to the participants of the Real Estate benchmarkingexercise we have included below a summary of key metrics and the relative performance of top quartile and averageparticipants.
Metrics Peer Median Top quartile
Tra
nsa
ctio
na
lE
ffic
ien
cy
Process costs as a % of revenue 0.71% 0.42%
AP invoices processed per FTE (‘000) 6 11
AP Invoice error rate 2.0% 1.0%
DPO average 30 34
DSO average 15 12
AR error rate 1.0% 1.0%
Co
ntr
ol
&C
om
pli
an
ce Control & Compliance FTEs per $bn revenue 17 12
Process costs as a % of revenue 0.33% 0.18%
Bu
sin
ess
Insi
gh
t
% of time spent data gathering vs analysis 75% 55%
Elapsed days to complete budget 100 95
Average number of budget iterations 3 3
Tec
hn
olo
gy
Number of ERP instances 2 1
Number of charts of accounts 1 1
Average number of days for month end close 6 5
Peo
ple
Average remuneration- Transactional Efficiency $120,000 $94,000
Average remuneration- Compliance & Control $172,000 $139,000
Average remuneration- Business Insight $186,000 $153,000

www.pwc.com.au
© 2016 PricewaterhouseCoopers. All rights reserved.PwC refers to the Australian member firm, and may sometimes refer to the PwC network.Each member firm is a separate legal entity. Please see www.pwc.com/structure for further details.
Liability limited by a scheme approved under Professional Standards Legislation


