13
Shanghai, December 14 th 2018 Benchmarking the evolution of the China luxury market Illustrative Report

Shanghai, December 14th 2018
Benchmarking the evolution of
the
China luxury market
Illustrative Report

14 Dec 2018
Contents of the document
China at a glance
Overview of China luxury market
Retail development of reference brands
Selected trends

14 Dec 2018
China at a glance: Population Mainland China is divided into 27 Provinces and 4 Municipalities (Beijing, Shanghai, Tianjin and Chongqing). 8 Provinces
have a population larger than 60 millions
Heilongjiang
Jil
in Liaoning
Tianjin
Beijing
Shandong
Shaanxi Jiangsu
Shanghai Zhejiang
Jiangxi
Hubei Chongqing
Guizhou
Guangxi Guangdong
Fujian
Xinjiang
Qinghai
Tibet
Yunnan
Gansu
Hainan
Inner Mongolia Jilin
Sichuan
Shanxi
Henan
Ningxia
Anhui
Hunan
Hebei
Source: www.Citepopulation.de
104
Guizhou Shanxi Fujian
Sichuan
96
Shaanxi Heilongjiang
Liaoning
Henan 94
Jiangxi Yunnan
Guangxi
Shandong
80
Zhejiang Hubei Anhui
Guangdong
79
Hunan Hebei
Jiangsu 72
66 60
57 54
46 46 45 44
38 37 37 36 35
29 27
26 25
23 22
20 13
9 6 6
Inner Mongolia Gansu
Jilin Chongqing
3
Shanghai Xinjiang
Beijing Tianjin Hainan Ningxia Qinghai
Tibet
>40, <60
>60, <80
>20, <40
>80
<20
Map of Population (Mil.) Population 2010 (Mil.)
14 Dec 2018
Heilongjiang
Jil
in Liaoning
Tianjin
Beijing
Shandong
Shaanxi Jiangsu
Shanghai Zhejiang
Jiangxi
Hubei Chongqing
Guizhou
Guangxi Guangdong
Fujian
Xinjiang
Qinghai
Tibet
Yunnan
Gansu
Hainan
Inner Mongolia Jilin
Sichuan
Shanxi
Henan
Ningxia
Anhui
Hunan
Hebei
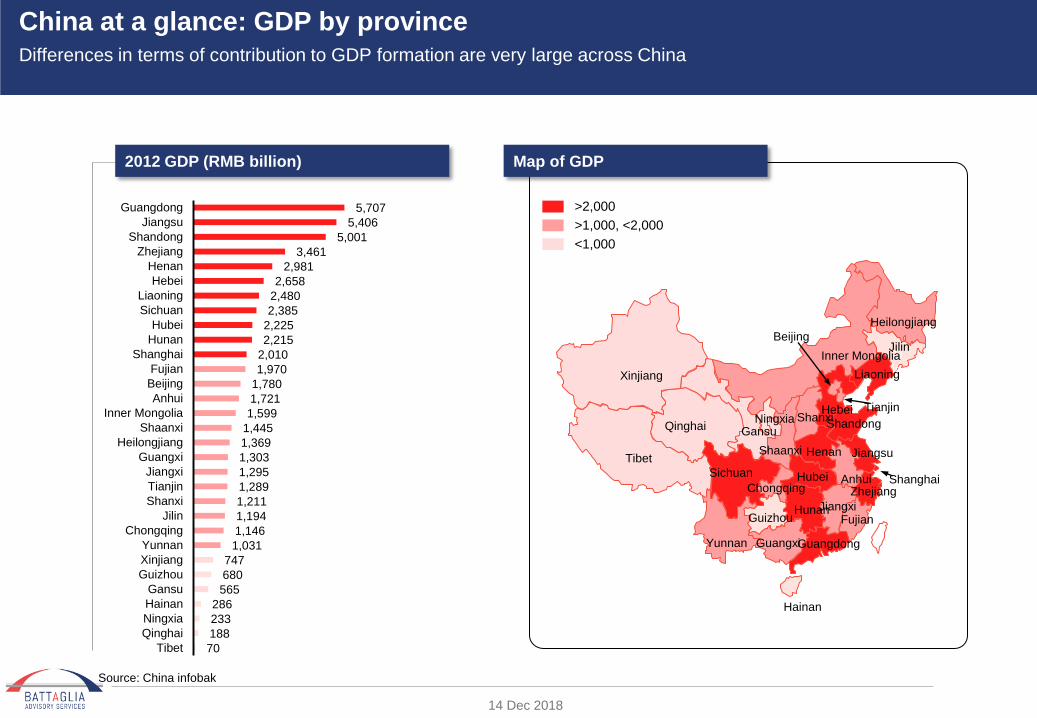
>2,000
>1,000, <2,000
<1,000
70
188
233
286
565
680
747
1,031
1,146
1,194
1,211
1,289
1,295
1,303
1,369
1,445
1,599
1,721
1,780
1,970
2,010
2,215
2,225
2,385
2,480
2,658
2,981
3,461
5,001
5,406
5,707
Tibet
Qinghai
Ningxia
Hainan
Gansu
Guizhou
Xinjiang
Yunnan
Chongqing
Jilin
Shanxi
Tianjin
Jiangxi
Guangxi
Heilongjiang
Shaanxi
Inner Mongolia
Anhui
Beijing
Fujian
Shanghai
Hunan
Hubei
Sichuan
Liaoning
Hebei
Henan
Zhejiang
Shandong
Jiangsu
Guangdong
Source: China infobak
Map of GDP 2012 GDP (RMB billion)
China at a glance: GDP by province
Differences in terms of contribution to GDP formation are very large across China

14 Dec 2018
China at a glance: Disposable income Municipalities and coastal provinces have the highest per capita disposable income
Map of Disposal Income (kRMB)
Heilongjiang
Liaoning
Tianjin
Beijing
Shandong
Shaanxi Jiangsu
Shanghai Zhejiang
Jiangxi
Hubei Chongqing
Guizhou
Guangxi Guangdong
Fujian
Xinjiang
Qinghai
Tibet
Yunnan
Gansu
Hainan
Inner Mongolia Jilin
Sichuan
Shanxi
Henan
Ningxia
Anhui
Hunan
Hebei
Per capita Disposal Income 2012 (kRMB)
Source: www.Citepopulation.de
Heilongjiang Inner Mongolia
19
Tibet
19
Guizhou
19
Gansu
18
Xinjiang
18
Qinghai
18
Ningxia
25
Sichuan
23
Henan
20
Shanxi
20
Shaanxi
19
Hebei
19
Hainan
16
Hunan
15
Hubei
14
Yunnan
2
Anhui
14
Jiangxi
2
Guangxi
36
Jilin
33
Chongqing
31
Liaoning
27
Shandong
27
Fujian 26 Jiangsu
18
Guangdong
18
Tianjin
18
Zhejiang
18
Beijing
18
Shanghai
16
18
>10, <20
>20, <30
<10
>30

14 Dec 2018
China at a glance: Main cities According to the common definition, China is segmented in 4 Tier 1 cities, 14 Tier 2 and 19 Tier 3
4
Tier 1 cities
14
Tier 2 cities
19
Tier 3 cities
Beijing
Shanghai
Guangzhou
Shenzhen
Hangzhou
Tianjin
Chengdu
Wuhan
Nanjing
Shenyang
Qingdao
Harbin
Chongqing
Xi’an
Dalian
Jinan
Changchun
Changsha
Wuxi
Wenzhou
Sanya
Nanning
Kunming
Fuzhou
Zhengzhou
Taiyuan
Suzhou
Changzhou
Guiyang
Haikou
Hohhot
Ningbo
Shijiazhuang
Xiamen
Urumqi
Hefei
Lanzhou
GDP Population
1,780 20.7
2,010 23.8
1,230 8.1
1,150 10.5
GDP Population
780 8.8
455 9.9
1,119 13.5
685 14.1
800 10.1
720 8.2
591 7.2
1,146 29.5
730 7.7
730 8.6
700 5.9
481 7.0
400 7.6
640 7.1
GDP Population
757 4.7
208 4.2
335 8.0
33 0.6
221 7.1
251 6.5
373 6.5
1,200 6.4
555 9.0
397 3.6
170 4.4
71 2.1
218 2.9
652 5.8
408 10.3
206 3.4
282 1.9
364 7.5
156 3.2
Total 63 145 98 Total Total
Source: China infobank

14 Dec 2018
China at a glance: Regional differences Some central provinces are today growing very fast and are generally considered the next frontier of China luxury
development
East
- Moderate weather
- Fashion savvy, pay great attention to details
- Fast-paced life
- The area with the higher purchasing power
- One of the richest areas, it is also a shopping destination for
consumers from all around China
South
- A very developed and rich area
- Moderate climate, pleasant the whole year
- Travel frequently to HK and Macau (and do there most of their
shopping)
- Counterfeiting is a huge problem in this area
- Being much driven by export, the area suffered from the crisis
North
- Winter is dry and cold
- Conservative and respectful for traditional family values
- Generous, practical and forthright
- Good appreciation of luxury goods, but economy less developed
and retail market still very “polarized” (luxury or low end)
- Local consumer are less aware of international brands and do
not travel as much as in the other areas
West
- Moderate continental weather
- Very laid-back life attitude and carefree lifestyle
- Local consumers seem very willing to spend on luxury goods
(similarly to those of the north) and do not travel frequently
- The market demand is growing quickly driven by the rise of the
middle class
Source: TNS International Research, Internal analysis
14 Dec 2018
Contents of the document
China at a glance
Overview of China luxury market
Retail development of reference brands
Selected trends

14 Dec 2018
Chinese millionaires map Beijing, Guangdong, Shanghai and Zhejiang are home to the largest concentration of Chinese Millionaires, accounting
for 60% of total
20.000
17.100
20.000
22.500
24.200
52.000
53.000
55.000
140.000
179.000
7.000
7.500
6.500
8.800
13.000
12.500
12.500
12.500
12.500
15.000
18.000
>100k
50k-100k
30k-50k
10k-30k
<10k
Beijing
Shanghai
Guangzhou
Hangzhou
Shenzhen
Nanjing
Wenzhou
Suzhou
Tianjin
Ningbo
Dongguan
Chengdu
Xiamen
Qingdao
Dalian
Chongqing
Fuzhou
Shenyang
Harbin
Wuhan
Xi’an
19%
15%
12%
12%
14%
10%
10%
28%
18%
48%
23%
11%
9%
13%
14%
29%
27%
15%
12%
59%
67%
In 2012, Chinese Millionaires increased to 1,020,000 by number. Xi’an, Wuhan,
Ningbo, Chongqing, Suzhou and Dongguan enjoyed the fastest growth from 2010
to 2012
Hangzhou
Chongqing
Guangzhou
Shanghai
Tianjin
Beijing
Dongguan
Wenzhou
Suzhou
Ningbo
Shenzhen
Chengdu
Nanjing
Xiamen
Fuzhou
Qingdao
Dalian
Harbin
Shenyang
Wuhan
Tier1 city
Tier2 city
Tier3 city
Source: Hurun 2012 Wealth Report
No. of Millionaires in 2012 Growth%
2010 - 2012
Fastest growth

14 Dec 2018
40% 37%
34%
33%
26%
30%
2011 2012
OverseasHK/ Macau/ TWMainland China
Luxury spending of Chinese nationals Despite the global economy slow down, Mainland China luxury market still increased by 7% in 2012. Total Luxury
consumption of Chinese nationals grew 15%
In 2012, Mainland China’s luxury market
grew at 7%, a lower rate as respect to
previous years
Spending in HK/TW/Macau grew at 12%
Chinese outbound tourists have
traditionally targeted brands when
traveling to popular destinations like
South Korea, France and USA, as well
as at airport duty-free shops worldwide
Total= 266
306
Billion RMB
CAGR
(11’- 12’)
15%
N.B. The definition for “luxury products” is not precise. The categories here included are accessories, apparel, jewellery & watch, leather
goods (bags/shoes), high end cosmetics; Not include wine & spirits and durable goods such as cars and yachts
Source: Bain&Co, BAS analysis
Total spending on Luxury by Chinese nationals
31%
12%
7%

14 Dec 2018
Mainland China luxury market by product category Apparel accounts for 14.5% of the overall luxury goods markets. In 2012 it performed better than other luxury segments
Source Bain&Co, BAS analysis:
In 2012, China Luxury market
grew overall by 7% as respect to
30% in 2010 and 27% in 2009
Typical gifts items like watches (-
5%) and jewelry (+5%) were the
most affected categories
Women’s items (apparel and
cosmetics) still enjoyed a healthy
growth
Despite the temporary slow
down, China is still a very
dynamic market for luxury
brands
China Luxury market category
Accessories, 6%
Women’s wear, 4.5%
Shoes, 6%
Jewelry,8%
Men’s wear, 10%
Leather goods, 19.5%
Cosmetic, perfume
and personal care,
22%
Watches, 30%
2009-2010 2010-2011 2011-2012
27% 30% ~7%
15%
27%
20%
22%
24%
30%
22%
45%
20%
35%
20%
20%
30%
30%
22%
40%
10%
15%
10%
5%
12%
10%
15%
-5%

14 Dec 2018
Luxury consumption by disposable income segment Very wealthy and wealthy people drive luxury demand in China
2015E
15%
25%
32%
28%
2012
13%
27%
36%
24%
Upper Middle Class (50-250k)
Mass Affluent (250-500k)
Wealthy (500k - 1Mn)
Very Wealthy (>1Mn)
Total = 127 Bn RMB 188 Bn RMB
21%
10%
11%
24%
12%~16%
2012-2015 CAGR
The wealthy and very wealthy are
only 1% of total households, but
contributed for 60% of luxury
consumption in 2012. Their
purchases are expected to even
increase in terms of share by 2015
The consumption of the upper
middle class households is
expected to increase from 13% of
luxury consumption to 15%, mainly
fuelled by the increased number of
families reaching the status
Overall the market is still expected
to grow by more than 10% a year
Very
Wealthy
Wealthy
Mass
Affluent
Upper
Middle
Class
Source: Hurun Report 2012, McKinsey&Co
Luxury consumption by annual household disposal income
14 Dec 2018
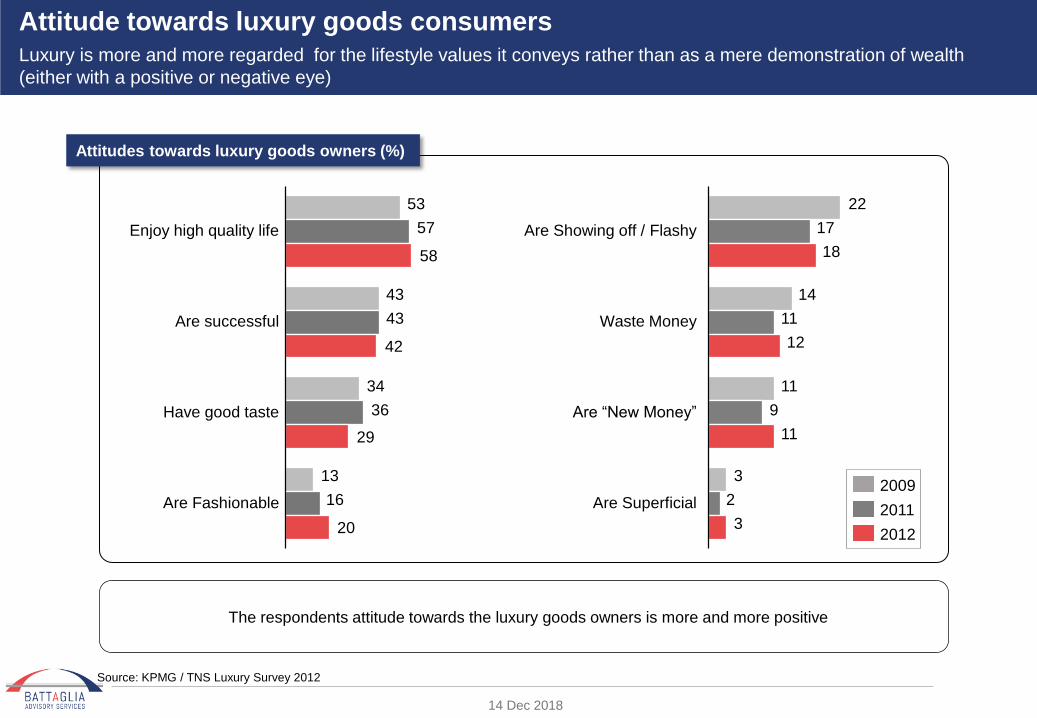
Attitudes towards luxury goods owners (%)
Attitude towards luxury goods consumers Luxury is more and more regarded for the lifestyle values it conveys rather than as a mere demonstration of wealth
(either with a positive or negative eye)
53
43
34
13
57
43
36
16
58
42
29
20
Enjoy high quality life
Are successful
Have good taste
Are Fashionable
22
14
11
3
17
11
9
2
18
12
11
3
Are Showing off / Flashy
Are Superficial
Are “New Money”
Waste Money
2012
2011
2009
Source: KPMG / TNS Luxury Survey 2012
The respondents attitude towards the luxury goods owners is more and more positive


