45
Airbus vs. Boeing in Superjumbos: Credibility and Preemption Benjamin C. Esty Pankaj Ghemawat Working Paper 02-061
Airbus vs. Boeing in Superjumbos: Credibility and Preemption
Benjamin C. Esty Pankaj Ghemawat
Working Paper 02-061
Working Paper 02-061
Copyright © 2001, 2002 by Benjamin C. Esty andPankaj Ghemawat
Working papers are in draft form. This working paper is distributed for purposes of comment and discussion only. It may not be reproduced without permission of the copyright holder. Copies of working papers are available from the author.
Airbus vs. Boeing in Superjumbos: Credibility and Preemption
Benjamin C. Esty Harvard Business School
Pankaj Ghemawat Harvard Business School
Airbus vs. Boeing in Superjumbos: Credibility and Preemption
by
Benjamin C. Esty
and
Pankaj Ghemawat
Current Draft: August 3, 2001 Benjamin C. Esty Pankaj Ghemawat Morgan 381 Morgan 227 Harvard Business School Harvard Business School Boston, MA 02163 Boston, MA 02163 Tel: (617) 495-6159 Tel: (617) 495-6270 e-mail: [email protected] e-mail: [email protected] Acknowledgements: We would like to thank Ed Greenslet and The Airline Monitor for providing data on and insights about the commercial jet aircraft industry, Mike Kane for assistance with the original teaching case, and the Division of Research at the Harvard Business School for supporting this research.
2
Airbus vs. Boeing in Superjumbos: Credibility and Preemption
Abstract In December 2000, Airbus formally committed to spend $12 billion to develop
and launch a 555-seat superjumbo plane known as the A380. Prior to and after Airbus’ commitment, Boeing started and canceled several initiatives aimed at developing a “stretch jumbo” with capacity in between its existing jumbo (the 747) and Airbus’ planned superjumbo. This paper provides a strategic (game-theoretic) interpretation of why Airbus, rather than Boeing, committed to the superjumbo, and why Boeing’s efforts to introduce a stretch jumbo have, at least to date, been unsuccessful. Specifically, game theory suggests that the incumbent, Boeing, would earn higher operating profits if it could somehow deter the entrant, Airbus, from developing a superjumbo, but that entry-deterrence through new product introductions is incredible even if the incumbent enjoys large cost advantages in new product development (e.g., because of line-extension economies)! This hypothesis of potentially profitable preemption precluded by credibility constraints is consistent with a wide array of evidence from the case studied: pro forma financial valuations, capital market reactions, plane pricing data, demand forecasts, and even internal organizational changes.
1
I. Introduction
In December 2000, Airbus formally committed to develop and launch a 555-seat superjumbo plane known as the A380 at a launch cost of $12 billion. In addition to making the superjumbo one of the largest product launch decisions in corporate history, this figure represented 26% of total industry revenues in 2000 ($45.6 billion) and more than 70% of Airbus’ total revenues ($17.2 billion) in 2000.1 The inherent risk associated with this major strategic commitment is magnified by the fact that Airbus must spend the entire amount before it delivers the first plane. History has shown that many firms including Glenn Martin, General Dynamics, and, more recently, Lockheed, have failed as a result of attempting such bet-the-company product development efforts. If, however, the launch effort does succeed, Airbus is expected to dislodge Boeing as the market leader in commercial aircraft after more than 50 years of market dominance by the latter.
This paper presents a game-theoretic analysis of this new product commitment
and, more generally, of competition in very large aircraft (VLA is defined as planes capable of seating more than 400 passengers).2 The basic theoretical argument is that it is important to account for credibility constraints and undertake systematic strategic analysis in assessing such product-line interactions. This argument is established in the context of a case that seems particularly likely to reveal the fingerprints of strategic behavior because of how well it maps into simple theoretical models of strategic interactions in new product development.
Several elements of the match between this empirical setting and the thrust of
theoretical modeling efforts are worth mentioning. To begin with, there are only two competitors in the market for large aircraft and they have some degree of familiarity with each other. While each competitor offers a broad array of products, looking at one end of their product range (defined in terms of product capacity) makes it more plausible to focus on a particular market segment, i.e., to concentrate on a small number of products, than if one were looking at the middle of the product range. The top-end VLA segment is particularly congenial analytically since at the bottom end, competition from regional jet manufacturers expanding beyond their sub-100 seat niche would also have to be taken into account. The two competitors’ possible moves in VLA are relatively clearly defined and involve, very large, lumpy commitments to product development. And the products themselves, while complex, fit relatively well with simple, i.e., low-dimensional, models of product differentiation. Given these considerations, one could argue that the battle over the VLA market segment is some sense a “critical case study” for game theory.
From an empirical rather than theoretical perspective, the data on actual prices,
quantities, and costs needed to calibrate structural models of strategic interactions in the VLA segment are not likely to become available until after 2010. But this setting does 1 Data according to Boeing’s 2000 Current Market Outlook. See also The Airline Monitor, July 2000. 2 Airbus’ Global Market Forecast (GMF) defines the VLA market as consisting of passenger aircraft with
more than 500 seats and cargo aircraft capable of handling more than 80 tonnes of freight. In contrast, Boeing’s Current Market Outlook (CMO) defines the VLA market as aircraft seating more than 400 passengers, the size of the 747.
2
possess other evidentiary attractions. For one thing, it has attracted substantial attention and commentary from the companies themselves, by financial analysts, and in the popular press. This information permits, among other things, rough modeling of the financial consequences to the two companies of pursuing different strategic options. Additionally, the fact that both competitors are (now) publicly-traded companies with commercial aircraft as their largest line of business facilitates event-study analysis, i.e., the analysis of stock price reactions to key product-related announcements.
The analysis employed in this paper therefore resembles Porter and Spence’s
[1982] classic case study of corn wet milling rather than more recent work involving estimation of detailed structural models (e.g., Benkard’s [1999] study of widebody aircraft). We place particular emphasis on the use of financial tools—pro forma models of the payoffs that the two companies attached, or should have attached, to various options, and event-study analysis—to assess the importance of the interactive effects identified by the game-theoretic modeling. Also pressed into service are a range of other sources of information, on prices, demand forecasts, and even internal organizational changes. The rationale for such eclecticism in data sources is that it is needed to interpret the events in this industry-and in many other settings characterized by thin data.
We focus our analysis of product-line interactions in the VLA segment on two
key questions. First, why did Airbus, not Boeing, launch the superjumbo? And second, why have Boeing’s efforts to launch an intermediate “stretch jumbo” been largely unsuccessful, at least to date? Section II of this paper provides background information on the commercial aircraft industry, the two major competitors in it, and the state of play between them in very large aircraft as of early 2001. Section III provides pro forma financial analyses of Airbus’s superjumbo and Boeing’s jumbo that anchor the rest of the discussion. Section IV maps this case onto a set of considerations that are, according to simple game-theoretic models, influential in determining whether an incumbent (read Boeing) can crowd out a possible entrant (read Airbus) by developing a new product. Section V adds to the evidence that the game-theoretic or strategic effects flagged by the theoretical models actually loomed large in Boeing and Airbus’s interactions in very large aircraft by analyzing stock market reactions to their product-related announcements (i.e., event study analysis), their pricing patterns, their public demand forecasts and even internal organizational factors. Section VI concludes.
II. Case Background3
With total sales of $45.6 billion in 2000, the manufacture and sale of jet aircraft is the biggest single segment of the $140 billion commercial aviation industry. Two firms, The Boeing Company and Airbus Industrie, dominate the manufacture of large commercial aircraft. Combined, they delivered 790 aircraft in 2000, ranging from single-aisle jets seating 100-200 passengers to the twin-aisle Boeing 747-400 seating more than
3 Most of the background material contained in Sections II and III comes from Esty and Kane’s (2001) case
study on the Airbus A3XX, later renamed the A380.
3
400 passengers. Figure 1 maps Boeing’s and Airbus’s product lines along the critical dimensions of capacity (in statute miles) and range (number of seats in the standard configuration). There is a strong, positive, and statistically significant relationship in positioning along these two dimensions of the product space.
Figure 1 about here Boeing has been at the forefront of civil aviation for over half a century. From
the B17s and B29s of World War II through the B52s of the Cold War, it has leveraged its manufacturing and defense experience to become the world’s leading producer of commercial aircraft. Boeing’s commercial fleet consists of 14 models spread across 5 aircraft families. It has built approximately 85% of the industry’s current fleet and, until recently, regularly captured 60-80% of orders and deliveries. The flagship of the Boeing fleet, the 747-400, holds 412 passengers in the standard three-class configuration and as many as 550 in certain “high-density,” all-coach configurations. More than three decades after the jumbo was introduced, demand for it remains strong. Boeing delivered 25 747’s in 2000, down from 47 planes in 1999, and had an order backlog for 80 more.4 At the corporate level, Boeing had revenues of $51.3 billion, net income of $2.1 billion, an equity market capitalization of $58 billion, and 198,000 employees at year end 2000. Sales of commercial aircraft generate almost two-thirds of total revenue while sales of military aircraft, missiles, and space systems account for the rest. In addition to being the federal government’s second largest defense contractor, Boeing is the largest single contributor to the US balance of payments in terms of exports.
The other major competitor, Airbus Industrie, was founded in 1970 as a
consortium of the principal aerospace companies of Germany (Deutsche Aerospace, now a Daimler-Chrysler subsidiary known as DASA), France (Aerospatiale Matra), England (Britain’s Hawker Siddeley, later BAE Systems), and Spain (Construcciones Aeronauticas, CASA). Airbus has a fleet of nine basic models, a customer base of 171 operators, and an order backlog for 1,445 planes. All of its planes employ “fly-by-wire” technology that substitutes computerized control for mechanical linkages between the pilot and the aircraft’s control surfaces. This technology combined with a common cockpit design help explain why Airbus received over half the orders for large aircraft for the first time in 1999, even though its share of deliveries was only 33% by number and 30% by value that year. Despite the gains in market share, Airbus still does not have a jumbo jet to compete with Boeing’s 747 in the VLA market. A senior executive at Aerospatiale complained: “The problem is the monopoly of the 747, which is a fantastic advantage. They have a product. We have none.”5
In the early 1990s, Airbus and Boeing independently began to study the feasibility
of launching a superjumbo capable of holding 500 to 1000 passengers. Both agreed there
4 According to The Airline Monitor, Jan/Feb 2001. 5 Cole, J., “Airbus Prepares to ‘Bet the Company’ as It Builds a Huge New Jet,” The Wall Street Journal,
11/3/99, p. A1.
4
was a growing need for a superjumbo because of increasing congestion at major hubs like New York, Los Angeles, London, and Tokyo. Alternative solutions were seen as either infeasible, in the case of greater flight frequency, or ineffective, in the case of flights to secondary airports. Fairly quickly, however, they realized, and industry analysts concurred, that there was room in the market for only one competitor.6
Over this period, there also appears to be an interesting attempt at preemption
involving private negotiations between Boeing and select Airbus members. Prior to joining forces with Airbus to explore the possibility of collaborating on a new superjumbo, Boeing secretly and separately approached Daimler Benz AG and British Aerospace PLC about the possibility of joining forces on a superjumbo jet. According to European news reports, subsequently denied by spokesmen from both Boeing and Airbus, Boeing invited Daimler-Benz and British Aerospace to collaborate in a joint venture.7
In the aftermath of such denials, Boeing and Airbus agreed to collaborate on a
joint feasibility study for a Very Large Capacity Transport (VLCT) plane that could hold from 550 to 800 passengers. When the collaboration began in January1993, they envisioned the plane would cost $10 to $15 billion to develop (with estimates ranging from $5 to $20 billion) and would sell for $150 to $200 million each. Their preliminary demand estimate was reported to be 500 planes over the next 20 years.8
In July 1995, however, the collaboration ended. An Airbus employee cynically
noted that Boeing’s participation in the joint effort may have been only to “…stall the market so that Airbus did not develop anything itself.”9 According to an industry analyst, much of the disagreement stemmed over the plane’s capacity and positioning in the VLA segment:
Strategic competitive considerations were also a factor for Boeing
and for the Airbus members. Seattle-based Boeing didn’t want the super-jumbo jet to carry fewer than 600 passengers, so that it could preserve the market for any expanded version of its 747 jumbo jets, which have a current maximum capacity of 420 seats.…Some Airbus members wanted any joint US-European line of superjumbo jets to begin with a 500-seat version to prevent Boeing from increasing its own overall share of all airliner markets.10
6 Cole, J. and B. Coleman, “Airbus Denies it Has Been Cut From Jet Talks,” The Wall Street Journal,
1/7/93, p. A4; Coleman, B., “Accord With Airbus to Study Superjumbo a Win for Boeing,” The Wall Street Journal Euorpe, 1/28/93, p. 3.
7 Cole, J., “Boeing, Two Airbus Members In Talks to Develop New Jet,” The Wall Street Journal Europe, 1/5/93, p. 3.
8 Coleman, B., “Accord With Airbus to Study Superjumbo a Win for Boeing,” The Wall Street Journal Euorpe, 1/28/93, p. 3.
9 “Airbus, Boeing Reportedly scrap Plans for Super Jumbo Venture, AFX News, 5/15/95. 10 Cole, J., “Boeing-led Allince Halts Superjumbo Jet,” The Wall Street Journal, 7/10/95, p. A3.
5
The two firms also disagreed at a very fundamental level about industry evolution. Boeing maintained that increased fragmentation in the form of point-to-point travel would solve the problem of congestion at major airports. Airbus, on the other hand, believed that hub-to-hub travel, particularly at the major airports in London, New York, Los Angeles, and Tokyo would continue to grow. Because greater flight frequency was not feasible and development of secondary airports was unlikely to provide a long-term solution, Airbus believed that development of planes with greater capacity was the only solution.
With the collaboration over, both competitors returned to independent study of the
superjumbo market. For its part, Boeing considered two updated and “stretched” versions of its popular 747 jumbo jet, the 747-500X holding up to 490 passengers and the 747-600X holding up to 550 passengers, at a cost of $5 to $7 billion.11 Although analysts expected Boeing to announce the new planes at the Farnborough Air Show in September 1996, it did not. In fact, Boeing never formally announced it was going to develop the stretch jumbo yet did, in January 1997, announce it was canceling the development effort.12 A little more than two years later, however, Boeing reversed course once again and now said it was going to build a stretch jumbo at a cost of $4 billion. The 747X-Stretch was supposed to hold up to 520 passengers and, according to Boeing, would be available by 2004, two years ahead of Airbus’ A380. At the time, Boeing forecast demand for 600 planes, comprised of 330 passenger and 270 cargo aircraft, in this size category by 2019.
Concurrently, Airbus forged ahead with development of a superjumbo jet and
finalized plans in 1999 to offer a family of very large aircraft. The first model, the A380-100, would seat 555 passengers in the standard three-class configuration and could provide non-stop service from Sydney to Los Angeles, Singapore to London Heathrow, or New York to Tokyo, the same routes currently served by Boeing’s jumbo. A second passenger model, the A380-200, would seat 650 passengers in the three-class configuration and up to 990 in an all-economy version. Airbus also planned to build a freighter version, the A380-800F, capable of carrying up to 150 tons of cargo. Although the increase in size relative to Boeing’s 747 appears large, Airbus argues that it represents a smaller relative increase over the 747 than Boeing’s 747 was over the next largest plane when it was introduced in 1969: the A380 is 35% larger than the 747, while the 747 was 150% larger than the 707.13 In terms of pricing, the A380’s list price is significantly higher than the 747’s list price, $220 million vs. $185 million, yet Airbus claims the combination of increased capacity and reduced operating costs provides superior economics. According to company documents, the operating cost per flight will be 12% more than the 747’s cost, but given the plane’s 35% greater capacity, it will provide almost 25% more volume for free.14
11 Sell, T.M., “Boeing May Soon Launch Updated 747s,” Seattle Post Intelligencer, 5/28/96, p. B1. 12 Cole, J., F. Rose, and C. Goldsmith, “Boeing’s 747 Decision Shifts Rivalry With Airbus,” The Wall
Street Journal, 1/22/97, p. A3. 13 Airbus A3XX Briefing to Financial Analysts, 10/4/00. 14 The Airline Monitor, Editor Edmund Greenslet, comment during an interview with the author on 9/28/00.
6
Developing the first passenger model and the freighter version of the superjumbo is expected to cost $10.7 billion, paid through $2.5 billion of “launch aid from European governments), $3.1 billion of risk sharing capital from suppliers like Saab, and $5.1 billion of equity from Airbus Industrie. In addition, Airbus forecasts a need for an additional $1.2 billion of capital expenditures bringing the total development and launch cost to $11.9 billion.
Between June 2000, when the Airbus supervisory board gave approval to begin
marketing the plane, and December 2000, airlines placed orders for 50 superjumbos and bought options on another 42 planes. With these orders in hand, including a number from important 747 customers such as Singapore Airlines and Qantas Airlines, the Airbus board officially launched the new plane.15 According to its internal projections, Airbus forecast a need for 1,500 planes of this size over the next 20 years, expected to capture up to half the market, and earn pre-tax margins of 20%.16 In addition, Airbus estimates it will break even with sales of 250 planes (on an accounting, but not cash flow basis) and will have 100 firm orders by the end of 2001.17
On March 29, 2001, Boeing announced it was curtailing development of its
stretch jumbo and would begin development of a new aircraft known as the sonic cruiser. This plane would fly faster (Mach 0.95 vs. Mach 0.80), higher, and more quietly than existing aircraft. It would also be significantly smaller than the stretch jumbo (200 passengers vs. 520 passengers), though it would cost more to develop ($9 billion vs. $4 billion). The sonic cruiser is not only more consistent with Boeing’s predictions regarding industry evolution towards greater point-to-point travel, but also adds a third dimension—speed—to the capacity/range product space.
Our analysis of this sequence of competitive interaction is, as mentioned above, in
the spirit of Porter and Spence’s [1982] classic study of corn wet milling. Specifically, we attempt to assess the financial implications of various strategic options considered by Airbus and Boeing and to establish whether non-cooperative profit-maximizing choices from this menu of payoffs should have been expected to lead to the outcomes actually observed. But there are also some differences that should be pointed out. We focus on a context where there are only two competitors (versus a dozen in corn wet milling), possible moves are discrete and subject to large economies of scale (avoiding the need to artificially delineate a small number of strategic options), and relatively fine-grained financial information is available. We also have more than 20 years of game-theoretic modeling in industrial organization to fall back on, and so manage to relate our empirical analysis to specific models of strategic product introduction.
15 Prada, P., “Airbus Industrie Board Gives Superjumbos Final Approval, The Wall Street Journal,
12/20/2000,online edition. 16 European Aeronautic Defence and Space Company, N.V., Reference Document 2000, pp. 39-40. 17 Rothman, A., “Airbus Chief Justifies Customer Discounts,” The Seattle Times, 3/24/01, p. E1.

7
III. Financial Modeling
To help us assess the valuation impact of various strategic actions in this sequence of competitor interactions, we built financial models of Airbus’s superjumbo development project and Boeing’s 747 franchise. We begin our reviews of these models with a projection of Airbus’s investments in and returns from the superjumbo over a 20-year horizon (plus a terminal value). The model uses inputs from Airbus as well as from equity research reports on Airbus and EADS by analysts at Lehman Brothers (LB), CS First Boston (CSFB), Dresdner Kleinwort Benson (DKB), and The Airline Monitor (TAM), an industry consulting and data tracking service.
Before getting into the details of the model, which appear in Appendix 1, two
limitations are worth noting. First, this investment is incredibly complex and we have, by necessity, vastly simplified inputs to create a more tractable model. Nevertheless, we believe we have captured the essence of the investment and have results that are both reasonable and approximately correct. In fact, when we calibrate our model against the significantly more complex models used by the equity analysts mentioned above, we get similar results. Second, many of the inputs are informed estimates because Airbus has released few details other than expected investment costs. Critical details surrounding pricing, volume, and funding remain shrouded in secrecy. For example, The Economist noted, “The terms of the British government aid are suspiciously secret . . .(which) may indicate the rules have been stretched.”18
The discussion here focuses on the key assumptions of the model and the
principal results (additional discussion of key inputs and some omitted factors can be found in Appendix 1). The most critical assumption is that we treat the investment on a standalone basis financed with 100% equity. Whereas Airbus’ investment is clearly equity, it is less clear how to treat the risk sharing capital and government launch aid. Arguably, these forms of capital more closely resemble cumulative preferred stock than debt because repayment occurs through a per plane fee: if Airbus does not sell any planes, it does not owe any money back.19 With this assumption, it is appropriate to discount the cash flows at an un-levered cost of capital (the asset cost of capital, described below). If one were to view the risk sharing capital or launch aid contributions as debt, then it would be necessary to account for the value derived from interest tax shields using either a levered cost of capital such as the weighted average cost of capital (WACC) or an alternative valuation method such as the adjusted present value (APV, see Myers, 1974). This assumption also means that our operating margins must be before repayment of capital contributions. A second important assumption is that we estimate project value as of year-end 2000, the date at which Airbus’ supervisory board made the “go/no go” decision, and have ignored all expenditures prior to that date. By its own account, Airbus has spent $700 million on the plane million by December 2000 (Airbus Briefing, 2000). Finally, we calculate the value accruing from years 1 to 20 (2001 to 2020) and use a terminal value to capture cash flows from years 21 to infinity. 18 “Airbus bets the Company,” The Economist, 3/18/00, p. 67. 19 Estimates of the per plane fee range from $11 to $18 million from DKB (2000, p. 25) to $7.5 million
from LB (1999, p. 24).
8
In the base case, which is reproduced in Tables 1 and 2, we assume Airbus will
sell 50 planes per year in steady state after an initial ramp-up period for a total of 701 planes by 2020. This number is slightly less than its stated goal of capturing half the projected market for superjumbos (1/2 * 1,550 planes = 775 planes). By way of comparison, the analysts are predicting that Airbus will sell from 515 planes (The Airline Monitor, Jan/Feb 2000, p.13) to 665 planes (LB, pp. 22-23) in their base case scenarios.20 It is interesting to note that none of these estimates approaches the level in our base case, never mind Airbus’ stated objective. More interestingly, Airbus’ assumption exceeds the average number of 747’s Boeing has sold over the past 30 years (35.2 planes per year).
We also assume the realized price in 2008 will be $225 million, which will
produce an operating margin of 15%. Note that analysts’ reports from Lehman Brothers (1999, p. 9) and DKB (2000, p. 30) assume average margins of 14% and 19%, respectively, over the next 20 years. Also, analysts tend to assume that Boeing, a monopolist with more than 1,000 planes of cumulative production, has operating margins of 15% to 20% on its jumbo the 747.21
Tables 1 and 2 about here Using a discount rate of 11.0%, these inputs imply an NPV of $348 million.22 Of
this amount, investment outflows have an NPV of negative $5.69B, operating cash inflows through 2020 have an NPV of $4.23B, and the terminal value has an NPV of $1.81B assuming 2% growth. Without the terminal value for sales after 2020, the investment has a negative NPV of $1.46B. Table 1 also presents sensitivity analyses along several dimensions: operating margins, discount rate, tax rate, inflation rate, unit sales, investment expenditure, realized price, and sales ramp-up. Reducing the operating margin from 15% to 10% reduces the base case NPV by $2.0B, and to 5% by another $2.0B. Reducing the steady state number of planes sold from 50 to 30 reduces the NPV by $1.8B. Increasing the R&D investment cost from $9.7B to $11.7B reduces the NPV by $1.0B. Finally, delaying the initial sales by two years reduces the NPV by $1.0B.
The same model can be used to sharpen one’s sense of how duopolists in the VLA
market would fare. Assuming both Airbus and Boeing spend the requisite $12 billion to develop a superjumbo, and that competition in the VLA segment drives margins down to
20 Our model assumes that Airbus will sell 201 planes in the first 10 years. According to the analysts,
Airbus will sell 130 (DKB, 2000, p. 27) to 184 (LB, 1999, pp. 22-23) planes in the first 10 years in the base case scenarios. Thus, we are assuming a faster ramp-up in sales though we analyze the sensitivity to this assumption in Table 1.
21 Lehman Brothers (12/6/99, p. 16) assumes Boeing earns an operating margin of 15% on large aircraft. DKB assumes the operating margin is 15-20% (5/8/00, p. 6). Most analysts believe that both Airbus and Boeing make virtually all their profits from their widebody jets.
22 By way of comparison, Lehman Brothers (12/6/99, p. 20) uses a WACC of 13.4% in its analysis, which implies an even higher asset cost of capital. In more recent analysis, CSFB (3/14/01, p. 236) uses a WACC of 9.1% for EADS.

9
10%, each competitor would have a negative NPV unless they sold more than 70 planes per year. In other words, each competitor would have to sell 40% more planes than Airbus is predicting it can sell as a monopolist in the VLA segment just to break even! And if competition drove operating margins down to 5%, each would have to sell more than 140 planes per year—clearly an infeasible number. Sales of a more reasonable number of planes—30 to 50 per year—would result in massive losses for both firms, confirming the conclusions reached by the firms back in the early 1990s when they decided to collaborate. So financial modeling of the superjumbo suggests that while there may be room in the market for one new product of this sort, there certainly is not room for two entirely new products.
Given that at most one superjumbo was going to be launched, it is natural to ask
why Airbus, not Boeing, decided to launch a superjumbo plane. In other words, why didn’t Boeing preempt Airbus into the new segment? Perhaps the most obvious answer is that Airbus received a project-specific subsidy to build the superjumbo whereas Boeing did not. Given that the estimated NPVs for the superjumbo range from the very negative to the slightly positive, the argument that the present value of the subsidy component of the launch aid of $2.5 billion was decisive in Airbus’s decision to proceed cannot be dismissed outright. But if Airbus needed a subsidy to build the superjumbo, that does not mean that an unsubsidized project was not viable for Boeing. To be more explicit, unsubsidized non-viability for Airbus does not imply unsubsidized non-viability for Boeing because the value of exclusion to the incumbent is more than the value of entry to the entrant. The asymmetry arises from the anticipation that entry and subsequent price competition will reduce the incumbent’s profits.
One can gain a sense of whether this theoretical effect is empirically significant
through some more pro forma financial modeling, this time of Boeing’s revenue and income streams from its jumbo airplane. Assume that Boeing sells 38 jumbos (747-400 planes) per year in each of the next 15 years. These assumptions are based on the fact that Boeing sold an average of 38 planes per year from 1995 to 1999, and that another 15 years of sales will give this version of the plane a life span that is slightly longer than the life span of the previous version, the 747-1/300. Now assume a realized price of $165 million per plane (rising at 2% per year for inflation); an operating margin of 20%; and a tax rate of 34%. Using a discount rate of 9.0% (Boeing’s calculated WACC), the present value of the annuity stream is approximately $7.5 billion. This sum represents 12.7% of Boeing’s total equity market capitalization at year-end 2000. Triangulating on the validity of this simple financial model, each 747 sold adds approximately 2.5 cents to Boeing’s earnings per share, which is in line with what analysts assume in their reports.23
Now, if Airbus introduces a superjumbo, ending Boeing’s monopoly position in
the VLA segment, Boeing’s profit margin on the 747 could fall from 20% to 10% or less, which is more typical for large airplanes facing direct competition.24 According to our
23 Holmes, S., “Boeing turnaround shows up in results,” The Seattle Times, 10/15/99, p. E1. Robinson, P.
Boeing orders could Boost Earnings,” Seattle Post-Intelligencer, 8/5/99, p. C1. 24 In recent years, Airbus has earned operating margins of 3.9% to 8.5% and is projected to earn margins of
4.9% to 8.5% through 2005, according to CS First Boston (reports on EADS, 3/14/01). Boeing, on the
10
annuity model, this reduction in margin translates into a loss of $3.8 billion in present value or a 6% drop in Boeing’s total market value—the net value is $3.7 billion. Clearly, the anticipation of entry and subsequent price competition has large effects on the value of the 747 product—larger, specifically, than the present value of any subsidy inherent in the launch aid.
The specific magnitude of the gains to Boeing from preemption in such a context
depends, of course, on assumptions about the margins that prevail if it manages to monopolize both the jumbo and superjumbo niches. Assuming (somewhat liberally) that Boeing achieves operating margins on its superjumbo at Airbus’ targeted 15% level, that margins on its jumbo remain at 20%, and that volumes are unaffected at 50 superjumbos and 38 jumbos per year over the time periods specified above, then the present value of the operating profit stream to Boeing from monopolies in both the jumbo and superjumbo markets is $13.5 billion (= $7.5 billion from the jumbo and $6.0 billion from the superjumbo). The present value of the development and launch costs is $5.7 billion, which implies a net payoff of $7.8 billion from launching a superjumbo and monopolizing that niche. This sum substantially exceeds the $3.7 billion net payoff that Boeing can expect by conceding the superjumbo niche to Airbus and having to lower prices on the jumbo. And if superjumbo demand falls to the low level of 30 planes per year, then—under the assumption that that does not, by itself, affect jumbo prices—Boeing stands to make $5.4 billion from occupying and monopolizing the superjumbo niche versus $3.7 billion from conceding it to Airbus. Clearly, there is substantial room for Boeing to experience lower volumes than built into the base case—perhaps as a result of the high margins assumed—and yet still find it profitable to preempt Airbus. The more than $3 billion in market value at stake on the 747 drives a large wedge between the two competitors’ payoffs from an investment in the superjumbo that effectively excludes the other.
Given the lack of equivalently detailed financial information, it is impossible to
perform analogous calculations for the intermediate products or “stretch jumbos” that Boeing announced and then cancelled. But the basic story should be clear: Boeing failed to preempt Airbus despite apparently large incentives to block its entry into the superjumbo segment. This outcome might seem to be inconsistent with profit-maximizing behavior. Game theory, or the explicit consideration of strategic interactions, is required to understand it.
IV. Models of Strategic Product Introduction
The broad game-theoretic insight that motivates our theoretical analysis is that the desire to protect a stream of quasi-rents (in Boeing’s case, on its jumbo 747) may make preemption profitable, but is not sufficient, by itself, to ensure preemption will occur. Preemption must also be credible. We make these points concrete in the context of the standard model of spatial competition in a market consisting of a line segment of unit
other hand, earns an operating margin of 8-10% in a typical year in its commercial airplane division (Boeing Annual Reports). Boeing’s higher margin is, in part, due to the high margins on its jumbo.

11
length and a uniform distribution of customers along this interval. We think of customers—airlines—as being spatially dispersed in terms of their product preferences: in the context of very large aircraft, this dispersion is best thought of as differences in preferred capacities.25 The same basic set-up could be used, of course, to analyze competition when customers are dispersed in geographic space.
Let the net benefits of a customer located at x from buying a product located at s
and priced at p be given by u – p – t(s-x)2. (1) Note, in particular, the assumption that “transportation costs,” which can be
thought of the cost of imperfect matches between product characteristics and customer preferences, are quadratic in distance.26 If the net benefit in (1) is negative, then customers at this location do not buy the product; if the net benefit is greater than or equal to zero, then each such customer purchases one unit of the product or, in the event the market contains more than one product, one unit of the product that maximizes net benefits.
Initially, there is only one product in the market—think of this as Boeing’s jumbo.
It is located at 0 and produced by an incumbent firm, firm I. Assuming marginal costs of c, u < c + 3t ensures that the market will be uncovered, i.e., some customers will fail to purchase the jumbo because it is too small for their needs. In such a situation, firm I’s optimal price for its product will be given by (2u+c)/3.
We successively extend this one (product) location model to two product
locations (with the second location corresponding to the superjumbo) and then to three (with the third location corresponding to the stretch jumbo). These two extensions help address our two key questions: why did Airbus, not Boeing, launch the superjumbo, and why did Boeing’s “stretch jumbo” fail to deter Airbus from developing the superjumbo? IV.A. Two Product Locations
Assume that a second product, the superjumbo (Airbus’ A380), becomes available and is located at 1. If it is offered by a second firm, the potential entrant (firm E, or Airbus), and has equivalent marginal costs of c, then prices at the Bertrand-Nash equilibrium are given by min(u, c + t), and the market will be completely covered if u > c + 1.25 t (see Tirole [1988], chapter 7). The coverage condition seems to characterize the case being considered given the overlapping appeal of the jumbo and the superjumbo to some customers. For example, Singapore Airlines, one of Boeing’s largest 747 25 While product comparisons in this industry often focus on two distinct major characteristics—capacity
and range—the two tend are highly collinear. As seen in Figure 1, capacity and range are significantly, positively related. Also, range is arguably becoming less of a factor as the proposed large aircraft come closer to being able to fly half-way around the world nonstop.
26 Linear transportation costs tend to yield similar results, but are more prone to discontinuities in payoff functions and the consequent problems with the existence of equilibria in pure pricing strategies.
12
customers, was one of the early “launch” customers for the A380. Yet in the absence of larger offerings, Singapore probably would have purchased more 747s. In addition, without some overlap, there would be no demand-side interactions between the two products, and no difference between the incumbent and the entrant with regard to the incentives to launch new products. As a result, we assume that these two (or more) products cover the market.
Assuming that the market is covered, industry operating profits are no longer
invariant to whether firm I or firm E introduces the new product at location 1.27 If firm I introduces the new product, prices will be given by u - .25t which, if the inequality in the previous paragraph holds, is greater than c + t, the price level if firm E introduces the new product. This is the familiar result that monopoly is more efficient at generating profits than duopoly. An “efficiency effect” of this sort is what makes preemption by the incumbent profitable.
But even if preemption is profitable for the incumbent, it may not be feasible.
Much of the game-theoretic literature on incumbent-entrant interactions in industrial organization (IO) consists of attempts to construct models of various exclusionary mechanisms that can make preemption effective: physical preemption, property rights, control of standards, privileged relationships/legal status, contractual commitments, exit costs, increasing returns to scale (including economies of scale, scope and learning), reputation for toughness, strategic information transmission/asymmetric information, et cetera (e.g., Tirole [1988]). In the context of strategic product innovation, the mechanisms that have been emphasized the most are patents/other intellectual property rights and the increasing returns to scale created by the fixed costs of new product development.28 But in the context of very large aircraft, patent-based preemption does not seem to have been possible. And in the absence of such technology-based exclusion mechanisms, the preemptive incurral of development costs is of limited effectiveness in allowing the incumbent to lock the entrant out of the market. In other words, probably the most important insight from game-theoretic IO modeling in the present context is the negative one that large product development and introduction costs may well be an insufficient basis for successful preemption.
The relevant argument involves more careful consideration of competitors’
strategy spaces and was originally developed in the context of a circular model of product differentiation by Judd (1985). In the present, linear context, reconsider the two firms’ new product decisions. If both firms somehow introduced a new product at location 1, prices there would fall to the common marginal cost of c, and no operating profits would be earned on the new product by either firm. This would also put pressure on firm I’s price at location 0, which in equilibrium would fall to c + 0.5t, ensuring it total operating profits of t/8. In the absence of exit costs, firm I could improve its payoffs by
27 Note that coverage of the market with interfirm competition is necessary but not sufficient to guarantee
coverage without interfirm competition. This means that in comparing the two cases, one must be careful to recognize variations in the parameterization of various regimes across them. But it does not affect the basic logic of the argument developed in this subsection.
28 Consult, for instance, Gilbert and Newbery (1982) and (1984); and Reinganum (1983) and (1985).
13
withdrawing its product from location 1 and letting firm E monopolize it. In doing so, the incumbent could raise its price at location 0 to c + t (firm E’s equilibrium price at location 1 would also now be c + t), earning operating profits of t/2. By implication, in the absence of exit costs, if both firms do end up entering location 1, it is a dominant strategy for firm I to withdraw from location 1 and, since it is not credible for firm I to threaten to stay in the market, for firm E to stay. Anticipating this outcome, firm I rationally saves itself the fixed costs of product innovation—even if it is able to move first—and refrains from entering location 1 even if innovation is viable for firm E (i.e., in a standalone sense). It is worth emphasizing that the fixed costs of innovation/entry do not affect this prediction: exit costs are necessary to allow firm I to effectively “stake out” location 1 as the first-mover (Judd, 1985).
It is in this sense that game theory—or more specifically, the relatively subtle
constraint that preemption be credible—helps rationalize why Airbus, not Boeing, introduced the superjumbo. It is time to turn to the second key question about their interactions: why Boeing also considered but failed in its attempts to proceed with a “stretch jumbo” intermediate to its jumbo and Airbus’s planned superjumbo in terms of capacity. The analysis will, once again, focus on using expected operating profits to help pin down product offerings in the long run without imposing a specific structure on the fixed costs of innovation/entry. IV.B. Three Product Locations
Consider a model that allows for three product locations: the incumbent product at 0 (the jumbo), the entrant’s product at 1 (the superjumbo), and a possible intermediate product (the stretch jumbo) introduced by the incumbent at location r [Є(0,1)]. The limit point r = 0 corresponds to the product market outcome if the incumbent decides not to introduce a new product at all (i.e., firm I offers a product at 0 and firm E offers a product at 1), while the limit point r = 1 corresponds to the outcome, already determined to be dominated by r = 0 from the incumbent’s perspective, if the incumbent offers products at both 0 and 1 and the entrant offers a product at 1. Thus, increases in r can be thought of as decreasing substitutability within firm I’s product line while increasing it within firm E’s product line.
Relatively general results for games with this structure indicate that increasing r has a positive direct effect on firm I’s profitability, but that it is always offset by a negative strategic effect associated with the increasingly tough price competition with firm E that ensues as r increases (Cabral and Villas-Boas, 2001). Unfortunately, it is impossible to make general predictions about the relative size of the two effects.29 But 29 Such predictions are possible for symmetric cases, subject to several auxiliary qualifications elaborated
by Cabral and Villas-Boas (2001). Thus, extend the model considered in the previous subsection to let both firm I and firm E introduced (symmetrically situated) intermediate products. Then, known results would guarantee that the negative strategic effects outweighed the positive direct effects in this four-product case. The discussion in this subsection focuses, however, on the asymmetric case of three products.
14
specific parameterizations, such as the model with quadratic costs and uniform distribution of demand developed in the last subsection, do indicate that it is possible for the negative strategic effect to dominate the positive direct effect for all positive choices of r. To rework that model in the present context, it is useful to begin by specifying the locations, dependent on prices, at which customers are indifferent between adjacent products. Let x denote the indifference point between the product located at 0 and priced at p0 and the intermediate product located at r and priced at pr, and y the indifference point between that intermediate product and the product located at 1 and priced at p1. See Figure 2.
Figure 2 about here By definition, p0 + tx2 = pr + t(r-x)2,
⇔ tr2pp
2rx 0r −
+= (2)
and
pr + t(y-r)2 = p1 + t(1-y)2,
⇔ r)-2t(1
p-p2
r1y r1++= (3)
Firm I’s operating profits, conditional on the choice of intermediate location r, are
given by ΠI = (p0-c)x + (pr-c)(y-x) (4)
= ( ) ( )
−+
+2tr
p-p2r-y c-p
2trp-p
2r c-p 0r
r0r
0
Differentiating with respect to p0, the first-order condition for an optimum is given by
2
tr p p2
r0 += (5)
which implies in turn that
15
4rx = (6)
Given equations (3)-(6), we can rewrite firm I’s operating profits as
ΠI = ( )8
trr)-2t(1
p-p2
r1 c-p3
r1r +
++ (7)
Differentiating (7) with respect to pr and setting the result equal to zero implies that
2r)r)(1t(1cpp 1
r+−++= (8)
Similarly, one can differentiate firm E’s operating profits,
ΠE = (p1-c)(1-y), (9)
with respect to p1 and, setting the result to zero, obtain
p1 = 2
r)- t(1 c p 2r ++ (10)
Given the first-order conditions for equilibrium in (8) and (10),
pr = 3
r)r)(3- t(1 c ++ (11)
and
p1 = 3
r)r)(3-t(1 c −+ (12)
Based on (11) and (12), the indifference points x and y and the two firms’ operating profits could also be written out in closed form. But to gain an intuitive sense of the implications, it is better to simply calculate price-cost margins, indifference points and profits across the domain of possible locations r Є(0,1). The results appear in Table 3.
Table 3 about here
Several patterns evident in Table 3 are worth stressing. First, normalized by t (a measure of the scope for product differentiation/heterogeneity that enters the firms’ profit functions linearly), price-cost margins decline monotonically on all three products as r
16
increases from 0 to 1.0. The price cost margin decreases from 1.0 to 0.5 in the case of the product located at 0, and from 1.0 to 0 for the other two products (particularly rapidly in the case of the entrant’s product, located at 1). Second, because the entrant’s market share declines, its normalized operating profit (ΠE/t) decreases as well: from 0.5 at the limit point of r = 0 to 0 at the limit point of r = 1. Third, while the incumbent’s market share increases with r, this increase is insufficient to offset the lower price realizations as firm E reacts by cutting prices aggressively. As a result, ΠI/t is also inversely related to r: it decreases from 0.5 at the limit point of r = 0 to 0.125 at the limit point of r = 1 (in which all the operating profit is generated by the product located at 0). In other words, the strategic effect dominates the direct effect for all values of r.
The last point implies, by analogy with the argument employed above in the two-
product case, that the incumbent’s launch of an intermediate product (the stretch jumbo) fails exactly the same credibility test for entry-deterrence as did its option of launching the truly new product, located at 1 (the superjumbo). The incumbent’s equilibrium operating profits are higher without the intermediate product than with it. As a result, it will prefer to withdraw the product, even after it has been introduced unless, of course, there are significant exit costs.
This is a striking conclusion not because of the generality of this result—which
has been established only in the context of a specific demand structure—but because it demonstrates by example the unreliability of a prediction that would probably command broad assent: that large efficiency advantages for the intermediate product over the truly new product (e.g., significantly lower development costs and/or quicker speed to market) make the former an effective vehicle for an incumbent to deter entry based on the latter if the latter’s economics are sufficiently marginal to start with. Boeing itself appears to have placed some emphasis on this advantage of the stretch jumbo over the superjumbo, at least in its public communications. According to one press report, “Boeing is banking on the fact that it should cost them far less to modify the company’s existing 747-400 model than it will cost Airbus to build a completely new plane.”30
What the theoretical model in this subsection suggests, by example, is that maybe
Boeing should not have banked quite as much as it is asserted to have done on the efficiency advantages of the stretch jumbo. More broadly, purely efficiency-based predictions of which product will “win out” over the other are not always adequate. They need to be supplemented with some attention to strategic (in the sense of self-consciously interactive) considerations.
V. Testing for Strategic Effects
The strategic models of product introduction in the previous section rationalize both why Airbus, not Boeing, launched the superjumbo, and why Boeing also failed to
30 Mike Maharry, “Boeing Says It Has Been Offering New 747 Versions for Months,” The News Tribune
(Tacoma, Washington), June 24, 2000, p. D1.
17
proceed with the “stretch jumbo.” But with a very limited number of key events, it is also easy to imagine non-strategic rationalizations (e.g., purely efficiency-based reasoning or unobservable and, therefore, effectively random effects). How then, can one test for whether the strategic effects highlighted by the models actually were important to the competitive interactions in the very large aircraft segment?
Caves (1994, p. 13) proposes one way forward:
“To test not the central prediction but to deploy the available data to measure key parameters and document various assumptions, components, and corollaries of the model. The null hypothesis … can be rejected not in one decisive test but by the cumulative weight of a body of evidence.” This is the approach we adopt. Note that we have already made a start in this
direction, particularly in the section on financial modeling that documented the existence of a potentially large stream of quasi-rents for Boeing from its jumbo and the threat to it posed by Airbus’ superjumbo. This section analyzes additional evidence involving capital market reactions to product-related announcements, pricing patterns, public demand forecasts and elements of internal organization. This mass of quantitative and qualitative evidence generally favors the hypothesis of intended but incredible—and therefore infeasible—preemption by Boeing.
Capital Market Reactions
The key prediction from the three location model developed in the previous section is that if the incumbent (Boeing) does attempt to introduce an intermediate product to counter an entry threat (Airbus’s superjumbo), announcement of that intent will decrease the incumbent’s market valuation to the extent that it is “news,” is taken seriously (which depends on the irreversibility or commitment-intensity surrounding the announcement), and is expected to lead to losses.31 Conversely, retraction of the intent to pursue an investment strategy that does not maximize value should, under similar auxiliary conditions, increase the incumbent’s market valuation.
It is worth pointing out that these predicted capital market reactions are the opposite of the positive reaction—a 2-day abnormal return of 5-6%—that Boeing experienced when it originally announced its 747 back in 1966 as well as larger sample evidence indicating positive capital market reactions, on average, to corporate announcements about new investments. For example, both McConnell and Muscarella (1985) and Chung, Wright, and Charoenwong (1998) find that firms experience significant, positive abnormal stock returns averaging 1.3 % when they announce increases in capital expenditures. Similarly, Chan, Martin, and Kensinger (1990) find that firms experienced significant, positive 31 Note that the presumptions underlying such an inference are staples of financial “event-study”
methodology (MacKinlay, 1997).
18
abnormal returns averaging 1.4% when they announce new research and development (R&D) expenditures. Because development of a new aircraft involves both R&D and capital expenditures, these broader patterns are worth bearing in mind as we look at capital market reactions to Boeing’s announced introductions and cancellations of its intermediate products.
Boeing did not formally announce that it was planning an intermediate product
after its collaboration with Airbus on very large aircraft ended in July 1995; instead, news of Boeing’s intentions appears to have trickled out over time. Nevertheless, it is possible to identify four discrete events since that time in which a plane intermediate to the jumbo and the superjumbo was prominently involved: see Table 4.32 All of the events are signed as predicted above: the capital market reaction was negative when Boeing announced that the intermediate product would cost more than expected, was positive when Boeing first canceled the intermediate product, was negative when Boeing restarted that program, and was positive when Boeing canceled it for the second time.33 In addition, the reactions to the first two events are both statistically significant.
Table 4 about here
Taken together, these events and the reactions to them indicate that the capital markets considered the intermediate products investigated by Boeing likely to destroy shareholder value if pursued seriously. These findings are consistent with and, therefore, bolster the three location model developed in the previous section and the conclusions from it.
The Sonic Cruiser
Boeing’s so called sonic cruiser is of interest not only because its announcement coincided with the second cancellation of the stretch jumbo, but also because it has served as the basis for an entirely different interpretation of competitive interactions in very large aircraft. Gordon Bethune, who oversaw the development of the 737 and 757 planes at Boeing before becoming the CEO of Continental Airlines, described the sequence of moves as an explicit attempt by Boeing to “sandbag” Airbus:
32 There are also many seemingly less important, predicted, and even contaminated events that generate
insignificant returns. For example, Boeing’s most recent twist as of this writing—the announcement in mid-April that it would develop a longer-range alternative to the 747 with a handful of extra seats—elicited an insignificant -0.09% return over the standard two-day “event horizon.”
33 The second cancellation was coupled with the announcement of a new “sonic cruiser,” contaminating the capital market reaction observed. How to make additional headway is discussed in the next subsection, in the broader context of the sonic cruiser.
19
“They waited until the [A380] project gets launched and the other guys are committed to the project, and then they say: we’re going fast, not big…[Airbus] can’t catch up. They don’t have enough resources since so much is committed to the big plane.”34 Under this interpretation, far from being forced by credibility constraints to cede
the superjumbo market, Boeing waited for and even encouraged Airbus to lock itself into an expensive development program. And once Airbus had committed to develop the superjumbo, Boeing announced a change in the game in large aircraft, from a focus on size to a focus on speed (and range), knowing that Airbus could not imitate.
To put the sandbagging interpretation in perspective, note that if it were correct,
then event #4 listed in Table 4 should have resulted in a negative return for Airbus’ principal parent, EADS (European Aeronautic Defence and Space Company), as well as a positive return for Boeing.35 Interestingly, EADS experienced a positive, albeit insignificant 2-day abnormal return of 4.68% around event #4 (producing an abnormal change in market value of $640 million).36 By taking a positive view of the net effects of Boeing’s simultaneous cancellation of the intermediate product and announcement of a (possible) sonic cruiser on Airbus, investors apparently placed more emphasis on the benefit to Airbus of the cancellation and less on the threat from the sonic cruiser. This capital market reaction casts doubt on the “sandbagging” interpretation. So, too, do comments about event #4 from industry analysts. According to one analyst, “This news is extremely important for Airbus and EADS as it significantly increases the probability that the A380 will be a commercial success.”37
Of course, the sonic cruiser could pay off for Boeing without necessarily hurting
Airbus. Addressing this possibility requires assessing the basic economics of the sonic cruiser which are still murky, not least because the development program is a year or two away from being initiated even if Boeing does decide to proceed with the plane.38 Positive factors include time savings valued not only by passengers but by airlines as enablers of more trips/plane and an extended range: 9,000 to 11,000 nautical miles versus 8,100 for the A380. On the other hand, there are significant issues with the sonic
34 Matthew Brelis, “Faster vs. Bigger,” The Boston Globe, May 6, 2001, p. C7 35 The impact of the earlier events in Table 4 on Airbus/EADS cannot be examined analogously because
Airbus an untraded consortium of European aerospace companies whose revenues and market values were dominated by their other businesses. EADS grouped together the Airbus-related interests of three of the original parents into a 80% stake in Airbus Integrated Company; the fourth, British Aerospace, separately held the remaining 20%.
36 Based off data from the Paris stock exchange using the CAC40 as the market index and a 160-day estimation window. Because of time differences, event day 0 is 3/30/01. The number of shares outstanding is 807.2 million as of March 2001. Note the results change slightly depending on the stock exchange (Paris, Madrid, or Frankfurt) and the length of the estimation window (80 to 160 days).
37 “EADS Takes Off as Boeing Scraps Superjumbo Plans,” Reuters News, 3/30/01. 38 Joseph Campbell, an aerospace analyst at Lehman Brothers, commented, “We wouldn’t think that the
new “Sonic Cruiser” would enter service earlier than 2008 timeframe. We wouldn’t normally expect quite this much planned publicity on a plane whose launch is certainly 3-4 years into the future, and whose entry into service is 8 to 10 years out.” (Lehman Brothers, Equity Research report, 3/30/01, p. 2.)
20
cruiser as well. Its total development and launch costs are projected to be $8 to $10 billion, smaller than the amount Airbus is budgeting for the A380, but still large enough to require a substantial profit stream to be justifiable.39 Furthermore, the sonic cruiser is perceived to require more new technologies than the A380 and, as a result of the implied “unknown unknowns,” to be prone to proportionately larger overruns. Other disadvantages include high operating costs associated with traveling at speeds just below the sound barrier and a probable need to focus on high-end customers such as business travelers (which implies aggregation challenges). The Concorde, capable of flying twice as fast as the proposed new plane when it is allowed to break the sound barrier, exemplifies in extreme form how limiting these disadvantages can be. Also, if the sonic cruiser is launched, it will cannibalize demand for some of Boeing’s most profitable planes as well as Airbus’s.
A final problem for the sonic cruiser is highlighted by stretching out the customer
space in the theoretical model along two dimensions rather than just one to allow for vertical differentiation based on differences in passengers’ incomes as well as horizontal differentiation among planes based on capacity differences. In this expanded context, the sonic cruiser can be thought of as representing a vertically differentiated alternative to flying jumbos and superjumbos (among other aircraft) on certain routes. All passengers prefer the vertically differentiated alternative in gross benefit terms because it is presumably attractive to reach a destination faster; however, except at corner solutions, higher-income passengers are willing to pay more for the extra speed but lower-income passengers are not. This way of setting up the interactions among products suggests that as horizontal competition intensifies in conventional very large aircraft, any pricing pressure manifest there will also reduce the payoffs to a vertically differentiated product such as the sonic cruiser. Actual pricing patterns in very large aircraft are looked at in the next section.
For all these reasons, and the fact that Boeing has yet to commit to the sonic
cruiser, it may plausibly (still) be regarded as a feint or a phantom plane that simply gave Boeing something positive to announce as it was forced, by credibility constraints, to withdraw from the contest to develop new very large aircraft.
Pricing Patterns
Pricing patterns in very large aircraft are of additional interest because pricing pressures drive the theoretical predictions that the entrant will introduce the new product (the superjumbo, in this case) and that intermediate products will be unprofitable for the incumbent. If one did not actually observe pricing pressures in the VLA segment as a result of Airbus’s commitment to enter with a superjumbo and Boeing’s efforts to enter with intermediate products, the credibility of the theoretical model in that context would suffer. 39 Morgan Stanley Dean Witter Equity Research Report, “Boeing Company,” March 20, 2001, p. 2.
21
It is useful to begin this examination of pricing by noting several basic facts about
it. First, both Boeing and Airbus post list prices for their entire product lines. Boeing, for example, shows a price range for each aircraft on its corporate web site, where the range depends on the specific configuration.40 Second, both companies announce nominal changes to their price lists annually. In Boeing’s case, the price changes are tied to an explicit formula that places a 65% weight on labor costs and a 35% weight on changes in the Producer Price Index (the PPI). Third, planes sell at large discounts to list prices, ranging from 18 –40% for Boeing and 16-27% for Airbus according to recent data from The Airline Monitor.41 Finally, although the manufacturers and their customers disclose realized prices only on an exceptional basis, industry analysts and trade journals such as The Airline Monitor ascertain reasonably accurate information by reverse engineering published financial statements and plane delivery records. Note that the ability to reverse engineer realized prices improves over time as more data become available.42
With that background, several indicators of pricing pressure in the very large
aircraft segment can be cited. Starting with Airbus’ A380 which has a list price of $218-$240 million in 2000. Given the 17-21% discount typical for the largest Airbus planes, the realized prices should be around $176 million assuming a list price of $220 million and a 20% discount. According to Airbus’s CFO, it expects to make pre-tax margins of 20% over the next 20 years.43 On a realized price of $176 million, this implies $35 million of operating profit on top of operating costs of approximately $140 million. As it turns out, however, the early sales have occurred at prices as low as $135-140 million or, in other words, essentially at “steady state” cost.44 While some of the early launch customers like Qantas and Virgin reportedly paid approximately $150 million per plane,45 Singapore Airlines reportedly paid only $140 million when it bought 10 aircraft in September 2000. Furthermore, Boeing was also reported to have cut the asking price on its intermediate product to $140 million in its unsuccessful attempt to win the Singapore Airlines order (off a list price of $185 million).46
One way of putting these prices in perspective is to note that they are on the low
end even for the smaller 747, the production of which must be well down its learning curve. In a rare occurrence, Thai Airways disclosed in January 2001 that it paid $147 million for new 747-400s, a 20% discount off list price.47 The magnitude of this 40 The prices appear on the Boeing web site at http://www.boeing.com/commercial/prices/index.html. 41 The Airline Monitor, (Jan/Feb 2001, Table 6). 42 In the case of The Airline Monitor, it compares unit sales and estimated realized prices against published
financial statements. Over time, it has refined its pricing model to the point where it has a high degree of confidence in its ability to estimate average realized prices.
43 Business Week, 3/5/01, p. 52. 44 Business Week, 3/5/01, p. 52; Lehman Brothers 10/2/00, p. 3. 45 M. Flores, “Airbus Set to Launch its Monster Jet,” The Seattle Times, 12/19/00, p. D1. 46 The Lehman Brothers Equity Research Report, 10/2/00, p. 3, suggests a price of $135-$140 million;
“Boeing Loses Singapore Airlines Jet Order to European Rival Airbus Industrie,” The Seattle Times, 9/30/00, suggests $142 million.
47 Wallace, J., “Thais get a good deal on Boeing 747; competition with Airbus spurs cuts, Seattle Post-Intelligencer, 1/12/01, p. D1.
22
discount, particularly for the limited number of planes on order, surprised industry analysts, prompting one to observe, “It’s not the kind of number we have in our models. We are thinking that a 747-400 gets sold for more than that.”48
In fact, since 1996, when Airbus’s independent effort to develop a superjumbo
started to take definite shape, data from The Airline Monitor indicate a real annual rate of decline of 2% through 2000 in Boeing’s average realized price on the 747. This is a departure from previous pricing dynamics: between 1978 (year 10 of deliveries of the 747) and 1984, realized prices increased at an estimated real annual rate of 4%, and between 1984 and 1996 at 0.5% (helped by a model changeover to the 747-400, which started to be delivered in 1989).49 By way of comparison, application of an 80% learning curve to 747 deliveries indicates that production costs have declined at a real annual rate of 1-2%, perhaps exceeding the higher end of the range after the changeover to the 747-400 and verging on the lower end more recently.50 So the period since 1996 stands out in the last 20 years of the 747’s pricing history as being one of margin compression rather than margin expansion. In other words, competition seems to have been responsible already for pricing pressure in very large aircraft, although different explanations can be entertained as to “who started it.”
An additional piece of evidence that points in the same direction involves
comparing prices on VLA with the rest of Boeing and Airbus’ product lines. Figure 3 plots realized prices per seat (i.e., price divided by capacity) against product capacity, the product characteristic on which our earlier analysis focused. The data indicate a noticeable break in the positive correlation between prices per seat and capacity. This suggests, once again, significant pressure on prices in the VLA segment.
Figure 3 about here Of course, Boeing’s cancellation of the intermediate product does eliminate one
source of pricing pressure. An analyst pointed out that one way to think about the positive reaction of both companies’ stock prices to the cancellation was that Boeing was effectively announcing that it would abandon its cutthroat pricing policy and would price planes to make money, not to hold on to market share.51 But cancellation of the intermediate product does not, by itself, reverse the downward trend that seems to have characterized 747 prices since 1996.
48 Wallace, J., “Thais get a good deal on Boeing 747; competition with Airbus spurs cuts, Seattle Post-
Intelligencer, 1/12/01, p. D1. 49 Sutton, Oliver, “What’s in a price hike?” Interavia Business & Technology, 12/1/98, pp. 36-38. 50 The use of an 80% learning curve is common to and apparently even originated in the airframe sector of
the aircraft industry. See Hartley [1968]. 51 Reuters, as quoted from Yahoo!Finance News, “Boeing to shelve superjumbo,” 3/28/01.
23
Demand Forecasts
Because large aircraft take years to design and develop, require enormous up-front investment, and have useful lives of over 30 years (some people think that the 747, for example, will have a useful life of 50-plus years), Airbus and Boeing both generate long-term demand projections for their products. Airbus’s Global Market Forecast (GMF) is based on annual demand for new aircraft on each of 10,000 passenger routes linking almost 2000 airports. Its model assumes that cargo and passenger demand will track GDP growth as it has for the past 50 years and estimates, for each airline, on each route pair, the need for specific aircraft, and compares that number with the existing stock of aircraft. In contrast, Boeing’s Current Market Outlook (CMO) forecasts economic growth in 12 regions around the world and then uses these assumptions about growth to forecast traffic flows in 51 intra- and inter-regional markets.
As of 2000, Boeing and Airbus forecast relatively similar rates of growth in
aggregate air traffic: 4.8% and 4.9% respectively. Although both had decreased their growth forecasts in response to the Asian financial crisis in the late 1990s, they agreed that Asia would register the world’s highest growth rates over the next 20 years.52 They disagreed sharply, however, about demand for in the VLA segment due to their divergent view on industry evolution—Boeing towards greater fragmentation and Airbus towards greater capacity planes. Table 5 summarizes their evolving 20-year forecasts regarding the number of VLA deliveries. Its most striking feature is the fact that Airbus’ market forecasts have consistently been more than three times larger than Boeing’s forecasts. And while both companies’ forecasts fell in the late 1990s, primarily because of the Asian crisis, Airbus’ latest forecasts are down only 15% from their 1997 high, compared to nearly 30% for Boeing’s.
Table 5 about here The magnitude of the discrepancy is surprising given Boeing and Airbus’s
collaborative efforts in the early and mid 1990s, a process that must have involved detailed discussion of different market forecasting techniques. It provides a sense of some of the ambiguities inherent in coming up with long-run demand forecasts for such products. And the direction of discrepancy is interesting, too: Boeing’s forecasts are lower than Airbus’s, not the other way around.
Although Boeing’s more pessimistic forecasts may represent its best estimate of
future demand, an alternative interpretation is that they fulfill a strategic purpose. One possible purpose, more likely to have been important before Airbus committed to develop the A380, might have been to discourage entry by downplaying superjumbo demand. More recently, maintenance intertemporal consistency may have been important, along with signaling to third parties—investment analysts, investors, governments, and 52 “The Size Equation,” Airline Business, April 1999, p. 52.
24
customers, suppliers and even employees—that Boeing is acting responsibly in not launching a very large aircraft. (Symmetrically, Airbus might be expected to overstate demand to make the case that it is acting responsibly in launching.) Such signals of “taking care” tend to be most important in high-ambiguity environments.53 As a result, the possibility of strategic manipulation of forecasts—understatement by Boeing, overstatement by Airbus—merits mention, even though the statistical power with which it can be tested on its own (as opposed to in conjunction with other pieces of evidence) is limited.
Organization and Reorganization
Our rationalization of why Boeing decided not to proceed with the stretch jumbo
begs the question of why Boeing elected to announce the intermediate product in the first place. The negative capital market reaction to the initial announcement(s) suggests that investors, at least, attached a significant probability to the idea that Boeing might actually pursue a suboptimal, value-destroying path by introducing a stretch. Is such a mistake plausible in the context of the case being considered?
The game-theoretic literature on mistakes of this sort is sparse and generally seeks
to rationalize excessive entry with intended profit maximization by invoking observational and entry lags (e.g., Cabral, 1997). But to address the possibility of deliberate non-maximization, we must look internally, at Boeing’s organizational structure and resource allocation process. While mostly qualitative analysis of this sort is more common in, say, political science or sociology than it is in industrial organization, prior case studies suggest that it can be enormously valuable in industrial organization as well.54 In the present case, organizational analysis suggests that there was considerable impetus within Boeing to develop its own very large aircraft, increasing the perceived likelihood that the company might actually proceed with such a project even if it was expected to destroy shareholder value. By necessity, our reasoning in this regard can be reviewed in only highly abbreviated form.
There are a number of historical reasons why Boeing’s commercial aircraft group
might be expected, in the late 1990s, to have had some degree of discretion to influence the pursuit of strategies that emphasized investment and plane development instead of value maximization. For decades after it was founded in 1915, Boeing remained focused on military aircraft. But in 1952, it decided to wager a substantial fraction of its net worth on the introduction of the first commercial jet aircraft, the Boeing 707, at a time when Douglas, the leader in the commercial segment, and other producers continued to
53 Amar Bhide, “Taking Care: Ambiguity, Joint Action and Error Control,” Unpublished working paper,
Columbia Business School, April 22, 2001. 54 Consult, for instance, the abbreviated “competitor analyses” in Porter and Spence’s [1982] case study of
corn wet milling.
25
bet on propeller-driven planes. This “sporty” bet55 made Boeing the leader in commercial aircraft, and it followed up with large-scale and ultimately successful commitments to the 727 and the 747 in the 1960s. As a result, risk-taking and “technical bravado” became deeply engrained values at Boeing, and were even feted publicly. According to James Collins, co-author of a best-selling book on visionary companies titled Built to Last (Collins and Porras [1994]):
There’s one thing that made Boeing really great all the way along. They always understood that they were an engineering-driven company, not a financially driven company. They were always thinking in terms of “What could we build?” not “What does it make sense to build?” If they’re no longer honoring that as their central mission [with the concession of the very large aircraft segment to Airbus], then over time they’ll just become another company.”56 In the second half of the 1990s, continuation of this storied tradition seemed to
depend on the stretch jumbo program: without it, Boeing would have no new plane on the drawing board for the first time in more than fifty years. Rumors circulated at Boeing that it might shut down its group responsible for advanced designs.57 And in 1999, Airbus outsold it for the first time in terms of unit orders. In the face of these events, considerable impetus built up within the commercial aircraft group to use its sizeable and growing free cash flow to proceed with a new plane instead of ceding the VLA market to Airbus. In the face of these events, considerable impetus built up within the commercial aircraft group to use the company’s sizeable and growing free cash flow to proceed with a new plane instead of ceding the VLA market to Airbus see Figure 4.58 And Boeing’s senior management appeared to find the commercial aircraft group’s claims on corporate wealth difficult to resist because the division still represented more than 60% of Boeing’s total revenues and was a key part of company’s corporate identity.
Figure 4 about here That Boeing’s top management ultimately did manage to resist the internal
impetus to build a very large aircraft seems to reflect, in part, three macro organizational
55 John Newhouse coined this term in his book, The Sporty Game (1982), to refer to the high-risk nature of
commercial plane development. He writes, “But what really sets the commercial airplane business apart is the enormity of the risks as well as the costs that must be accepted; they create an array of obstacles to profitability, hence viability, which discourages all but the bold and committed” (p. 3).
56 Jerry Useem, “Boeing vs. Boeing,” Fortune, 10/2/00, pp. 148-160. 57 Jenkins, H.W., Jr., “Haven’t shareholders had enough chicken,” The Wall Street Journal, 4/4/01, p. A21. 58 Free cash flow for the commercial airplanes division is defined as earnings from operations less taxes at
34% (EBIAT), plus depreciation, minus capital expenditures. In its annual reports, Boeing breaks out these accounting entries on a division level, but does not allocate working capital by division. Thus, the calculation does not include changes in net working capital. Also note that the downturns in 1997 and 1998 reflected production problems following the acquisition and integration of McDonnell Douglas’s operations.
26
changes at the company in the late 1990s. First, Boeing built up its defense, space and communications businesses by acquiring Rockwell International’s aerospace businesses in 1996, McDonnell-Douglas in1997, and Hughes Space and Communications in 2000.59 These acquisitions and a newfound emphasis on commercial aircraft services helped create growth options outside the traditional realm of commercial aircraft construction. Second, aided by an inflow of top managers from McDonnell Douglas and elsewhere into what had historically been an insular, engineering-driven environment, Boeing instituted a much more detailed system of financial controls and performance measurement. A system for tracking product line profitability was reportedly put into place for the first time. To further the company’s stated goal of increasing its stock price five times in five years,60 the Board instituted a new incentive program that linked compensation with stock price appreciation, and established stock ownership guidelines for top executives.61 These changes facilitated a shift in the mode of resource allocation that placed more emphasis on efficiency and shareholder value rather than historical entitlement, engineering challenges, and a host of other non-economic criteria. And more recently, Boeing decided to relocate its corporate headquarters from Seattle to Chicago. An important reason for the move, according to Boeing’s top management, was the belief that the corporate center would remain too prone to the influence of the commercial aircraft group as long as the two headquarters remained collocated in Seattle.62
To summarize, the organizational evidence presented in this subsection helps
explain both why Boeing came close to developing the stretch jumbo and why it ultimately decided not to do so. The analysis also suggests a more internally-focused motive for why Boeing’s pre-announcement of the sonic cruiser—it may have needed a new program to engage its engineers following the cancellation of the stretch jumbo. This analysis supports the notion that traditional “no-fat” game-theoretic modeling of the interplay of incentives among competitors trying to maximize profits can often usefully be supplemented with detailed analysis of competitors’ histories, strategies and organizational structures. For additional discussion of this point, see Ghemawat ([1997], chapter 8).
VI. Conclusion
In addition to shedding light on a case that has attracted considerable public attention, this paper suggests that game theory can be useful to business strategy and that the case method can help connect the two. To begin with game theory, it provided a
59 Although the McDonnell Douglas acquisition did bring in some commercial aircraft business, it, like the
other acquisitions, was focused on other businesses. 60 Stepankowsky, P.A., “Boeing CFO: Co. Focused on Plane Delivery, New Initiatives,” Dow Jones News
Service, 3/23/00. 61 The Boeing Company, Proxy Statement, 3/11/00, pp. 29-30. 62 Jenkins, H.W., Jr., “Haven’t shareholders had enough chicken,” The Wall Street Journal, 4/4/01, p. A21.
Also, Schafer, S., “Boeing Picks Chicago for Headquarters; Firm Wanted Base Centrally Placed, Away From Units,” The Washington Post, 5/11/01, p. E3.
27
language and a set of logical tools for analyzing the competitive interactions in the market for very large aircraft. If offered, in the process, some nonobvious or counterintuitive insights such as the importance of credibility constraints and the induced possibility that the more “efficient” of two candidate new products might not win out—that presumably have some prescriptive value. And in addition to these analytical and prescriptive purposes, it also fulfilled a descriptive one: it helped explain actual patterns of product introductions (and cancellations) in very large aircraft.
Turning to the case method, its most obvious contribution in the present context
was to help generate an example of a stipulated theoretical effect—the importance of credibility constraints in spatial preemption—that has been discussed extensively, but in a bit of an empirical vacuum. The process of relating the case to a theoretical framework also suggested a particular extension of standard spatial models of strategic product introduction, from two locations to three. And finally, the case method was used to test for the importance of the strategic effects highlighted by such models in addition to exemplifying and adding to them. The tests relied on qualitative as well as quantitative evidence and drew heavily on financial and organizational as well as strategic analysis. They thereby underscored the importance of imagination in the choice of inferential methods given that many of the cases of the most interest from a strategic perspective, even the relatively data-rich ones such as the one considered in this paper, do not lend themselves to traditional large-sample analysis.
28
References Airbus Industrie - Global Market Forecast, 1995-2000 - Airbus Briefing to Financial Analysts, 10/4/00 in Toulouse, France Airline Monitor, The, - January/February 2000. Benkard, C. Lanier, 2000, A dynamic analysis of the market for wide-bodied commercial
aircraft, National Bureau of Economic Research (NBER) Working Paper 7710, May.
Benkard, C. Lanier, 2000, Learning and forgetting: The dynamics of aircraft production,
American Economic Review, 90:1034-54. Bhide, Amar, 2001, Taking Care: Ambiguity, Joint Action and Error Control,
Unpublished working paper, Columbia Business School, April 22. Boeing Company - Annual Reports, 1995 to 2000. - Current Market Outlook, 1994-2000 - Proxy Statements, 1996-1998 Cabral, L.M.B., 1997, Entry mistakes, Center for Economic Policy Research, Discussion
paper #1729, London, England, November. Cabral, L.M.B., and J.M. Villas-Boas, 2001, Multiproduct oligopoly and Bertrand
Supertraps, Stern School of Business Working Paper, New York University, January.
Caves, R.E., 1994, Game theory, industrial organization, and business strategy, Journal
of the Economics of Business, 1:11-14. Chan, S., J. Martin, and J. Kensinger, 1990, Corporate research and development
expenditures and share value, Journal of Financial Economics 26, 255-76. Chung, K.H., P. Wright, and C. Charoenwong, 1998, Investment opportunities and
market reaction to capital expenditure decisions, Journal of Banking and Finance, 22:41-60.
Collins, J.C., and J.I. Porras, 1994, Built to Last: Successful Habits of Visionary
Companies, Harper Business (New York, NY).
29
Credit Suisse First Boston, Equity Research Report: “Global Commercial Aerospace Monthly,” May 23, 2000.
Credit Suisse First Boston, Equity Research Report: “European Aeronautic Defence and
Space Company (EADS),” March 14, 2001. Dresdner, Kleinwort, Benson, Aerospace and Defence Equity Research Report: “Airbus
A3XX: The Business Case for the Double Decker,” May 8, 2000. Esty, B.C., and M. Kane, 2001, Airbus A3XX: Developing the World’s Largest
Commercial Jet, Harvard Business School Case No. 201-028 and Teaching Note Case No. 201-040.
Ghemawat, Pankaj, 1997, Games People Play: Cases and Models, The MIT Press
(Cambridge, MA).
Gilbert, R.J., and D.M.G. Newbery, 1982, Preemptive patenting and the persistence of monopoly, American Economic Review, 72:514-526.
Gilbert, R.J., and D.M.G. Newbery, 1984, Uncertain innovation and the persistence of
monopoly: Comment, American Economic Review, 74:238-242. Hartley, K., 1965, “The Learning Curve and Its Application to the Aircraft Industry,”
Journal of Industrial Economics, Vol. 13, No. 2:122-128. Ibbotson Associates, 2001, Stocks, bonds, bills, and inflation: 2001 Yearbook, Ibbotson
Associates (Chicago, IL). Judd, K.J., 1985, Credible spatial preemption, Rand Journal of Economics, 16:153-166. Lehman Brothers, Equity Research Report: “Airbus Industrie: Airbus’ A3XX Nears
Another Milestone,” December 6,1999.
MacKinlay, A. C., 1997, Event studies in economics and finance, Journal of Economic Literature, 35:13-39.
McConnell, J.J., and C.J. Muscarella, 1985, Corporate capital expenditure decisions and
the market value of the firm, Journal of Financial Economics, 14:399-422. Myers, S.C., 1974, Interactions of corporate financing and investment decisions—
Implications for capital budgeting, The Journal of Finance, 24:1-25. Newhouse, J., The Sporty Game, (New York, Alfred A. Knopf, 1982).
30
Porter, M.E., and A.M. Spence, 1982, The capacity expansion process in a growing oligopoly: The case of corn wet milling, in The Eocnomics of Information and Uncertainty, J.J. McCall, ed., (University of Chicago Press, Chicago, IL).
Reinganum, J.F., 1983, Uncertain innovation and the persistence of monopoly, American
Economic Review, 73:741-748. Reinganum, J.F., 1985, Innovation and industry evolution, Quarterly Journal of
Economics, 91:81-99. Reinganum, J.F., 1989, The timing of innovation: research, development, and diffusion,
in the Handbook of Industrial Organization, R. Schmalensee and R.D. Willig, eds., (Elsevier Science Publishing Company, New York, NE), 849-908.
Tirole, Jean, 1988, The Theory of Industrial Organization, (MIT Press, Cambridge, MA). Welch, I., 1999, Views from financial economists on the equity premium and
professional controversies, Anderson School at UCLA working paper, June.
31
Appendix 1 A Financial Model for the Airbus Superjumbo
Key Inputs to the Model:
1) Operating profit: As of 2008, the price per plane is $225m, the number of planes in steady state production is 50, and the constant operating margin is 15%. We have ignored leaning curve effects. Incorporating learning effects and starting with a much lower initial margin, lowers NPV unless one assumes that the operating margin exceeds 15% at some point in time.
2) Sales ramp-up: Based on assumptions in the models in the research reports. Plane Sales 20 years 10 years Our Base Case 701 201 The Airline Monitor 515 125 (Jan/Feb, 2000, p. 13) DKB analysis (pp. 27) High demand 644 175 Medium demand 553 130 Low demand 433 75 LB analysis (pp. 22-23) High demand 792 Medium demand 665 184 Low demand 364
If one uses a ramp-up schedule that matches what the analysts are predicting—a rate that is slower than our base case—the NPV falls to approximately $0.0 billion.
3) Launch costs: According to Airbus, the total cost will be $10.7B for R&D and net working capital (NWC), and $1.2B for fixed assets related to final assembly (capital expenditures), for a total investment cost of $11.9B. The timing of expenditure follows the DKB research report.
4) Funding sources: Of the $11.9B total, $6.3B will come from Airbus, $2.5B from government launch aid, and $3.1B from Risk Sharing Partners.
5) Discount rate: The discount rate is the unlevered (asset) cost of capital, calculated according to the Capital Asset Pricing Model (CAPM, KA = Rf + βA*RP) with the following inputs:
a) risk-free rate = 6.0%, the yield on the 10-year US Treasury Note as of December 15, 2000.
b) asset beta for commercial aviation = 0.84, the average asset beta derived from a market model using two years of daily data from 1/1/98 to 12/31/99 for Boeing and Bombardier.
c) market risk premium = 6%, slightly below the arithmetic average of the difference between returns on large company stocks and returns on long-term government bonds of 7.3%according to Ibbotson and Sinqfield
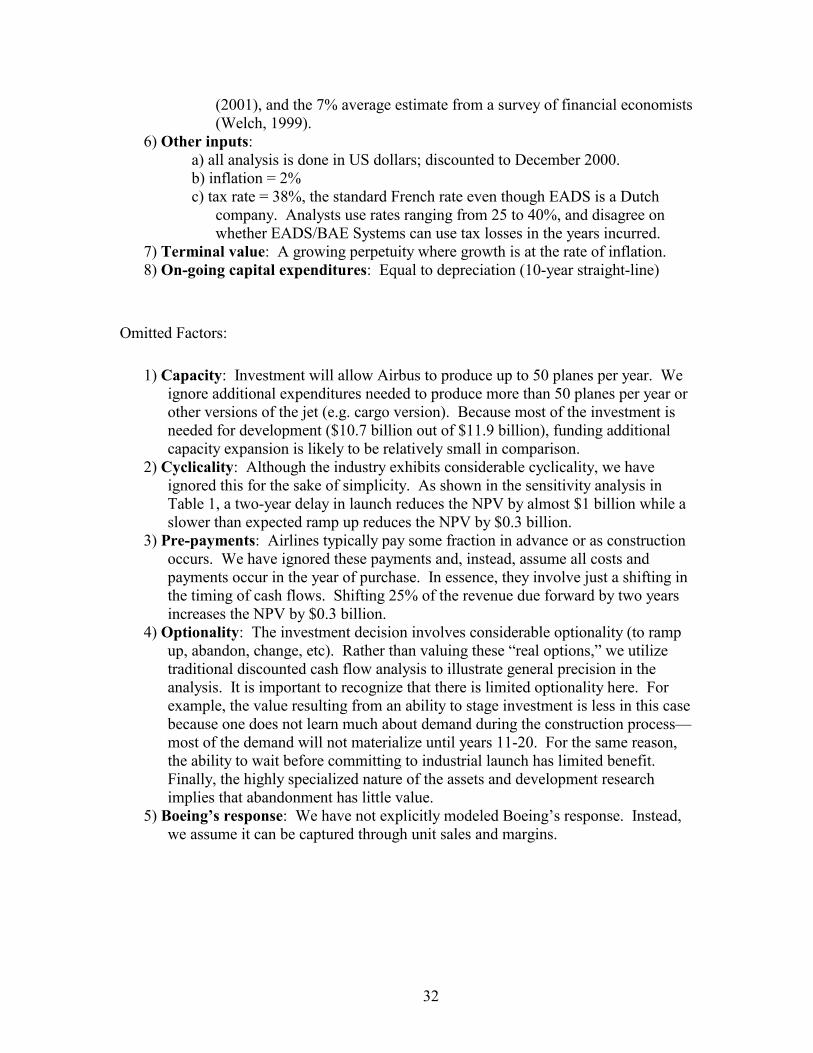
32
(2001), and the 7% average estimate from a survey of financial economists (Welch, 1999).
6) Other inputs: a) all analysis is done in US dollars; discounted to December 2000. b) inflation = 2% c) tax rate = 38%, the standard French rate even though EADS is a Dutch
company. Analysts use rates ranging from 25 to 40%, and disagree on whether EADS/BAE Systems can use tax losses in the years incurred.
7) Terminal value: A growing perpetuity where growth is at the rate of inflation. 8) On-going capital expenditures: Equal to depreciation (10-year straight-line)
Omitted Factors:
1) Capacity: Investment will allow Airbus to produce up to 50 planes per year. We ignore additional expenditures needed to produce more than 50 planes per year or other versions of the jet (e.g. cargo version). Because most of the investment is needed for development ($10.7 billion out of $11.9 billion), funding additional capacity expansion is likely to be relatively small in comparison.
2) Cyclicality: Although the industry exhibits considerable cyclicality, we have ignored this for the sake of simplicity. As shown in the sensitivity analysis in Table 1, a two-year delay in launch reduces the NPV by almost $1 billion while a slower than expected ramp up reduces the NPV by $0.3 billion.
3) Pre-payments: Airlines typically pay some fraction in advance or as construction occurs. We have ignored these payments and, instead, assume all costs and payments occur in the year of purchase. In essence, they involve just a shifting in the timing of cash flows. Shifting 25% of the revenue due forward by two years increases the NPV by $0.3 billion.
4) Optionality: The investment decision involves considerable optionality (to ramp up, abandon, change, etc). Rather than valuing these “real options,” we utilize traditional discounted cash flow analysis to illustrate general precision in the analysis. It is important to recognize that there is limited optionality here. For example, the value resulting from an ability to stage investment is less in this case because one does not learn much about demand during the construction process—most of the demand will not materialize until years 11-20. For the same reason, the ability to wait before committing to industrial launch has limited benefit. Finally, the highly specialized nature of the assets and development research implies that abandonment has little value.
5) Boeing’s response: We have not explicitly modeled Boeing’s response. Instead, we assume it can be captured through unit sales and margins.
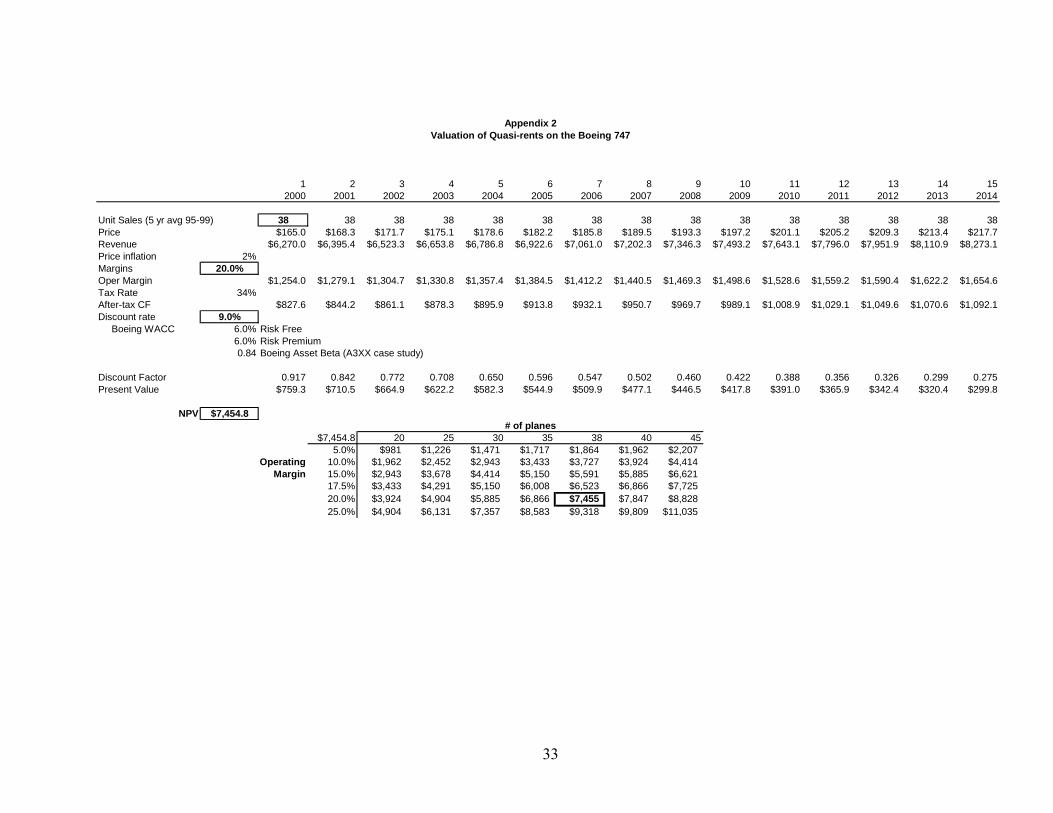
33
Appendix 2Valuation of Quasi-rents on the Boeing 747
1 2 3 4 5 6 7 8 9 10 11 12 13 14 152000 2001 2002 2003 2004 2005 2006 2007 2008 2009 2010 2011 2012 2013 2014
Unit Sales (5 yr avg 95-99) 38 38 38 38 38 38 38 38 38 38 38 38 38 38 38Price $165.0 $168.3 $171.7 $175.1 $178.6 $182.2 $185.8 $189.5 $193.3 $197.2 $201.1 $205.2 $209.3 $213.4 $217.7Revenue $6,270.0 $6,395.4 $6,523.3 $6,653.8 $6,786.8 $6,922.6 $7,061.0 $7,202.3 $7,346.3 $7,493.2 $7,643.1 $7,796.0 $7,951.9 $8,110.9 $8,273.1Price inflation 2%Margins 20.0%Oper Margin $1,254.0 $1,279.1 $1,304.7 $1,330.8 $1,357.4 $1,384.5 $1,412.2 $1,440.5 $1,469.3 $1,498.6 $1,528.6 $1,559.2 $1,590.4 $1,622.2 $1,654.6Tax Rate 34%After-tax CF $827.6 $844.2 $861.1 $878.3 $895.9 $913.8 $932.1 $950.7 $969.7 $989.1 $1,008.9 $1,029.1 $1,049.6 $1,070.6 $1,092.1Discount rate 9.0% Boeing WACC 6.0% Risk Free
6.0% Risk Premium0.84 Boeing Asset Beta (A3XX case study)
Discount Factor 0.917 0.842 0.772 0.708 0.650 0.596 0.547 0.502 0.460 0.422 0.388 0.356 0.326 0.299 0.275Present Value $759.3 $710.5 $664.9 $622.2 $582.3 $544.9 $509.9 $477.1 $446.5 $417.8 $391.0 $365.9 $342.4 $320.4 $299.8
NPV $7,454.8# of planes
$7,454.8 20 25 30 35 38 40 455.0% $981 $1,226 $1,471 $1,717 $1,864 $1,962 $2,207
Operating 10.0% $1,962 $2,452 $2,943 $3,433 $3,727 $3,924 $4,414Margin 15.0% $2,943 $3,678 $4,414 $5,150 $5,591 $5,885 $6,621
17.5% $3,433 $4,291 $5,150 $6,008 $6,523 $6,866 $7,72520.0% $3,924 $4,904 $5,885 $6,866 $7,455 $7,847 $8,82825.0% $4,904 $6,131 $7,357 $8,583 $9,318 $9,809 $11,035
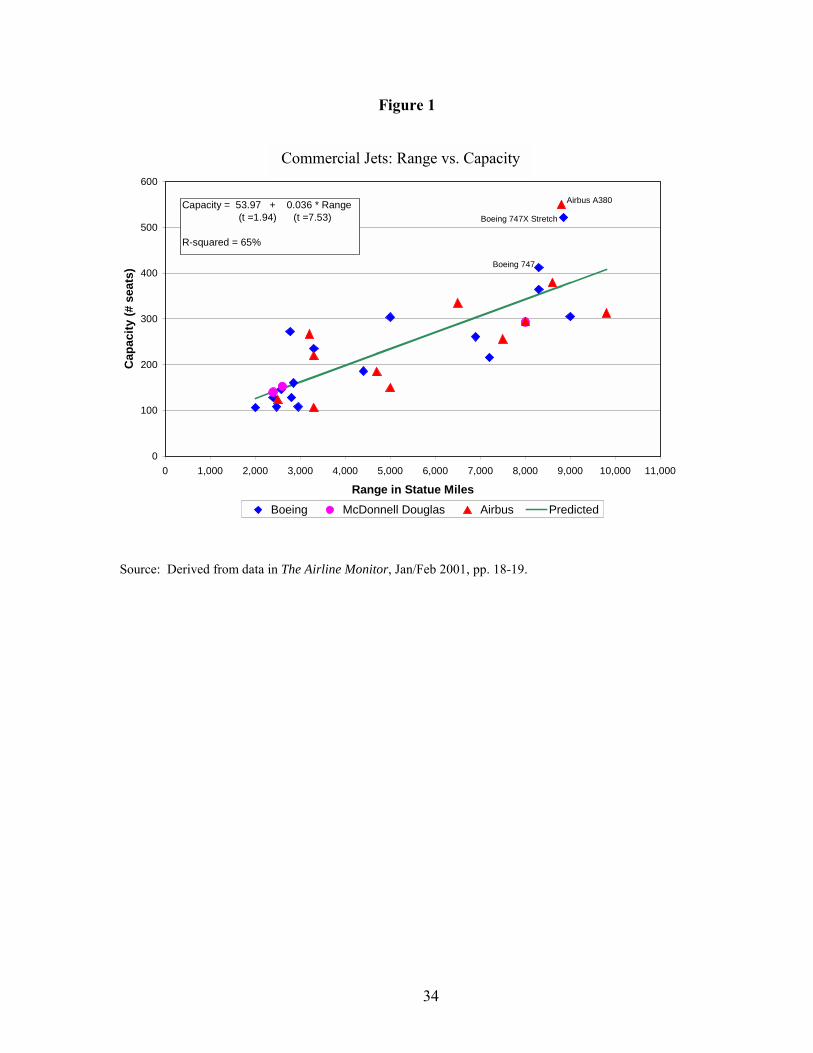
34
Figure 1
Source: Derived from data in The Airline Monitor, Jan/Feb 2001, pp. 18-19.
Commerical Jets: Range vs. Capacity
0
100
200
300
400
500
600
0 1,000 2,000 3,000 4,000 5,000 6,000 7,000 8,000 9,000 10,000 11,000
Range in Statue Miles
Cap
acity
(# s
eats
)
Boeing McDonnell Douglas Airbus Predicted
Airbus A380
Boeing 747X StretchCapacity = 53.97 + 0.036 * Range (t =1.94) (t =7.53)
R-squared = 65%
Boeing 747
Commercial Jets: Range vs. Capacity
35
Table 1
Simplified Valuation Analysis for the Airbus A3XX
Key Assumptions as of 2008 Discount Rate AssumptionsPrice per Plane $225 in millions Risk-free Rate 6.0%
Number of Planes 50 in steady state Asset Beta 0.84Operating Margin 15.0% Risk Premium 6.0%
Discount Rate 11.0%General Assumptions as of 2000
Inflation Rate 2.0% Results from the ModelTax Rate 38.0% NPV = $348
After-tax IRR = 11.6%Required Investment as of 2000 ($millions) Pre-tax IRR = 14.7%
Research & Development $9,700 # planes sold by 2010 201 in first 10 yearsCapital Expenditures $1,200 # planes sold by 2020 701 in first 20 yearsNet Working Capital $1,000 Capacity Constraint Violated? No Max = 50/year
Sensitivity Analysis
Operating Margins$348 5% 10% 15% 20% 25%8.0% ($2,774) $824 $4,422 $8,020 $11,6189.0% ($3,222) ($303) $2,617 $5,536 $8,456
Discount 10.0% ($3,511) ($1,091) $1,328 $3,748 $6,167Rate 11.0% ($3,702) ($1,677) $348 $2,372 $4,397
12.0% ($3,812) ($2,072) ($333) $1,406 $3,14513.0% ($3,878) ($2,378) ($879) $621 $2,12114.0% ($3,910) ($2,605) ($1,300) $5 $1,310
Operating Margins$348 5% 10% 15% 20% 25%
20 ($4,918) ($4,110) ($3,301) ($2,493) ($1,684)Steady 30 ($4,511) ($3,294) ($2,078) ($862) $354
State 40 ($4,110) ($2,493) ($876) $742 $2,359# of 50 ($3,702) ($1,677) $348 $2,372 $4,397
Planes 60 ($3,301) ($876) $1,550 $3,976 $6,40170 ($2,894) ($60) $2,773 $5,607 $8,440
R&D Cost$348 $8,700 $9,700 $10,700 $11,700 $12,700
2008 165 ($845) ($1,272) ($1,700) ($2,128) ($2,555)Realized 185 ($305) ($732) ($1,160) ($1,588) ($2,015)
Price 205 $235 ($192) ($620) ($1,048) ($1,475)Per 225 $775 $348 ($80) ($508) ($935)
Plane 245 $1,315 $888 $460 $32 ($395)
Tax Rate$348 15% 20% 25% 30% 38%0.0% $671 $554 $436 $319 $1321.0% $824 $695 $565 $436 $229
Inflation 2.0% $1,011 $867 $722 $578 $348Rate 3.0% $1,244 $1,081 $919 $756 $496
4.0% $1,544 $1,357 $1,171 $985 $6865.0% $1,943 $1,725 $1,507 $1,289 $9406.0% $2,500 $2,238 $1,975 $1,713 $1,294
Ramp-up (% of steady state sales)2006 2007 2008 2009 2010 NPV
2 Year Delay 0% 0% 25% 75% 100% ($601)Slow 10% 33% 67% 100% 100% ($90)
Expected 25% 75% 100% 100% 100% $348Fast 50% 100% 100% 100% 100% $595
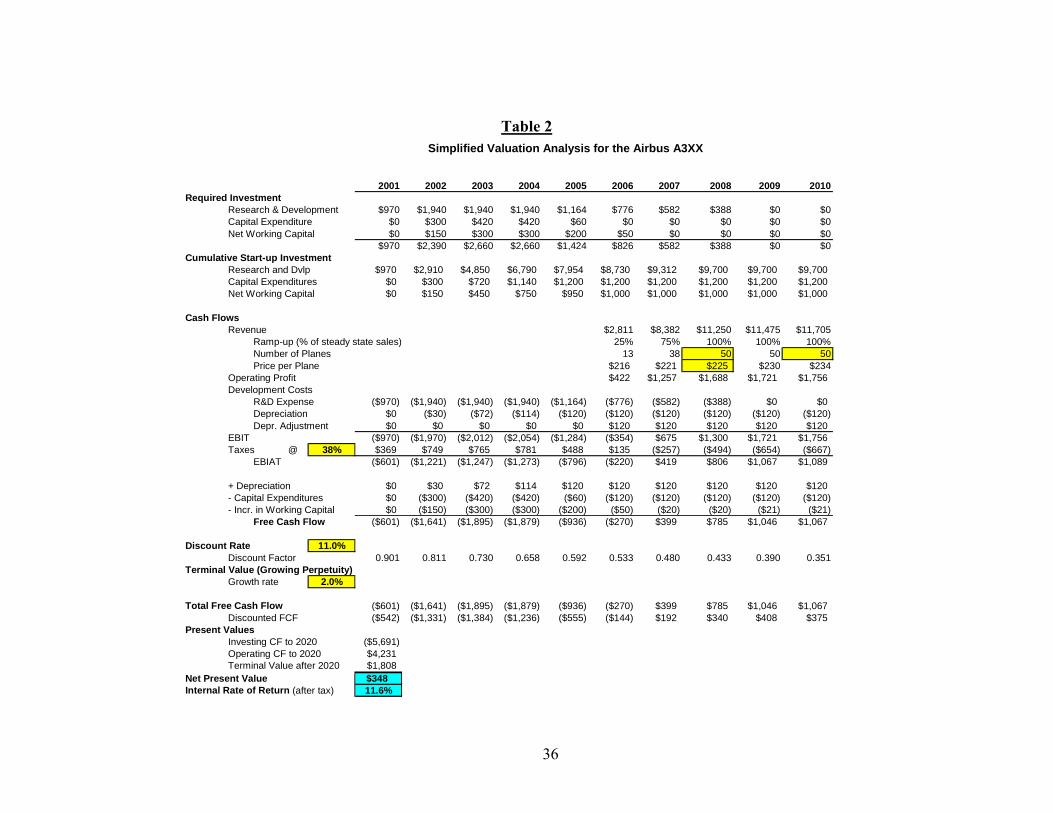
36
Table 2 Simplified Valuation Analysis for the Airbus A3XX
2001 2002 2003 2004 2005 2006 2007 2008 2009 2010Required Investment
Research & Development $970 $1,940 $1,940 $1,940 $1,164 $776 $582 $388 $0 $0Capital Expenditure $0 $300 $420 $420 $60 $0 $0 $0 $0 $0Net Working Capital $0 $150 $300 $300 $200 $50 $0 $0 $0 $0
$970 $2,390 $2,660 $2,660 $1,424 $826 $582 $388 $0 $0Cumulative Start-up Investment
Research and Dvlp $970 $2,910 $4,850 $6,790 $7,954 $8,730 $9,312 $9,700 $9,700 $9,700Capital Expenditures $0 $300 $720 $1,140 $1,200 $1,200 $1,200 $1,200 $1,200 $1,200Net Working Capital $0 $150 $450 $750 $950 $1,000 $1,000 $1,000 $1,000 $1,000
Cash FlowsRevenue $2,811 $8,382 $11,250 $11,475 $11,705
Ramp-up (% of steady state sales) 25% 75% 100% 100% 100%Number of Planes 13 38 50 50 50Price per Plane $216 $221 $225 $230 $234
Operating Profit $422 $1,257 $1,688 $1,721 $1,756Development Costs
R&D Expense ($970) ($1,940) ($1,940) ($1,940) ($1,164) ($776) ($582) ($388) $0 $0Depreciation $0 ($30) ($72) ($114) ($120) ($120) ($120) ($120) ($120) ($120)Depr. Adjustment $0 $0 $0 $0 $0 $120 $120 $120 $120 $120
EBIT ($970) ($1,970) ($2,012) ($2,054) ($1,284) ($354) $675 $1,300 $1,721 $1,756Taxes @ 38% $369 $749 $765 $781 $488 $135 ($257) ($494) ($654) ($667)
EBIAT ($601) ($1,221) ($1,247) ($1,273) ($796) ($220) $419 $806 $1,067 $1,089
+ Depreciation $0 $30 $72 $114 $120 $120 $120 $120 $120 $120- Capital Expenditures $0 ($300) ($420) ($420) ($60) ($120) ($120) ($120) ($120) ($120)- Incr. in Working Capital $0 ($150) ($300) ($300) ($200) ($50) ($20) ($20) ($21) ($21)
Free Cash Flow ($601) ($1,641) ($1,895) ($1,879) ($936) ($270) $399 $785 $1,046 $1,067
Discount Rate 11.0%Discount Factor 0.901 0.811 0.730 0.658 0.592 0.533 0.480 0.433 0.390 0.351
Terminal Value (Growing Perpetuity)Growth rate 2.0%
Total Free Cash Flow ($601) ($1,641) ($1,895) ($1,879) ($936) ($270) $399 $785 $1,046 $1,067Discounted FCF ($542) ($1,331) ($1,384) ($1,236) ($555) ($144) $192 $340 $408 $375
Present ValuesInvesting CF to 2020 ($5,691)Operating CF to 2020 $4,231Terminal Value after 2020 $1,808
Net Present Value $348Internal Rate of Return (after tax) 11.6%
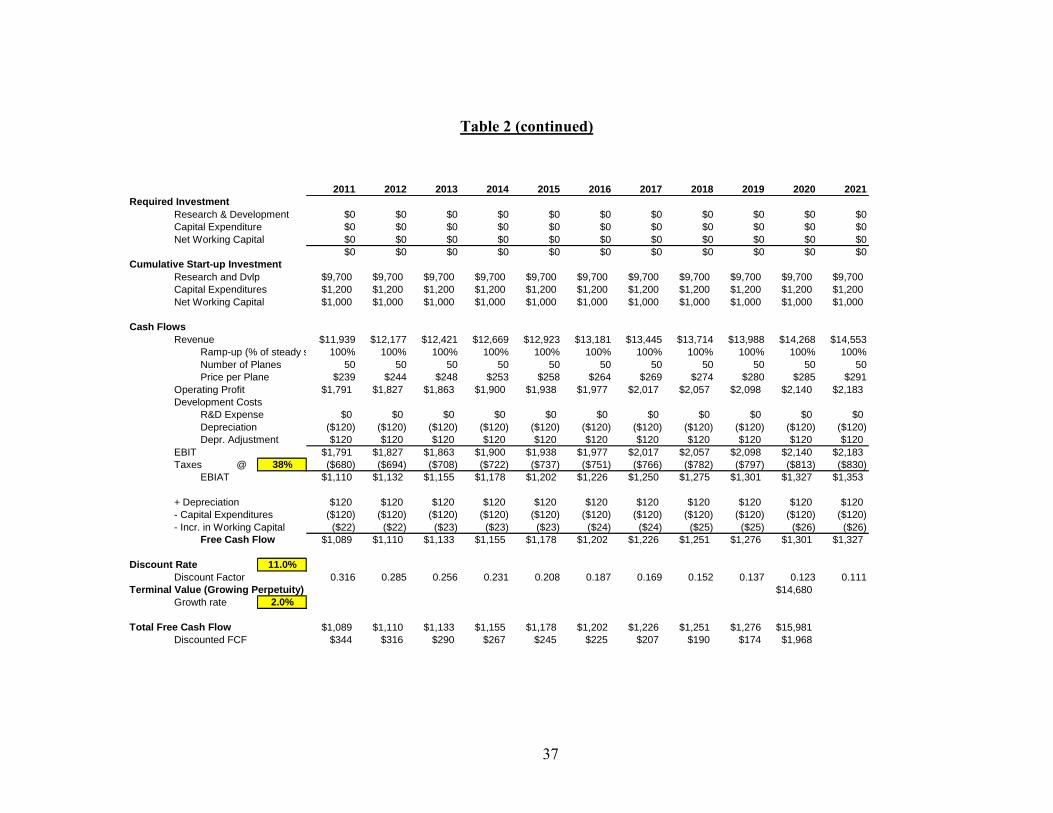
37
Table 2 (continued)
2011 2012 2013 2014 2015 2016 2017 2018 2019 2020 2021Required Investment
Research & Development $0 $0 $0 $0 $0 $0 $0 $0 $0 $0 $0Capital Expenditure $0 $0 $0 $0 $0 $0 $0 $0 $0 $0 $0Net Working Capital $0 $0 $0 $0 $0 $0 $0 $0 $0 $0 $0
$0 $0 $0 $0 $0 $0 $0 $0 $0 $0 $0Cumulative Start-up Investment
Research and Dvlp $9,700 $9,700 $9,700 $9,700 $9,700 $9,700 $9,700 $9,700 $9,700 $9,700 $9,700Capital Expenditures $1,200 $1,200 $1,200 $1,200 $1,200 $1,200 $1,200 $1,200 $1,200 $1,200 $1,200Net Working Capital $1,000 $1,000 $1,000 $1,000 $1,000 $1,000 $1,000 $1,000 $1,000 $1,000 $1,000
Cash FlowsRevenue $11,939 $12,177 $12,421 $12,669 $12,923 $13,181 $13,445 $13,714 $13,988 $14,268 $14,553
Ramp-up (% of steady s 100% 100% 100% 100% 100% 100% 100% 100% 100% 100% 100%Number of Planes 50 50 50 50 50 50 50 50 50 50 50Price per Plane $239 $244 $248 $253 $258 $264 $269 $274 $280 $285 $291
Operating Profit $1,791 $1,827 $1,863 $1,900 $1,938 $1,977 $2,017 $2,057 $2,098 $2,140 $2,183Development Costs
R&D Expense $0 $0 $0 $0 $0 $0 $0 $0 $0 $0 $0Depreciation ($120) ($120) ($120) ($120) ($120) ($120) ($120) ($120) ($120) ($120) ($120)Depr. Adjustment $120 $120 $120 $120 $120 $120 $120 $120 $120 $120 $120
EBIT $1,791 $1,827 $1,863 $1,900 $1,938 $1,977 $2,017 $2,057 $2,098 $2,140 $2,183Taxes @ 38% ($680) ($694) ($708) ($722) ($737) ($751) ($766) ($782) ($797) ($813) ($830)
EBIAT $1,110 $1,132 $1,155 $1,178 $1,202 $1,226 $1,250 $1,275 $1,301 $1,327 $1,353
+ Depreciation $120 $120 $120 $120 $120 $120 $120 $120 $120 $120 $120- Capital Expenditures ($120) ($120) ($120) ($120) ($120) ($120) ($120) ($120) ($120) ($120) ($120)- Incr. in Working Capital ($22) ($22) ($23) ($23) ($23) ($24) ($24) ($25) ($25) ($26) ($26)
Free Cash Flow $1,089 $1,110 $1,133 $1,155 $1,178 $1,202 $1,226 $1,251 $1,276 $1,301 $1,327
Discount Rate 11.0%Discount Factor 0.316 0.285 0.256 0.231 0.208 0.187 0.169 0.152 0.137 0.123 0.111
Terminal Value (Growing Perpetuity) $14,680Growth rate 2.0%
Total Free Cash Flow $1,089 $1,110 $1,133 $1,155 $1,178 $1,202 $1,226 $1,251 $1,276 $15,981Discounted FCF $344 $316 $290 $267 $245 $225 $207 $190 $174 $1,968
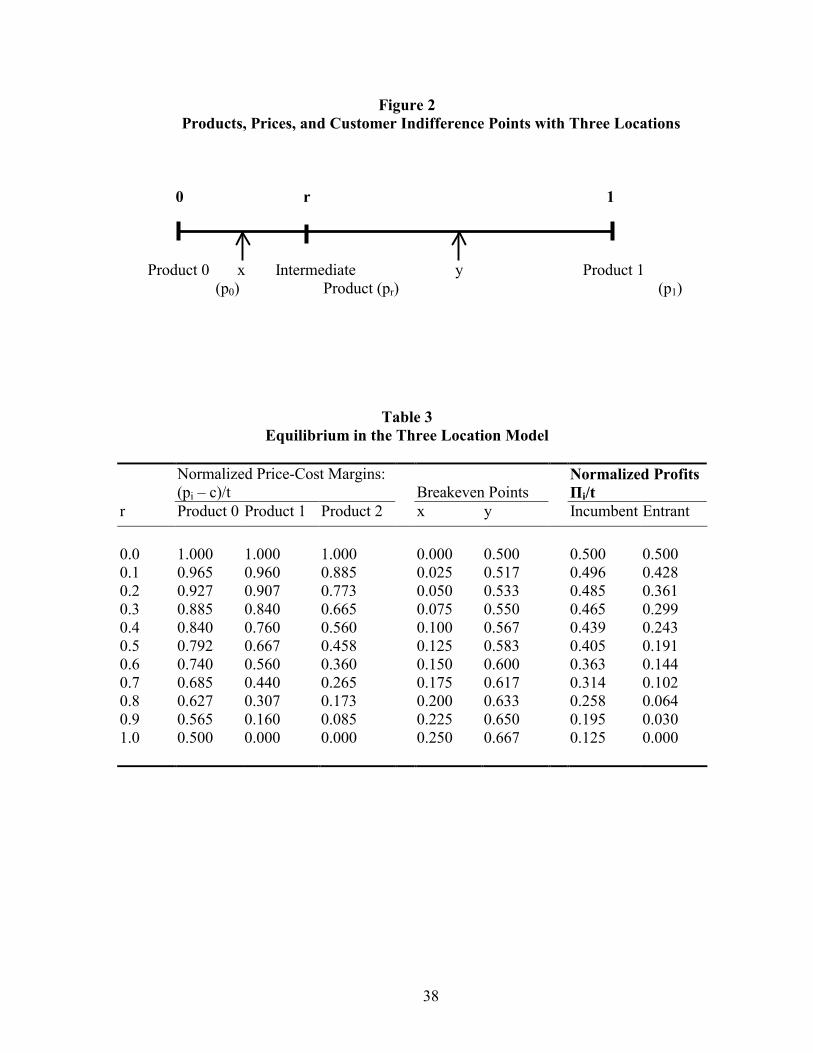
38
Figure 2 Products, Prices, and Customer Indifference Points with Three Locations
0 r 1
Product 0 x Intermediate y Product 1
(p0) Product (pr) (p1)
Table 3
Equilibrium in the Three Location Model
Normalized Price-Cost Margins: (pi – c)/t
Breakeven Points
Normalized Profits Πi/t
r Product 0 Product 1 Product 2 x y Incumbent Entrant 0.0 1.000 1.000 1.000 0.000 0.500 0.500 0.500 0.1 0.965 0.960 0.885 0.025 0.517 0.496 0.428 0.2 0.927 0.907 0.773 0.050 0.533 0.485 0.361 0.3 0.885 0.840 0.665 0.075 0.550 0.465 0.299 0.4 0.840 0.760 0.560 0.100 0.567 0.439 0.243 0.5 0.792 0.667 0.458 0.125 0.583 0.405 0.191 0.6 0.740 0.560 0.360 0.150 0.600 0.363 0.144 0.7 0.685 0.440 0.265 0.175 0.617 0.314 0.102 0.8 0.627 0.307 0.173 0.200 0.633 0.258 0.064 0.9 0.565 0.160 0.085 0.225 0.650 0.195 0.030 1.0 0.500 0.000 0.000 0.250 0.667 0.125 0.000
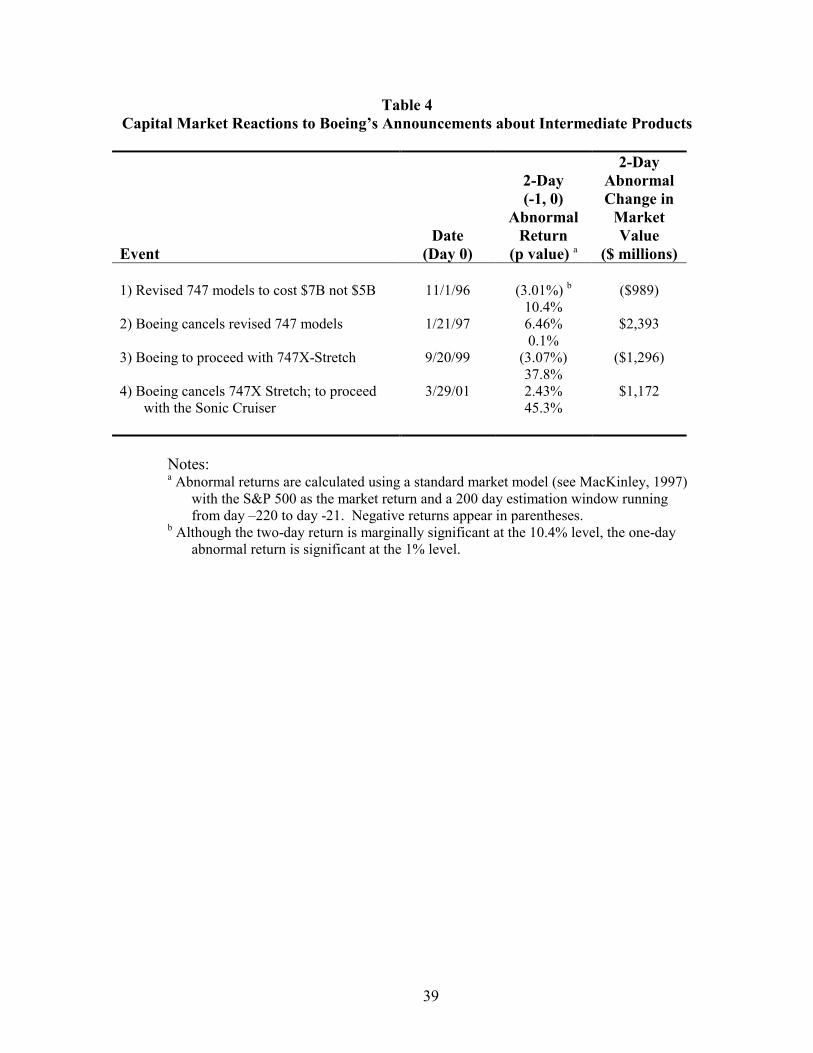
39
Table 4 Capital Market Reactions to Boeing’s Announcements about Intermediate Products
Event
Date
(Day 0)
2-Day (-1, 0)
Abnormal Return
(p value) a
2-Day Abnormal Change in
Market Value
($ millions) 1) Revised 747 models to cost $7B not $5B 11/1/96 (3.01%) b
10.4% ($989)
2) Boeing cancels revised 747 models 1/21/97 6.46% 0.1%
$2,393
3) Boeing to proceed with 747X-Stretch 9/20/99 (3.07%) 37.8%
($1,296)
4) Boeing cancels 747X Stretch; to proceed with the Sonic Cruiser
3/29/01 2.43% 45.3%
$1,172
Notes: a Abnormal returns are calculated using a standard market model (see MacKinley, 1997)
with the S&P 500 as the market return and a 200 day estimation window running from day –220 to day -21. Negative returns appear in parentheses.
b Although the two-day return is marginally significant at the 10.4% level, the one-day abnormal return is significant at the 1% level.

40
Figure 3
Realized Price per Seat
Table 5 20-Year Forecasts of the Number of VLA Deliveries
(Passenger Jets > 500 seats only)
Boeing CMO
Forecast
Airbus GMF
Forecast 1995 n/a 1374 1996 n/a n/a 1997 460 1442 1998 405 1332 1999 365 1208 2000 330 1235
Source: Boeing Current Market Outlook (CMO) and Airbus
Global Market Forecast (GMF), various years.
$0
$50
$100
$150
$200
$250
$300
$350
$400
$450
0 100 200 300 400 500 600
Number of Seats in Standard Configuration
Rea
lized
Pric
e pe
r Sea
t in
2000
($00
0)
Boeing Airbus McDonnel-Douglas
Boeing 747-400(realized price)
Airbus A380(realized)
Airbus A380(list price)
Boeing 747X(list price)
Boeing 747X(discount price)
Boeing 747-400(list price)
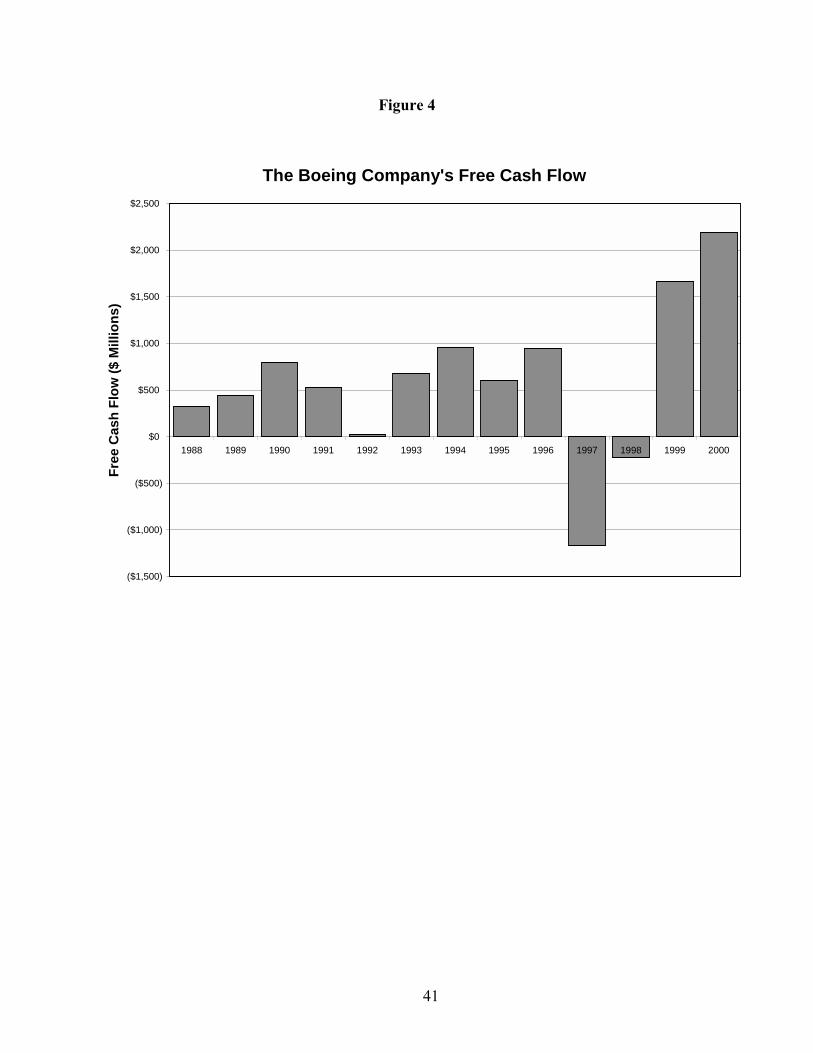
41
Figure 4
The Boeing Company's Free Cash Flow
($1,500)
($1,000)
($500)
$0
$500
$1,000
$1,500
$2,000
$2,500
1988 1989 1990 1991 1992 1993 1994 1995 1996 1997 1998 1999 2000
Free
Cas
h Fl
ow ($
Mill
ions
)


