1 Benthic Biological Community Responses to Sediment Loading in Experimental Stream Mesocosm Channels Report 4 of 4 Contract #05-179-160-0 David B. Herbst R. Bruce Medhurst Matthew K. Wilson Scott W. Roberts Nicholas G. Hayden Sierra Nevada Aquatic Research Laboratory University of California HCR 79, Box 198 Mammoth Lakes, CA 93546 SUMMARY 1) The objectives of this study were to examine the effect of sediment dose and duration (pulse vs. press) on benthic communities inhabiting different in-stream habitats (riffle vs. pool) among replicate treatments over a 6-week exposure period, and after nearly one year. 2) Experiments were conducted in outdoor mesocosm stream channels at the Sierra Nevada Aquatic Research Laboratory (SNARL), Mammoth Lakes, CA. Pulse experiments consisted of a single 100 or 1000 liter dose of sediment (dry volume) and a control channel. Press experiments were composed of 10 repeated doses (at four-day intervals) covering a cumulative range of 100, 250, 500, and 1000 liters of sediment (dry volume) and a control channel. 3) Invertebrate drift increased in all but the lowest dose treatment and did not appear to result in mortality but drift emigration was low compared to benthic densities. 4) Mobilization and export of CPOM increased in proportion to sediment dose. 5) Algae chlorophyll biomass (green filamentous forms) was highest where most sediment was already present or was added in the greatest amount. 6) No effect of sediment was observed in changing density or richness, but multivariate analysis revealed increasing dissimilarity in overall community composition relative to initial stating conditions at higher doses. 7) The effect of sediment was more pronounced in pools where deeper, slow flows accumulated more sediments compared to riffles. 8) Long term samples taken 11 months after initial dosing indicated significant reductions in density and richness of benthic communities within riffle habitats. It is the longer-term legacy effects of sedimentation that appear to alter recruitment and result in patch-scale and reach-scale restrictions on distribution, abundance and composite community complexity.
Transcript
1
Benthic Biological Community Responses to Sediment Loading
in Experimental Stream Mesocosm Channels
Report 4 of 4
Contract #05-179-160-0
David B. Herbst
R. Bruce Medhurst
Matthew K. Wilson
Scott W. Roberts
Nicholas G. Hayden
Sierra Nevada Aquatic Research Laboratory
University of California
HCR 79, Box 198
Mammoth Lakes, CA 93546
SUMMARY
1) The objectives of this study were to examine the effect of sediment dose and
duration (pulse vs. press) on benthic communities inhabiting different in-stream
habitats (riffle vs. pool) among replicate treatments over a 6-week exposure
period, and after nearly one year.
2) Experiments were conducted in outdoor mesocosm stream channels at the Sierra
Nevada Aquatic Research Laboratory (SNARL), Mammoth Lakes, CA. Pulse
experiments consisted of a single 100 or 1000 liter dose of sediment (dry volume)
and a control channel. Press experiments were composed of 10 repeated doses (at
four-day intervals) covering a cumulative range of 100, 250, 500, and 1000 liters
of sediment (dry volume) and a control channel.
3) Invertebrate drift increased in all but the lowest dose treatment and did not appear
to result in mortality but drift emigration was low compared to benthic densities.
4) Mobilization and export of CPOM increased in proportion to sediment dose.
5) Algae chlorophyll biomass (green filamentous forms) was highest where most
sediment was already present or was added in the greatest amount.
6) No effect of sediment was observed in changing density or richness, but
multivariate analysis revealed increasing dissimilarity in overall community
composition relative to initial stating conditions at higher doses.
7) The effect of sediment was more pronounced in pools where deeper, slow flows
accumulated more sediments compared to riffles.
8) Long term samples taken 11 months after initial dosing indicated significant
reductions in density and richness of benthic communities within riffle habitats.
It is the longer-term legacy effects of sedimentation that appear to alter
recruitment and result in patch-scale and reach-scale restrictions on distribution,
abundance and composite community complexity.
2
INTRODUCTION
The effects of sediment as a pollutant on water quality and biological health are
often difficult to assess because transport and deposition of sediment is a natural process
of streams. Sediment derived from the landscape contributes to the dynamic processes of
building, shaping, and renewing stream channels. Sediment fractions of fine, sand and
gravel sizes contribute to the dynamic ecological function of streams, often forming the
matrix substratum of stream bed habitat for periphyton, invertebrates, and fish. However,
excess sediment supply to a stream, at levels exceeding natural background contributed
by anthropogenic disturbances, can impair indigenous stream communities and interfere
with their ecological function. The challenge for researchers and managers seeking to
understand the effects of watershed disturbance and excess sediment loading on a stream
is to determine: (1) whether impairment to aquatic life is occurring; (2) what portion of
observed impairment can be attributed to excess sediment; and, (3) the degree to which
sediment loads must be reduced to improve habitat quality and beneficial uses.
Many studies have examined the relationship of the physical substrate of the
stream bed to benthic life (Minshall 1984; Waters 1995; Allen and Castillo 2007). Field
studies of substrate associations with benthic invertebrates, algae and fish are confounded
though by many environmental covariates, including current, depth, organic matter, and
the patchiness of distributions across heterogeneous microhabitats. To control
background sources of variation, experimental studies of substrate influence on stream
invertebrates have typically examined either the colonization of introduced substrates of
differing size and variety, or the responses of established replicate communities to
sediment addition. Experiments have the advantage of manipulating the frequency,
duration and intensity of exposure that form the elements of the stress regime of
sedimentation. As with many other ecological experiments, results are limited by the
relatively small scale and short time frame over which manipulations can be conducted
and that responses are conditional on the community profile of taxa present in treatment
units. Stream mesocosms are an advantage over laboratory microcosms in that they are
nearer the natural scale of habitat units where experimental subjects reside, and are in
operation for weeks to months, rather than hours or days, covering a greater length of the
life history for organisms such as aquatic invertebrates (Cooper and Barmuta 1993).
Background
Sediment supply, transport, deposition and predicted effects on benthic biota
Stream sediment is supplied from sources both external and internal to the stream
channel (Gordon et al. 2004; Gomi et al. 2005). External sources include bank erosion,
mass movement, roads and trails, and surface erosion on slopes, while internal sources
include material stored within the channel system in perennial and ephemeral reaches and
their floodplains. Anthropogenic activities in the watershed can influence both the
sediment supply and hydrologic conditions of a stream, affecting the quantity and quality
of external sediment sources, as well as the transport and storage capacity of a stream.
Watershed or stream disturbance that increase rates of erosion and the rate of sediment
delivery to a stream will increase the external sediment supply. Internal storage and
transport capacity will also be influenced by activities in the watershed, including the
construction of impervious surfaces, the removal of vegetative cover, and the
construction of dams, all of which alter the timing, duration, and magnitude of flow
3
events. Changes in within-channel sediment storage may delay and attenuate sediment
waves introduced from external sources (Hassan et al. 2005). Thus, the effects of
increased sediment supply to a stream are complex and cannot necessarily be decoupled
from alterations to its hydrology.
Wash material, functionally defined as fine sediment particles that are transported
in suspension, comprises the major portion of total sediment load in most river systems,
and strongly influences the physical and biological structure of streams (Gomi et al.
2005; Hassan et al. 2005). During transport events, wash material scours stream channels
and can lead to temporarily turbid, inhospitable conditions for many organisms. At lower
flows, wash material will be deposited within the interstices of coarser bed material, and,
when in sufficient supply, even cover or bury bed material under surficial patches of fine
sediment (Lisle and Hilton 1999). For a given hydrologic regime, as sediment supply
increases fine particles will become more abundant on the bed surface (Dietrich et al.
1989). Generally, wash material will be transported directly through a reach without
being deposited in the main channel. However, such fine sediment may be deposited in
portions of a stream where channel velocities are lower than the settling velocities of
these particles; in pools, along the channel margins, and upstream of flow obstructions
such as boulders or large woody debris. In these locations, it is expected that the effects
of deposition from excess sediment supply will most influence benthic habitat. In
particular, as sediment supplies increase, the substrate quality in channel margins is likely
to shift from a heterogeneous mixture of largely coarse bed materials, to a more
homogenous matrix dominated by deposited wash material, with a corresponding shift in
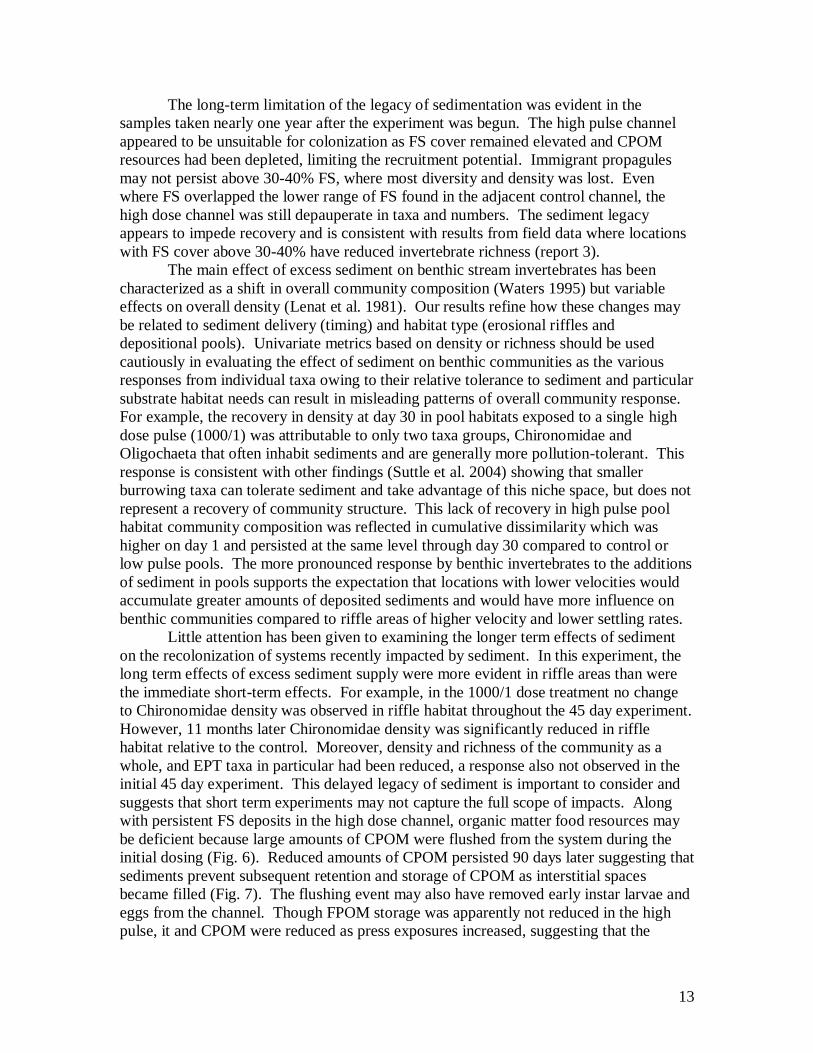
benthic biological communities (Fig. 1). While physical disturbance of benthic
organisms may occur during both sediment transport and deposition processes, long-term
effects from excess sediment supply will be most evident along channel margins where
bar formations develop in zones of low power.
The effects of sediment supply may also vary longitudinally along a stream where
flow power declines (pools, low gradient, flow separation), and due to variability in the
location and extent of sediment sources and fluvial processes such as sorting and abrasion
that influence the deposition of sediment spatially. While locations with substantial bank
erosion and other direct contributions of sediment to a stream may be important, it is
expected that watershed disturbance will particularly influence sediment supplies from
tributaries. It has been asserted that tributary confluences can result in abrupt changes in
bed sediment character and water quality in a main channel, depending on the volume
and character of the water and sediment a tributary delivers (Rice et al. 2001). These
changes also have implications for a number of important habitat characteristics. Abrupt
changes in sediment supply and discharge may cause adjustments in channel form (slope,
width, depth), bed sediment character (size, sorting, shape), and channel hydraulics (near-
bed velocity and shear stress fields). Such effects will also vary downstream from a
confluence due to sorting and abrasion processes that cause a downstream “fining” of
channel substrates as finer sediment particles are preferentially transported and eventually
deposited (Rice and Church 1998). This longitudinal variability presents an additional
challenge to measuring biological impairment from sediment, one that requires
appropriate sampling frequency and site selection. But it also presents the potential
opportunity to detect variable effects from each tributary, such that a range of sediment
“doses” might be detected.
4
Experimental studies of sediment effects on benthic macroinvertebrates communities
Considering how sediment is added, both the exposure time and concentration
may be important to the biological effects observed. In one study, drift increase occurred
only with prolonged exposure even at high concentrations, and with little mortality
among communities (Shaw and Richardson 2001; Molinos and Donohue 2009). Others
have observed immediate drift as either the concentration or duration of sediment
exposure was increased relative to controls (Rosenberg and Wiens 1978; Doeg and
Milledge 1991; Shaw and Richardson 2001; Suren and Jowett 2001). Some of these
studies also reported declining density of benthic invertebrates and periphyton with
sediment addition (Suren and Jowett 2001; Molinos and Donohue 2009). The survival of
benthic macroinvertebrates in most experimental exposures to sediment suggests that
short-term responses are mediated through drift rather than mortality (Culp et al. 1986).
A number of studies have examined the effects of sediment transport and deposition
processes on benthic macroinvertebrates. During sediment transport, both the duration
and magnitude of an event will determine its effects. Macroinvertebrates may be
impacted by abrasion, reduced visual efficiency in feeding, and interference with food
gathering, which has been shown to induce many animals to drift downstream (Waters
1995) . These effects may be temporary, as macroinvertebrate communities can be
expected recover rapidly if habitat and substrate characteristics are restored to pre-event
conditions and intact colonization sources persist upstream.
The effects of sediment deposition on benthic macroinvertebrate communities are
often more substantial, and presumably detectable long after an event. As described
above, excess sediment deposition can alter the particle-size distribution of streambed
substrate through the addition of fine particles. Macroinvertebrate abundance and
community composition are often dependent on substrate particle size, such that a
gradient of abundance of particular taxa is observed across the series of particle sizes
(Waters 1995). Especially sensitive to substrate particle size are many mayfly
(Ephemeroptera), stonefly (Plecoptera), and caddisfly (Trichoptera) taxa, collectively
referred to as EPT, that often inhabit interstitial spaces of coarse substrate. Several
studies have demonstrated that EPT abundance is best correlated to a mixture of
heterogeneous gravel, pebbles, and cobbles (Bjornn et al. 1977; Ciborowski et al. 1977;
Rutherford and Mackay 1986). Taxa that inhabit the hyporheic zone and depend on the
flow of oxygen-containing water through interstitial spaces are affected by substrate
particle size (Waters 1995), where more than 10 to 20 percent fine sand and silt (i.e.,
<0.25 mm) can cause a significant reduction in the oxygen content within the substratum
(Eriksen 1966).
Although individual taxa may be particularly sensitive to excess sediment inputs,
the effect of excess sediment may be best characterized in terms of a shift in overall
community composition (Waters 1995). Dominant species types and diversity may
change as excess sediment inputs convert the dominant substrate from coarse to fine
particles. A response often observed is a change from a community dominated by larger
surface-dwelling taxa to one dominated by smaller burrowing macroinvertebrates (Suttle
et al. 2004) such as Oligochaeta (segmented worms) and Chironomidae (midges).
Sediment sufficient to change the dominant substrate type to sand-silt may change the
number and type of taxa, altering community composition and structure, with variable
effects on overall density (Lenat et al. 1981).
5
The objectives of this study were to improve on previous research by increasing
the scale and duration of sediment exposure while contrasting the specific effects of press
and pulse disturbances, partitioning these effects by habitat type. A better understanding
of how sediment affects stream resources and dynamics, directed at what levels of
sedimentation elicit changes in community structure and function, will aid researchers
and managers in discerning the relative impacts of shorter term sedimentation events
compared to longer term chronic delivery, and how invertebrate communities respond to
the legacy of past deposition.
METHODS
Experimental design
Experiments to test the effects of suspended and deposited sediments on
invertebrate communities were conducted in the outdoor mesocosm stream channels at
the Sierra Nevada Aquatic Research Laboratory (SNARL) in July and September of 2008
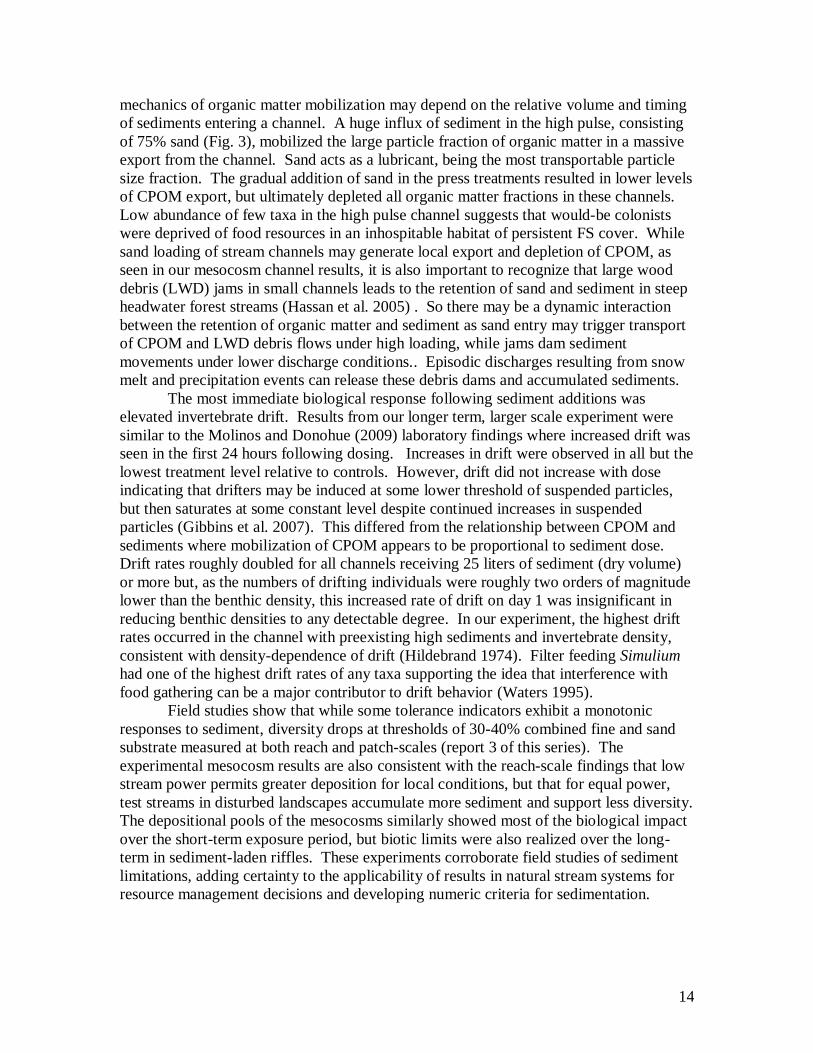
(Fig. 2). These experiments were designed to test the effects of both pulse and press
exposures of resident invertebrate assemblages to a range of sediment additions. In one
experiment, using three channels, sediment was added as a single pulse exposure of a low
dose (100 liter dry volume), high dose (1000 liter), and a control channel. In the second
experiment using six channels, sediment was added gradually over 40 days with ten
repeated additions every four days that covered a cumulative range of 100, 250, 500 and
1000 liters of sediment added. In all cases, sediment was added over a fixed duration of
two hours during which time the volume for each treatment was delivered evenly through
perforated buckets at the top of each experimental channel.
The SNARL mesocosm stream channels, located in the eastern Sierra Nevada at
7000 ft elevation, are each 50 m in length, surface slope 0.1%, and are comprised of
seven riffle sections alternating with six pools in a sinuous form (mean riffle width 1m,
max pool width 1.45 m). Channels are divided into two independent groups of six
channels, and three channels, with source water originating from separate reservoirs.
Flow is maintained in the channels year-round and natural recruitment of invertebrates
occurs through both drift and colonization from adjacent Convict Creek. Trout were
removed one month prior to the beginning of the experiment but did have access to the
channels from Convict Creek. Although trout were able to move in or out of any of the
channels, they were only transient occupants.
Preliminary conditions and preparation of experimental mesocosm channels
In fall 2007, prior to the summer 2008 experiments, substrate and depth profiles
were characterized to determine adjustments that might be necessary to equalize
conditions across the channels in riffles and pools. Particle size distribution and water
depths were measured along five transects of 5 points each, within each riffle and pool.
Substrate was added or removed from channels as necessary, and flow gate openings set
to distribute flow equally across channels. Adjusted conditions were maintained through
the winter and spring preceding the experiments. Spring floods brought fine sediments
into the outer channel of the upper set of six, so this channel began with an elevated
burden of fine sediment, especially in pools. Initial conditions in riffles at the start of the
experiment were a geometric mean particle size of 38.1 mm (95% CI 0.93) and mean
water depth of 8.4 cm (SD 3.2).
6
Experimental treatments
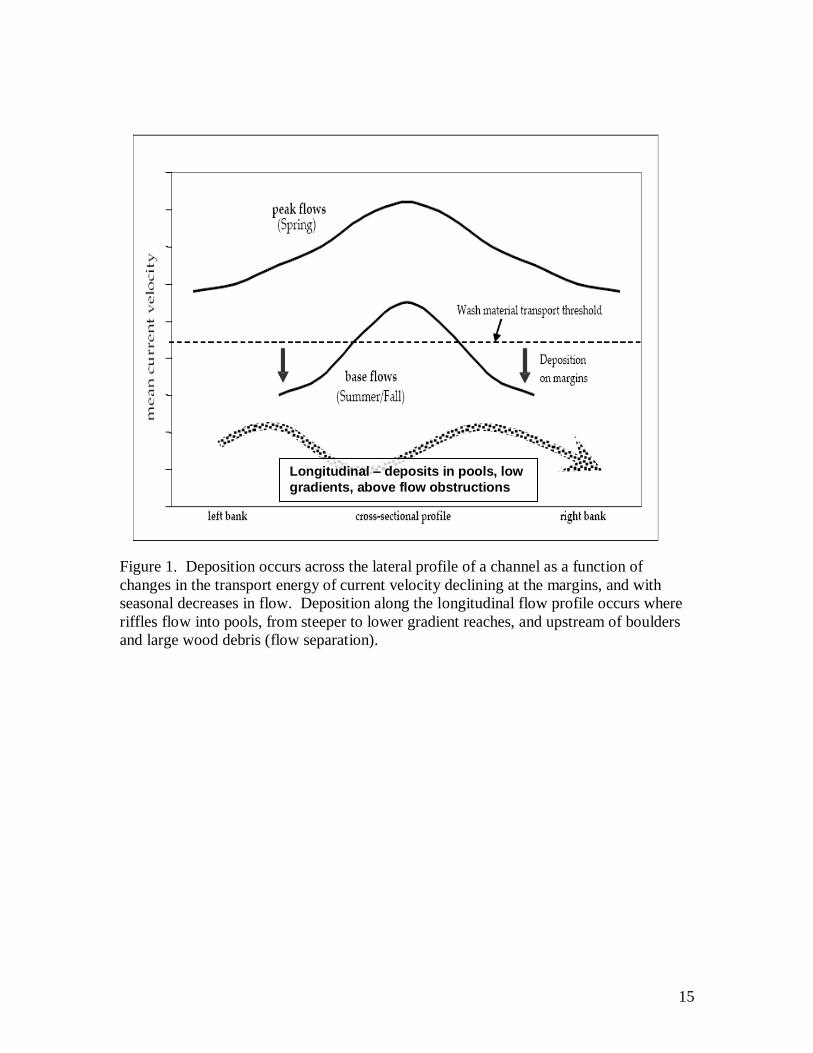
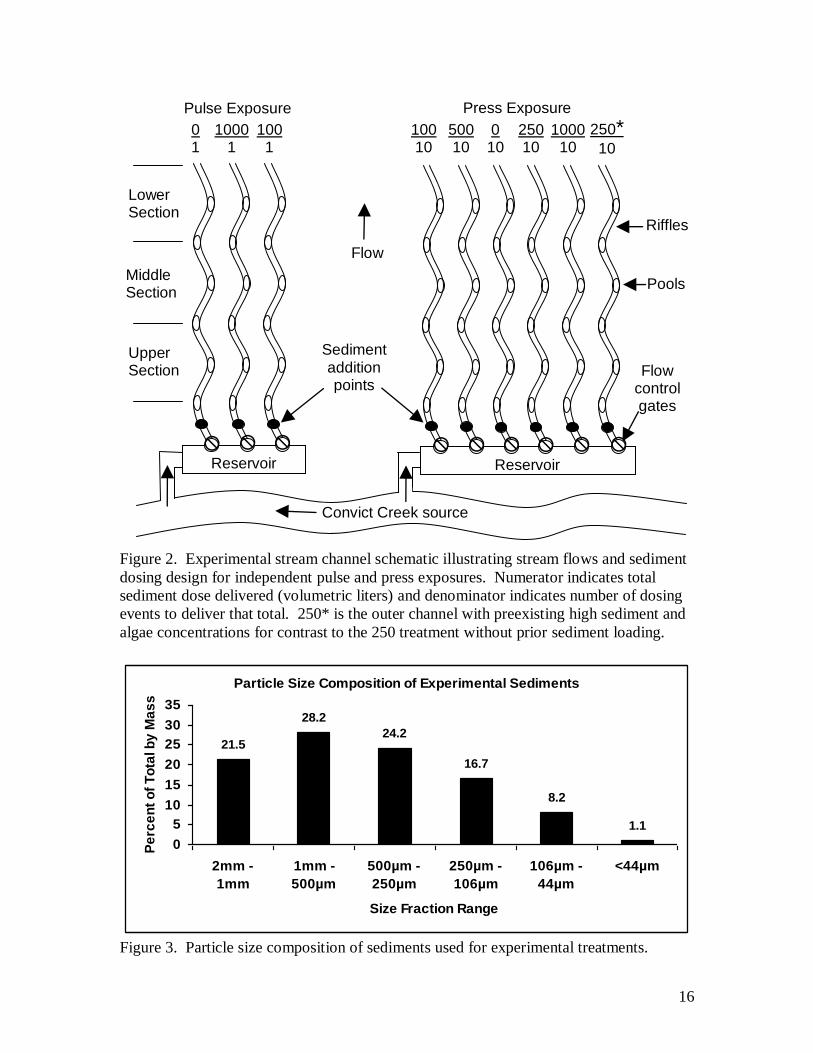
Sediment particles were obtained from a nearby commercial sand and gravel yard.
Only particles passing through a 2 mm sieve were used in the experiment (Fig. 3). We
found that the organic content of this material was less than 0.2% AFDM, and even the
smallest fraction was only 1% organic. On each day of sediment dose addition, the
appropriate volume of sediment for each channel was measured and mixed with water in
a five gallon bucket to create a slurry. This slurry was added manually to each channel at
a constant rate over a two hour period. Larger particles within the size range settled out
as bedload while smaller particles remained in suspension and passed through the system
as washload. A discharge of approximately 30 L/sec (velocity = 25 cm/sec) was selected
as the highest discharge that could be maintained throughout the experiment as the
natural flow of Convict Creek was reduced through the summer.
The levels of sediment exposures tested were 100, 250, 500, and 1000 liters (1 L
= 1.64 kg) of inorganic sediment. This was delivered in the 3-channel set as a single
pulse event of 100 and 1000 liters plus an untreated control (pulse dose experiment
treatments referred to here as 100/1, 1000/1, and 0/1), and in the six-channel set as ten
event pulses given at 4 day intervals (press dose experiment referred to hereafter as 0/10,
100/10, 250/10, 500/10, and 1000/10. Treatments were assigned randomly to channels,
with one control for each treatment group. Possibly related to spring floods that ran over
the ground surface in this area, channel 6 (see Fig 2) exhibited high fine sediment and
algal cover prior to the start of the experiment. In this channel we repeated the 250 liter
treatment (coded as 250/10*) so that responses in this channel could be contrasted with
the other 250 liter treatment channel. While this problem prevented us from assigning
another dose level, it afforded the opportunity to observe the effect of sediment addition
to an already sediment-loaded system.
Physical habitat description
Surveys of water depth and substrate particle size (intermediate width axis) were
taken at five equidistant transects within each riffle and pool section. Each transect
consisted of five equally spaced point-intercepts. These measures permitted comparison
of the extent of treatment effects on channel substrate composition, and were made on
day 0, 30, and 60 of the experiment. In addition, current velocity and depth measures
were taken at the mid-channel thalweg at 1, 25 and 46 days after treatments had begun.
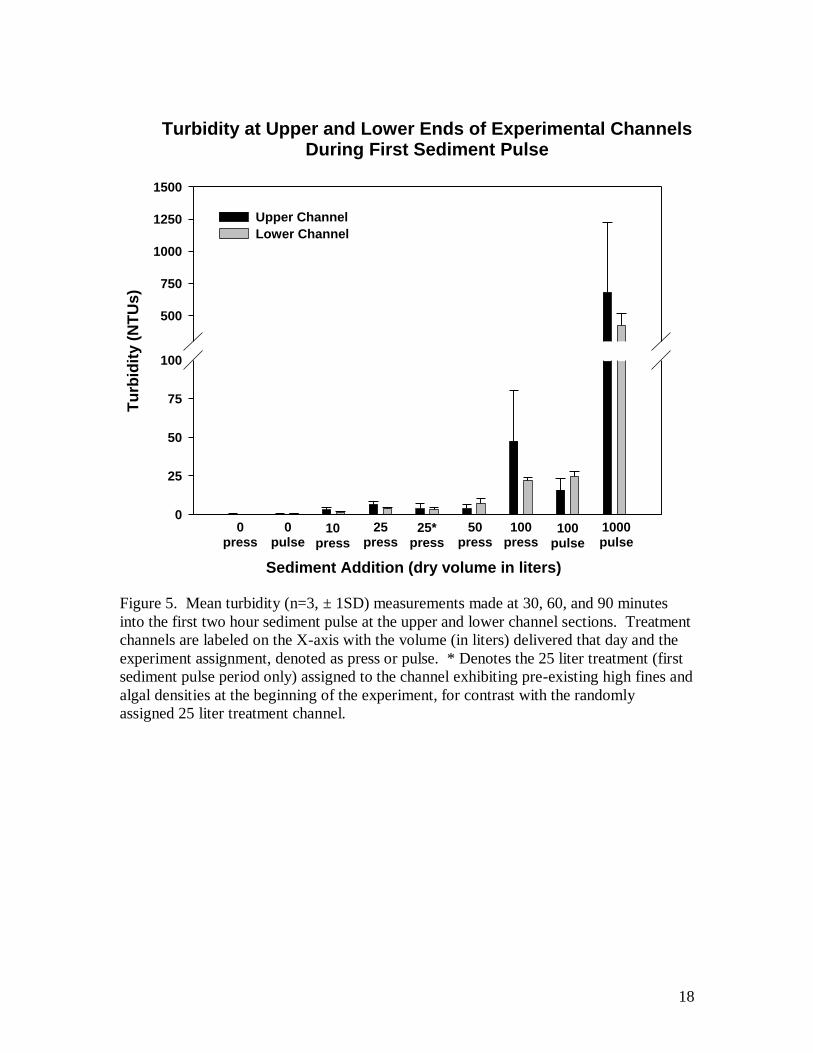
During the initial sediment addition, turbidity measurements were taken at 30, 60, and 90
minutes in the upper and lower portions of each channel to establish the wash load
carried for each treatment event.
The cover of fine and sand particles (<0.25 mm and 0.25 – 2 mm, respectively)
along each experimental channel was also measured before sediment was added, and in
conjunction with each invertebrate sampling event. A 30 × 30 cm grid frame with 25
cross points was centered over six alternating left and right half channel positions within
each of the six riffle segments sampled, for a total of 900 point counts per channel. The
fine-sand counts were made using a plexiglass tube-scope to view the channel bottom.
Biological sampling
Beginning July 24, 2008 benthic invertebrate samples were sampled using a 20 x
20 cm Surber-type frame completely enclosed on all sides by 250 micron mesh netting.
7
An aquarium net 20 cm wide with 100 micron mesh net was placed at the downstream
side and the substrates within the frame disrupted by hand to dislodge organisms that
were swept by the current or hand into this net. Samples were taken on the day before
addition of sediments (day 0), and then on day 1, 10, 30, and 45. The sampling design
divided each channel into an upper, middle, and lower section containing two riffles each.
Four samples were collected from each section (two per riffle, 400 cm2 area each) and
combined into a single collection. The exact location of each sample was recorded to
avoid re-sampling the same area of substrate on subsequent sample dates.
Drift samples were collected over a 24 hour period using a 250 micron drift net
one day before and one day after the initial addition of sediments. Drift nets captured
100% of channel flow and all invertebrates. Samples were preserved in 100% ethanol.
All invertebrate samples were identified in accordance with the standard level of
taxonomic effort established by the Southwest Association of Freshwater Invertebrate
Taxonomists (SAFIT, 2006), with the exception of Chironomidae not being identified
beyond family. Sub-sampling was conducted using a Folsom plankton splitter to obtain a
minimum count of 250 individuals removed from at least 1/16 or more of any sample.
Benthic algae (periphyton) samples were collected on day 0 and 60. From each of
the lower, middle and upper riffle sections, two cobble-size rocks were selected at
random from the 2 riffles in each section. These rocks were combined in a tub and all
surfaces scrubbed clean with a nylon bristle brush into a small volume of water in the tub.
Rock surfaces were rinsed into the pan and their length (L), perpendicular width (W),
height (H), and longest perimeter (LP) dimensions of each were measured to estimate
total surface area (upper surface area = (L*W + L*H + W*H)*(LP/(2(L+W)). The
sample volume was adjusted to a fixed volume of 150 ml and this was then homogenized
in a blender for 30 seconds. Sub-samples of the homogenate were removed with a 20 ml
syringe and this was filtered through 25mm type A/E glass fiber filters (1 micron pore
size), fit in a filter holder, to obtain a sample of algae sufficient for fluorometric analysis
(usually 5-10 ml volumes filtered). Sample filters were kept in darkness, frozen within 2
hours of collection and analyzed after storage. Frozen filters were ground in 95%
ethanol, stored for 12 hours in cold and darkness, mixed and centrifuged for 4 minutes.
The supernatant was read in a Turner model TD-700 fluorometer, and then re-read after
acidification with 6 drops of 0.1 N HCl (to determine phaeophytin content), and the
readings calibrated to chlorophyll standards.
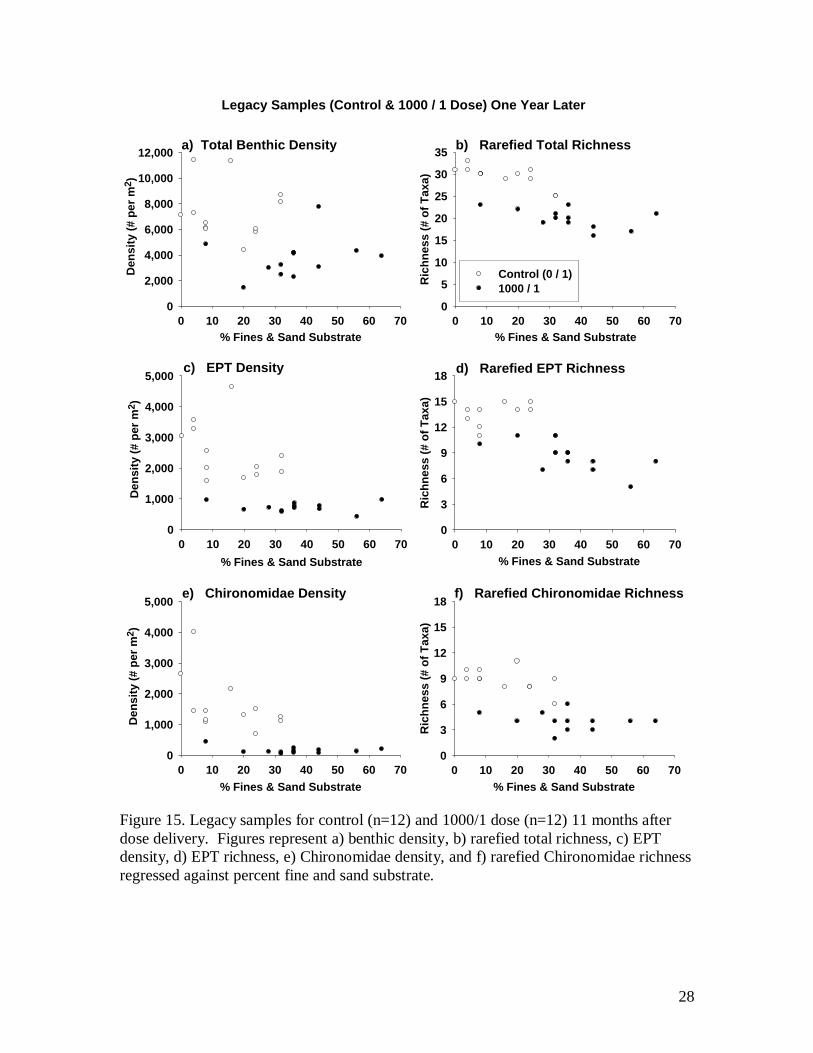
To examine the long term effects of sediment, a set of “legacy samples” were
collected in early June 2009, 11 months after the start of the experiment. Samples were
collected from the control channel (0/1) and the largest pulse dose channel (1000/1).
Two replicate samples were collected from the upper end of each of six riffle sections per
channel (n=12 per channel). Within a 30 x 30 cm area, counts of fine and sand substrate
were made at intersecting grid points (as described previously) prior to collecting
invertebrates from this same location using a D-frame net.
Statistical and exploratory analysis
Richness values were rarefied at our minimum count of 230 organisms using
EcoSim700 (Gotelli and Entsminger 2001) with 1000 iterations of Monte Carlo
randomizations. Rarefied Ephemeroptera, Plecoptera, Trichoptera (EPT) richness was
derived from output provided by EcoSim of the final iteration which listed all taxa, their
8
original richness, and the rarefied richness for that iteration. Indicator taxa were
identified from the indicator taxa analysis routine in PC ORD 5 (McCune and Mefford
2006), using sediment dose as the grouping variable. Total density, rarefied total
richness, and rarefied EPT richness estimates were based on an average of the upper,
middle, and lower sections of each treatment channel. Samples from the upper, middle,
and lower sections do not represent replicates but more accurately capture the average
community structure and illustrate within channel variability as affected by both
suspended load and bed load introduced. This channel average was calculated only for
riffle habitats where all channel section samples were processed. Pool samples represent
only a single value from the upper sections. Dissimilarity among all samples of
composite channel section for each treatment through time was calculated in PC ORD 5
using Bray-Curtis distances. Figures illustrate the amount of cumulative dissimilarity in
macroinvertebrate community structure with respect to the initial community structure
(day 0) before treatments were applied. Non-metric multidimensional scaling (NMDS)
was conducted in PC ORD 5 to identify which taxa were driving the observed
dissimilarity by examining differences between the highest dose level (1000 liters)
compared to control channel changes at the final sample date (day 45) when differences
were most pronounced. Time (day of experiment) was included as a quantitative
variable, and taxa with high time axis correlations and that were both abundant and
common were then examined to determine if they were increasing or decreasing over the
course of the experiment. Differences in legacy samples were tested for using t-tests
assuming unequal variance at a significance level of 0.05. Differences in velocity and
depth were tested for using two factor repeated measures ANOVA conducted in R.
Differences in accumulated fines and sand from day 0 levels were tested for using paired
t-tests in R.
RESULTS
Physical habitat changes
Current velocities varied between 25-35 cm/sec and did not differ among
channels or over time (two factor ANOVA, p = 0.44 and p = 0.73 respectively). Depths
ranged from 8-10 cm and did not differ among channels or over time (two factor
ANOVA, p = 0.89 and p = 0.35 respectively). Although flow and depths were not
altered, sediment treatments changed the physical environment of the experimental
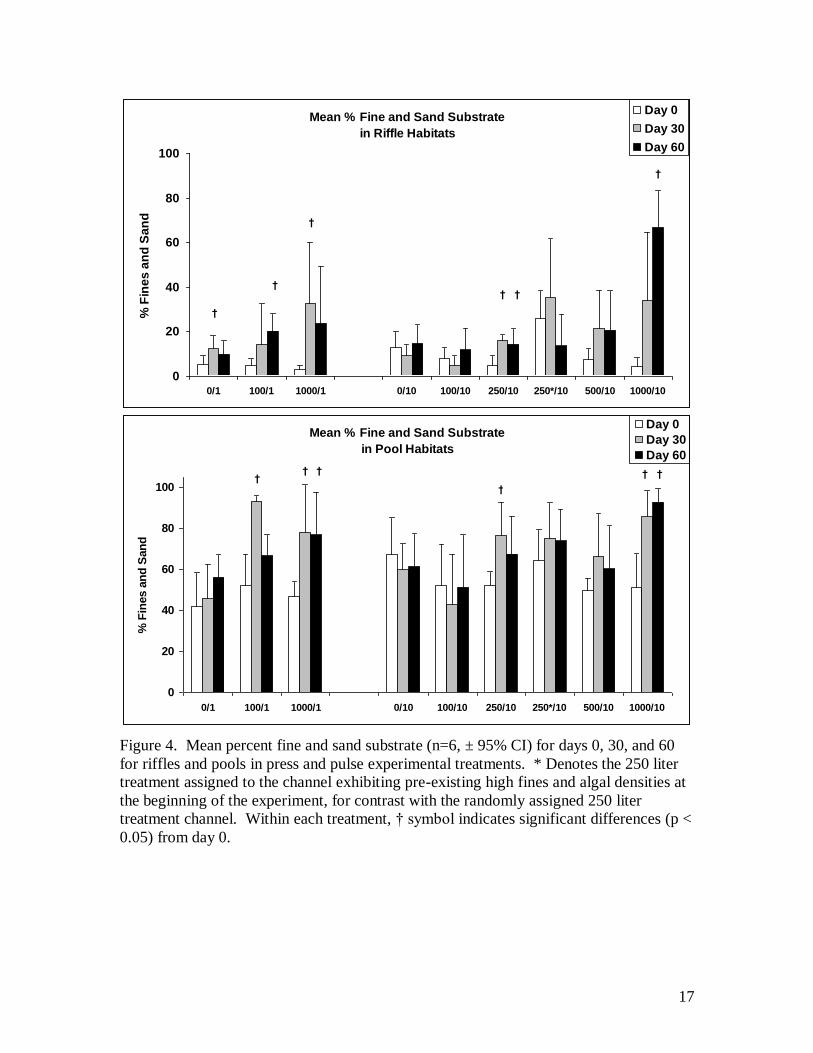
channels in several ways. In riffle habitats, mean values of fines and sand increased in all
but the lowest treatment by day 30, however, this was only significant for 250/10 and
1000/1 treatment (4.7 to 15.9% and 3.2 to 32.6% respectively, p < 0.05 for both; Fig. 4).
Control channel 0/1 also showed a significant increase in fines and sand by day 30 and
may reflect natural background accumulation associated with higher summer flows,
although this was not observed in the 0/10 control. By day 60 fines and sand remained
high in the 250/10, declined in the 1000/1, and increased significantly over day 0 levels
in the 1000/10, and 100/1 treatments (4.1 to 66.6%, and 4.8 to 20.1% respectively, p <
0.05 for both). In pool habitats, mean values of fines and sand also increased in all but
the lowest treatment by day 30 with significant increases in the 250/10, 1000/10, 100/1,
and 1000/1 treatments (Fig 4). By day 60, fine and sand levels remained high in 1000/10
9
and 1000/1 but declined in the 100/1 and 250/10 treatments. Geometric mean particle
size declined in all treatments after sediment addition was reduced from 44 to 13 mm at
the highest (1000/1) dose level (mostly due to deposition in the upper riffles), and mean
pool particle size was reduced from 1.9 to 1.3 mm. The channel with preexisting high
sediment (250/10*) accumulated more fine and snd sediment than the matched treatment
with an increase in fines and sand from 4.7 to 15.8% for the channel with lower initial
fines and sand, and 25.6 to 35.1% in the channel with preexisting fines and algae.
The coverage of fines and sand were attenuated downstream from the application
point, but over the experimental period, sediments were transported out of portions of the
upper and into lower riffles, partly uncovering the rock present on the bed. In the pulse
exposures, the 100 and 1000 liter loads both showed initially high FS compared to
control levels but the high dose FS levels gradually migrated downstream and out of the
channel (Fig. 4). In the press exposures, the gradual additions of sediment resulted again
in higher cover in the upper riffles, accumulating most extensively in the early stages in
the 250/10* treatment which had preexisting high sediments, and also at the 1000/10
treatment where sediments continued to build to high coverage over the length of the
channel (Fig. 4). Turbidity measurements showed that suspended sediment concentration
was elevated during additions of sediment as a function of treatment level (Fig. 5).
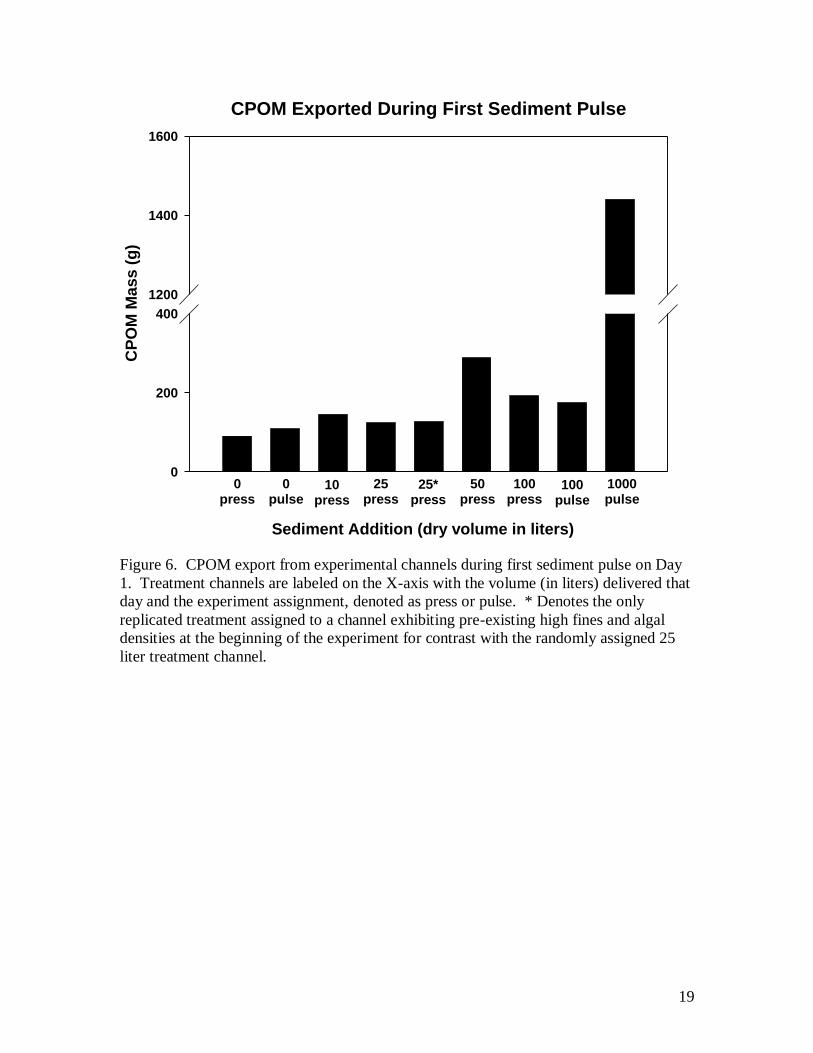
Sediment treatments affected the mass of course particulate organic matter
(CPOM) exported from channels. During the first addition of sediment (day 1) CPOM
exported from channels corresponded roughly to dose (Fig. 6). The mass of CPOM
exported from the 1000/1 treatment was more than 7 times greater than that of the 100/1
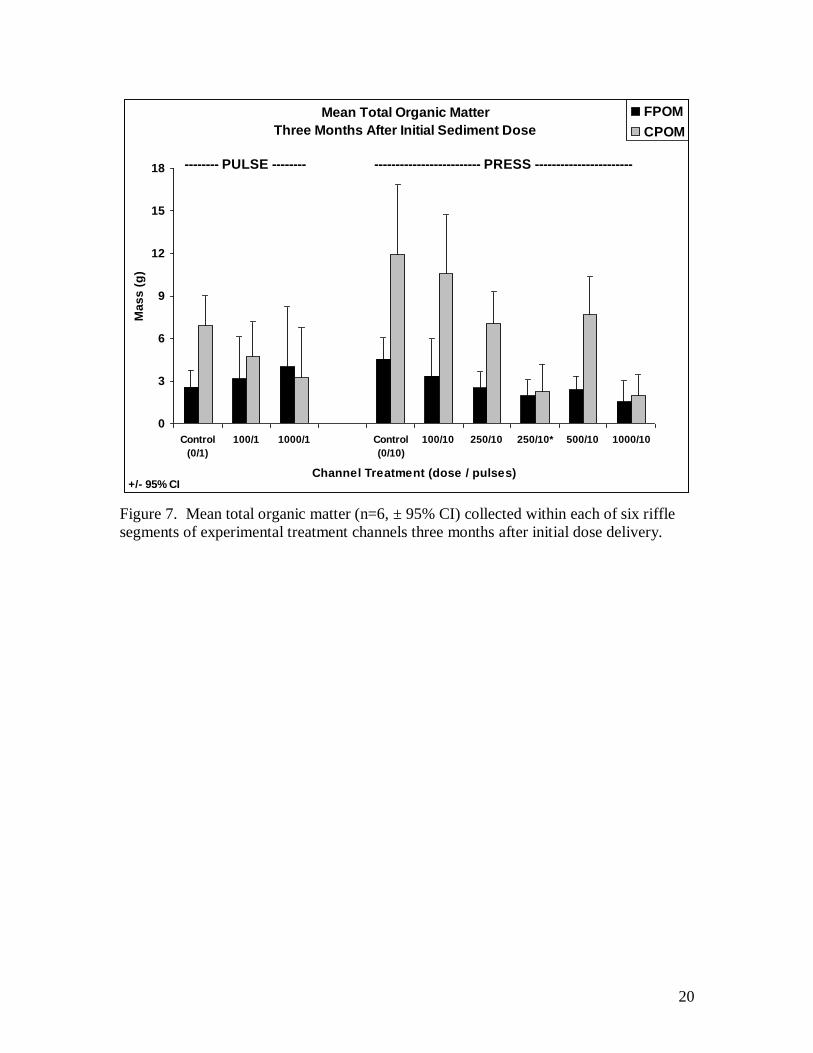
treatment and 15 times greater than that of the control. Organic matter samples taken
three months after the first sediment deliveries indicate a continued depletion in CPOM
with increasing dose and little effect on FPOM (Fig. 7). The lack of overlap between the
means and confidence intervals for the press control relative to both 250* and 1000 liter
dose levels suggest these reductions are statistically significant.
Biological responses
Prior to the application of sediment treatments, channel 6 (see Fig. 2, channel
schematic), where high levels of sediment were already present, had noticeably greater
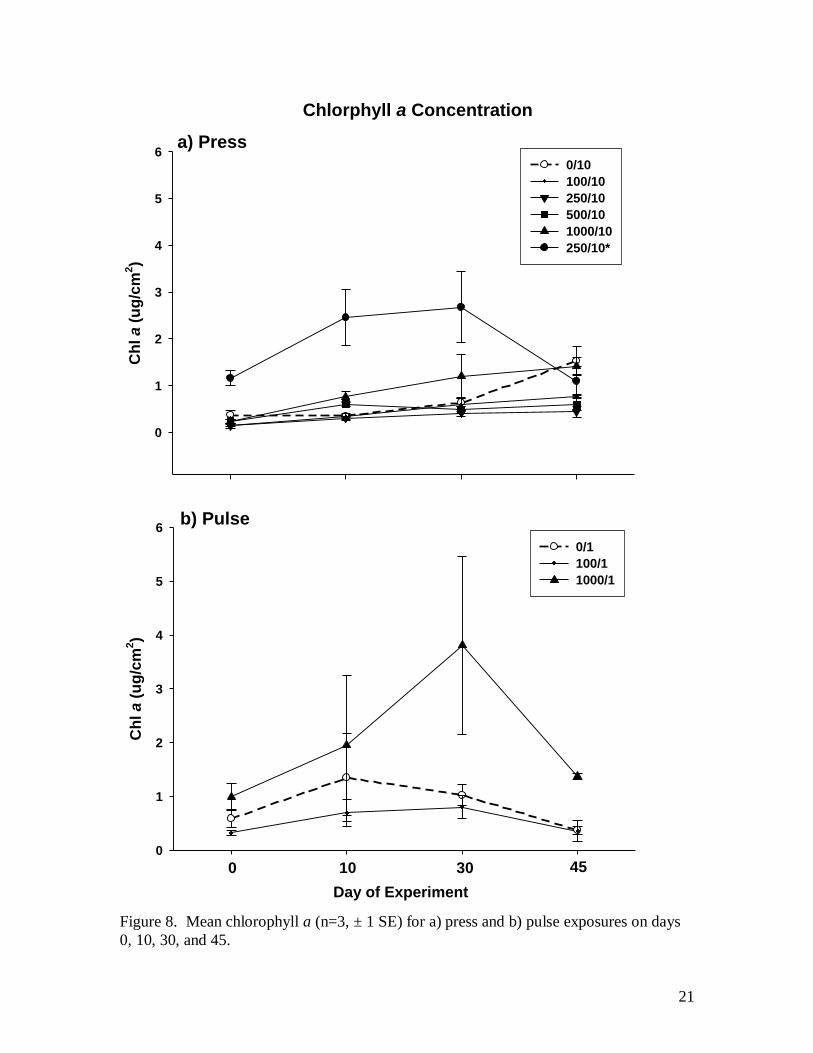
levels of filamentous green algae on day 0 (Fig. 8). Remaining channels had growth of
epilithic diatoms but little filamentous algae. In press exposures, chlorophyll a appears to
increase slightly over the course of the experiment with no effect of sediment treatments
relative to the control except for channel 6 which received a 250 liter dose over the 45
day experiment, but where more sediment appeared to accumulate and was trapped in
algae. In this channel chlorophyll a increased at an initially higher rate then declined
after day 30 to levels similar to the control (Fig. 8). In the pulse exposure, chlorophyll a
also increased over time with change to both the 100 and 1000 liter treatments being
similar to that of the control for the first ten days. Beyond day 10, chlorophyll a in the
1000 liter treatment continued to rise with increasing variability then decline after day 30
but always remaining higher than the control. Filamentous green algae dominated the
periphyton.
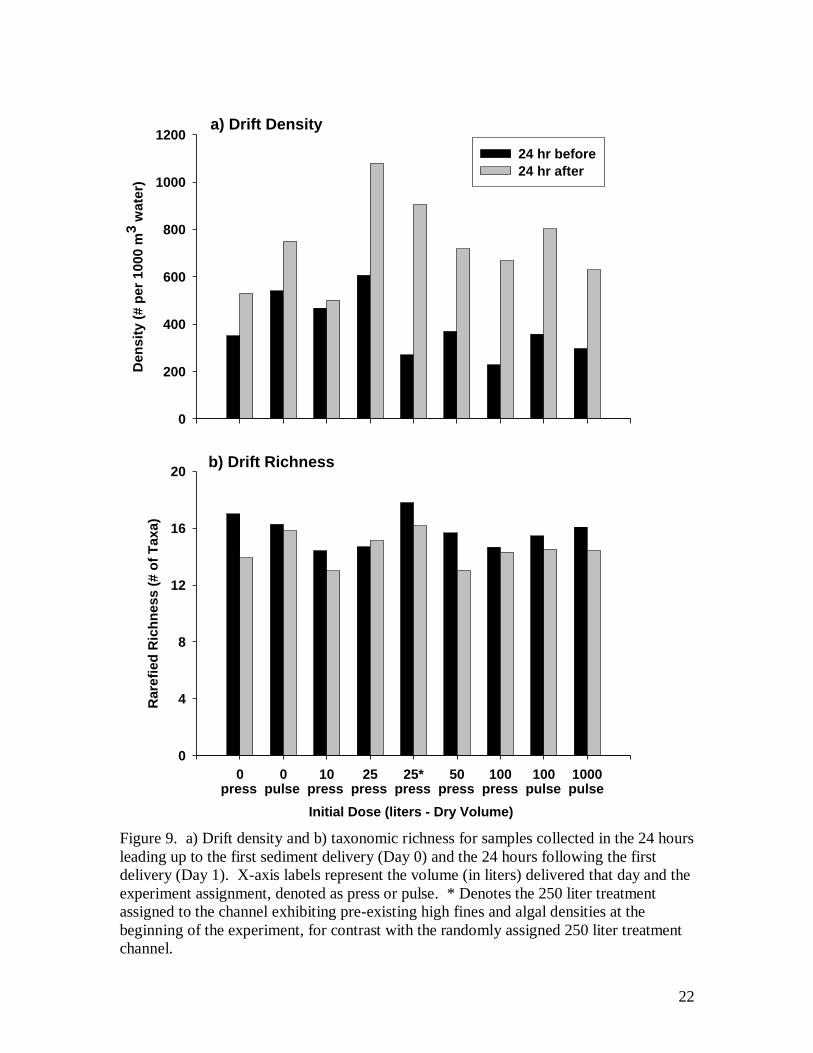
Immediately following sediment delivery there was an increase in drift rate of
invertebrates (Fig. 9). Initial drift rates are presented over a gradient showing both press
and pulse experiments because some applications were the same (e.g., the 100/1 and
10
1000/10 treatment each received the same 100 liter volume dose on Day 1 and are labeled
100-pulse and 100-press respectively). Drift rate increased on day 1 in all treatment
channels and controls. Control channels showed drift increases of 40-50%. The smallest
increase in drift (7%) occurred in the channel receiving 10 liters of sediment while the
largest increase (235%) occurred in the channel with preexisting high sediments
receiving 25 liters. The other treatment adding 25, and at 50 liters, showed drift
increased about 80-90%, while those receiving 100 liters of sediment increased by over
100% and remained at this level in the 1000 liter addition. Three taxa dominated the
drift, together comprising nearly 75% of the total: Simulium (26%), Chironomidae (26%),
and Baetis (21%). Collectively, the drift of these taxa increased on average from day 0 to
day 1 about twice as much among all treatments excluding the lowest (100/10) compared
to the control channels (means of 59 to 149 m-3
hr-1
in treatments and 65 to 111 m-3
hr-1
in
controls). Relative to controls on day 0, no changes in the taxonomic richness of drifting
invertebrates occurred after the initial pulse of sediment (Figure 9b). The per capita drift
emigration rates, as a fraction of overall benthic densities, were less than just 1% export
per day (using riffle area densities and one-half the area of pools to be conservative).
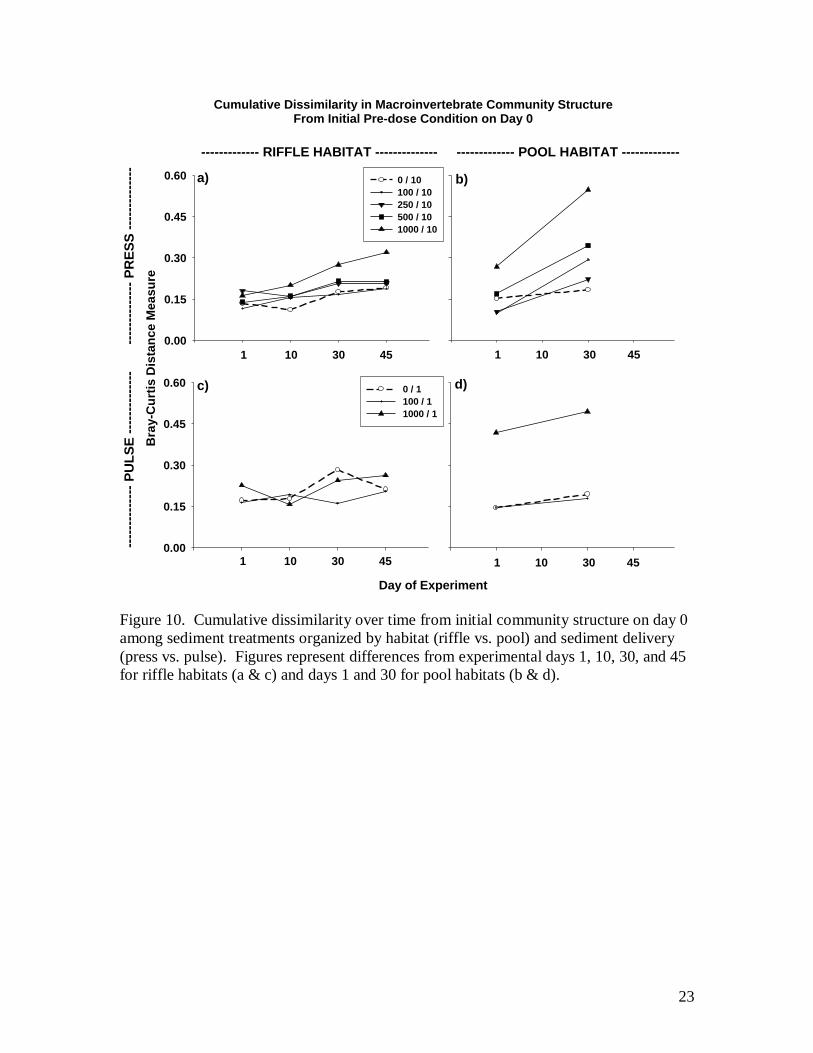
The degree to which macroinvertebrate community structure was altered by
sedimentation was influenced by habitat type (riffle vs. pool), duration of delivery (pulse
vs. press), and magnitude of the dose. Generally, pool habitats were more altered by
sedimentation than riffle habitats, and continuous press delivery changed benthic
communities to a greater extent than did a one time pulse of the same magnitude (Fig.
10). In terms of a habitat specific response, alteration of community structure relative to
initial pre-dose conditions occurred on day 1 in pools following the first of ten press
deliveries and continued to change by day 30 for both the press and pulse (Fig. 10b & d)
Riffle habitats, by contrast, changed little on day 1 and did not accrue noticeable
alteration until day 30-45, and only in the high press exposure (Fig. 10). The effect of
dose was mixed across habitat types with little change in community structure occurring
for the 100, 250, or 500 liter dose in riffle habitats (Fig. 10a) compared to noticeable
change for the same dose levels in pools (Fig. 10b). NMDS analysis identified several
dominant taxa that appear to be driving patterns in community dissimilarity. For
example, Diphetor whose densities increased in control riffles over time as well as the
1000/1 exposure, remained constant in the 1000/10 exposure. Midges (Chironomidae)
were unchanged in riffle habitats; but in pools they increased by 430% in the single pulse
exposure, and were reduced by 88% in the press exposure, but showed little net change in
controls. Flat worms (class Turbellaria) were also relatively unaffected in riffle habitat
but were eliminated in pools receiving the 1000 liter dose regardless of press or pulse
exposure. Several taxa in riffle habitat increased in density in the presence of sediments.
For example, in the 1000 liter press exposure aquatic mites, Baetis, and Optioservus
increased from 20.3 to 96.0, 10.6 to 101.3, and 26.6 to 314.6 individuals per m2
respectively over 45 days. These same taxa also increased in the high dose pulse
exposures relative to pre-treatment levels.
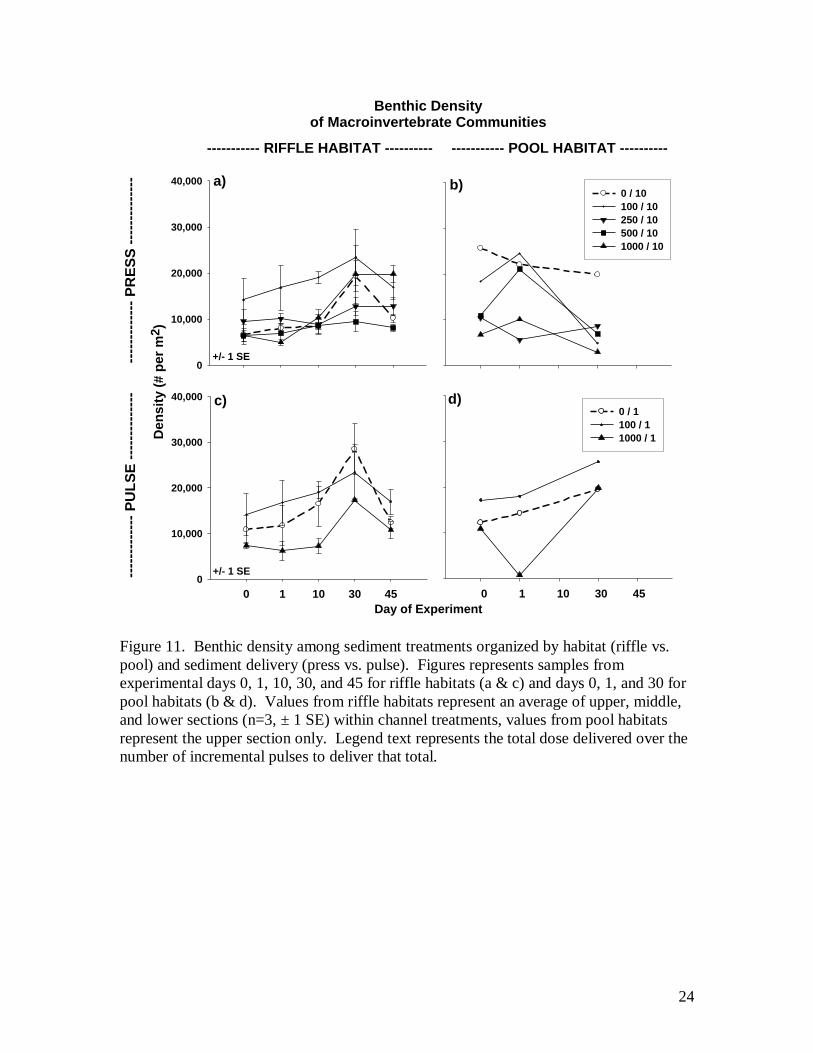
Benthic densities of control channels exhibited a gradual increase over the course
of the 45 day experiment with a spike in density at Day 30 (Fig. 11). Some substantial
differences existed in mean values both within control channels and between channel
sections of controls on day 0 and day 1. These differences were inconsistent in direction
and suggest a highly variable and patchy distribution of invertebrates within and between
11
channel sections. In the case of both press and pulse deliveries, sediment appears to have
had little affect on benthic densities of riffle communities (Fig. 11a & c). The 100 and
500 liter doses appear to have caused an increase in pool densities on day 1 (Fig. 11b).
This is possibly an artifact of the channel design where sediment delivery was occurring
directly above the first sampled pools (see Fig. 2, channel schematic) and may have been
driving invertebrates from the upper riffle into these upper pools. This result was
temporary as densities declined by day 30 resulting in a change similar to the control.
The pool under the 1000-lieter pulse exposure showed a marked decrease in density on
day 1, recovering by day 30 (Fig. 11d). This was not a recovery of community
composition but of density only as it was driven by two opportunistic taxa, midges and
Oligochaete worms. Both taxa were reduced in density by roughly 95% on day 1
followed by a 95X increase by day 30 for Chironomidae and a 32X increase for
Oligochaetes. Remaining taxa changed little or were reduced in density.
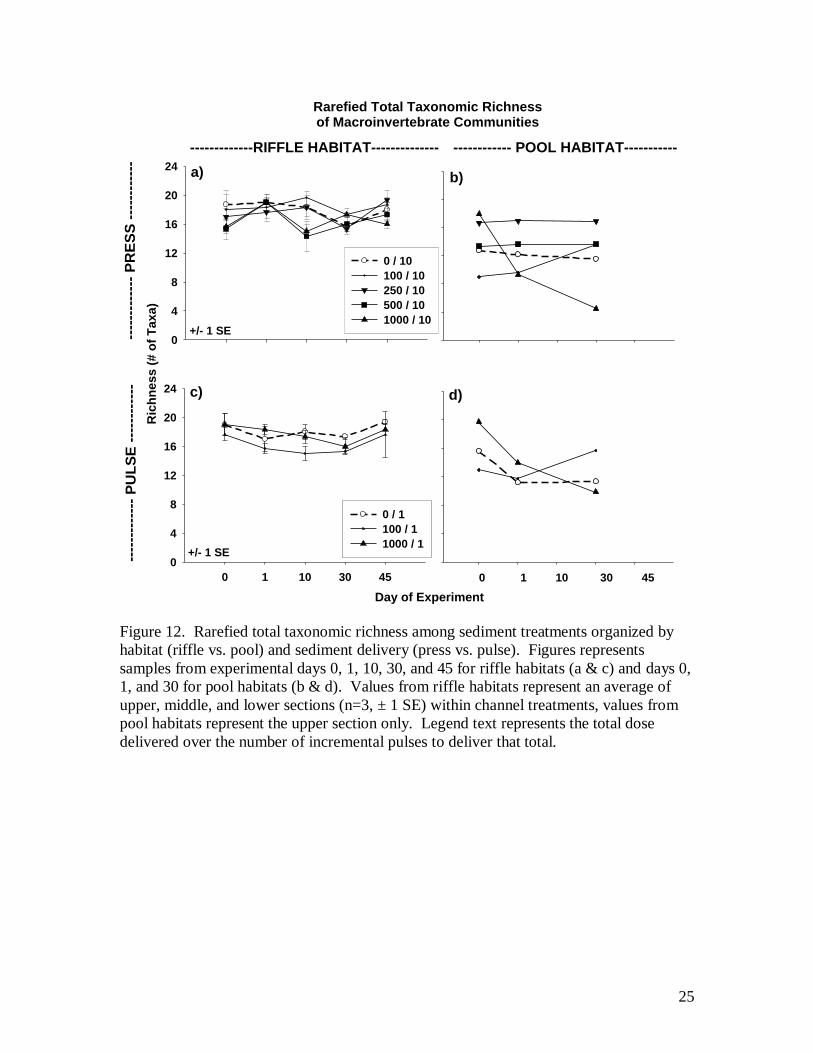
Rarefied total taxonomic richness was not influenced by sediment in riffles, but
pools were depleted at high doses. At the 1000 liter dose level, the press pool decreased
in total richness from 18 to 5 taxa over 30 days (Fig. 12b), and from 20 to 10 taxa in the
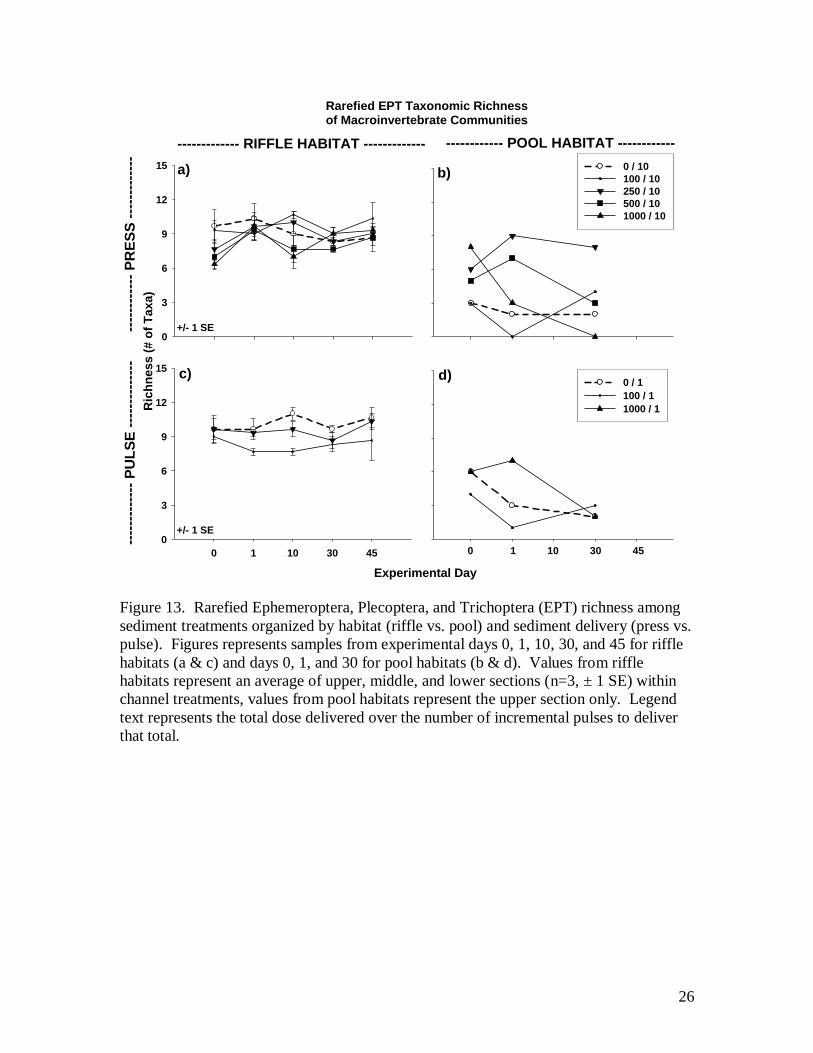
pulse pool. In comparing among channel treatments, rarefied EPT taxonomic richness
was far more variable among pools than riffles (Fig. 13). Similar to total richness, EPT
richness showed no influence of dose relative to controls in riffles, but the press-exposed
1000-liter pool showed a richness decrease from 8 to 0 EPT taxa over 30 days (Fig. 13b).
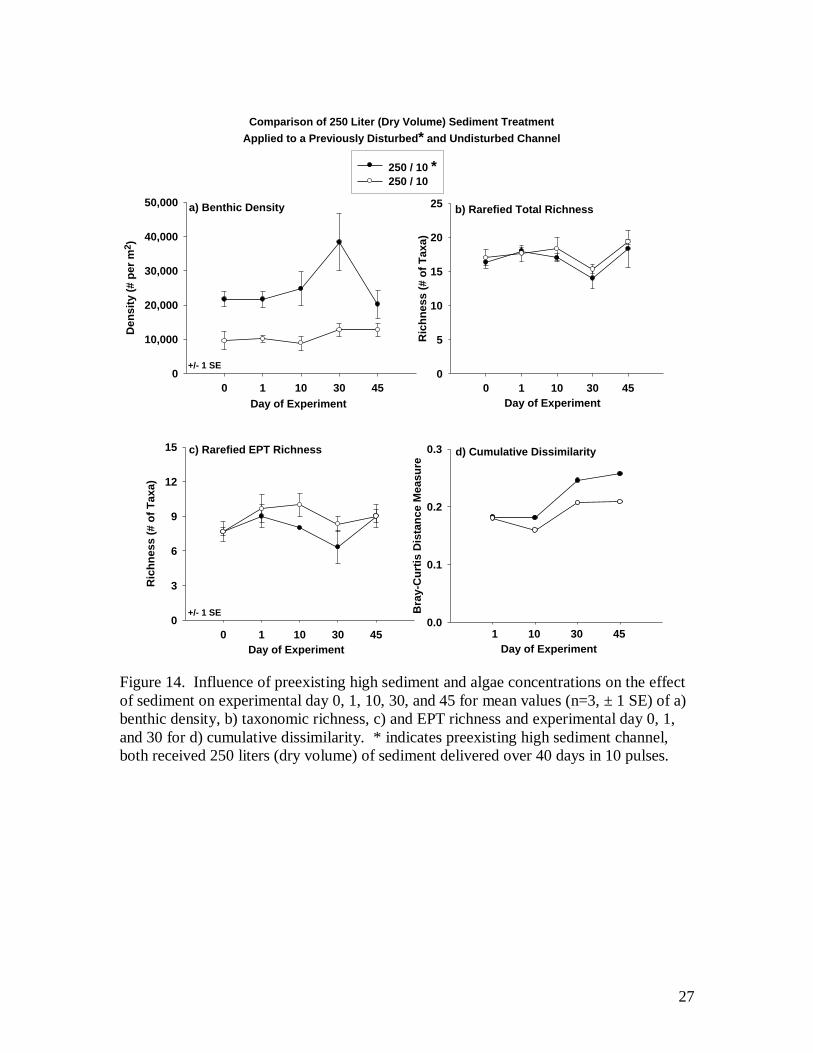
Influence of preexisting high sediment levels
Biological response to sediment differed between the two channels receiving a
250 liter treatment, one with high initial sediment and algae (250/10*) and the other with
lower levels (250/10). Benthic density was initially higher in the 250/10* channel and
exhibited the largest increase in density compared to any other treatment channel at day
30. This high density on day 0 appears to be driven by tolerant dipteran taxa as Bezzia,
Limnophora, and Chironomidae as well as higher densities of Physa snails and an
absence of Ameletus present in the 250/10 channel. Total and EPT richness (Fig. 14b & c
respectively) appear to have been only slightly reduced if at all by the pre-existing high
sediment and algae conditions. Cumulative dissimilarity (Fig. 14d) shows a higher
degree of community alteration over time in the 250/10* channel compared to the 250/10.
Legacy samples 11 months later
Physical habitat measures such as velocities and depths were not measured during
the 11 month post experiment period, however, channel gate controls remained the same
and any variations in flow to these channels occurred equally. All density and richness