79
| Date post: | 06-Apr-2018 |
| Category: |
Documents |
| Upload: | kemal-can-bizsel |
| View: | 226 times |
| Download: | 0 times |
8/2/2019 Benthic Habitat Mapping Guide (NOAA)
http://slidepdf.com/reader/full/benthic-habitat-mapping-guide-noaa 1/79
8/2/2019 Benthic Habitat Mapping Guide (NOAA)
http://slidepdf.com/reader/full/benthic-habitat-mapping-guide-noaa 2/79
GUIDANCE FOR BENTHIC HABITAT MAPPING:AN AERIAL PHOTOGRAPHIC APPROACH
by
Mark FinkbeinerNational Oceanic and Atmospheric Administration
Coastal Services Center
Bill Stevenson and Renee SeamanTechnology Planning and Management Corporation
March 2001
ACKNOWLEDGMENTS
This document is a product of the experience, wisdom, and applied research of theNational Oceanic and Atmospheric Administration’s (NOAA) Coastal Services Center.Many individuals at the federal, state, and local level have contributed to this document.In particular the authors would like to acknowledge Dr. Randolph Ferguson and LisaWood at the NOAA Center for Coastal Fisheries and Habitat Research in Beaufort,North Carolina, for their efforts in developing the original NOAA Coastal Change Analysis Program: Guidance for Regional Implementation document and for their
continuing support of benthic mapping. Frank Sargent of the Florida Fish and WildlifeCommission, Florida Marine Research Institute and Charles Costello of theMassachusetts Department of Environmental Protection have been consistentsupporters of NOAA’s benthic mapping efforts at the Coastal Services Center. Theirlong-term perspective and pragmatic approach to coastal environmental issues havebenefited this document significantly. Dr. Robert Virnstein and Becky Robbins of theSt. Johns River and South Florida Water Management Districts respectively have beeninstrumental in helping shape these methods through collaborative project work. Theauthors also would like to acknowledge the staff of the NOAA Coastal Services Center,in particular Dr. Dorsey Worthy and Steve Raber for their leadership and for making thisdocument possible.
U.S. NOAA Coastal Services Center. 2001. Guidance for Benthic Habitat Mapping: An AerialPhotographic Approach by Mark Finkbeiner [and by] Bill Stevenson and Renee Seaman, TechnologyPlanning and Management Corporation, Charleston, SC. (NOAA/CSC/ 20117-PUB). Available on: U.S.National Oceanic and Atmospheric Administration. Coastal Services Center. Submerged AquaticVegetation: Data Development and Applied Uses. (CD-ROM). (NOAA/CSC/20116-CD). Charleston,SC. 2001.
NOAA/CSC/20117-PUB
8/2/2019 Benthic Habitat Mapping Guide (NOAA)
http://slidepdf.com/reader/full/benthic-habitat-mapping-guide-noaa 3/79
CONTENTS
Acknowledgments . . . . . . . . . . . . . . . . . . . . . . . . . . . . . . . . . . . . . . . . . . . . . . . . . . . . . . i
Introduction . . . . . . . . . . . . . . . . . . . . . . . . . . . . . . . . . . . . . . . . . . . . . . . . . . . . . . . . . . 1
• Objectives of This Document . . . . . . . . . . . . . . . . . . . . . . . . . . . . . . . . . . . . . . 1• What Can Be Mapped Using These Methods . . . . . . . . . . . . . . . . . . . . . . . . . . 2• Document Structure . . . . . . . . . . . . . . . . . . . . . . . . . . . . . . . . . . . . . . . . . . . . . . 4
Image Acquisition . . . . . . . . . . . . . . . . . . . . . . . . . . . . . . . . . . . . . . . . . . . . . . . . . . . . . 6• Mission Specifications . . . . . . . . . . . . . . . . . . . . . . . . . . . . . . . . . . . . . . . . . . . . 7• Environmental Considerations . . . . . . . . . . . . . . . . . . . . . . . . . . . . . . . . . . . . . . 9
Collection of Ground Control Points for Image Rectification . . . . . . . . . . . . . . . . . . . 15• Ground Control Point Selection and Measurement with GPS . . . . . . . . . . . . 15• Alternative Sources of Control . . . . . . . . . . . . . . . . . . . . . . . . . . . . . . . . . . . . . 18
Photointerpretation and Image Analysis . . . . . . . . . . . . . . . . . . . . . . . . . . . . . . . . . . . 20• Recommended Interpretation Decision Rules . . . . . . . . . . . . . . . . . . . . . . . . . 22
Data Development Methods . . . . . . . . . . . . . . . . . . . . . . . . . . . . . . . . . . . . . . . . . . . . 25• Analytical Photogrammetry . . . . . . . . . . . . . . . . . . . . . . . . . . . . . . . . . . . . . . . 25• Soft-Copy Photogrammetry . . . . . . . . . . . . . . . . . . . . . . . . . . . . . . . . . . . . . . . 28• Analog Interpretation . . . . . . . . . . . . . . . . . . . . . . . . . . . . . . . . . . . . . . . . . . . . 30
Editing and Attributing Polygonal Habitat Data . . . . . . . . . . . . . . . . . . . . . . . . . . . . . . 34• Building and Cleaning Polygon Topology . . . . . . . . . . . . . . . . . . . . . . . . . . . . . 34
• Reviewing Edited Polygon Coverages . . . . . . . . . . . . . . . . . . . . . . . . . . . . . . . 37
Field Surveys . . . . . . . . . . . . . . . . . . . . . . . . . . . . . . . . . . . . . . . . . . . . . . . . . . . . . . . 38• Field Equipment . . . . . . . . . . . . . . . . . . . . . . . . . . . . . . . . . . . . . . . . . . . . . . . . 40• Signature Development . . . . . . . . . . . . . . . . . . . . . . . . . . . . . . . . . . . . . . . . . . 41
Data Validation Methods . . . . . . . . . . . . . . . . . . . . . . . . . . . . . . . . . . . . . . . . . . . . . . . 42• Spatial Accuracy . . . . . . . . . . . . . . . . . . . . . . . . . . . . . . . . . . . . . . . . . . . . . . . 42• Thematic Accuracy . . . . . . . . . . . . . . . . . . . . . . . . . . . . . . . . . . . . . . . . . . . . . 45• Temporal Accuracy . . . . . . . . . . . . . . . . . . . . . . . . . . . . . . . . . . . . . . . . . . . . . 47
Supplemental Mapping Technologies . . . . . . . . . . . . . . . . . . . . . . . . . . . . . . . . . . . . . 48• Videography . . . . . . . . . . . . . . . . . . . . . . . . . . . . . . . . . . . . . . . . . . . . . . . . . . . 48• Single-Beam Acoustics . . . . . . . . . . . . . . . . . . . . . . . . . . . . . . . . . . . . . . . . . . 52

8/2/2019 Benthic Habitat Mapping Guide (NOAA)
http://slidepdf.com/reader/full/benthic-habitat-mapping-guide-noaa 4/79
Data Quality Reporting and Documentation . . . . . . . . . . . . . . . . . . . . . . . . . . . . . . . . 59• Spatial Accuracy Requirements . . . . . . . . . . . . . . . . . . . . . . . . . . . . . . . . . . . . 59• Thematic Accuracy Requirements . . . . . . . . . . . . . . . . . . . . . . . . . . . . . . . . . . 59• Other Data Parameters . . . . . . . . . . . . . . . . . . . . . . . . . . . . . . . . . . . . . . . . . . 60• Metadata . . . . . . . . . . . . . . . . . . . . . . . . . . . . . . . . . . . . . . . . . . . . . . . . . . . . . 60
Conclusion . . . . . . . . . . . . . . . . . . . . . . . . . . . . . . . . . . . . . . . . . . . . . . . . . . . . . . . . . 62
References . . . . . . . . . . . . . . . . . . . . . . . . . . . . . . . . . . . . . . . . . . . . . . . . . . . . . . . . . 63
Appendix 1: Sample Project Design . . . . . . . . . . . . . . . . . . . . . . . . . . . . . . . . . . . . . . 68
Appendix 2: Brief Overview of Alternative Mapping Technologies . . . . . . . . . . . . . . . 70
Appendix 3: Flight Planning Chart . . . . . . . . . . . . . . . . . . . . . . . . . . . . . . . . . . . . . . . 73
Appendix 4: Scanned Aerial Photo Worksheet . . . . . . . . . . . . . . . . . . . . . . . . . . . . . . 74
Appendix 5: Ground Control Point Collection Sheet . . . . . . . . . . . . . . . . . . . . . . . . . . 75

8/2/2019 Benthic Habitat Mapping Guide (NOAA)
http://slidepdf.com/reader/full/benthic-habitat-mapping-guide-noaa 5/79
1
INTRODUCTION
This document, Guidance for Benthic Habitat Mapping: An Aerial Photographic Approach , describes proven technology that can be applied in an operational mannerby state-level scientists and resource managers. This information is based on the
experience gained by NOAA Coastal Services Center staff and state-level cooperatorsin the production of a series of benthic habitat data sets in Delaware, Florida, Maine,Massachusetts, New York, Rhode Island, the Virgin Islands, and Washington, as wellas during Center-sponsored workshops on coral remote sensing and seagrass andaquatic habitat assessment.
The original benthic habitat document, NOAA Coastal Change Analysis Program (C-CAP): Guidance for Regional Implementation (Dobson et al.), was published by theDepartment of Commerce in 1995. That document summarized procedures that wereto be used by scientists throughout the United States to develop consistent and reliablecoastal land cover and benthic habitat information. Advances in technology and new
methodologies for generating these data created the need for this updated report,which builds upon the foundation of its predecessor.
Objectives of This Document
The goal of this document is to provide technical guidance to data developers workingto produce digital spatial data on benthic habitat. Using these methods, developers willbe able to produce consistent benthic data suitable for regional comparison andapplication to various coastal management issues.
All mapping efforts are designed to answer specific questions about the environmentand meet objectives specific to a given project. The techniques used in generating amap determine its utility for meeting those objectives. The methods described in thisdocument are designed to meet the following general objectives:
• Produce digital baseline data on the spatial extent and characteristics ofbenthic habitats.
• Produce synoptic data over estuary-sized study areas.• Provide data that optimize the efficiency of further in-situ sampling.• Provide data at a resolution that can contribute to environmental
permitting processes (such as Clean Water Act Section 404 fill
determinations).• Produce data that support change detection over extensive areas.
The technical recommendations are designed to allow some flexibility in the choices ofclassification scheme, remote sensor data source, analysis procedures, and other keyelements that vary regionally; however, all have been applied in various regions of the
8/2/2019 Benthic Habitat Mapping Guide (NOAA)
http://slidepdf.com/reader/full/benthic-habitat-mapping-guide-noaa 6/79
2
country and should be usable with minor modifications in the majority of geographicsettings.
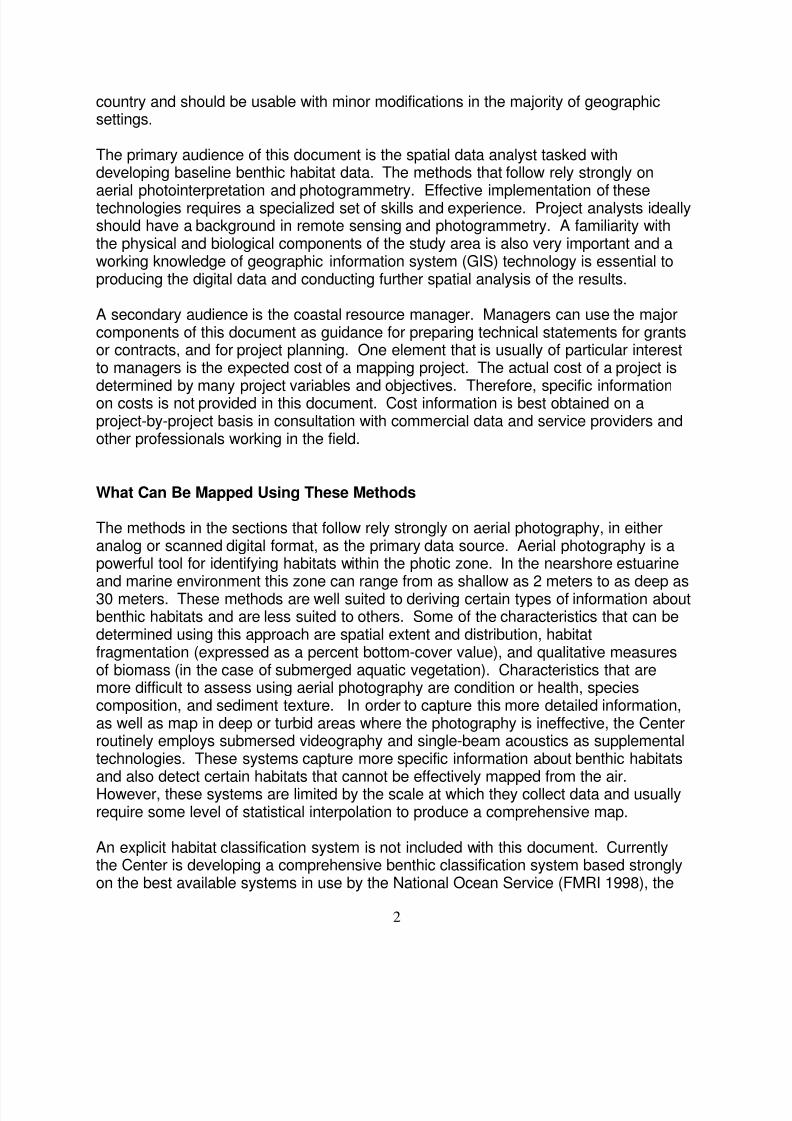
The primary audience of this document is the spatial data analyst tasked withdeveloping baseline benthic habitat data. The methods that follow rely strongly on
aerial photointerpretation and photogrammetry. Effective implementation of thesetechnologies requires a specialized set of skills and experience. Project analysts ideallyshould have a background in remote sensing and photogrammetry. A familiarity withthe physical and biological components of the study area is also very important and aworking knowledge of geographic information system (GIS) technology is essential toproducing the digital data and conducting further spatial analysis of the results.
A secondary audience is the coastal resource manager. Managers can use the majorcomponents of this document as guidance for preparing technical statements for grantsor contracts, and for project planning. One element that is usually of particular interestto managers is the expected cost of a mapping project. The actual cost of a project is
determined by many project variables and objectives. Therefore, specific informationon costs is not provided in this document. Cost information is best obtained on aproject-by-project basis in consultation with commercial data and service providers andother professionals working in the field.
What Can Be Mapped Using These Methods
The methods in the sections that follow rely strongly on aerial photography, in eitheranalog or scanned digital format, as the primary data source. Aerial photography is apowerful tool for identifying habitats within the photic zone. In the nearshore estuarine
and marine environment this zone can range from as shallow as 2 meters to as deep as30 meters. These methods are well suited to deriving certain types of information aboutbenthic habitats and are less suited to others. Some of the characteristics that can bedetermined using this approach are spatial extent and distribution, habitatfragmentation (expressed as a percent bottom-cover value), and qualitative measuresof biomass (in the case of submerged aquatic vegetation). Characteristics that aremore difficult to assess using aerial photography are condition or health, speciescomposition, and sediment texture. In order to capture this more detailed information,as well as map in deep or turbid areas where the photography is ineffective, the Centerroutinely employs submersed videography and single-beam acoustics as supplementaltechnologies. These systems capture more specific information about benthic habitatsand also detect certain habitats that cannot be effectively mapped from the air.However, these systems are limited by the scale at which they collect data and usuallyrequire some level of statistical interpolation to produce a comprehensive map.
An explicit habitat classification system is not included with this document. Currentlythe Center is developing a comprehensive benthic classification system based stronglyon the best available systems in use by the National Ocean Service (FMRI 1998), the
8/2/2019 Benthic Habitat Mapping Guide (NOAA)
http://slidepdf.com/reader/full/benthic-habitat-mapping-guide-noaa 7/79
3
U.S. Fish and Wildlife Service (Cowardin et al. 1979), and various state naturalresource agencies. Nevertheless, some discussion about what habitats can bemapped using these methods is needed. The following habitats can be reliablymapped using aerial photography:
• Seagrass meadows, both patchy and continuous cover• Coral reefs• Unconsolidated sediments• Shellfish beds, oyster and mussel• Hard bottom areas, soft corals, sponges, etc. on consolidated substrate• Macro algal beds and drift algal accumulations
The following are examples of some of the habitats that are more difficult to map usingaerial imagery. These may require use of alternative technologies to map.
• Low biomass submerged aquatic vegetation (SAV), such as species in the
genus halophila (videography)• Clam beds (videography)• Bacterial mats (videography)• Worm tubes (videography and single-beam acoustics)• Shrimp burrows (videography and single-beam acoustics)
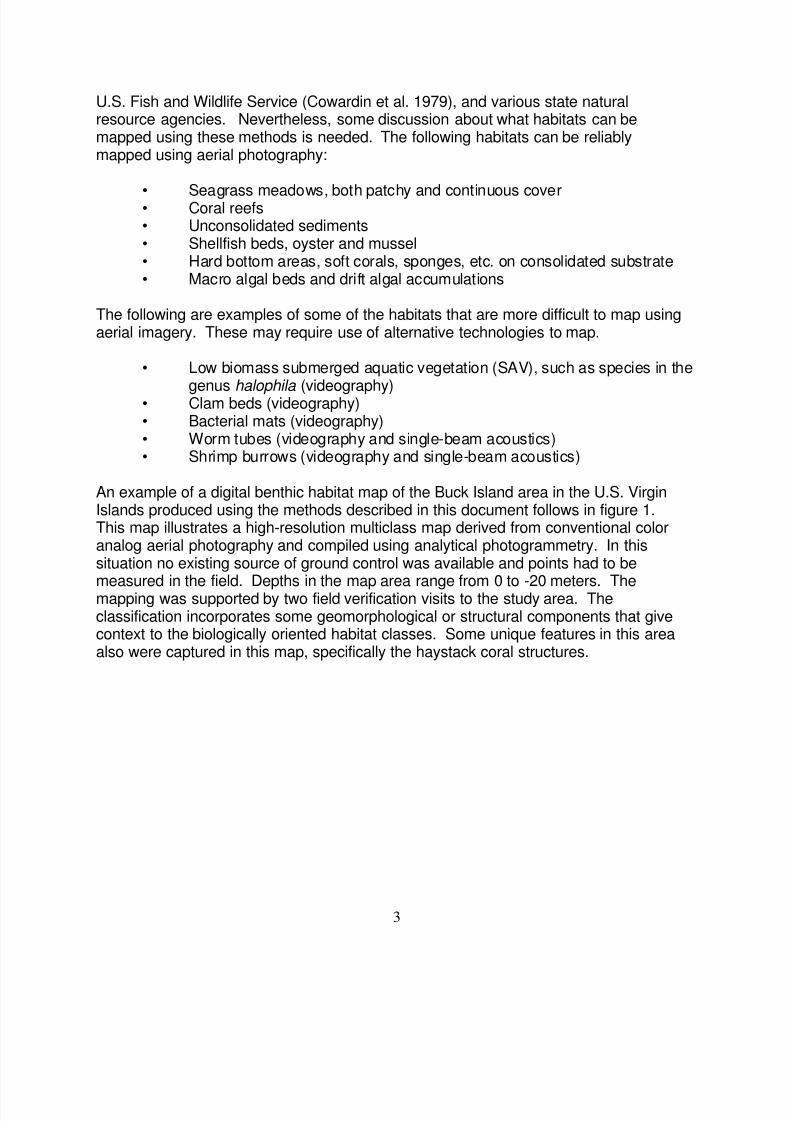
An example of a digital benthic habitat map of the Buck Island area in the U.S. VirginIslands produced using the methods described in this document follows in figure 1.This map illustrates a high-resolution multiclass map derived from conventional coloranalog aerial photography and compiled using analytical photogrammetry. In thissituation no existing source of ground control was available and points had to be
measured in the field. Depths in the map area range from 0 to -20 meters. Themapping was supported by two field verification visits to the study area. Theclassification incorporates some geomorphological or structural components that givecontext to the biologically oriented habitat classes. Some unique features in this areaalso were captured in this map, specifically the haystack coral structures.
8/2/2019 Benthic Habitat Mapping Guide (NOAA)
http://slidepdf.com/reader/full/benthic-habitat-mapping-guide-noaa 8/79
8/2/2019 Benthic Habitat Mapping Guide (NOAA)
http://slidepdf.com/reader/full/benthic-habitat-mapping-guide-noaa 9/79
5
• Supplemental Technologies: guidance for applying two technologies tocomplement the remotely-derived data.
• Data Validation and Metadata: documenting the data for future use.
A sample project plan is included as Appendix 1 that also outlines some of the major
topics that should be considered during the project planning step. The Centerrecognizes that there are a variety of technologies and approaches to benthic habitatmapping. Several of these have great promise for meeting the mapping objectivespreviously listed. A brief discussion of some of these technologies is presented inAppendix 2. Additional appendices include tables that can assist with flight planning,scanning and ground control point documentation.
Just as the 1995 implementation document required updates due to changes intechnology, these methods will be supplemented and revised based on technologicaladvances, emerging environmental issues, and the needs and capabilities of thecoastal management community. Users of this document are strongly encouraged to
consult with the Center’s benthic habitat mapping project Web page(www.csc.noaa.gov/crs/bhm ) for the latest updates and technical guidance.
8/2/2019 Benthic Habitat Mapping Guide (NOAA)
http://slidepdf.com/reader/full/benthic-habitat-mapping-guide-noaa 10/79
6
IMAGE ACQUISITION
No element of a benthic mapping effort is more critical to project success thancollecting source photography at the proper specifications and under the optimalenvironmental conditions. Following these procedures and carefully addressing the
environmental variables will have a profound effect on the quality of any mapping.Failure to consider them can make mapping impossible. The following sections havebeen drawn from the 1995 report (Dobson et al. 1995) and were developed based onchange detection pilot work by Dr. Randolph Ferguson and Lisa Wood of the NOAACenter for Coastal Fisheries and Habitat Research at Beaufort North Carolina. Theseguidelines have proven themselves in every subsequent Center project. They remainessential for successful benthic mapping. As discussed in the 1995 report, benthichabitat mapping is primarily a photogrammetric task relying on aerial photography asthe primary data source. Aerial photography has been successfully used for benthicmapping of diverse habitats (Sheppard et al. 1995; Hopley 1978) and it has thefollowing advantages for mapping aquatic habitat:
• It provides wide area synoptic coverage amenable to mapping.Depending on the scale, a typical aerial photograph provides a planimetric(map-based) view of several square kilometers of the ground at consistentresolution.
• It is readily obtainable throughout the nation through either federal, stateor private sources. A strong commercial aerial survey industry exists thatcan collect new imagery, and several national archives contain historicalimagery that is available to the public.
• It is easily integrated into the coastal management process. Photographyis already commonly used to address other coastal management issues
such as shoreline and coastal development. This data source is familiarto the coastal management community and has been accepted into thelegal process.
• It can be obtained when environmental conditions are optimal. Sufficientaircraft/camera services are available so that a mission can be held onstandby until conditions are right.
• It provides sufficient spectral and superior spatial resolution for detectingsubtle submerged features. Depending on scale, this imagery producesan image that the human eye can easily interpret and resolves featuressmaller than 1 meter.
The image acquisition process consists of two components: 1) setting projectacquisition specifications, and 2) addressing environmental considerations.Discussions of both follow.
8/2/2019 Benthic Habitat Mapping Guide (NOAA)
http://slidepdf.com/reader/full/benthic-habitat-mapping-guide-noaa 11/79
7
Mission Specifications
FilmThe recommended film has been Aerocolor 2445 color negative film. However, Kodakis now producing Aerocolor film 2444. This film has been applied in a Center benthic
mapping project in coastal Massachusetts and initial results indicate a slightimprovement over 2445. Another good choice is Aerochrome 2448 color reversal film.This film has a slower effective aerial film speed that reduces its ability to image darkersubmerged features but since it is a reversal film it provides a first generation productfor interpretation.
Aerographic 2405 black and white negative film has a sufficient spectral range to beuseful for benthic mapping as well, although the loss of color hampers the ability todiscriminate between certain bottom types and between dark bottoms and deeperwater. Anti-vignetting filters are recommended on all these films. Haze filters (WrattenHF-3 or 2B) are also strongly encouraged to minimize the degrading effect of haze on
photographic images. These filters can be used with 2445 and 2448 films. Aerocolor2444 has an integral ultraviolet filter and normally does not require additional filtering.Polarizing filters subdue reflections from the water surface. However, theireffectiveness is influenced by sun angle, and the use of polarizing filters also affectscolor saturation of the film. It should be noted that comparable medium- to high-speedaerial films are available from other sources as well.
Infrared film is generally not recommended for delineating benthic habitats. In a NorthCarolina pilot project, with tandem cameras, Aerochrome 2443 false color infrared filmwas much less effective than color film at recording benthic features in shallow,moderately turbid water. Near-infrared light is absorbed in only a few decimeters of the
water surface, and red wavelengths only penetrate to depths of a few meters (Lillesandand Keifer 2000). Conventional color film gives more information than either black-and-white or infrared film, and can be critical for initial mapping attempts in new or unfamiliarareas. This film may permit identification of species in some tropical, clear water areas.
Color negative film also appears to be better than color reversal or black-and-white filmfor identification of habitat under moderately turbid or hazy conditions. Colortransparencies (diapositives) are dimensionally stable and are most amenable toillumination of dark areas of the photograph for viewing under magnification. Paperprints are not as dimensionally stable as transparencies (i.e., they are subject tostretching and shrinking) and typically have lower spatial resolution than diapositivesdue to a lower density of silver halide grains. However, paper prints don’t requirebacklighting, which makes them more useful in the field.
Flight Line Orientation and Overlap/SidelapFlight lines can be planned using U.S. Geological Survey (USGS) 7.5-minute quads,which at 1:24,000 provide good detail for developing a flight map. NOAA nauticalcharts should also be consulted in setting up a flight plan since they depict bathymetry
8/2/2019 Benthic Habitat Mapping Guide (NOAA)
http://slidepdf.com/reader/full/benthic-habitat-mapping-guide-noaa 12/79
8
and can indicate areas where submerged aquatic vegetation (SAV) or other importantbenthic habitats may be located.
Occasionally, airspace is restricted for military or other use. These restrictions areusually indicated on aeronautical charts, which will likely be used by the flight crew
during the actual mission. Reconnaissance flights can provide valuable perspective onhabitat distribution if timed to optimize visualization of shallow bottoms. Ideally, eachphotograph in a flight line records sufficient cultural and shoreline features to registerthe image to a base map, or support a digital rectification process, about one-third ofthe exposure. This permits correction of photographic scale and orientation to theexternal reference system. At a scale of 1:24,000 (1 inch = 2,000 feet), a standard 9inch by 9 inch aerial photograph has a coverage of 18,000 feet by 18,000 feet. Largeareas of open water require parallel flight lines. These should be oriented such thatthey support bridging of control points if aerotriangulation is planned, or to maximize theamount of land features that will assist in image rectification.
Overlap of photographs includes endlap of adjacent photographs along a flight line andsidelap of photographs along parallel flight lines. Sixty percent endlap allowsstereoscopic interpretation, facilitates interpretation from the most central region of thephotographs, and usually compensates for loss of coverage due to sun glint in thephotographs. In certain instances where sun glint is expected to be a problem endlapcan be increased to 80 percent to ensure that glint does not prevent interpretation ofcertain areas. Sidelap of 30 percent ensures contiguous coverage of adjacent flightlines and produces a block of aerial photographs that may be subjected tophotogrammetric bundle adjustment if necessary. It also supports the use of passpoints for those using photogrammetric data development methods.
ScalePhotography should be obtained at a scale appropriate to the areal extent of habitat,local water conditions, type of habitat being studied, and resolution requirements for theresultant data. Determining a mission scale requires a compromise between resolutionsufficient to detect small features, coverage of habitat with land features sufficient forhorizontal control, and cost. Photographic scale for benthic mapping normally rangesfrom 1:12,000 to 1:48,000. For most estuaries, a scale of 1:24,000 represents a goodbalance between area coverage and small-feature detection. This scale also matchesthe USGS 7.5-minute topographic quad maps. For chronically turbid estuarine orbrackish water areas, 1:12,000 or larger scale photographs obtained at times ofminimal turbidity may be required for acceptable visualization of submerged features.Small-scale (higher altitude) photography may be necessary to bridge habitatdelineated in larger-scale (low altitude) photographs to local horizontal control points onadjacent land feature that are not included in the larger-scale photos. GlobalPositioning System (GPS) instruments on board the airplane to position photographiccenters during exposure may be used to reduce this limitation of larger-scalephotography. For extensive areas of relatively clear water such as the Florida Keys, ascale of 1:48,000 may be sufficient and cost-effective.
8/2/2019 Benthic Habitat Mapping Guide (NOAA)
http://slidepdf.com/reader/full/benthic-habitat-mapping-guide-noaa 13/79
9
Metric CamerasThe Center recommends the use of USGS-calibrated metric aerial framing cameras asa primary sensor for benthic mapping. These cameras have the highest quality opticlenses and are specially designed to strict tolerances to produce finely detailedphotographs. The exact camera geometry is also recorded in the camera calibration
report. These reports are available from the U.S. Geological Survey and provide ameasure of the distortion and specifications for each camera/lens system. Thisinformation is critical to all photogrammetric applications, where the objective is toremove radial distortion inherent in the image, topographic displacement, and theeffects of aircraft tilt from the image before compiling a map. These effects areaccounted for in the photogrammetric orientation process and are recorded directlywhen the aircraft employs a GPS and an Inertial Motion Unit. Normal aerial surveymission specifications require that tilt be less than 4 degrees, crab be less than 3degrees, and both together not exceed 5 degrees (American Society ofPhotogrammetry and Remote Sensing - Draft Standards for Aerial Photography, 1995).Distortions greater than these can cause offsets in the apparent horizontal locations of
features both above and below the water surface.
Environmental Considerations
Knowledge of the study area is important to a successful project. This informationincludes the following:
• The benthic communities likely to be present• The general bottom characteristics in the area• The plant species comprising any SAV
• The morphology and phenology of these plants• The depth ranges and location of known habitats• Locations with water depth potentially suitable for habitat• The types and locations of features that may confuse photointerpretation• The seasonality of turbidity, weather, and haze• Daily patterns in wind speed and direction, and progression of sun angle
through the day• Daily and seasonal tidal regimes
Primary and secondary seasonal windows and the day and time of conductingphotography should be selected to optimize the visibility of habitat in the photography.Water bodies in different locations and at different times of the year will be more or lesssensitive to surface waves, turbidity from local runoff, plankton blooms, and localresuspension of sediment. Tidal currents and temperature gradients can also result inmaterial being suspended in the water column. Seasonal and daily trends for haze,cloud cover, and wind direction, duration and velocity should be included in planning forphotography. The decisions of when to have the aircraft arrive at the study area (withinthe seasonal window) and when to collect photography should be based on NOAA
8/2/2019 Benthic Habitat Mapping Guide (NOAA)
http://slidepdf.com/reader/full/benthic-habitat-mapping-guide-noaa 14/79
10
National Ocean Service tide tables, local knowledge of factors affecting water clarityand depth, observation of recent weather patterns (precipitation and wind direction andspeed), and water clarity. The decision to photograph should be based on groundobservations of conditions on the day of the mission and finally on observations by theflight crew while in the air. It is critical to a project’s success that specific individuals be
charged with making these determinations (one ground crew and one flight crew), andthat these individuals remain in close contact. In most instances the ground-crewmember will be the mapping project leader. The flight-crew member will often be partof an aerial survey company. Both individuals must have a common appreciation of theimportance of proper environmental conditions to mission success.
Project plans should allow two or three months for primary and secondary photographicwindows to assure the occurrence of optimal conditions for photography. For single-day missions it may be possible to have the plane and flight crew fly to the study areaon the day of photography. In the North Carolina pilot project, staging of the plane andflight crews to the study area several times for periods of several days was required to
complete missions involving more than one day of actual photography.In tropical clear-water areas these windows can probably be greatly reduced, while inthe Pacific northwest they may have to be doubled.
The decision to fly should be driven primarily by atmospheric conditions (clouds), waterclarity, and tidal stage. Other conditions should be optimized as much as possible oncethese variables have been addressed.
PhenologyAll other conditions being acceptable, the best time of year to acquire photography isduring the season of maximum biomass or flowering of dominant species. Considering
the phenologic overlap, that is the season when most plants or communities are at theirpeak, for the entire community. This peak is June for the SAV of the Pacific Northwestand Atlantic Northeast, April and May for the southeastern U.S., and September formost of the other species of SAV in the eastern U.S. While biomass may be highduring the summer months, in many areas the strong potential for runoff fromconvective storms and haze during this season limits the ability to acquire adequatephotography.
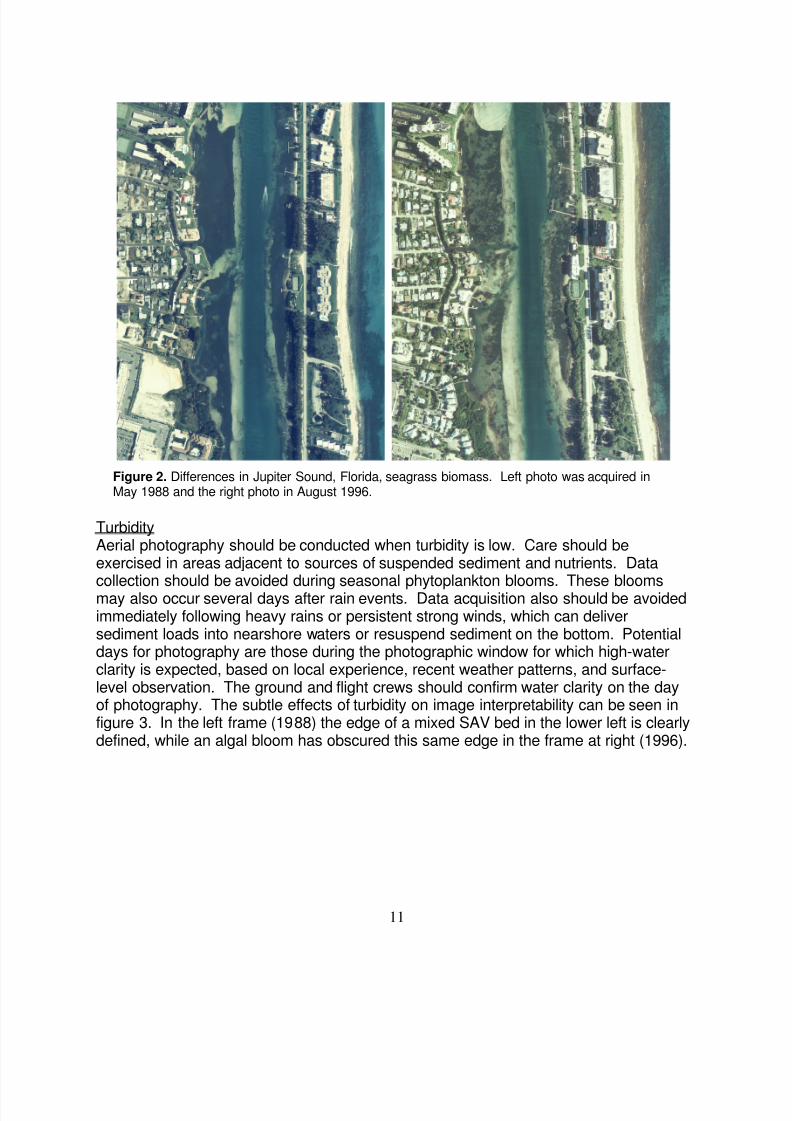
Figure 2, on the following page, illustrates the apparent differences in habitat that canresult from changes due to phenological stage of seagrass. The frame on the left wasacquired in the spring while manatee grass was in full foliage. The frame to the rightwas acquired later in the season when above-ground biomass had acquiesced (diedback). There is no real loss of seagrass between the two dates.
8/2/2019 Benthic Habitat Mapping Guide (NOAA)
http://slidepdf.com/reader/full/benthic-habitat-mapping-guide-noaa 15/79
11
Figure 2. Differences in Jupiter Sound, Florida, seagrass biomass. Left photo was acquired inMay 1988 and the right photo in August 1996.
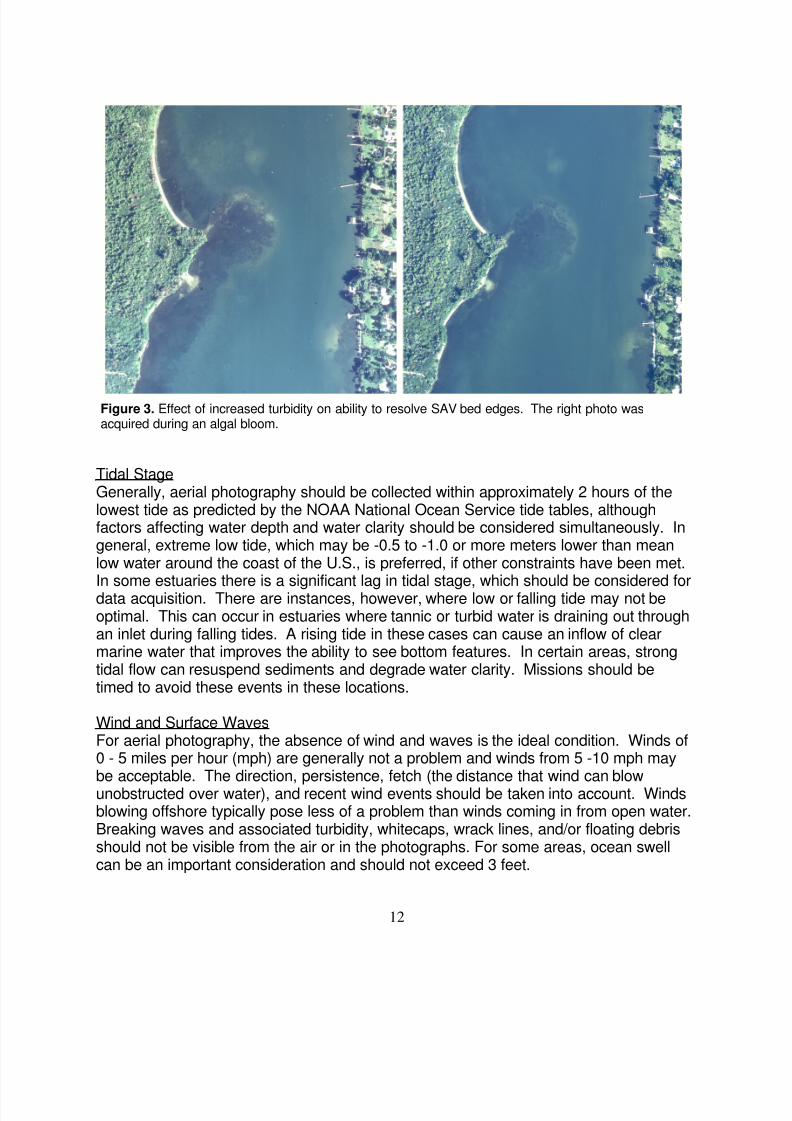
TurbidityAerial photography should be conducted when turbidity is low. Care should beexercised in areas adjacent to sources of suspended sediment and nutrients. Datacollection should be avoided during seasonal phytoplankton blooms. These bloomsmay also occur several days after rain events. Data acquisition also should be avoidedimmediately following heavy rains or persistent strong winds, which can deliversediment loads into nearshore waters or resuspend sediment on the bottom. Potentialdays for photography are those during the photographic window for which high-waterclarity is expected, based on local experience, recent weather patterns, and surface-level observation. The ground and flight crews should confirm water clarity on the dayof photography. The subtle effects of turbidity on image interpretability can be seen infigure 3. In the left frame (1988) the edge of a mixed SAV bed in the lower left is clearlydefined, while an algal bloom has obscured this same edge in the frame at right (1996).
8/2/2019 Benthic Habitat Mapping Guide (NOAA)
http://slidepdf.com/reader/full/benthic-habitat-mapping-guide-noaa 16/79
12
Figure 3. Effect of increased turbidity on ability to resolve SAV bed edges. The right photo wasacquired during an algal bloom.
Tidal StageGenerally, aerial photography should be collected within approximately 2 hours of thelowest tide as predicted by the NOAA National Ocean Service tide tables, althoughfactors affecting water depth and water clarity should be considered simultaneously. Ingeneral, extreme low tide, which may be -0.5 to -1.0 or more meters lower than meanlow water around the coast of the U.S., is preferred, if other constraints have been met.In some estuaries there is a significant lag in tidal stage, which should be considered fordata acquisition. There are instances, however, where low or falling tide may not beoptimal. This can occur in estuaries where tannic or turbid water is draining out throughan inlet during falling tides. A rising tide in these cases can cause an inflow of clearmarine water that improves the ability to see bottom features. In certain areas, strongtidal flow can resuspend sediments and degrade water clarity. Missions should betimed to avoid these events in these locations.
Wind and Surface WavesFor aerial photography, the absence of wind and waves is the ideal condition. Winds of0 - 5 miles per hour (mph) are generally not a problem and winds from 5 -10 mph maybe acceptable. The direction, persistence, fetch (the distance that wind can blowunobstructed over water), and recent wind events should be taken into account. Windsblowing offshore typically pose less of a problem than winds coming in from open water.Breaking waves and associated turbidity, whitecaps, wrack lines, and/or floating debrisshould not be visible from the air or in the photographs. For some areas, ocean swellcan be an important consideration and should not exceed 3 feet.
8/2/2019 Benthic Habitat Mapping Guide (NOAA)
http://slidepdf.com/reader/full/benthic-habitat-mapping-guide-noaa 17/79
13
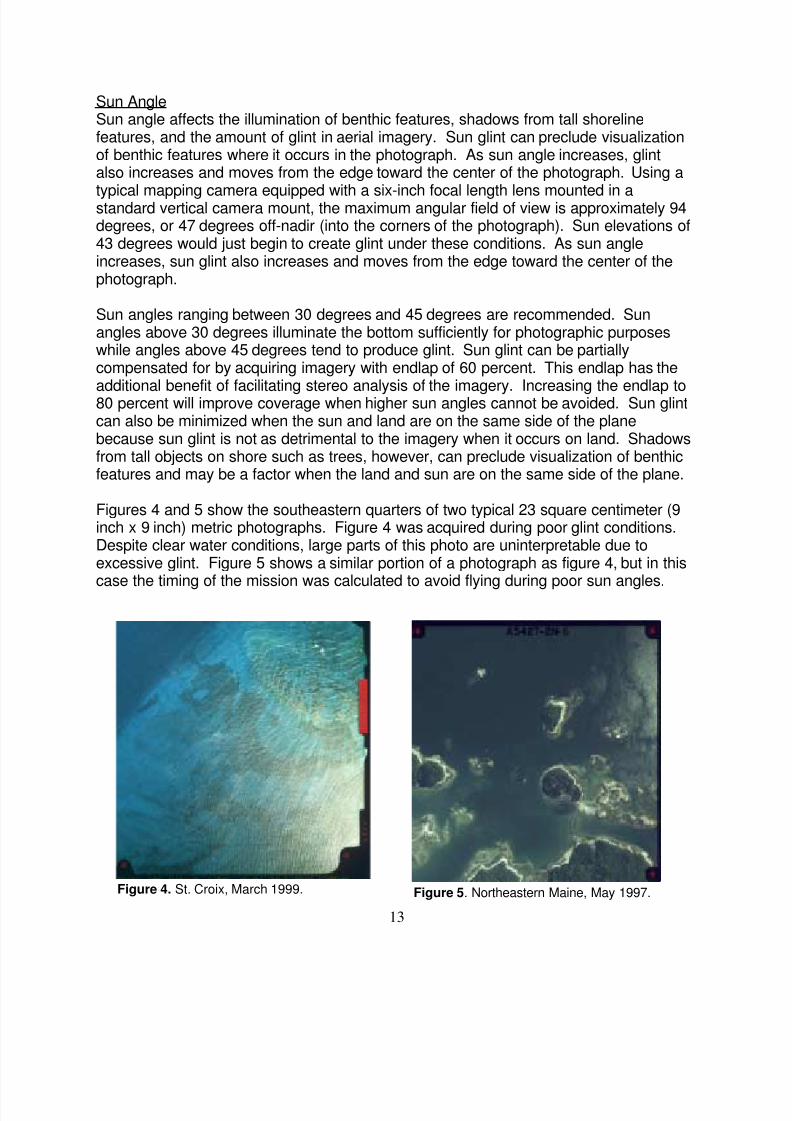
Figure 4. St. Croix, March 1999. Figure 5. Northeastern Maine, May 1997.
Sun AngleSun angle affects the illumination of benthic features, shadows from tall shorelinefeatures, and the amount of glint in aerial imagery. Sun glint can preclude visualizationof benthic features where it occurs in the photograph. As sun angle increases, glintalso increases and moves from the edge toward the center of the photograph. Using a
typical mapping camera equipped with a six-inch focal length lens mounted in astandard vertical camera mount, the maximum angular field of view is approximately 94degrees, or 47 degrees off-nadir (into the corners of the photograph). Sun elevations of43 degrees would just begin to create glint under these conditions. As sun angleincreases, sun glint also increases and moves from the edge toward the center of thephotograph.
Sun angles ranging between 30 degrees and 45 degrees are recommended. Sunangles above 30 degrees illuminate the bottom sufficiently for photographic purposeswhile angles above 45 degrees tend to produce glint. Sun glint can be partiallycompensated for by acquiring imagery with endlap of 60 percent. This endlap has the
additional benefit of facilitating stereo analysis of the imagery. Increasing the endlap to80 percent will improve coverage when higher sun angles cannot be avoided. Sun glintcan also be minimized when the sun and land are on the same side of the planebecause sun glint is not as detrimental to the imagery when it occurs on land. Shadowsfrom tall objects on shore such as trees, however, can preclude visualization of benthicfeatures and may be a factor when the land and sun are on the same side of the plane.
Figures 4 and 5 show the southeastern quarters of two typical 23 square centimeter (9inch x 9 inch) metric photographs. Figure 4 was acquired during poor glint conditions.Despite clear water conditions, large parts of this photo are uninterpretable due toexcessive glint. Figure 5 shows a similar portion of a photograph as figure 4, but in thiscase the timing of the mission was calculated to avoid flying during poor sun angles.
8/2/2019 Benthic Habitat Mapping Guide (NOAA)
http://slidepdf.com/reader/full/benthic-habitat-mapping-guide-noaa 18/79
14
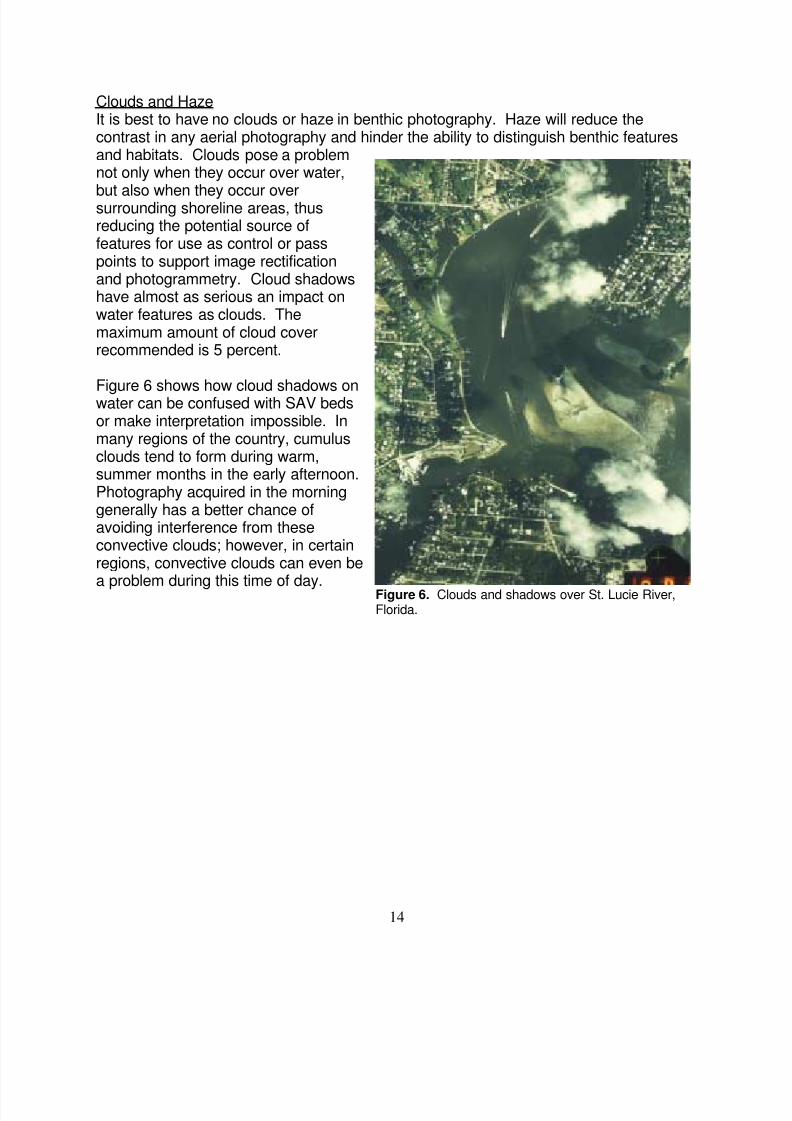
Figure 6. Clouds and shadows over St. Lucie River,Florida.
Clouds and HazeIt is best to have no clouds or haze in benthic photography. Haze will reduce thecontrast in any aerial photography and hinder the ability to distinguish benthic featuresand habitats. Clouds pose a problemnot only when they occur over water,
but also when they occur oversurrounding shoreline areas, thusreducing the potential source offeatures for use as control or passpoints to support image rectificationand photogrammetry. Cloud shadowshave almost as serious an impact onwater features as clouds. Themaximum amount of cloud coverrecommended is 5 percent.
Figure 6 shows how cloud shadows onwater can be confused with SAV bedsor make interpretation impossible. Inmany regions of the country, cumulusclouds tend to form during warm,summer months in the early afternoon.Photography acquired in the morninggenerally has a better chance ofavoiding interference from theseconvective clouds; however, in certainregions, convective clouds can even bea problem during this time of day.
8/2/2019 Benthic Habitat Mapping Guide (NOAA)
http://slidepdf.com/reader/full/benthic-habitat-mapping-guide-noaa 19/79
15
COLLECTION OF GROUND CONTROL POINTSFOR IMAGE RECTIFICATION
Rectification of aerial imagery over extensive water bodies poses the greatest challengeto benthic mapping. Even in areas where habitat can be successfully imaged and
mapped, the lack of usable ground control data to bring the data into a spatial referenceplane can severely hamper the mapping effort. Typically, project leaders will addressthis issue by either obtaining spatial location information (x, y, z coordinates) fromanother image or map source or by measuring image features on the ground withsurveying instruments or GPS receivers. With the improvement in the coastalContinuously Operating Reference Stations (CORS) and radio beacons operated by theU.S. Coast Guard and other agencies, Global Positioning System (GPS) technologyhas been established as a powerful way of making direct ground control pointmeasurements. The following sections outline guidance for this type of measurementas well as recommendations for using other sources of control.
Ground Control Point Selection and Measurement with GPS
In cases where no acceptable raster or existing point source of ground control points(GCPs) exists for photorectification, it will be necessary for the project to collect its own.If the resources permit, it is often worthwhile to collect at least some independent GCPsas a cross-reference to a raster control source that may provide the bulk of GCPs. It isrecommended that GCPs be selected after the imagery has been received andscreened. In this way, points can be selected with the best possible distributionthroughout the study area and for the individual photo frames. Collecting GCPs is afield-intensive process, so all effort should be made to be efficient in selecting the
points.
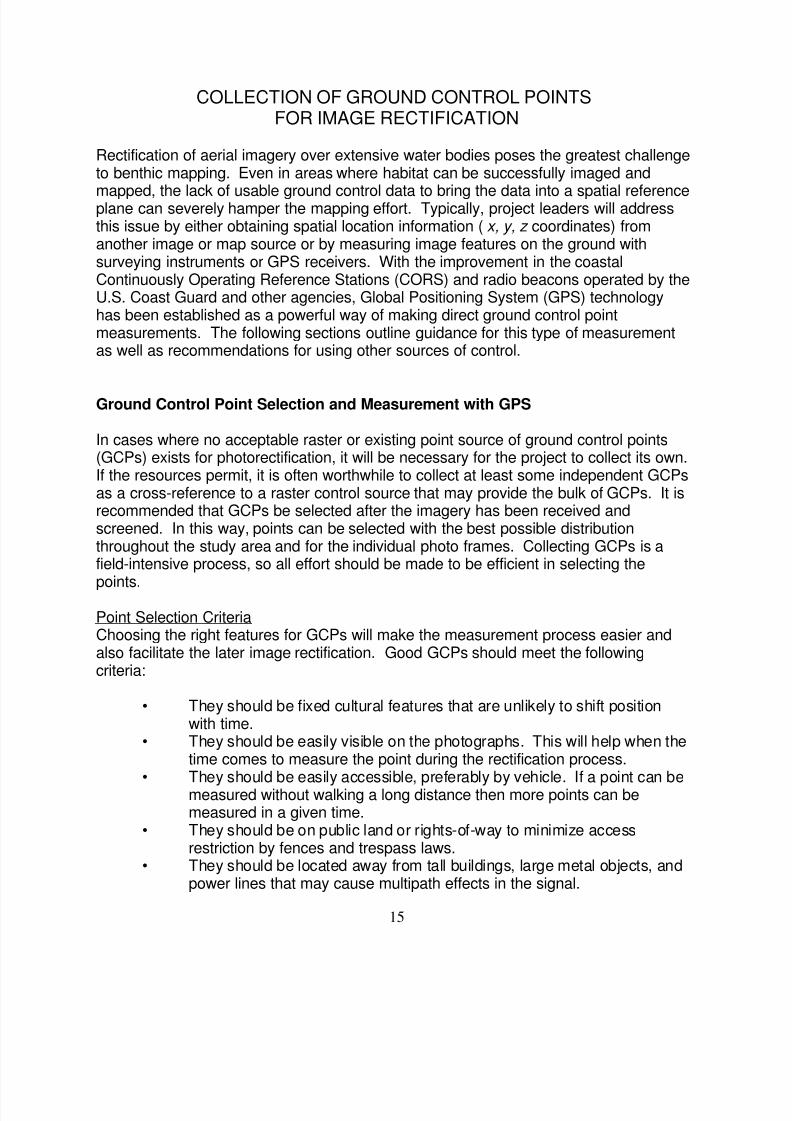
Point Selection CriteriaChoosing the right features for GCPs will make the measurement process easier andalso facilitate the later image rectification. Good GCPs should meet the followingcriteria:
• They should be fixed cultural features that are unlikely to shift positionwith time.
• They should be easily visible on the photographs. This will help when thetime comes to measure the point during the rectification process.
• They should be easily accessible, preferably by vehicle. If a point can bemeasured without walking a long distance then more points can bemeasured in a given time.
• They should be on public land or rights-of-way to minimize accessrestriction by fences and trespass laws.
• They should be located away from tall buildings, large metal objects, andpower lines that may cause multipath effects in the signal.

8/2/2019 Benthic Habitat Mapping Guide (NOAA)
http://slidepdf.com/reader/full/benthic-habitat-mapping-guide-noaa 20/79
16
Figure 7. An optimal
distribution of full control points(yellow labels). Supplementalcontrol points are shown in blue.All four quadrants of the photocontain a point, and they aredistributed on either side of thelagoon, which is the focus of thismapping effort.
• They should be located in open areas away from heavy tree cover tominimize the potential loss of satellite signals.
Examples of good GCPs are sidewalk corners and intersections, the corners of pavedparking lots, railroad crossings (in cases where it is safe), and piers and pier abutments.
Less desirable GCPs are trees or bushes, curves or banks of streams, corners ofbuildings, and areas of heavy vegetation cover or sheer terrain.
Point DistributionGCPs should be selected after a review of the photography and should be welldistributed throughout the photo. Photogrammetric orientation solutions require aminimum of three points to establish a model. However, it is advisable to collect atleast several additional points (five or six) to allow rejection of points that don’tcontribute to an acceptable solution. In cases where multiple flight lines converge,more points should be collected to ensure that polygons delineated on adjacent framesare not out of position with each other. Another case where additional points are
recommended occurs when a flight line begins to extend into remote areas where nocontrol is available, as in an area where triangulation or bridging is required. In thiscase, errors occurring along the triangulated strip are minimized to the greatest extentpossible by a robust rectification at the beginning. Linear arrangements of points orpoints clustered in small portions of the photographs will typically not produce the most
8/2/2019 Benthic Habitat Mapping Guide (NOAA)
http://slidepdf.com/reader/full/benthic-habitat-mapping-guide-noaa 21/79
17
accurate rectifications. If full aerotriangulation is anticipated for the mapping project, agreatly reduced number of points is required. In these instances GCPs should becollected primarily at the beginning and ends of flight lines and around the edges ofparallel lines in a block.
Point Measurement and DocumentationAs GCPs are chosen during a review of the photography, it is recommended that thepoints be annotated in some way on a set of working prints. This assists in latermeasurement of the points during the rectification process. In addition to documentingthe points on the photos, a data sheet describing each point should be completed. Themost important component of this sheet is a detailed sketch of the actual feature beingmapped. In many cases the scale of the working print will not allow this to beadequately annotated. The detailed drawing on the data sheet will be valuable laterduring the rectification process when the photos can be observed under highmagnification. The sheets also form a cross record for ensuring that all points weremeasured. A sample sheet is included at the end of this document in Appendix 5.
The actual measurement or recording of Global Positioning System signals while onsite should normally follow common GPS practices. The goal of this process is toproduce a positional record for the feature that is accurate to less than 1 meter. Usingeither real-time differential correction from a radio beacon, or post-processing, the fielddata should produce data that meet this requirement, provided the GPS receiver is ofsufficient quality. GPS receivers that are capable of tracking 12 satellites (12-channel)are more than adequate for this task and are commonly available on the commercialmarket.
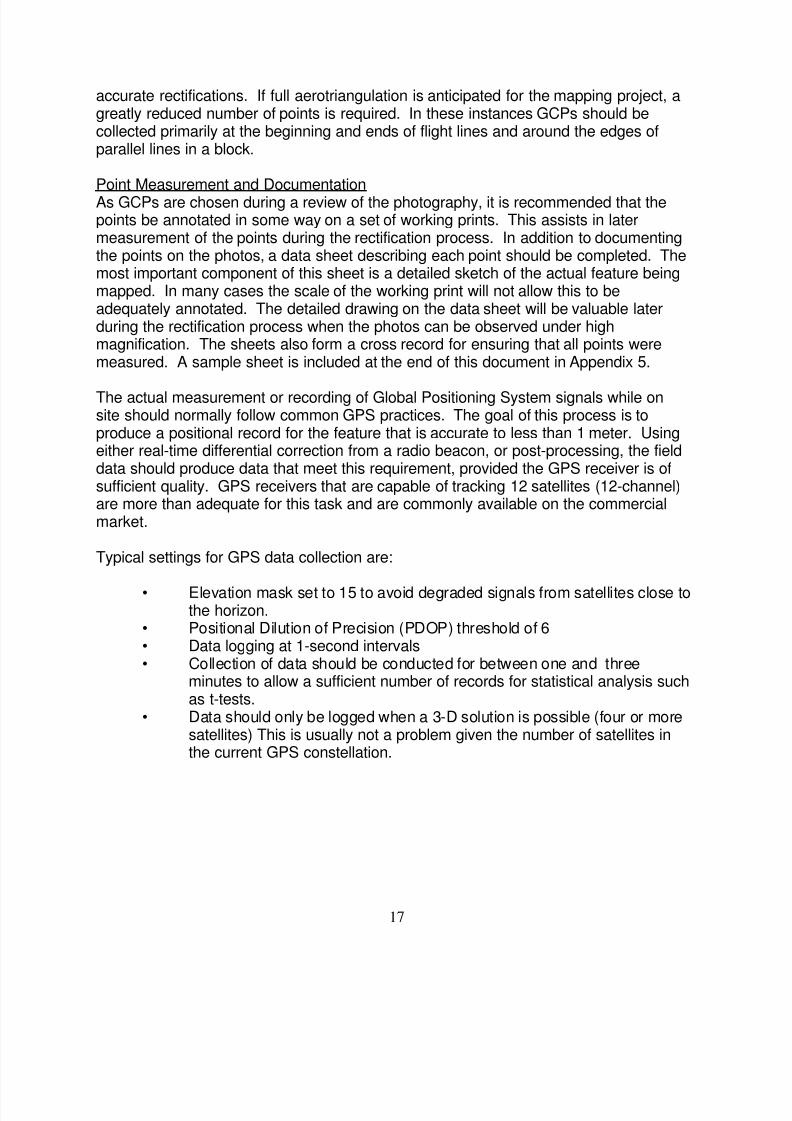
Typical settings for GPS data collection are:
• Elevation mask set to 15 to avoid degraded signals from satellites close tothe horizon.
• Positional Dilution of Precision (PDOP) threshold of 6• Data logging at 1-second intervals• Collection of data should be conducted for between one and three
minutes to allow a sufficient number of records for statistical analysis suchas t-tests.
• Data should only be logged when a 3-D solution is possible (four or moresatellites) This is usually not a problem given the number of satellites inthe current GPS constellation.
8/2/2019 Benthic Habitat Mapping Guide (NOAA)
http://slidepdf.com/reader/full/benthic-habitat-mapping-guide-noaa 22/79
18
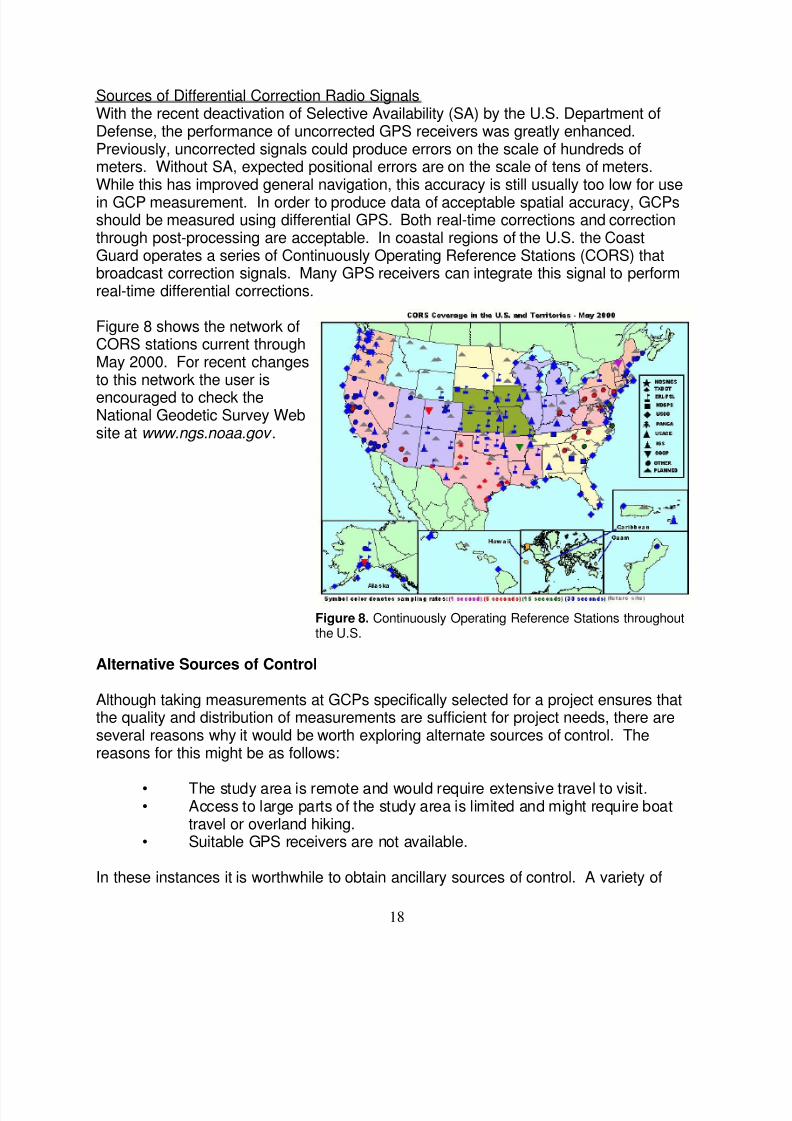
Figure 8. Continuously Operating Reference Stations throughoutthe U.S.
Sources of Differential Correction Radio SignalsWith the recent deactivation of Selective Availability (SA) by the U.S. Department ofDefense, the performance of uncorrected GPS receivers was greatly enhanced.Previously, uncorrected signals could produce errors on the scale of hundreds ofmeters. Without SA, expected positional errors are on the scale of tens of meters.While this has improved general navigation, this accuracy is still usually too low for usein GCP measurement. In order to produce data of acceptable spatial accuracy, GCPsshould be measured using differential GPS. Both real-time corrections and correctionthrough post-processing are acceptable. In coastal regions of the U.S. the CoastGuard operates a series of Continuously Operating Reference Stations (CORS) thatbroadcast correction signals. Many GPS receivers can integrate this signal to performreal-time differential corrections.
Figure 8 shows the network ofCORS stations current throughMay 2000. For recent changesto this network the user is
encouraged to check theNational Geodetic Survey Website at www.ngs.noaa.gov .
Alternative Sources of Control
Although taking measurements at GCPs specifically selected for a project ensures thatthe quality and distribution of measurements are sufficient for project needs, there areseveral reasons why it would be worth exploring alternate sources of control. Thereasons for this might be as follows:
• The study area is remote and would require extensive travel to visit.• Access to large parts of the study area is limited and might require boat
travel or overland hiking.• Suitable GPS receivers are not available.
In these instances it is worthwhile to obtain ancillary sources of control. A variety of
8/2/2019 Benthic Habitat Mapping Guide (NOAA)
http://slidepdf.com/reader/full/benthic-habitat-mapping-guide-noaa 23/79
8/2/2019 Benthic Habitat Mapping Guide (NOAA)
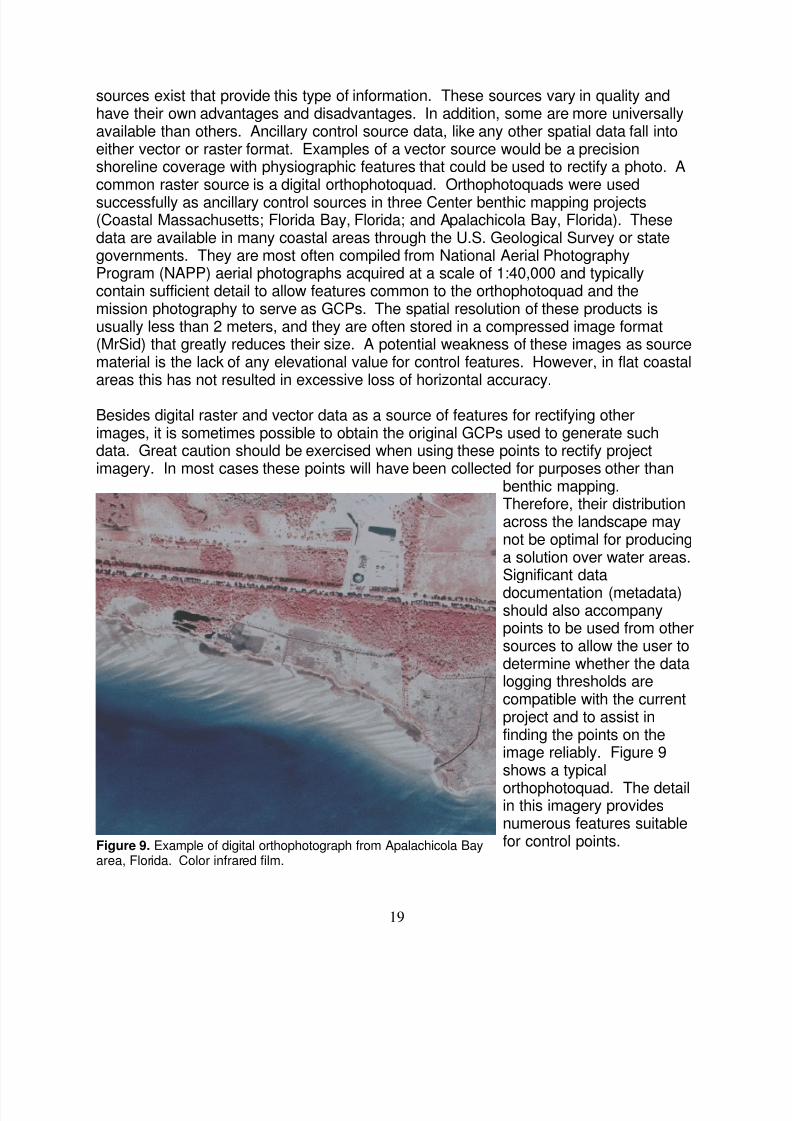
http://slidepdf.com/reader/full/benthic-habitat-mapping-guide-noaa 24/79
20
PHOTOINTERPRETATION AND IMAGE ANALYSIS
The following section draws on Chapter 4 of Dobson et al. 1995; however, since 1995mapping efforts using these methods have been applied to many other habitats besidesSAV. Other habitats that have been successfully mapped include algae, corals, andhardbottom habitats. Habitats such as sand flats, mud areas, and rubble bottoms havealso occasionally been mapped. All of these habitats can be identified in aerial photoswithin the photic zone. Specific guidance on actual polygon delineation is provided inthe following discussion based on experiences in Indian River Lagoon, Florida, andother project areas around the country.
Benthic habitats can be interpreted from metric-quality aerial photographs acquired asrecommended in the previous sections. The accurate identification of these habitats inaerial photographs requires visual evaluation of the fundamental elements of imageinterpretation (tone, color, contrast, texture, shadow, etc.). This type of mapping alsorequires experience at ground level in the study area since the photographic images ofhabitat features vary in ways that cannot readily be modeled, described, orcommunicated. Training for a habitat change analysis effort includes literatureresearch, discussions with local ecologists and biologists, site visits, overflights in smallaircraft, and examination of historical aerial photographs of the area (Maragos andCook 1995). Training of photointerpreters is active throughout the life of the project.
Photointerpretation of shallow-water benthic habitats is best accomplished using stereopairs of photographs and high quality stereoscopic instruments (e.g. Wild, AVIOPRET,APT2, stereoscopes). Polygons can then be annotated on overlays fixed to eachphotograph or digitally delineated through a screen display or stereoplotter view. To bedelineated as a particular habitat, recognizable and verified signatures associated withthat habitat must be present in the photographs (Hopley 1978). These habitatsignatures will often vary depending upon species composition, bottom sediment,depth, season, haze, clouds, water clarity and surface disturbances, and sun angle atthe time of photography. The analyst will need to account for this variability in habitatsignature and aggregate them into one habitat class where appropriate or discriminatebetween habitat classes during the mapping interpretation process.
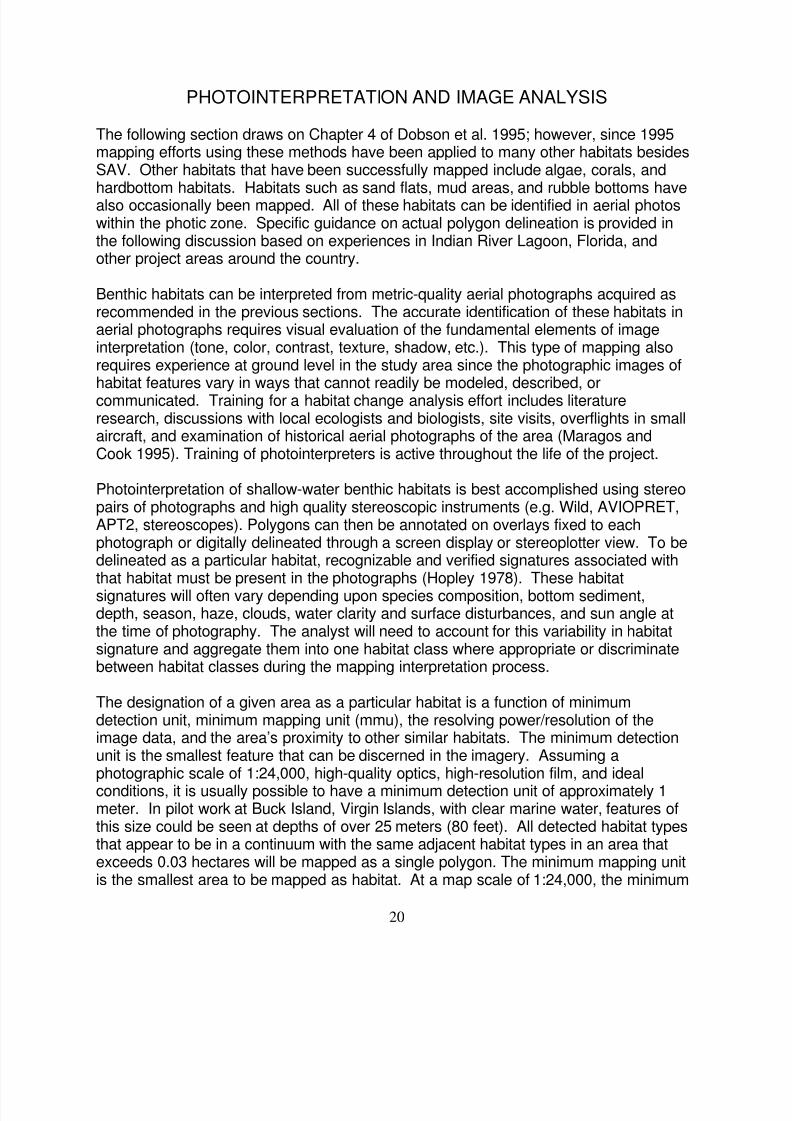
The designation of a given area as a particular habitat is a function of minimumdetection unit, minimum mapping unit (mmu), the resolving power/resolution of theimage data, and the area’s proximity to other similar habitats. The minimum detectionunit is the smallest feature that can be discerned in the imagery. Assuming aphotographic scale of 1:24,000, high-quality optics, high-resolution film, and ideal
conditions, it is usually possible to have a minimum detection unit of approximately 1meter. In pilot work at Buck Island, Virgin Islands, with clear marine water, features ofthis size could be seen at depths of over 25 meters (80 feet). All detected habitat typesthat appear to be in a continuum with the same adjacent habitat types in an area thatexceeds 0.03 hectares will be mapped as a single polygon. The minimum mapping unitis the smallest area to be mapped as habitat. At a map scale of 1:24,000, the minimum
8/2/2019 Benthic Habitat Mapping Guide (NOAA)
http://slidepdf.com/reader/full/benthic-habitat-mapping-guide-noaa 25/79
21
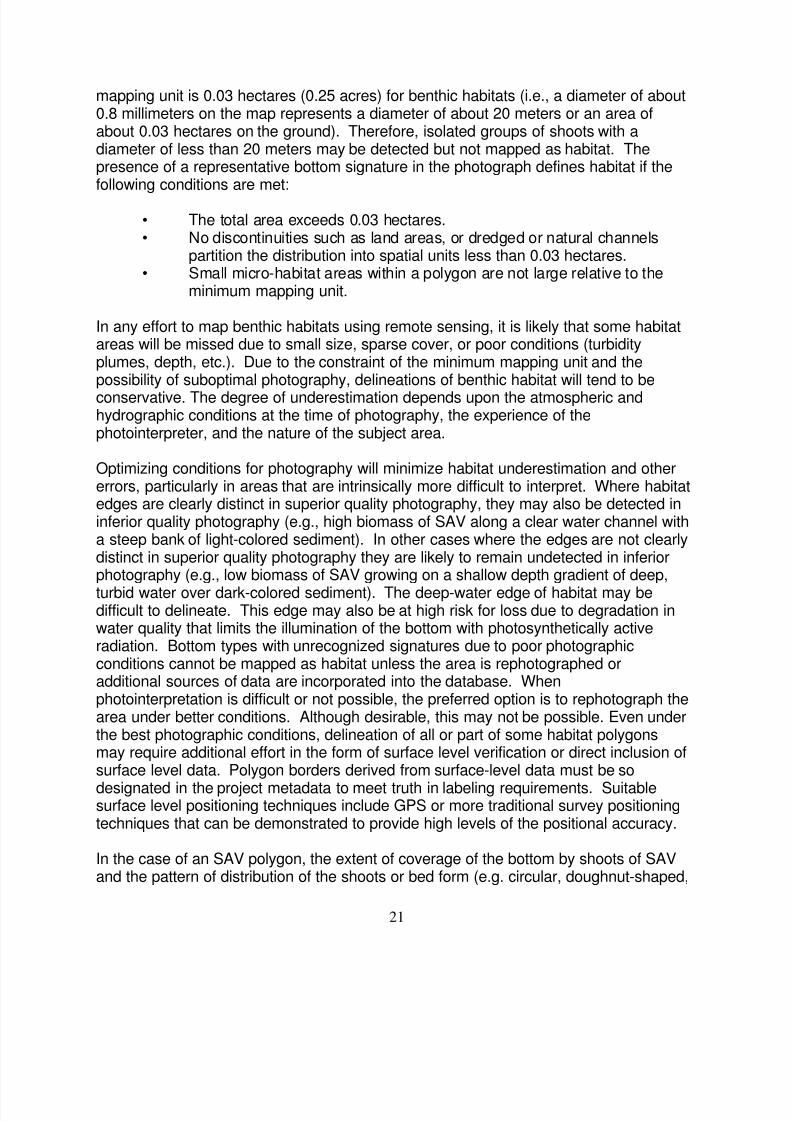
mapping unit is 0.03 hectares (0.25 acres) for benthic habitats (i.e., a diameter of about0.8 millimeters on the map represents a diameter of about 20 meters or an area ofabout 0.03 hectares on the ground). Therefore, isolated groups of shoots with adiameter of less than 20 meters may be detected but not mapped as habitat. Thepresence of a representative bottom signature in the photograph defines habitat if thefollowing conditions are met:
• The total area exceeds 0.03 hectares.• No discontinuities such as land areas, or dredged or natural channels
partition the distribution into spatial units less than 0.03 hectares.• Small micro-habitat areas within a polygon are not large relative to the
minimum mapping unit.
In any effort to map benthic habitats using remote sensing, it is likely that some habitatareas will be missed due to small size, sparse cover, or poor conditions (turbidityplumes, depth, etc.). Due to the constraint of the minimum mapping unit and thepossibility of suboptimal photography, delineations of benthic habitat will tend to be
conservative. The degree of underestimation depends upon the atmospheric andhydrographic conditions at the time of photography, the experience of thephotointerpreter, and the nature of the subject area.
Optimizing conditions for photography will minimize habitat underestimation and othererrors, particularly in areas that are intrinsically more difficult to interpret. Where habitatedges are clearly distinct in superior quality photography, they may also be detected ininferior quality photography (e.g., high biomass of SAV along a clear water channel witha steep bank of light-colored sediment). In other cases where the edges are not clearlydistinct in superior quality photography they are likely to remain undetected in inferiorphotography (e.g., low biomass of SAV growing on a shallow depth gradient of deep,
turbid water over dark-colored sediment). The deep-water edge of habitat may bedifficult to delineate. This edge may also be at high risk for loss due to degradation inwater quality that limits the illumination of the bottom with photosynthetically activeradiation. Bottom types with unrecognized signatures due to poor photographicconditions cannot be mapped as habitat unless the area is rephotographed oradditional sources of data are incorporated into the database. Whenphotointerpretation is difficult or not possible, the preferred option is to rephotograph thearea under better conditions. Although desirable, this may not be possible. Even underthe best photographic conditions, delineation of all or part of some habitat polygonsmay require additional effort in the form of surface level verification or direct inclusion ofsurface level data. Polygon borders derived from surface-level data must be so
designated in the project metadata to meet truth in labeling requirements. Suitablesurface level positioning techniques include GPS or more traditional survey positioningtechniques that can be demonstrated to provide high levels of the positional accuracy.
In the case of an SAV polygon, the extent of coverage of the bottom by shoots of SAVand the pattern of distribution of the shoots or bed form (e.g. circular, doughnut-shaped,
8/2/2019 Benthic Habitat Mapping Guide (NOAA)
http://slidepdf.com/reader/full/benthic-habitat-mapping-guide-noaa 26/79
22
irregular patches and/or continuous cover of SAV), reflects the interaction of biotic,physical, and anthropogenic factors.
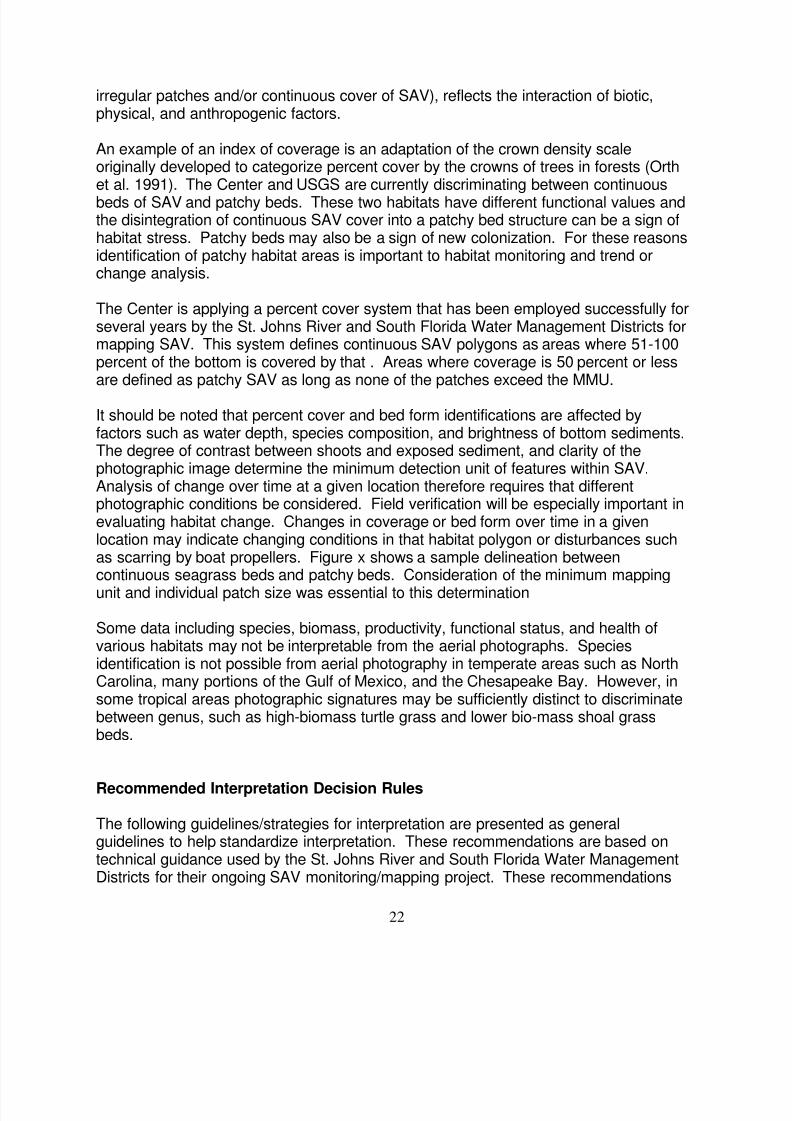
An example of an index of coverage is an adaptation of the crown density scaleoriginally developed to categorize percent cover by the crowns of trees in forests (Orthet al. 1991). The Center and USGS are currently discriminating between continuousbeds of SAV and patchy beds. These two habitats have different functional values andthe disintegration of continuous SAV cover into a patchy bed structure can be a sign ofhabitat stress. Patchy beds may also be a sign of new colonization. For these reasonsidentification of patchy habitat areas is important to habitat monitoring and trend orchange analysis.
The Center is applying a percent cover system that has been employed successfully forseveral years by the St. Johns River and South Florida Water Management Districts formapping SAV. This system defines continuous SAV polygons as areas where 51-100percent of the bottom is covered by that . Areas where coverage is 50 percent or lessare defined as patchy SAV as long as none of the patches exceed the MMU.
It should be noted that percent cover and bed form identifications are affected byfactors such as water depth, species composition, and brightness of bottom sediments.The degree of contrast between shoots and exposed sediment, and clarity of thephotographic image determine the minimum detection unit of features within SAV.Analysis of change over time at a given location therefore requires that differentphotographic conditions be considered. Field verification will be especially important inevaluating habitat change. Changes in coverage or bed form over time in a givenlocation may indicate changing conditions in that habitat polygon or disturbances suchas scarring by boat propellers. Figure x shows a sample delineation betweencontinuous seagrass beds and patchy beds. Consideration of the minimum mapping
unit and individual patch size was essential to this determination
Some data including species, biomass, productivity, functional status, and health ofvarious habitats may not be interpretable from the aerial photographs. Speciesidentification is not possible from aerial photography in temperate areas such as NorthCarolina, many portions of the Gulf of Mexico, and the Chesapeake Bay. However, insome tropical areas photographic signatures may be sufficiently distinct to discriminatebetween genus, such as high-biomass turtle grass and lower bio-mass shoal grassbeds.
Recommended Interpretation Decision Rules
The following guidelines/strategies for interpretation are presented as generalguidelines to help standardize interpretation. These recommendations are based ontechnical guidance used by the St. Johns River and South Florida Water ManagementDistricts for their ongoing SAV monitoring/mapping project. These recommendations
8/2/2019 Benthic Habitat Mapping Guide (NOAA)
http://slidepdf.com/reader/full/benthic-habitat-mapping-guide-noaa 27/79
23
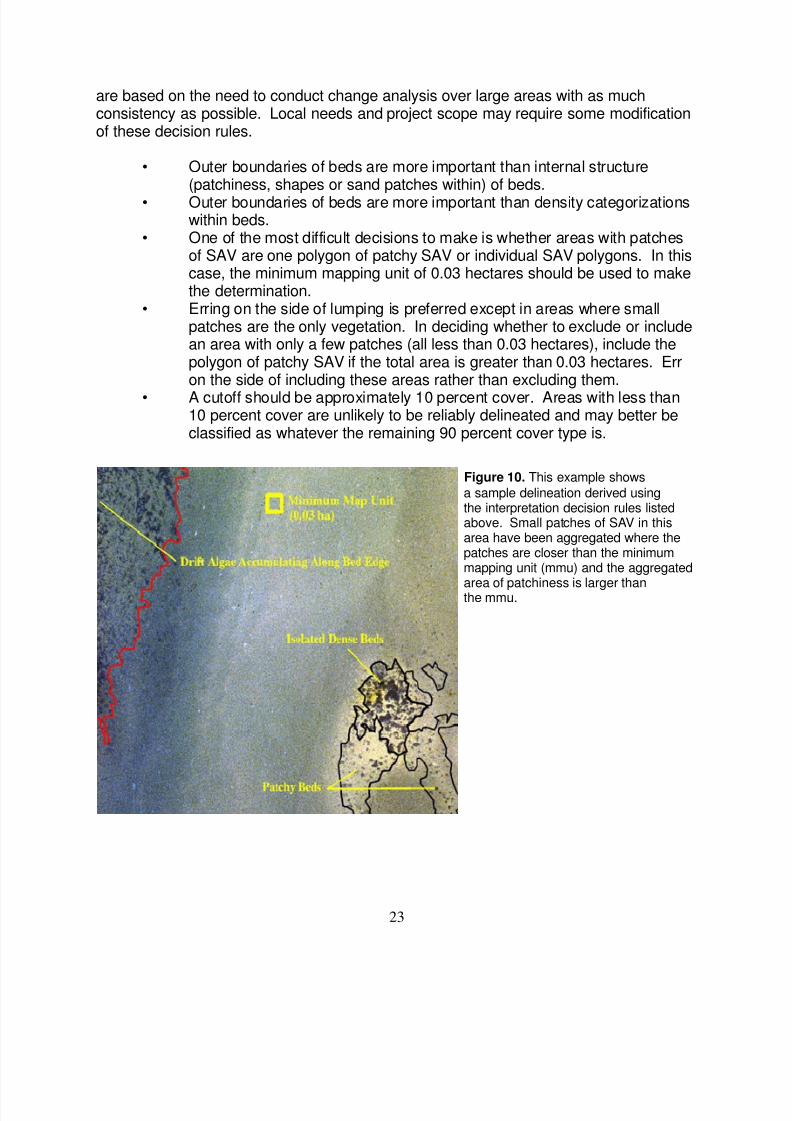
Figure 10. This example shows
a sample delineation derived usingthe interpretation decision rules listedabove. Small patches of SAV in thisarea have been aggregated where thepatches are closer than the minimummapping unit (mmu) and the aggregated
area of patchiness is larger thanthe mmu.
are based on the need to conduct change analysis over large areas with as muchconsistency as possible. Local needs and project scope may require some modificationof these decision rules.
• Outer boundaries of beds are more important than internal structure(patchiness, shapes or sand patches within) of beds.
• Outer boundaries of beds are more important than density categorizationswithin beds.
• One of the most difficult decisions to make is whether areas with patchesof SAV are one polygon of patchy SAV or individual SAV polygons. In thiscase, the minimum mapping unit of 0.03 hectares should be used to makethe determination.
• Erring on the side of lumping is preferred except in areas where smallpatches are the only vegetation. In deciding whether to exclude or includean area with only a few patches (all less than 0.03 hectares), include thepolygon of patchy SAV if the total area is greater than 0.03 hectares. Erron the side of including these areas rather than excluding them.
• A cutoff should be approximately 10 percent cover. Areas with less than10 percent cover are unlikely to be reliably delineated and may better beclassified as whatever the remaining 90 percent cover type is.

8/2/2019 Benthic Habitat Mapping Guide (NOAA)
http://slidepdf.com/reader/full/benthic-habitat-mapping-guide-noaa 28/79
24
In summary, the habitat delineation process should be carried out to preserve themaximum detail obtainable from the photography. Because a focus of these methodsis on supporting habitat change detection, small movements of an SAV edge due toincreased turbidity or other factors are important to capture. Generalized habitatdelineations will be unlikely to capture these small changes.
8/2/2019 Benthic Habitat Mapping Guide (NOAA)
http://slidepdf.com/reader/full/benthic-habitat-mapping-guide-noaa 29/79
25
DATA DEVELOPMENT METHODS
The Center recommends three methods for creating digital habitat data from aerialphotography and other supplemental data streams. These methods are designed tomaximize the capture of thematically and spatially accurate data on benthic habitat.Three methods are presented to provide guidance to agencies with varying levels oftechnical capacity. They are also intended to be applicable by state and private-sectorscientists and environmental technicians working in a variety of environmental settings.All the methods assume a certain level of expertise in remote sensing andphotointerpretation. The objective in each case is to identify all living benthic habitatdespite the interference presented by the water column. An additional objective is toproduce spatially precise baseline data that minimizes positional offsets that can detractfrom the accuracy of subsequent change detection efforts. Three methods listed inorder of preference are recommended for producing benthic data:
• Analytical Photogrammetry• Soft-Copy Photogrammetry• Analog Interpretation
Analytical Photogrammetry
This method is the preferred technique for generating digital benthic data. The methodhas been applied successfully by several of the water management districts in the stateof Florida. This method employs a stereoplotter to delineate and simultaneously rectifyand digitize habitat polygons. The three-dimensional stereo model of the aerialphotographs is leveled and scaled in the analytical plotter (AP), and the interpreterviews a three-dimensional landscape during photointerpretation. All polygonalinterpretations are automatically stored in digital x, y , and z coordinates in their properplanimetric position during photointerpretation (Welch et al. 1992), avoiding any errorwhich might arise during information transfer using a zoom transfer scope or handdigitization where base map inaccuracies may be a factor.
The analytical photogrammetric process employs either original or duplicate filmdiapositives. This is the optimal interpretation medium for photomapping. Analyticalstereoplotters typically have system resolutions on the order of 1 to 2 microns.Therefore, to reduce the effects of film shrinkage and distortion that could affect theorientation process, it is recommended that film be processed to a 7mil estar base fordimensional stability. In addition to stable diapositives, this method requires groundcontrol points with elevational values to correct for terrain displacement, radialdistortion, and aircraft positional aberrations (roll, pitch and yaw). These ground controlpoints can be obtained from a variety of sources, as well as created through GPS aspart of the project activities as previously discussed. Detailed information on thecamera specifications is also needed for this method. This is available through thecamera calibration report. The USGS maintains a calibration report archive for many of
8/2/2019 Benthic Habitat Mapping Guide (NOAA)
http://slidepdf.com/reader/full/benthic-habitat-mapping-guide-noaa 30/79

8/2/2019 Benthic Habitat Mapping Guide (NOAA)
http://slidepdf.com/reader/full/benthic-habitat-mapping-guide-noaa 31/79
27
AerotriangulationIn cases where multiple strips of photography are required for the project, or in areaswhere GCPs are not available, an aerotriangulation process will be required. In fact, itis recommended that this procedure be used whenever possible, as it reduces thenumber of GCPs that have to be measured. This process will rely on tie pointscommon to exterior oriented photos to rectify photos without any actual GCPs withinthem. If GPS/IMU information on photo centers is available, these data will also greatlyfacilitate the aerotriangulation process, especially over open-water areas. Atriangulation algorithm will typically employ an iterative least-squares approach toadjusting the block or strip of photography. The convergence value at which thisprocess ceases should be in ground units. It is especially important in theaerotriangulation process to measure tie points accurately and have a minimalconvergence value.
At the conclusion of the triangulation and compilation process, a set of spatially precisepositionally registered habitat polygons will be exported from the photogrammetricenvironment. A subsequent effort to build polygon topology, perform Quality
Assurance/Quality Control (QA/QC), and attribute the polygon data will still be needed.
RecommendationsAnalytical stereoplotters are very expensive and require special training. Someadditional expense to locate x, y, and z control points may be necessary to successfullylevel the block of aerial photography. This technology may be outside the capability ofmany Center partners. For this reason it is recommended that this technique beemployed in the following cases:
• When there is a need for a spatially precise baseline to support futurechange detection projects. These often require high levels of positional
accuracy to reduce change caused by positional shifts between data sets.• When the data are likely to be critical to local permitting activities.• When the number of photographs in the project is very large and storage
of scanned digital photographs might be problematic.• When the environmental conditions are challenging and interpretation off
of the original or first generation film media is critical.• When existing base maps for analog interpretation and zoom transfer are
clearly outdated or inaccurate.
8/2/2019 Benthic Habitat Mapping Guide (NOAA)
http://slidepdf.com/reader/full/benthic-habitat-mapping-guide-noaa 32/79
28
Soft-Copy Photogrammetry
Recent advances in soft-copy photogrammetry allow analytical stereoplotter functionsto be accomplished using computer workstations and image processing software (e.g.ERDAS OrthoBase, Socet Set, Softplotter, and Intergraph). Therefore, this alternativewill become more affordable and attractive in the future. Fundamental to the soft-copyapproach is the fact that the analysis relies on a native digital or scanned analog aerialphotograph. In order to preserve image geometry and the spectral balance in thenative imagery, photogrammetric scanners are recommended to produce the scans.The scan resolution (pixels per inch) will vary based on the scale of the originalimagery, but should be sufficient to capture small features that allow identification ofdifferent habitats. Since texture plays such a primary role in this habitat determination,preserving a high spatial resolution is important to this process. A minimum resolutionthat has proven satisfactory for soft-copy interpretation is 1 meter, although higherresolutions are desirable if file size and computational capacity do not become limitingfactors. In cases where the original film diapositives remain available to the analyst,lower resolutions can be used. In areas where making an interpretation from the
screen is difficult, the analyst can then fall back on the film data.
Orientation Process and AerotriangulationThe orientation steps required to build stereo models and register them to a groundreference plane are the same in soft-copy photogrammetry as in analytical. Oneadvantage of some soft-copy systems is the ability to automatically generate largenumbers of pass points based on similar image signatures between stereopairs. Theanalyst can then choose the best of these points when conducting the relative andabsolute orientations. These points are also then useful in the aerotriangulationprocess. Because the images are stored in digital format, large numbers of images canbe called up quickly when doing the block adjustment, unlike analytical instruments,
which require the analyst to reload film diapositives and redo the interior orientation toaccomplish the same step. If a digital elevation model (DEM) exists for the region, thescanned photography can be orthorectified to this digital data set. As in analyticalphotogrammetry, aircraft kinematic GPS and IMU data provide detailed information onaircraft position and camera nadir location. These data are stored digitally and assist inrectification of imagery over open water with no GCPs.
Image ManipulationIn cases where the analyst is interpreting directly from a scanned photograph, there area variety of image processing techniques that can assist in delineating habitat. Theseinclude histogram manipulation and stretches to highlight dark areas and increase
contrast, and also spatial filters to emphasize certain spatial patterns in the data. Twouseful techniques are histogram matching and low-pass filtering (Hale and Frazer1997). These tools can assist an analyst during the mapping process but should beused carefully to avoid misinterpretation of image artifacts and noise.
Spectral clustering of aerial photography has been employed in certain studies to
8/2/2019 Benthic Habitat Mapping Guide (NOAA)
http://slidepdf.com/reader/full/benthic-habitat-mapping-guide-noaa 33/79
29
produce a quick initial organization of the photo data. These routines can highlightcertain features, especially sand bottoms, but they are extremely vulnerable tomisclassification from spectrally similar features on land or from image artifacts such asglint or sea state. This approach is not recommended as a mapping method. The levelof effort needed to extract meaningful habitat information from clustered aerialphotography is usually significantly greater than that required of a skilled analyst usingthe spectral and spatial data inherent in the photo to perform a manual interpretation.However, in certain localized areas of a study area image manipulation may be usefulas an ancillary interpretation tool. When directly interpreting/compiling from scannedrectified aerial photos it is recommended that, in areas of overlapping coverage,interpretation be done in the center portion of the photo. Flight plans that incorporate atleast 30 percent sidelap and 60 percent endlap will facilitate this approach.
The soft-copy photogrammetric method can produce spatially precise habitat polygonaldata of comparable quality to that produced in an analytical environment. However,there are some advantages and disadvantages to this method that should beconsidered when there is a choice of whether to use either the analytical or soft-copy
approach.
• Skill requirements and computer hardware necessary to conduct this typeof mapping are not as high as for analytical photogrammetry but aresubstantial nevertheless.
• This method has the advantage of allowing multiple analysts to worksimultaneously on a project in a networked environment.
• Working with a digital image allows the user to employ several imageenhancement processes. Some of the most useful are histogramstretching and spatial filtering. These can assist in mapping certainselected areas; however, they must be used with great caution since they
may highlight image artifacts that do not represent actual habitats.• The loss of resolution associated with the scanning process does
potentially hinder the interpretation process. The scanning processproduces a spectral record of the raw image that is based on a systematicx, y array of pixels of a given size. Narrow image features that are notoriented along the same axis as the scan array can be captured poorly bythe scanning process. In addition, the native resolution of most filmemulsions is on the order of multiple line-pairs per millimeter. Most scanresolutions are unable to capture images at this resolution.
• Larger projects can raise issues associated with file storage and dataretrieval. A typical color 23 centimeter x 23 centimeter (9 inch x 9 inch)
frame at a scale of 1:24,000, scanned to produce a 1 meter pixel(acceptable for interpretation), can result in a raw file size of 100megabytes.
8/2/2019 Benthic Habitat Mapping Guide (NOAA)
http://slidepdf.com/reader/full/benthic-habitat-mapping-guide-noaa 34/79
30
RecommendationsBased on the characteristics of soft-copy photogrammetry, the Center recommends itsuse in the following situations:
• Where environmental conditions are especially favorable andinterpretation is less challenging due to the reduced image detail.
• Where data storage is not a limiting factor.• Where existing hardware supports this method as opposed to the
analytical method.• Where time can be saved by splitting the workload between skilled
interpreters working on separate computers from a strict set of commonlyagreed-upon guidelines
• In study areas with large expanses of open water without features forGCPs or terrain points.
Analog Interpretation
Analog interpretation is the traditional method for generating data from aerialphotography. This method involves visually interpreting original or duplicate film anddelineating habitat polygons on transparent or semi-transparent overlays attached tothe photos. The Center recommends that film diapositives be viewed on a light table toaccomplish the interpretation. Original film materials (reversal films) are preferable dueto the loss of detail that occurs during the duplication or printing process. Transparentpolyfilm is the recommended overlay material since it is structurally stable and doesn’thinder the interpretation process. Each overlay should be registered to the photo byannotating the fiducial marks and some portion of the film titling (usually the frame, roll,date, and mission identification) to allow the overlay to be removed and reattached
correctly. Stereopairs with overlays attached (adjacent photographs with overlap) arebest interpreted using high quality stereoscopic instruments (e.g. Leica SD3000, WildAVIOPRET, APT2, B&L stereoscopes, etc.). If overlap is 60 percent or greater, onlyevery other frame need be annotated. The alternate frame can then be devoted tofieldwork. High-quality drafting pens are recommended for the annotation process.Pen sizes of 4x0 or 3x0 produce a fine continuous line that can be easily digitized at ascale of 1:24,000; these pens produce lines of 4.3 and 6.0 meters width on the ground.
Once the film has been interpreted and overlays completed, it is then necessary tobring the interpreted habitat polygons into a corrected reference frame and capture theinformation digitally. The reference process usually involves using a zoom transfer
scope to transfer the photo overlay annotations to a hard-copy planimetric base map ofsome type. USGS 7.5-minute quadrangles are the usual choice for this process,although printed orthoquads and NOAA nautical charts are also commonly used. Asecond acetate or mylar overlay is often attached to the base map. The zoom transferscope allows rubber sheeting of the photo overlay and superimposes the view on asimultaneous view of the base map using multiple optical lenses. In this manner the
8/2/2019 Benthic Habitat Mapping Guide (NOAA)
http://slidepdf.com/reader/full/benthic-habitat-mapping-guide-noaa 35/79
31
distortion and displacement inherent in all aerial photography is removed. Habitatdelineations from the aerial photo are then traced onto the base map overlay usingtechnical drafting pens.
RecommendationsThis method is the simplest and easiest to implement by the greatest number of Centercooperators. It requires the least capital investment of any of the methods. In thehands of experienced and diligent photointerpreters, it can produce benthic habitat datasuitable for detailed analysis and for change detection. While this document prefersphotogrammetric methods over analog interpretation, it is useful under the followingconditions:
• When the experience and skill level of the photointerpreters is high but thetechnical resources available to support the work are low.
• When project areas are relatively small with extensive land areas forreference points.
All of these methods, if used by experienced analysts, will produce acceptable benthichabitat data. The choice of which method or which suite of methods to use isdetermined by the project partner. The Center typically works in partnership with state-level cooperators and private-sector vendors to accomplish a project and can providetechnical guidance and in-kind assistance to partners/firms in completing a projectaccording to any of these methods, as well as in selecting an approach for developingbenthic habitat data.
Table DigitizationFollowing transfer of all polygonal annotations to the base map mylars, the linework isdigitized through manual table digitization; alternatively, vector polygon data can be
generated after scanning the overlay and running an automated digitization routine(ArcTrace, R2V). Although an analyst is still required to assist in the automateddecision process, these vectorization routines have the potential to greatly reduce thelabor associated with the digitization/vectorization process. For these routines to worksmoothly, the linework should be heavy enough and contain enough contrast from thebackground mylar to be easily captured during the scanning process and thusrecognized by the vectorization algorithm.
For projects employing the analog method and a zoom transfer rectification process, itwill be necessary to bring line work that has been transferred from the photography to ahard-copy base map into a digital environment. In table digitizing, a copy of the base
map is attached to a digitizing table and registered on the table using a GIS softwaresuch as ArcInfo. Digitization normally is accomplished by first measuring a set ofgraticule tic marks on the map and, once the results show an acceptable spatial error(expressed as root mean square error or RMSE), then tracing the line work with thedigitizing puck. Because the process relies on hard-copy maps, it is recommended thatstable media such as mylar be used for the base maps whenever possible to minimize
8/2/2019 Benthic Habitat Mapping Guide (NOAA)
http://slidepdf.com/reader/full/benthic-habitat-mapping-guide-noaa 36/79
32
the spatial error introduced by shrinkage of the map media. Some simple steps tosuccessful table digitizing include the following:
• Use the highest quality maps. This includes the best material, the mostappropriate scale, and the most recent publication dates.
• Establish a procedure for the digitizing. This typically involves digitizingone feature at a time, using a fixed naming convention, etc.
• Prepare the line work. This involves manually indicating start/stop nodeson polygonal boundaries, assigning easily identifiable names to themeasured tics and clarifying any line-work uncertainties prior to digitizing.
Screen Digitization of Manually Delineated Habitat PolygonsAn alternative approach to zoom transfer and table digitization is the screen digitizationapproach. In this method the aerial photo, with interpreted overlay attached, will bescanned and rectified using control derived from GCPs or other rectified images. In theCenter’s Florida Bay project, interpreted source diapositives at a scale of 1:48,000 werescanned at 600 ppi (pixels per inch). This resulted in a digital image with a resolution of
2 meters. This image provided enough detail to conduct an image-to-imagerectification with digital orthophotoquads provided by the state and adequately capturedthe line work on the overlay. Once the photos/overlays have been scanned andrectified the line work will then be digitized to create the digital polygonal data set.There are several software packages that allow digitization and attribution of the linework. The analyst will manually trace the scanned line work or will employ a vectorizingsoftware that will automatically create a preliminary vector line coverage. Whenmanually digitizing the scanned line work, it is important that the analyst trace the lineconsistently. Most linework on acetate is annotated using high-quality drafting pens.Depending on the gauge of pen used, the delineated lines can be fairly thick. Theanalyst should track either the center of the line so that small manual errors during the
digitization process do not alter the delineated polygon boundaries. Automateddigitizing software (R2V, ArcTrace, etc.) exists that can greatly facilitate the process.Some of these routines capture a digital line coverage in one pass that then requires ananalyst to edit to close polygons, connect arcs, or remove artifacts. Others requireiterative decision making by the analyst to assist the routine in capturing the appropriatelines during breaks or intersections.
At the conclusion of the initial line work generation process, additional processes will berequired to produce a polygon vector coverage with all appropriate habitat attributes.These include editing, building, cleaning, and labeling the polygonal line work.Once these preparatory steps are completed, the line work is ready for digitization. A
general rule is to avoid working near the edge of the table where inaccuracies aresometimes introduced. The process should start with tic measurements to checkRMSE values. RMSE values at this stage of the process are expressed in terms ofdigitizer inches. General values of 0.003 to 0.004 are good for paper maps at 1:24,000.The actual RMSE values for a project should reflect the spatial accuracy requirementsof the data in ground units. During the digitizing process it is recommended that only

8/2/2019 Benthic Habitat Mapping Guide (NOAA)
http://slidepdf.com/reader/full/benthic-habitat-mapping-guide-noaa 37/79
33
one feature at a time be digitized, such as shoreline, then one class of polygons, etc. Itis also recommended that line work should be traced to overshoot intersection points.These can be removed later in the editing process. At the conclusion of either thescreen process (digitizing or interpretation/digitizing) or the table process, the topologybuilding and editing process will follow.
8/2/2019 Benthic Habitat Mapping Guide (NOAA)
http://slidepdf.com/reader/full/benthic-habitat-mapping-guide-noaa 38/79
34
EDITING AND ATTRIBUTING POLYGONAL HABITAT DATA
A final component of benthic mapping from aerial photography is bringing delineatedhabitat polygons into a digital format with polygon topology and attributes. Due to itswidespread availability and relative ease of manipulation, preferred formats for thisdigital line work are Environmental Systems Research Institute (ESRI) polygoncoverages or shapefiles. The editing and attribution process will be needed after thefollowing two data development processes:
• After exporting photogrammetrically derived line work into either Arcgenerate, auto-cad (.dxf), or design (.dgn) files (analytical or soft-copymethods).
• After manual or semiautomatic generation of line work from a screendisplay (analog method).
A vector is a digital element with a defined structure that represents physical forms(elements) such as points, lines, and polygons. These terms are defined below asused in referring to ESRI format data.
• Points represent the locations of a specific geographic feature or objectthat has no area, such as a mountain peak, or navigation buoy.
• Lines consist of unclosed segments and represent linear geographicfeatures, such as rivers, roads, or utility lines.
• Polygons are closed sets of line segments defining homogeneous areas,such as a particular soil type, land use, or water body. The label pointlinks each polygon to its attributes This creates a vector layer thatconsists of both vector features and the attribute information.
Vector data are expressed as a series of vertex coordinates. The vertices that defineeach element are referenced with x, y values (longitude, latitude or easting, northing ).Although it is possible to have points, lines and polygons in a single layer, a layertypically consists of one type of feature.
Building and Cleaning Polygon Topology
Once line work has been digitized, it is necessary to establish the delineated areas asdiscrete polygon units recognizable in a GIS software environment. Two ESRI Arccommands accomplish this, Build and Clean. The Clean c ommand generates acoverage with correct polygon or arc-node topology. Clean edits and correctsgeometric coordinate errors, assembles arcs into polygons and creates feature attributeinformation for each polygon or arc; that is, it creates a polygon attribute table (PAT) orarc attribute table (AAT). Clean can be used to process line coverages in whichintersecting arcs must be split, or to re-create arc-node topology after editing. This toolwill assist in the prevention of dangles and unclosed polygons.
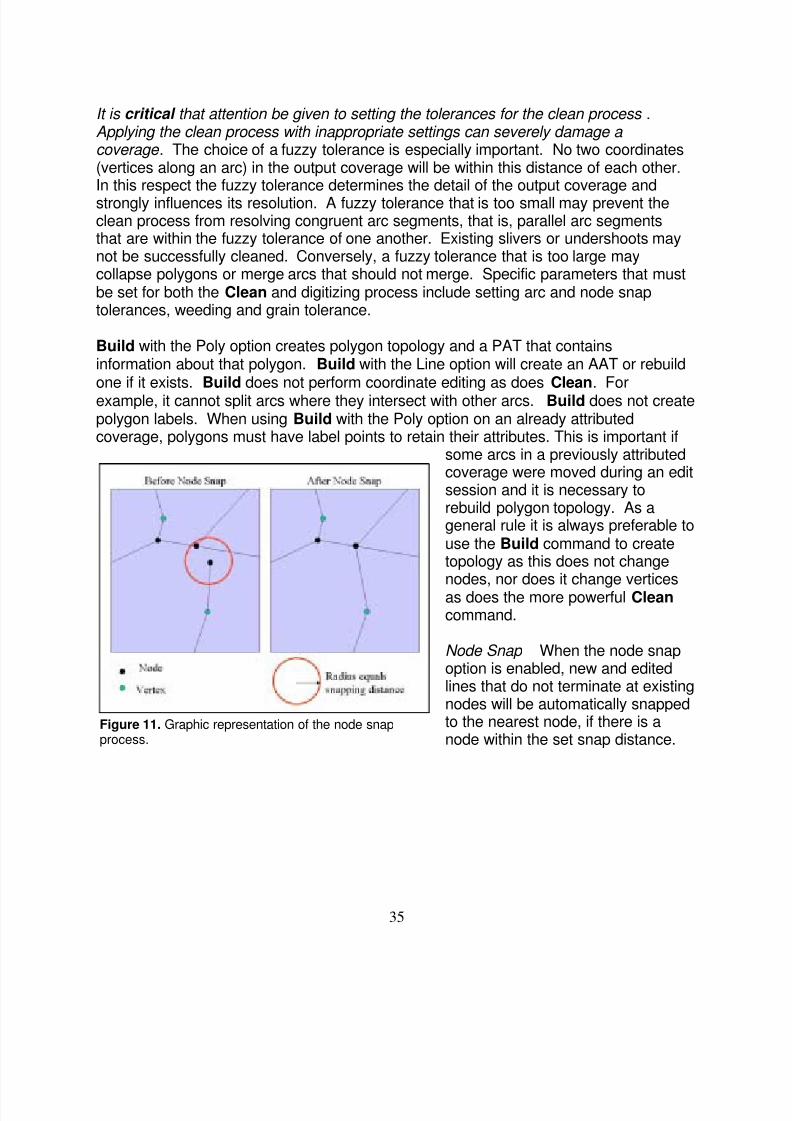
8/2/2019 Benthic Habitat Mapping Guide (NOAA)
http://slidepdf.com/reader/full/benthic-habitat-mapping-guide-noaa 39/79
35
Figure 11. Graphic representation of the node snapprocess.
It is critical that attention be given to setting the tolerances for the clean process .Applying the clean process with inappropriate settings can severely damage a coverage . The choice of a fuzzy tolerance is especially important. No two coordinates(vertices along an arc) in the output coverage will be within this distance of each other.In this respect the fuzzy tolerance determines the detail of the output coverage andstrongly influences its resolution. A fuzzy tolerance that is too small may prevent theclean process from resolving congruent arc segments, that is, parallel arc segmentsthat are within the fuzzy tolerance of one another. Existing slivers or undershoots maynot be successfully cleaned. Conversely, a fuzzy tolerance that is too large maycollapse polygons or merge arcs that should not merge. Specific parameters that mustbe set for both the Clean and digitizing process include setting arc and node snaptolerances, weeding and grain tolerance.
Build with the Poly option creates polygon topology and a PAT that containsinformation about that polygon. Build with the Line option will create an AAT or rebuildone if it exists. Build does not perform coordinate editing as does Clean. Forexample, it cannot split arcs where they intersect with other arcs. Build does not createpolygon labels. When using Build with the Poly option on an already attributedcoverage, polygons must have label points to retain their attributes. This is important if
some arcs in a previously attributedcoverage were moved during an editsession and it is necessary torebuild polygon topology. As ageneral rule it is always preferable touse the Build command to createtopology as this does not changenodes, nor does it change verticesas does the more powerful Cleancommand.
Node Snap When the node snapoption is enabled, new and editedlines that do not terminate at existingnodes will be automatically snappedto the nearest node, if there is anode within the set snap distance.
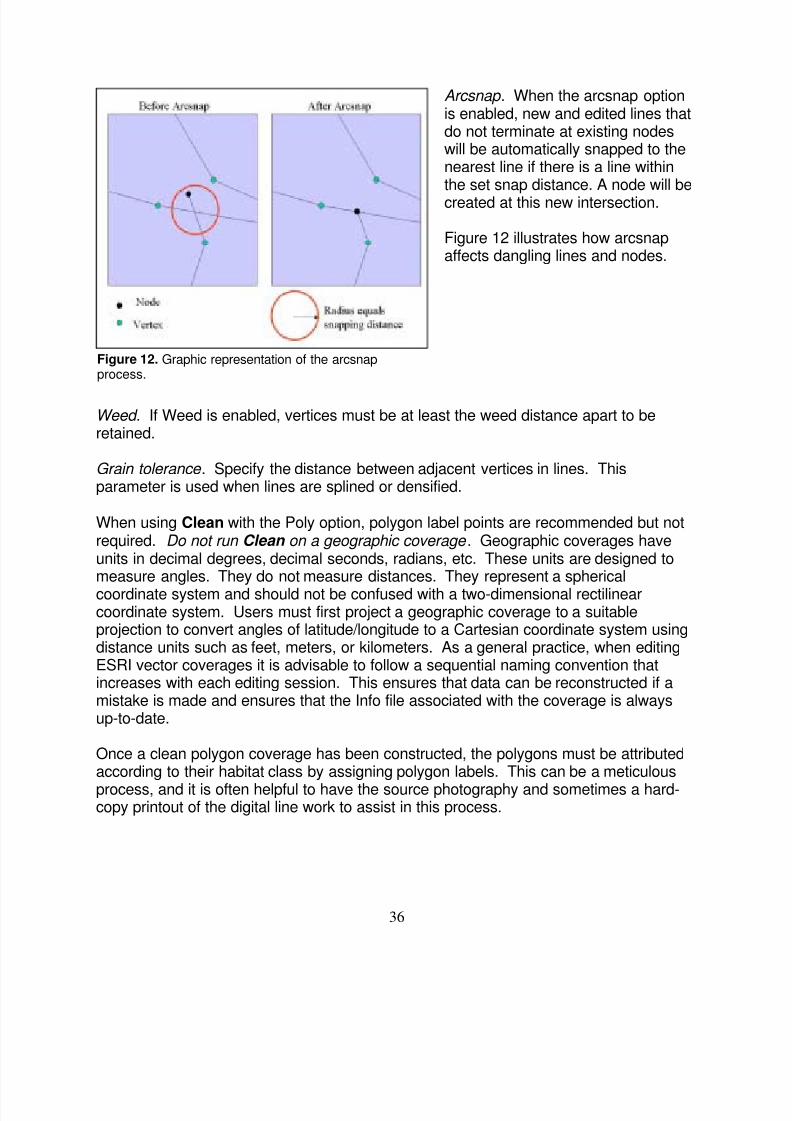
8/2/2019 Benthic Habitat Mapping Guide (NOAA)
http://slidepdf.com/reader/full/benthic-habitat-mapping-guide-noaa 40/79
36
Figure 12. Graphic representation of the arcsnapprocess.
Arcsnap . When the arcsnap optionis enabled, new and edited lines thatdo not terminate at existing nodeswill be automatically snapped to thenearest line if there is a line withinthe set snap distance. A node will becreated at this new intersection.
Figure 12 illustrates how arcsnapaffects dangling lines and nodes.
Weed. If Weed is enabled, vertices must be at least the weed distance apart to beretained.
Grain tolerance . Specify the distance between adjacent vertices in lines. Thisparameter is used when lines are splined or densified.
When using Clean with the Poly option, polygon label points are recommended but notrequired. Do not run Clean on a geographic coverage . Geographic coverages haveunits in decimal degrees, decimal seconds, radians, etc. These units are designed tomeasure angles. They do not measure distances. They represent a spherical
coordinate system and should not be confused with a two-dimensional rectilinearcoordinate system. Users must first project a geographic coverage to a suitableprojection to convert angles of latitude/longitude to a Cartesian coordinate system usingdistance units such as feet, meters, or kilometers. As a general practice, when editingESRI vector coverages it is advisable to follow a sequential naming convention thatincreases with each editing session. This ensures that data can be reconstructed if amistake is made and ensures that the Info file associated with the coverage is alwaysup-to-date.
Once a clean polygon coverage has been constructed, the polygons must be attributedaccording to their habitat class by assigning polygon labels. This can be a meticulous
process, and it is often helpful to have the source photography and sometimes a hard-copy printout of the digital line work to assist in this process.
8/2/2019 Benthic Habitat Mapping Guide (NOAA)
http://slidepdf.com/reader/full/benthic-habitat-mapping-guide-noaa 41/79
37
Reviewing Edited Polygon Coverages
The Quality Assurance and Quality Control process for reviewing vector data in detailedhabitat maps is especially important. There are two processes involved in reviewing theline work digitized from the rectified images. Both rely on visual inspection by atechnician.
The first process utilizes a digital display of the scanned and rectified imagery. Thepolygonal vector data are overlaid onto the imagery and reviewed to assure all lineshave been successfully captured from the overlay. This is readily accomplished byexamining each frame of photography with the line work assigned an easily viewablecolor such as yellow, magenta or red. All line work shared by adjacent photos must beedge matched (this also serves as a check of the relative quality of the imagerectification). Once the analyst is assured that all the line work has been captured andall polygons closed, especially where line work extends over adjacent photos, the nextstep is to check for attribute accuracy and completeness.
All polygons should have label points and polygonal topology (see discussion ofcleaning and building topology). Each habitat class should be expressed as an ASCIIstring and also as a numeric value. This allows a user to examine the table for habitattype, and the numeric value allows statistical examination and manipulation of thehabitat data by class. This becomes important when generating random samples foraccuracy assessment. Each class should also be assigned a unique color, and thecoverage should be checked for obvious errors, i.e., inclusion polygons that are mostlikely non-SAV and adjacent polygons of the same class. Another check should bemade with only the centroids, assigned a unique habitat class color or habitat attribute,displayed. This allows the line work and any identification code on the imagery to beviewed through the polygonal data.
It is often helpful to conduct both these reviews with hard-copy printouts. Test plots ofthe line work should be printed out at the same scale as the photography andcompared to the photos on a light table. Both line work and attributes can then beassessed and any unacceptable data flagged for further editing in the digitalenvironment. In complicated coverages over larger areas, it is helpful to work with theassistance of a grid laid over the printed linework to reduce the chances of missing anitem or rechecking areas that have already been reviewed. Queries of the polygonattribute table are also recommended to check for naming consistency and otherissues.

8/2/2019 Benthic Habitat Mapping Guide (NOAA)
http://slidepdf.com/reader/full/benthic-habitat-mapping-guide-noaa 42/79
38
FIELD SURVEYS
Field surveys are critical to any successful remote sensing project. Due to thedifficulties of mapping submerged habitat imposed by the intervening water column,field surveys are even more critical to creating accurate benthic data. The Center has
traditionally employed extensive field surveys in all of its benthic mapping projects, andthis component will continue to be an important element of future project work. Fieldsurveys provide critical opportunities for educating image analysts, verifying theaccuracy of data, deploying ancillary technologies to assist in the mapping, anddocumenting more detailed habitat character and conditions. However, field surveysare often one of the more costly components of a project. For this reason, efficiency inconducting field operations is especially important. Field activities typically fall into oneof two general categories, signature development and accuracy assessment, the formeroccurring primarily at the beginning or during a project and the latter at the end.Regardless of whether field verification is for signature development or final accuracyassessment, many of the methods for recording site information and the logisticsassociated with fieldwork will be the same. Because benthic field verification canoccasionally involve operation of electronic equipment from small craft, planning forenvironmental, and other conditions is especially important. The following sectionspresent some of the issues to be considered for field visit planning, logistics, andequipment.
PlanningSuccessful fieldwork is contingent upon good planning. Project leaders need toconsider many factors before leading a team onto the water. During the initial planningof a field trip, it is important to identify the goals and desired results of the fieldwork.The goal will determine the types of data that need to be collected and the amount ofpreparation time. Other questions must be considered as well:
• Is this fieldwork for signature development or accuracy assessment?• Considering the goal, what are the minimum amounts of sites that need to
be visited?
For most fieldwork, a boat will be necessary to access sites. It is important to considerthe size of the team and the amount of equipment that can fit comfortably on the boat.The boat must be suitable for the type of fieldwork to be conducted; a dingy would notbe suitable for offshore fieldwork, while a large deep-draft boat would not be suitable forgetting into shallow marshes. Once the goals are clearly identified, a determination ofwhat equipment is necessary to conduct the fieldwork must be made. Two veryimportant considerations must be taken prior to beginning the fieldwork:
• Most computer and GPS equipment is not waterproof, particularly againstsaltwater, unless explicitly stated. The equipment will be vulnerable tohumidity, spray and rain. In addition, equipment will be sensitive to directsunlight and heat.
8/2/2019 Benthic Habitat Mapping Guide (NOAA)
http://slidepdf.com/reader/full/benthic-habitat-mapping-guide-noaa 43/79
39
• What will be the source of power? Batteries may be short-lived and takeup a lot of space on a boat. A generator produces a lot of noise, fumes,and heat and needs to be protected from salt water and direct sunlight.Connecting to the boat's battery may be a feasible option; however, theequipment may possibly drain the boat's battery. The best option for afield team is to use a variety of power sources rather than rely upon oneoption.
WeatherCheck the local weather forecast and conditions the day of fieldwork. A boat with"housing" can extend the amount of fieldwork and the life of the equipment, as thehousing provides protection from harsh weather, direct sunlight, or humidity. Inaddition, it is important to determine the desired navigational track for the fieldwork.The conditions offshore may be extremely different from conditions within a protectedbay. Unfortunately, the team can only plan to do fieldwork during times when theweather is traditionally calm. It is extremely important to recognize that conditions maychange daily and that fieldwork may be canceled or postponed.
TidesUsing bathymetry maps or local expertise, determine if areas to be visited are onlyaccessible during high or low tide. This will reduce the number of boat strandings anddecrease the amount of time at each study site. A nautical chart and/or sound localknowledge is highly recommended.
TurbidityMany observations can be made by swimming, snorkeling, scuba diving and with theassistance of a towed video camera. The field team may find it advantageous toconduct verification activities when phytoplankton blooms are not in season, or after
periods of heavy wind or rain, in order to decrease the amount of time required toadequately characterize the site.
PhenologyField observations are best made as close as possible to the date of photo acquisitionto facilitate comparison between data recorded in the field and signatures observed onthe imagery. If this is not possible, the field team may find it advantageous to conductfieldwork during the same month that the photography was acquired to reduce the errorfrom observations made during the growing and nongrowing season of SAV. Thus, ifthe photography was acquired in June, when SAV has the highest biomass, and thefieldwork were to be conducted in January when biomass is at its lowest, the
differences in observation would likely be due to the differences in the phenology.
8/2/2019 Benthic Habitat Mapping Guide (NOAA)
http://slidepdf.com/reader/full/benthic-habitat-mapping-guide-noaa 44/79
8/2/2019 Benthic Habitat Mapping Guide (NOAA)
http://slidepdf.com/reader/full/benthic-habitat-mapping-guide-noaa 45/79
41
Signature Development
Signature development is the process of visiting areas visible on the imagery anddetermining the actual habitat present in the field. This process serves primarily as atraining tool to support the subsequent mapping effort. Signature development beginsas the aerial imagery is being screened for quality and acceptability. During this review,certain portions of the study area will be easily interpreted, while others will be moredifficult. This could be due to isolated problems with turbidity or depth, or uniquehabitats either not previously encountered by the analyst or unique to a particular studyarea. A signature development visit should be designed around these initial areas ofconfusion. It is recommended that signature development field surveys address thefollowing themes.
Areas of Confusion/UncertaintyThese sites will be the higher priority sites during any field visit. Typical confusion sitesare caused by factors such as turbidity, depth, glint, sediment color that is confusedwith living habitat, unfamiliar habitats, and subtle gradients between identifiable
habitats. There are often a number of these confusion sites within the study area.When prioritizing confusion sites for field examination, the emphasis should be placedon clearly discernable signatures that cannot easily be assigned to a category. Areasof confusion caused by deep or turbid water should be the next priority. As many ofthese sites should be visited as possible.
Areas of Initial ConfidenceIn addition to visiting the priority confusion sites, it is also important to visit and verifyareas that initially seemed easily categorized or mapped. This is important to test theassumptions about the habitat as observed in the preliminary photointerpretation.Occasionally, this visit reveals that the initial assumptions were not correct and that
what had been a simple site may now be a confusion site. These types of adjustmentsoften happen during signature development trips, and some amount of flexibility isnecessary.
8/2/2019 Benthic Habitat Mapping Guide (NOAA)
http://slidepdf.com/reader/full/benthic-habitat-mapping-guide-noaa 46/79
42
DATA VALIDATION METHODS
For every completed data set it is necessary to test the quality and correctness of thedata prior to use and distribution. This final stage is the accuracy assessment.Accuracy assessment falls into two categories, spatial and thematic. Spatial accuracyis the evaluation of the positional correctness of the data, while thematic accuracy is ameasure of whether a habitat or resource is correctly labeled in the final data. Both areof critical importance since errors in baseline data can be propagated through thechange detection process resulting in false estimates of habitat gain or loss. Portionsof the following discussions on spatial and thematic accuracy are drawn from Chapter 5of the 1995 report. Recommendations on how to assess the spatial and thematicaccuracy of benthic data are also included. In addition, a short discussion of thetimeliness of the assessment and possible approaches to address this issue arepresented in a section on temporal accuracy.
Spatial Accuracy
Spatial or positional accuracy is a measure of the accuracy of the geometric placementof points, lines, and polygon boundaries. Positional accuracy of photographicdelineations of submersed habitat is increasingly of concern to resource managers;however, it has not often been a subject of independent verification. This iscompounded by the fact that positional errors may be difficult to detect even whenverifying a specific polygon in the field. For a single time period, positional errors maynot greatly affect the aggregate area of each cover type. For change detection,however, positional accuracy is a crucial concern (Ferguson et al. 1992, 1993).Change data, especially data produced by post-classification comparison, willconspicuously record positional errors in excess of about 10 meters between data sets.This compounds the problem of recognizing real changes in the extent of habitat, whichalso tend to occur at polygon edges and class boundaries.
Registration of benthic habitat polygon edges is a function of a combination of factors,including the metric quality of photographs, the methods used to transfer theinformation to a planimetric map base, the spatial accuracy of that base map, thephotorectification process (including the quality of the source control points), and thequality of the digitization performed. In every case the spatial accuracy of the finaldigital data set is only as high as the least accurate source of control. The spatialaccuracy of delineations derived using table methods will only be as accurate as thebase map. In many cases, the most commonly available base maps are USGS 7.5-minute quads. These have spatial accuracies that meet National Map AccuracyStandards, which at a scale of 1:24,000 amounts to 13.3 meters on the ground. This is the minimum spatial accuracy for Center data.
With the increased availability of higher sources of control, such as differential GPSunits and digital orthoquads, and as image rectification software becomes more
8/2/2019 Benthic Habitat Mapping Guide (NOAA)
http://slidepdf.com/reader/full/benthic-habitat-mapping-guide-noaa 47/79
43
common and easy to apply, the need to depend on base maps at National MapAccuracy Standards is diminishing. Soft-copy and analytical photogrammetric methodsshould produce data with spatial accuracies on the order of 1 or 2 meters. While therecent deactivation of Selective Availability by the U.S. Department of Defense hasgreatly increased the spatial accuracy of GPS units without a real-time differentialcorrection beacon, the accuracies of uncorrected GPS readings remain on the order oftens of meters and is still not recommended for determining spatial accuracy of Centerdigital data.
Recommended ApproachThe Center’s benthic habitat mapping project has implemented two tests of spatialaccuracy based on project work in Indian River Lagoon, Florida, and coastalMassachusetts. In the first test, the benthic habitat polygons are spatially buffered toproduce a zone following the delineated lines. The width of the zone should bedetermined by the expected accuracy of the weakest source of control. In the Center’sexperience, using differential GPS as the primary source of control, a buffer of 5 meterson either side of the line is recommended. This buffer allows for real-time differential
GPS readings that produce values less than 1 meter, but that occasionally producereadings greater than 1 meter. It also allows for boat motion and addresses thedifficulty of precisely positioning a vessel on the water. This buffer should bedetermined by the scale of the imagery and by the sources of control that were used tobring the data into a reference plane. The maximum buffer width should be 13 meterson either side of the polygon boundary to be consistent with National Map AccuracyStandards. This buffered vector data set then becomes a source of randomly selectedspatial accuracy points that are verified in the field by video observation or diving.
In multidensity habitat classes only the boundaries of high-density (continuous cover)polygons should be examined to reduce potential subjectivity associated with patchy
polygon boundaries (Bruce et al.1998). At each sample point, a video or diver transectcan be run across the buffer zone, and if the edge of a habitat is detected within thezone, then the polygon boundary can be considered to have met the spatial accuracyrequirements. This test is most needed in large open-water areas and is alsorecommended in more enclosed environmental settings to check the accuracy of thebenthic polygon data. When performing this test, consideration should be given to anyseasonal differences between the date of the imagery and the date of the fieldverification. Changes in phenology may affect the apparent edge of certain habitatssuch as seagrass meadows and algal beds.
A second test of spatial accuracy is also recommended to further address the
challenges of precisely positioning a small vessel on the water for more than a fewmoments, and the occasional difficulty of determining a habitat edge during low visibilitydiving or in a patchy environment. In this test, a fixed terrestrial linear feature, such asa road or reinforced shoreline is delineated periodically during the mapping process.The closer this feature is to the center of the image and the water the better. A
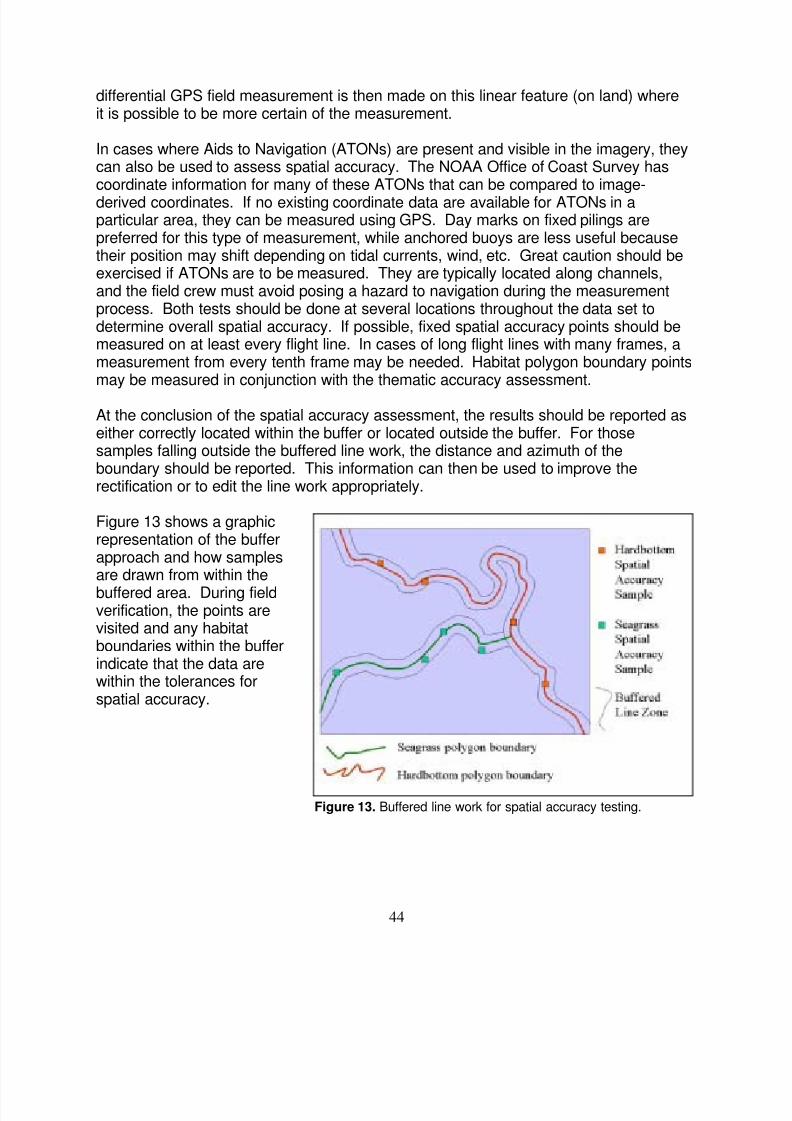
8/2/2019 Benthic Habitat Mapping Guide (NOAA)
http://slidepdf.com/reader/full/benthic-habitat-mapping-guide-noaa 48/79
44
Figure 13. Buffered line work for spatial accuracy testing.
differential GPS field measurement is then made on this linear feature (on land) whereit is possible to be more certain of the measurement.
In cases where Aids to Navigation (ATONs) are present and visible in the imagery, theycan also be used to assess spatial accuracy. The NOAA Office of Coast Survey hascoordinate information for many of these ATONs that can be compared to image-derived coordinates. If no existing coordinate data are available for ATONs in aparticular area, they can be measured using GPS. Day marks on fixed pilings arepreferred for this type of measurement, while anchored buoys are less useful becausetheir position may shift depending on tidal currents, wind, etc. Great caution should beexercised if ATONs are to be measured. They are typically located along channels,and the field crew must avoid posing a hazard to navigation during the measurementprocess. Both tests should be done at several locations throughout the data set todetermine overall spatial accuracy. If possible, fixed spatial accuracy points should bemeasured on at least every flight line. In cases of long flight lines with many frames, ameasurement from every tenth frame may be needed. Habitat polygon boundary pointsmay be measured in conjunction with the thematic accuracy assessment.
At the conclusion of the spatial accuracy assessment, the results should be reported aseither correctly located within the buffer or located outside the buffer. For thosesamples falling outside the buffered line work, the distance and azimuth of theboundary should be reported. This information can then be used to improve therectification or to edit the line work appropriately.
Figure 13 shows a graphicrepresentation of the bufferapproach and how samplesare drawn from within the
buffered area. During fieldverification, the points arevisited and any habitatboundaries within the bufferindicate that the data arewithin the tolerances forspatial accuracy.
8/2/2019 Benthic Habitat Mapping Guide (NOAA)
http://slidepdf.com/reader/full/benthic-habitat-mapping-guide-noaa 49/79
45
Thematic Accuracy
Thematic or attribute accuracy is a measure of the probability that the cover type forany given polygon is properly identified according to the classification scheme. Theremote sensing literature contains a variety of procedures for measuring attributeaccuracy (Congalton 1991). Generally, these procedures serve well for single timeperiods and for relatively small study areas. Historical data, however, cannot be fieldverified and conventional procedures also are difficult to apply to large (hundreds ofsquare kilometers) open-water areas, especially when operating out of small boats.
Thematic accuracy of remotely derived spatial data is influenced by a number offactors. The most critical is the quality of the source imagery. Others are thecomplexity of the benthic environment, the experience of the analyst, the amount ofsignature development that has been done to support the mapping, temporaldifferences between image date/season and verification data/season, the spatialprecision of the field verification data, and the logical integrity of the classificationsystem (Congalton et al. 1983; Congalton 1988; and Felix and Binney 1989). The
reported thematic accuracy of a digital map may also be negatively influenced by errorsin making an accurate field determination of habitat type. This can occur when poorvisibility hinders direct observation of habitat in a site or when the boundary betweenhabitat classes occurs across a transition zone of patchy or fragmented habitat.
Recommended ApproachCurrently the approach for thematic accuracy assessment of submersed habitat issimilar to that for emergent and upland habitat, but it should be noted that data forsubmersed habitat are intrinsically vector, not raster. Since Center benthic habitat dataare typically in a vector data structure, the actual units of the data are the polygonsthemselves, which constitute the thematic accuracy assessment sample units (Elliot
and Bruce 1998).
Habitat polygons (samples) should be selected by random sample stratified by class.Other stratification criteria that are useful are region (water body) and bathymetry.Vector water body and bathymetric contours can be merged with the habitat datathrough the Arc Union process to produce a stratified source for sample units.Additional sample locations from potential habitat sites (for example, areas of suitabledepth but devoid of mapped habitat) should also be selected. By converting the vectorhabitat data to a raster format such as an Arc grid, automated sample generatingroutines within commercial image processing softwares such as ERDAS Imagine canbe used. The resulting sample set can be stored in a database format that is
compatible with pen-based field softwares or ESRI’s ArcView.
An ongoing area of research within the remote sensing community is the appropriatesample size for a classified remotely derived data set. This sample size should bebased on the expected variance of the cover classification. To date, little research hasbeen done in the area of benthic habitat. Congalton and Green (1999) recommend as
8/2/2019 Benthic Habitat Mapping Guide (NOAA)
http://slidepdf.com/reader/full/benthic-habitat-mapping-guide-noaa 50/79
46
a rule of thumb a sample size of 50 samples (polygons) per class. This was also thesample size for land cover classification accuracy assessment recommended by Hay(1979). In every thematic accuracy assessment effort a balance must be reachedbetween the need to collect a statistically valid sample size and the challenges ofvisiting a large number of sites in small boats over project areas on the scale of majorestuaries. While the 50 points per class number was derived based on experience withterrestrial land cover data, this approach was successfully implemented in the WillapaBay, Washington benthic mapping project. Over a period of several days it waspossible to sample this many points from a 4-class map with a reasonable effort.
When visiting the sample points (polygons) it is important to examine the polygon forboth internal attribute integrity as well as the accuracy of its delineated edge. In largepolygons this can be an intensive process involving multiple video tows or dives.Observations can be made starting with circular tows or dives in the interior of polygons.The National Ocean Service uses a 7-meter radius for this type of observation in coralreef mapping. This should be the minimum area surveyed to assess the internalattributes of a polygon. Video or dive tracks should then be made across the polygon
to determine how well it has been delineated. In many cases at least two tracks normalto each other are needed to fully assess the polygon. During field verification, thefollowing minimum number of items should be recorded:
• Latitude or northing of center of polygon• Longitude or easting of center of polygon• Depth• Date• Map classification• Observed field classification• Time
• Observation method (either snorkeling, boat, or video). In the case ofvideo it is helpful to record what tape the site is captured on.
When making field observations for comparison to aerial synoptic data, the issue ofscale becomes an important factor. Diver or video observation typically takes place ona scale of meters, while remote observations are made at the kilometer scale.Individuals making the field verification should bear in mind that they will see smallhabitat changes within an area likely to have been given a single habitat attribute by themapper. Small openings and bare areas are often seen within a continuous SAV bedand do not necessarily indicate an inaccuracy. Likewise, individual plants or coralheads do not necessarily constitute SAV or coral habitats. A limited study comparing
video transects to aerial photography in Core Sound, North Carolina, highlightedsignificant challenges to integrating these two data streams due to scale issues(Fonseca et al., in publication).
8/2/2019 Benthic Habitat Mapping Guide (NOAA)
http://slidepdf.com/reader/full/benthic-habitat-mapping-guide-noaa 51/79
47
At the conclusion of the field visit, the accuracy assessment database containing thefield observations should be used to construct an error matrix. This matrix should beused to calculate overall and category-specific accuracies as well as a kappa coefficientand conditional kappa for each class. The kappa coefficient is a statistical measure ofthe actual agreement minus chance agreement and measures how well thecategorization sample reflects the actual data. A kappa value of 0.0 is obtained whenagreement between the reference data and a categorization result is the same as theagreement that would occur from chance alone. The upper limit of kappa is 1.0, whichoccurs only when there is perfect agreement (Rosenfeld and Fitzpatrick-Lins 1986).Kappa values below 0.5 may suggest that the results of the accuracy assessment donot actually reflect the validity of the data. The results of the error analysis should meetan overall accuracy of 85 percent.
Temporal Accuracy
An important issue to be considered when planning the accuracy assessment of a
benthic habitat data set is timeliness. Many benthic habitats, especially seagrassmeadows, are dynamic resources that colonize new areas and die back from existingareas from season to season. Many are also subject to significant impacts fromcatastrophic events such as hurricanes. Unfortunately, it is not unusual for theaccuracy assessment stage of a mapping project to occur months or years after theoriginal imagery and source data were collected. The changes that can occur in ahabitat over that time can hinder the ability to assess both the spatial and thematicaccuracy of a data set.
To the extent feasible, the Center recommends that during the initial signaturedevelopment stage, a selected set of field observations be collected that will later serve
as accuracy assessment samples more concurrent with the imagery. Collecting thisinitial field information as close as possible to the date of the aerial mission increasesthe utility of these points for a true accuracy assessment. These samples should thenbe separated from the signature development data and not examined until the finalaccuracy assessment stage.
If a previous data set is available, the polygons in this data may be a source of initialsample points that can be visited during the overflight, before the analyst has imagery inhand. These points can then serve as a set of concurrent accuracy assessmentsamples.
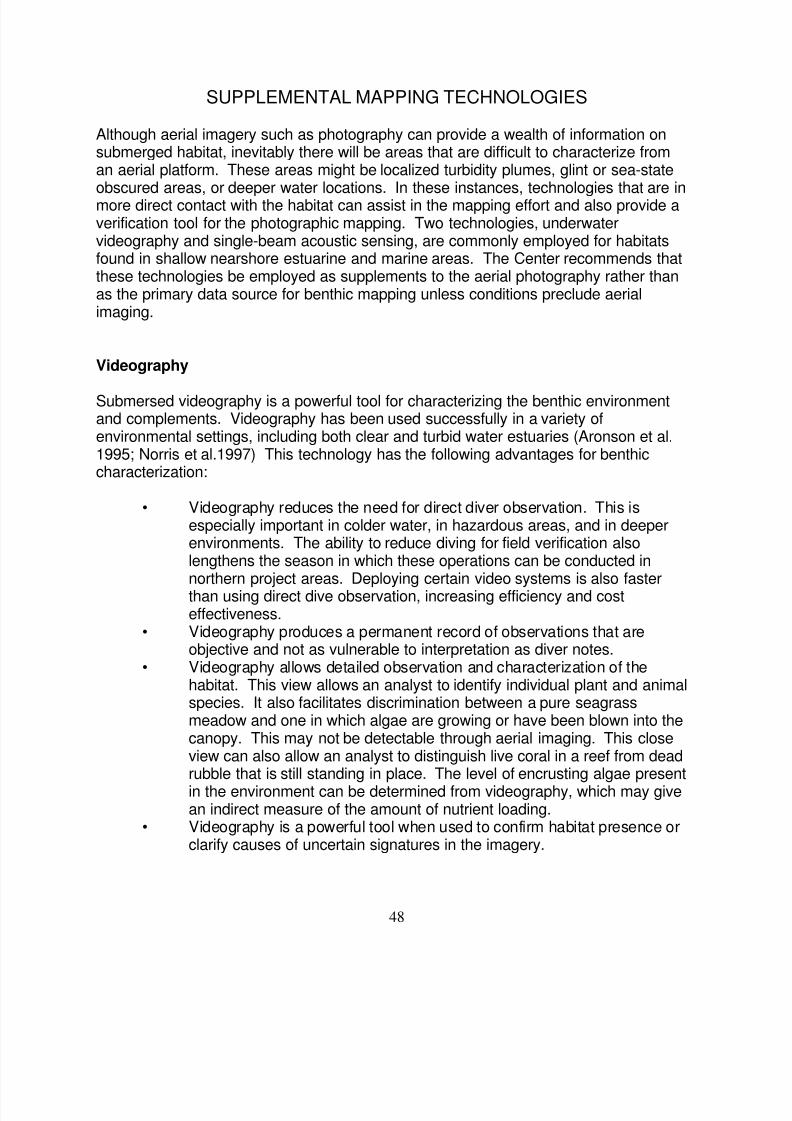
8/2/2019 Benthic Habitat Mapping Guide (NOAA)
http://slidepdf.com/reader/full/benthic-habitat-mapping-guide-noaa 52/79
48
SUPPLEMENTAL MAPPING TECHNOLOGIES
Although aerial imagery such as photography can provide a wealth of information onsubmerged habitat, inevitably there will be areas that are difficult to characterize froman aerial platform. These areas might be localized turbidity plumes, glint or sea-stateobscured areas, or deeper water locations. In these instances, technologies that are inmore direct contact with the habitat can assist in the mapping effort and also provide averification tool for the photographic mapping. Two technologies, underwatervideography and single-beam acoustic sensing, are commonly employed for habitatsfound in shallow nearshore estuarine and marine areas. The Center recommends thatthese technologies be employed as supplements to the aerial photography rather thanas the primary data source for benthic mapping unless conditions preclude aerialimaging.
Videography
Submersed videography is a powerful tool for characterizing the benthic environmentand complements. Videography has been used successfully in a variety ofenvironmental settings, including both clear and turbid water estuaries (Aronson et al.1995; Norris et al.1997) This technology has the following advantages for benthiccharacterization:
• Videography reduces the need for direct diver observation. This isespecially important in colder water, in hazardous areas, and in deeperenvironments. The ability to reduce diving for field verification alsolengthens the season in which these operations can be conducted innorthern project areas. Deploying certain video systems is also fasterthan using direct dive observation, increasing efficiency and costeffectiveness.
• Videography produces a permanent record of observations that areobjective and not as vulnerable to interpretation as diver notes.
• Videography allows detailed observation and characterization of thehabitat. This view allows an analyst to identify individual plant and animalspecies. It also facilitates discrimination between a pure seagrassmeadow and one in which algae are growing or have been blown into thecanopy. This may not be detectable through aerial imaging. This closeview can also allow an analyst to distinguish live coral in a reef from deadrubble that is still standing in place. The level of encrusting algae presentin the environment can be determined from videography, which may givean indirect measure of the amount of nutrient loading.
• Videography is a powerful tool when used to confirm habitat presence orclarify causes of uncertain signatures in the imagery.
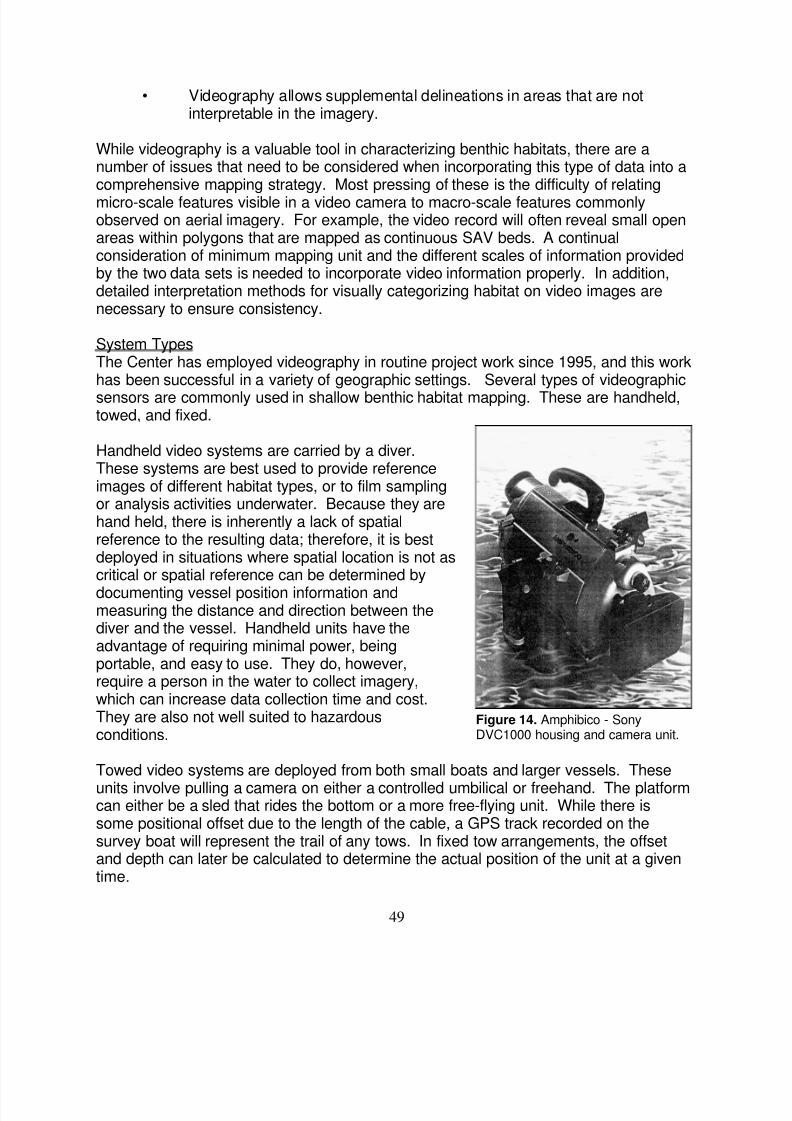
8/2/2019 Benthic Habitat Mapping Guide (NOAA)
http://slidepdf.com/reader/full/benthic-habitat-mapping-guide-noaa 53/79
49
Figure 14. Amphibico - SonyDVC1000 housing and camera unit.
• Videography allows supplemental delineations in areas that are notinterpretable in the imagery.
While videography is a valuable tool in characterizing benthic habitats, there are anumber of issues that need to be considered when incorporating this type of data into acomprehensive mapping strategy. Most pressing of these is the difficulty of relatingmicro-scale features visible in a video camera to macro-scale features commonlyobserved on aerial imagery. For example, the video record will often reveal small openareas within polygons that are mapped as continuous SAV beds. A continualconsideration of minimum mapping unit and the different scales of information providedby the two data sets is needed to incorporate video information properly. In addition,detailed interpretation methods for visually categorizing habitat on video images arenecessary to ensure consistency.
System TypesThe Center has employed videography in routine project work since 1995, and this workhas been successful in a variety of geographic settings. Several types of videographic
sensors are commonly used in shallow benthic habitat mapping. These are handheld,towed, and fixed.
Handheld video systems are carried by a diver.These systems are best used to provide referenceimages of different habitat types, or to film samplingor analysis activities underwater. Because they arehand held, there is inherently a lack of spatialreference to the resulting data; therefore, it is bestdeployed in situations where spatial location is not ascritical or spatial reference can be determined by
documenting vessel position information andmeasuring the distance and direction between thediver and the vessel. Handheld units have theadvantage of requiring minimal power, beingportable, and easy to use. They do, however,require a person in the water to collect imagery,which can increase data collection time and cost.They are also not well suited to hazardousconditions.
Towed video systems are deployed from both small boats and larger vessels. These
units involve pulling a camera on either a controlled umbilical or freehand. The platformcan either be a sled that rides the bottom or a more free-flying unit. While there issome positional offset due to the length of the cable, a GPS track recorded on thesurvey boat will represent the trail of any tows. In fixed tow arrangements, the offsetand depth can later be calculated to determine the actual position of the unit at a giventime.
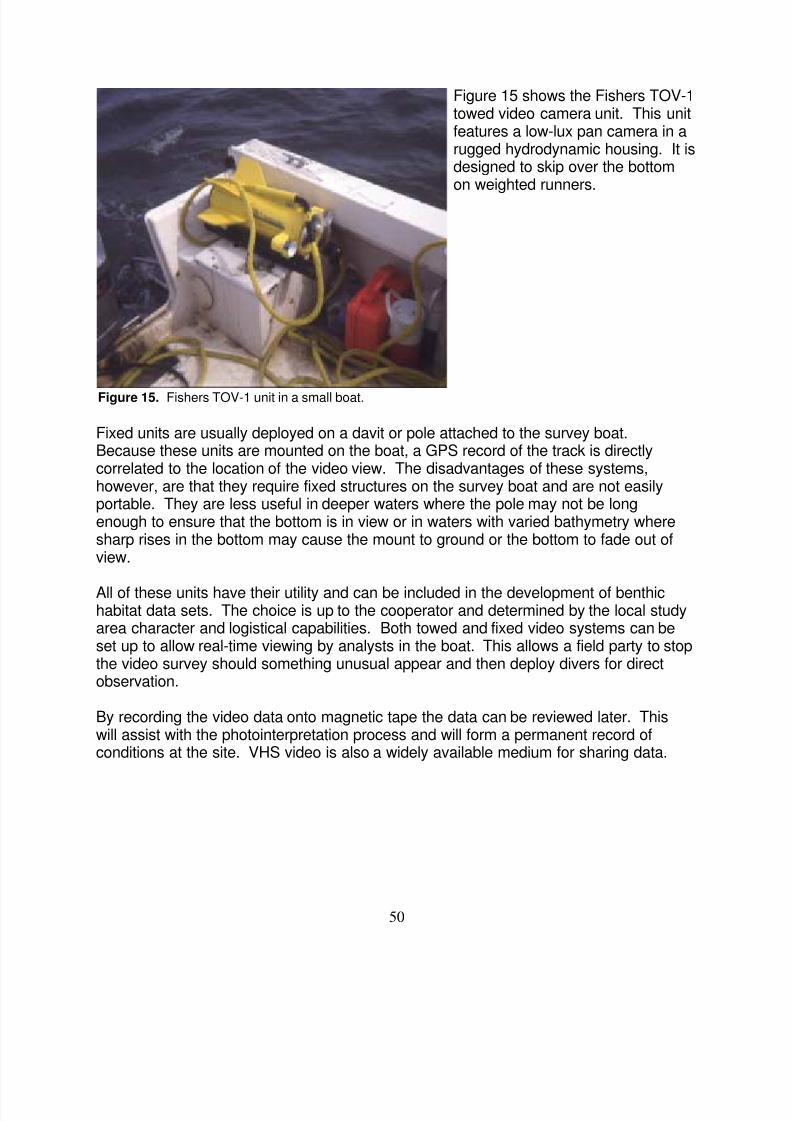
8/2/2019 Benthic Habitat Mapping Guide (NOAA)
http://slidepdf.com/reader/full/benthic-habitat-mapping-guide-noaa 54/79
50
Figure 15. Fishers TOV-1 unit in a small boat.
Figure 15 shows the Fishers TOV-1towed video camera unit. This unitfeatures a low-lux pan camera in arugged hydrodynamic housing. It isdesigned to skip over the bottomon weighted runners.
Fixed units are usually deployed on a davit or pole attached to the survey boat.Because these units are mounted on the boat, a GPS record of the track is directlycorrelated to the location of the video view. The disadvantages of these systems,however, are that they require fixed structures on the survey boat and are not easilyportable. They are less useful in deeper waters where the pole may not be longenough to ensure that the bottom is in view or in waters with varied bathymetry wheresharp rises in the bottom may cause the mount to ground or the bottom to fade out ofview.
All of these units have their utility and can be included in the development of benthichabitat data sets. The choice is up to the cooperator and determined by the local studyarea character and logistical capabilities. Both towed and fixed video systems can beset up to allow real-time viewing by analysts in the boat. This allows a field party to stopthe video survey should something unusual appear and then deploy divers for directobservation.
By recording the video data onto magnetic tape the data can be reviewed later. Thiswill assist with the photointerpretation process and will form a permanent record ofconditions at the site. VHS video is also a widely available medium for sharing data.
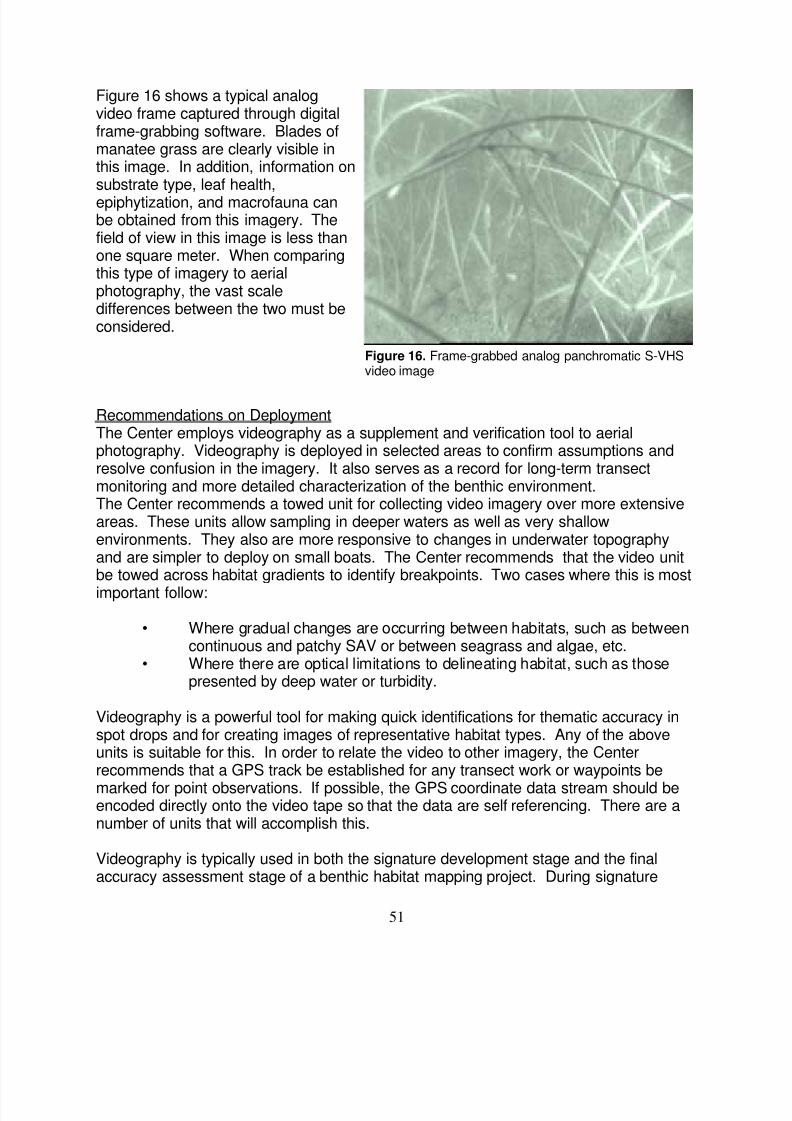
8/2/2019 Benthic Habitat Mapping Guide (NOAA)
http://slidepdf.com/reader/full/benthic-habitat-mapping-guide-noaa 55/79
51
Figure 16. Frame-grabbed analog panchromatic S-VHSvideo image
Figure 16 shows a typical analogvideo frame captured through digitalframe-grabbing software. Blades ofmanatee grass are clearly visible inthis image. In addition, information onsubstrate type, leaf health,epiphytization, and macrofauna canbe obtained from this imagery. Thefield of view in this image is less thanone square meter. When comparingthis type of imagery to aerialphotography, the vast scaledifferences between the two must beconsidered.
Recommendations on DeploymentThe Center employs videography as a supplement and verification tool to aerialphotography. Videography is deployed in selected areas to confirm assumptions andresolve confusion in the imagery. It also serves as a record for long-term transectmonitoring and more detailed characterization of the benthic environment.The Center recommends a towed unit for collecting video imagery over more extensiveareas. These units allow sampling in deeper waters as well as very shallowenvironments. They also are more responsive to changes in underwater topographyand are simpler to deploy on small boats. The Center recommends that the video unitbe towed across habitat gradients to identify breakpoints. Two cases where this is most
important follow:
• Where gradual changes are occurring between habitats, such as betweencontinuous and patchy SAV or between seagrass and algae, etc.
• Where there are optical limitations to delineating habitat, such as thosepresented by deep water or turbidity.
Videography is a powerful tool for making quick identifications for thematic accuracy inspot drops and for creating images of representative habitat types. Any of the aboveunits is suitable for this. In order to relate the video to other imagery, the Centerrecommends that a GPS track be established for any transect work or waypoints be
marked for point observations. If possible, the GPS coordinate data stream should beencoded directly onto the video tape so that the data are self referencing. There are anumber of units that will accomplish this.
Videography is typically used in both the signature development stage and the finalaccuracy assessment stage of a benthic habitat mapping project. During signature
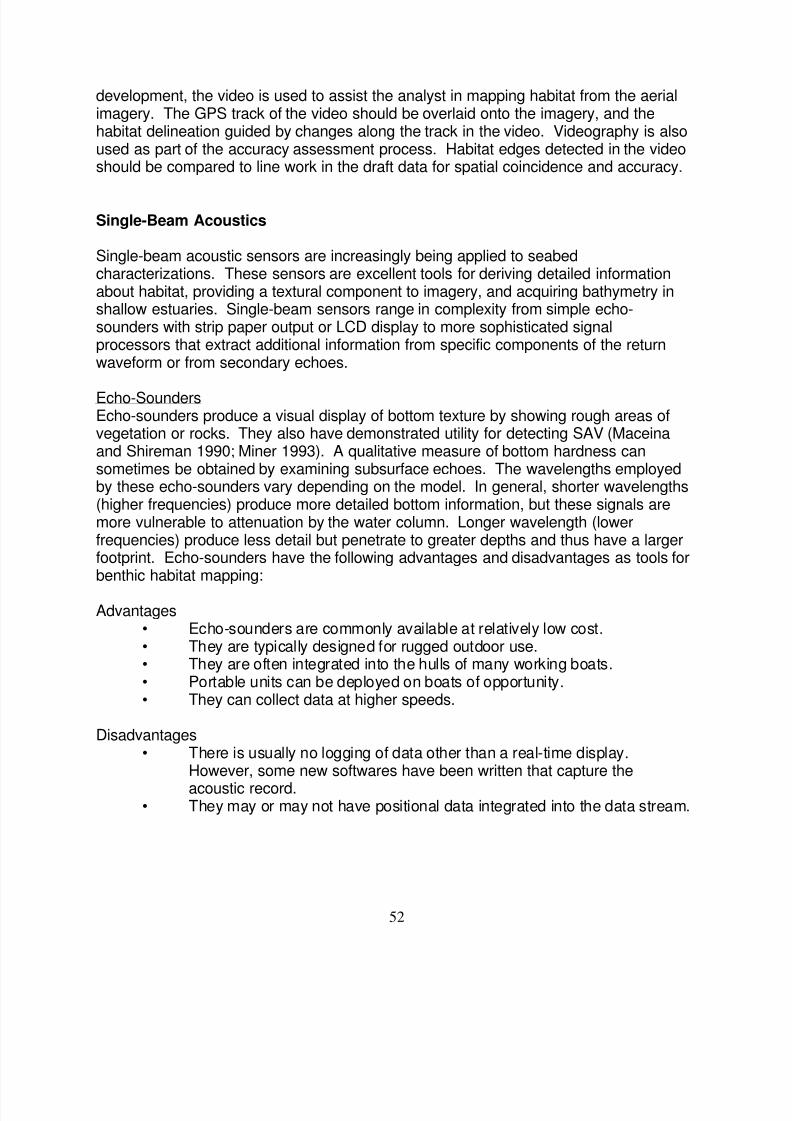
8/2/2019 Benthic Habitat Mapping Guide (NOAA)
http://slidepdf.com/reader/full/benthic-habitat-mapping-guide-noaa 56/79
52
development, the video is used to assist the analyst in mapping habitat from the aerialimagery. The GPS track of the video should be overlaid onto the imagery, and thehabitat delineation guided by changes along the track in the video. Videography is alsoused as part of the accuracy assessment process. Habitat edges detected in the videoshould be compared to line work in the draft data for spatial coincidence and accuracy.
Single-Beam Acoustics
Single-beam acoustic sensors are increasingly being applied to seabedcharacterizations. These sensors are excellent tools for deriving detailed informationabout habitat, providing a textural component to imagery, and acquiring bathymetry inshallow estuaries. Single-beam sensors range in complexity from simple echo-sounders with strip paper output or LCD display to more sophisticated signalprocessors that extract additional information from specific components of the returnwaveform or from secondary echoes.
Echo-SoundersEcho-sounders produce a visual display of bottom texture by showing rough areas ofvegetation or rocks. They also have demonstrated utility for detecting SAV (Maceinaand Shireman 1990; Miner 1993). A qualitative measure of bottom hardness cansometimes be obtained by examining subsurface echoes. The wavelengths employedby these echo-sounders vary depending on the model. In general, shorter wavelengths(higher frequencies) produce more detailed bottom information, but these signals aremore vulnerable to attenuation by the water column. Longer wavelength (lowerfrequencies) produce less detail but penetrate to greater depths and thus have a largerfootprint. Echo-sounders have the following advantages and disadvantages as tools forbenthic habitat mapping:
Advantages• Echo-sounders are commonly available at relatively low cost.• They are typically designed for rugged outdoor use.• They are often integrated into the hulls of many working boats.• Portable units can be deployed on boats of opportunity.• They can collect data at higher speeds.
Disadvantages• There is usually no logging of data other than a real-time display.
However, some new softwares have been written that capture the
acoustic record.• They may or may not have positional data integrated into the data stream.
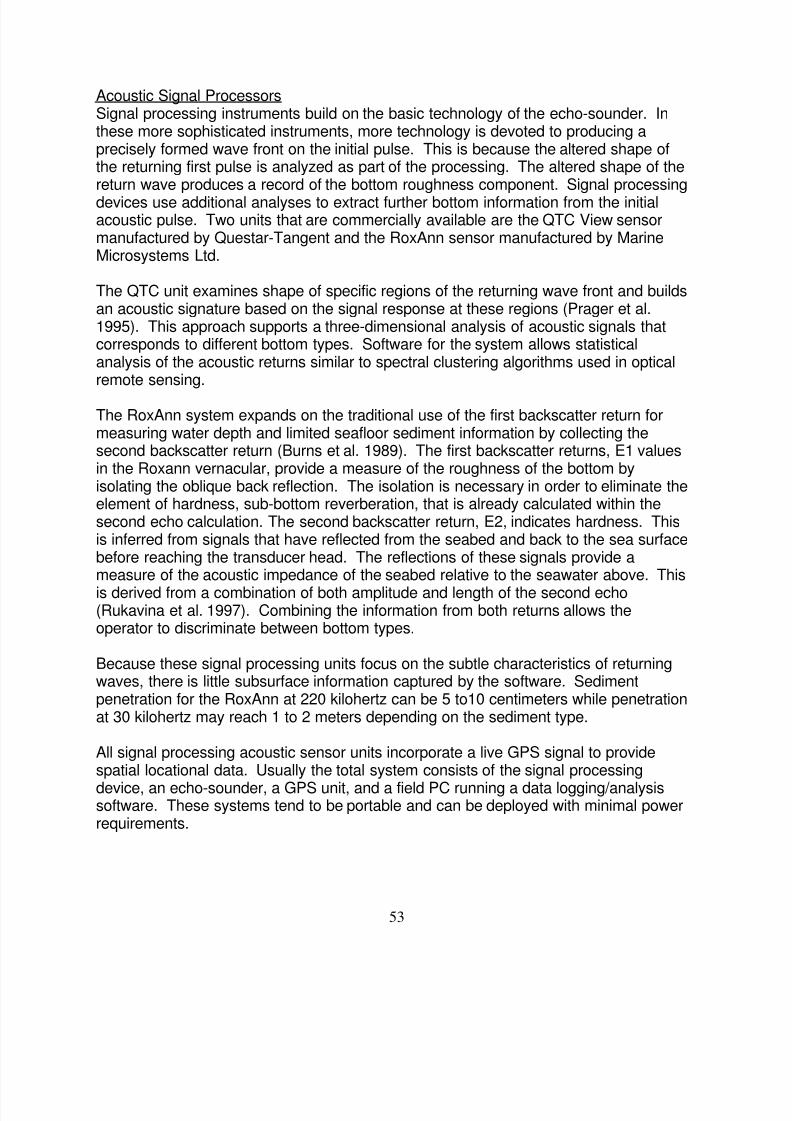
8/2/2019 Benthic Habitat Mapping Guide (NOAA)
http://slidepdf.com/reader/full/benthic-habitat-mapping-guide-noaa 57/79
53
Acoustic Signal ProcessorsSignal processing instruments build on the basic technology of the echo-sounder. Inthese more sophisticated instruments, more technology is devoted to producing aprecisely formed wave front on the initial pulse. This is because the altered shape ofthe returning first pulse is analyzed as part of the processing. The altered shape of thereturn wave produces a record of the bottom roughness component. Signal processingdevices use additional analyses to extract further bottom information from the initialacoustic pulse. Two units that are commercially available are the QTC View sensormanufactured by Questar-Tangent and the RoxAnn sensor manufactured by MarineMicrosystems Ltd.
The QTC unit examines shape of specific regions of the returning wave front and buildsan acoustic signature based on the signal response at these regions (Prager et al.1995). This approach supports a three-dimensional analysis of acoustic signals thatcorresponds to different bottom types. Software for the system allows statisticalanalysis of the acoustic returns similar to spectral clustering algorithms used in opticalremote sensing.
The RoxAnn system expands on the traditional use of the first backscatter return formeasuring water depth and limited seafloor sediment information by collecting thesecond backscatter return (Burns et al. 1989). The first backscatter returns, E1 valuesin the Roxann vernacular, provide a measure of the roughness of the bottom byisolating the oblique back reflection. The isolation is necessary in order to eliminate theelement of hardness, sub-bottom reverberation, that is already calculated within thesecond echo calculation. The second backscatter return, E2, indicates hardness. Thisis inferred from signals that have reflected from the seabed and back to the sea surfacebefore reaching the transducer head. The reflections of these signals provide ameasure of the acoustic impedance of the seabed relative to the seawater above. This
is derived from a combination of both amplitude and length of the second echo(Rukavina et al. 1997). Combining the information from both returns allows theoperator to discriminate between bottom types.
Because these signal processing units focus on the subtle characteristics of returningwaves, there is little subsurface information captured by the software. Sedimentpenetration for the RoxAnn at 220 kilohertz can be 5 to10 centimeters while penetrationat 30 kilohertz may reach 1 to 2 meters depending on the sediment type.
All signal processing acoustic sensor units incorporate a live GPS signal to providespatial locational data. Usually the total system consists of the signal processing
device, an echo-sounder, a GPS unit, and a field PC running a data logging/analysissoftware. These systems tend to be portable and can be deployed with minimal powerrequirements.
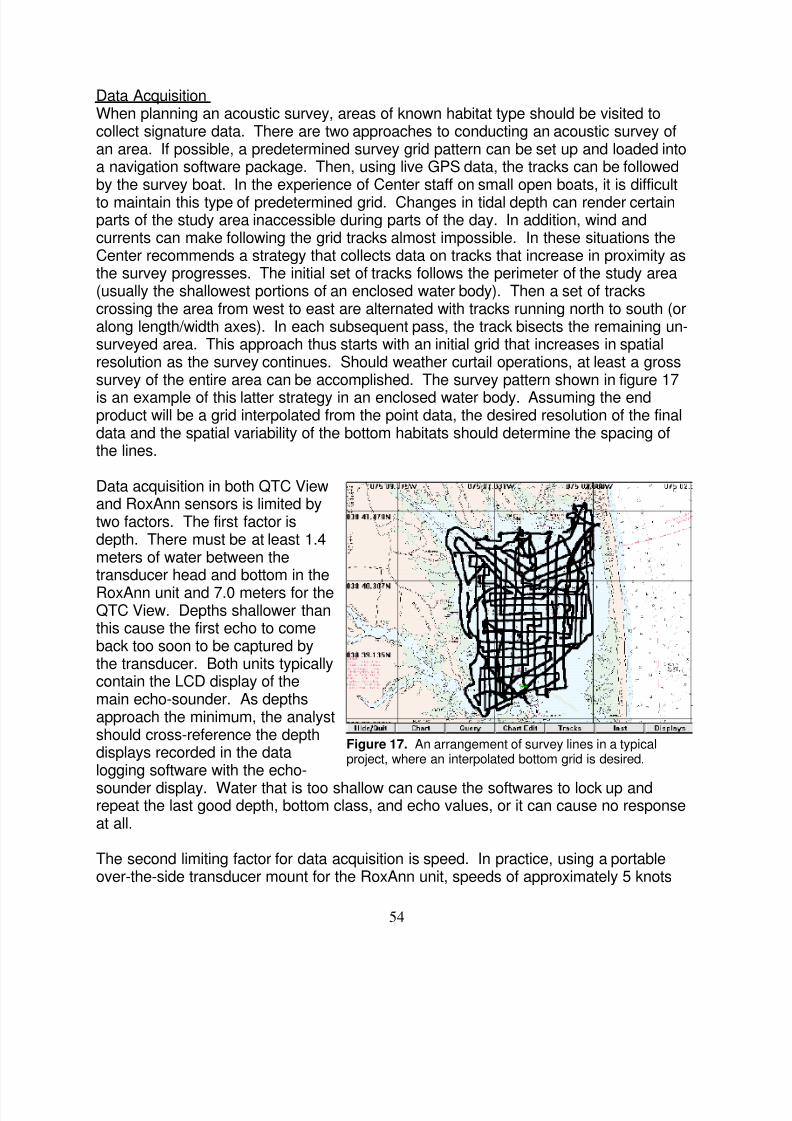
8/2/2019 Benthic Habitat Mapping Guide (NOAA)
http://slidepdf.com/reader/full/benthic-habitat-mapping-guide-noaa 58/79
54
Figure 17. An arrangement of survey lines in a typicalproject, where an interpolated bottom grid is desired.
Data AcquisitionWhen planning an acoustic survey, areas of known habitat type should be visited tocollect signature data. There are two approaches to conducting an acoustic survey ofan area. If possible, a predetermined survey grid pattern can be set up and loaded intoa navigation software package. Then, using live GPS data, the tracks can be followedby the survey boat. In the experience of Center staff on small open boats, it is difficultto maintain this type of predetermined grid. Changes in tidal depth can render certainparts of the study area inaccessible during parts of the day. In addition, wind andcurrents can make following the grid tracks almost impossible. In these situations theCenter recommends a strategy that collects data on tracks that increase in proximity asthe survey progresses. The initial set of tracks follows the perimeter of the study area(usually the shallowest portions of an enclosed water body). Then a set of trackscrossing the area from west to east are alternated with tracks running north to south (oralong length/width axes). In each subsequent pass, the track bisects the remaining un-surveyed area. This approach thus starts with an initial grid that increases in spatialresolution as the survey continues. Should weather curtail operations, at least a grosssurvey of the entire area can be accomplished. The survey pattern shown in figure 17
is an example of this latter strategy in an enclosed water body. Assuming the endproduct will be a grid interpolated from the point data, the desired resolution of the finaldata and the spatial variability of the bottom habitats should determine the spacing ofthe lines.
Data acquisition in both QTC Viewand RoxAnn sensors is limited bytwo factors. The first factor isdepth. There must be at least 1.4meters of water between thetransducer head and bottom in the
RoxAnn unit and 7.0 meters for theQTC View. Depths shallower thanthis cause the first echo to comeback too soon to be captured bythe transducer. Both units typicallycontain the LCD display of themain echo-sounder. As depthsapproach the minimum, the analystshould cross-reference the depthdisplays recorded in the datalogging software with the echo-
sounder display. Water that is too shallow can cause the softwares to lock up andrepeat the last good depth, bottom class, and echo values, or it can cause no responseat all.
The second limiting factor for data acquisition is speed. In practice, using a portableover-the-side transducer mount for the RoxAnn unit, speeds of approximately 5 knots
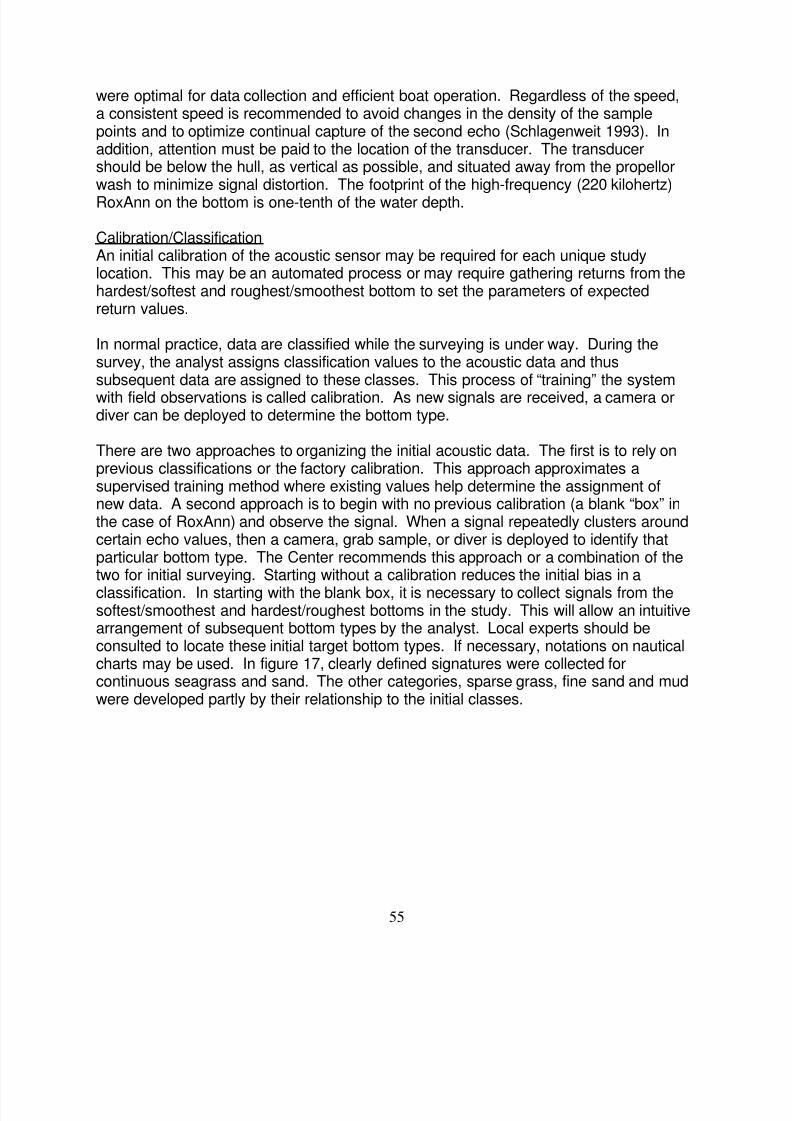
8/2/2019 Benthic Habitat Mapping Guide (NOAA)
http://slidepdf.com/reader/full/benthic-habitat-mapping-guide-noaa 59/79
55
were optimal for data collection and efficient boat operation. Regardless of the speed,a consistent speed is recommended to avoid changes in the density of the samplepoints and to optimize continual capture of the second echo (Schlagenweit 1993). Inaddition, attention must be paid to the location of the transducer. The transducershould be below the hull, as vertical as possible, and situated away from the propellorwash to minimize signal distortion. The footprint of the high-frequency (220 kilohertz)RoxAnn on the bottom is one-tenth of the water depth.
Calibration/ClassificationAn initial calibration of the acoustic sensor may be required for each unique studylocation. This may be an automated process or may require gathering returns from thehardest/softest and roughest/smoothest bottom to set the parameters of expectedreturn values.
In normal practice, data are classified while the surveying is under way. During thesurvey, the analyst assigns classification values to the acoustic data and thussubsequent data are assigned to these classes. This process of “training” the system
with field observations is called calibration. As new signals are received, a camera ordiver can be deployed to determine the bottom type.
There are two approaches to organizing the initial acoustic data. The first is to rely onprevious classifications or the factory calibration. This approach approximates asupervised training method where existing values help determine the assignment ofnew data. A second approach is to begin with no previous calibration (a blank “box” inthe case of RoxAnn) and observe the signal. When a signal repeatedly clusters aroundcertain echo values, then a camera, grab sample, or diver is deployed to identify thatparticular bottom type. The Center recommends this approach or a combination of thetwo for initial surveying. Starting without a calibration reduces the initial bias in a
classification. In starting with the blank box, it is necessary to collect signals from thesoftest/smoothest and hardest/roughest bottoms in the study. This will allow an intuitivearrangement of subsequent bottom types by the analyst. Local experts should beconsulted to locate these initial target bottom types. If necessary, notations on nauticalcharts may be used. In figure 17, clearly defined signatures were collected forcontinuous seagrass and sand. The other categories, sparse grass, fine sand and mudwere developed partly by their relationship to the initial classes.
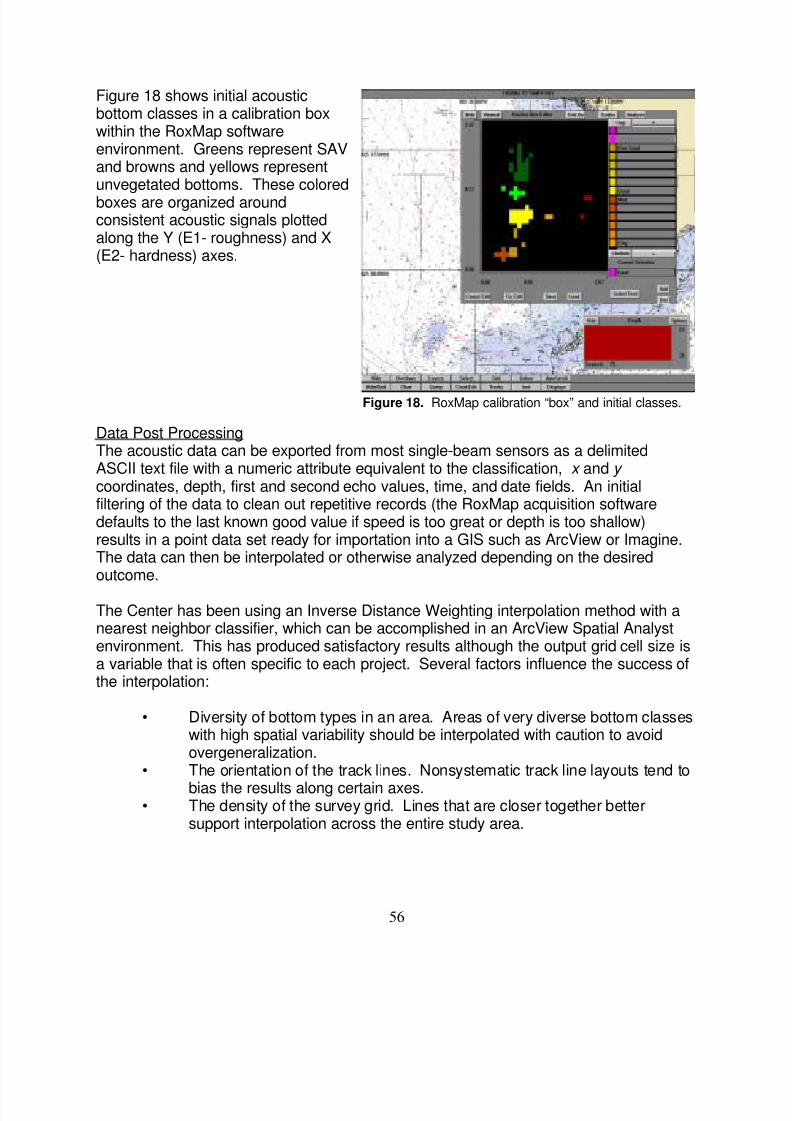
8/2/2019 Benthic Habitat Mapping Guide (NOAA)
http://slidepdf.com/reader/full/benthic-habitat-mapping-guide-noaa 60/79
56
Figure 18. RoxMap calibration “box” and initial classes.
Figure 18 shows initial acousticbottom classes in a calibration boxwithin the RoxMap softwareenvironment. Greens represent SAVand browns and yellows representunvegetated bottoms. These coloredboxes are organized aroundconsistent acoustic signals plottedalong the Y (E1- roughness) and X(E2- hardness) axes.
Data Post ProcessingThe acoustic data can be exported from most single-beam sensors as a delimitedASCII text file with a numeric attribute equivalent to the classification, x and y coordinates, depth, first and second echo values, time, and date fields. An initialfiltering of the data to clean out repetitive records (the RoxMap acquisition softwaredefaults to the last known good value if speed is too great or depth is too shallow)results in a point data set ready for importation into a GIS such as ArcView or Imagine.The data can then be interpolated or otherwise analyzed depending on the desiredoutcome.
The Center has been using an Inverse Distance Weighting interpolation method with anearest neighbor classifier, which can be accomplished in an ArcView Spatial Analystenvironment. This has produced satisfactory results although the output grid cell size isa variable that is often specific to each project. Several factors influence the success ofthe interpolation:
• Diversity of bottom types in an area. Areas of very diverse bottom classeswith high spatial variability should be interpolated with caution to avoidovergeneralization.
• The orientation of the track lines. Nonsystematic track line layouts tend to
bias the results along certain axes.• The density of the survey grid. Lines that are closer together better
support interpolation across the entire study area.
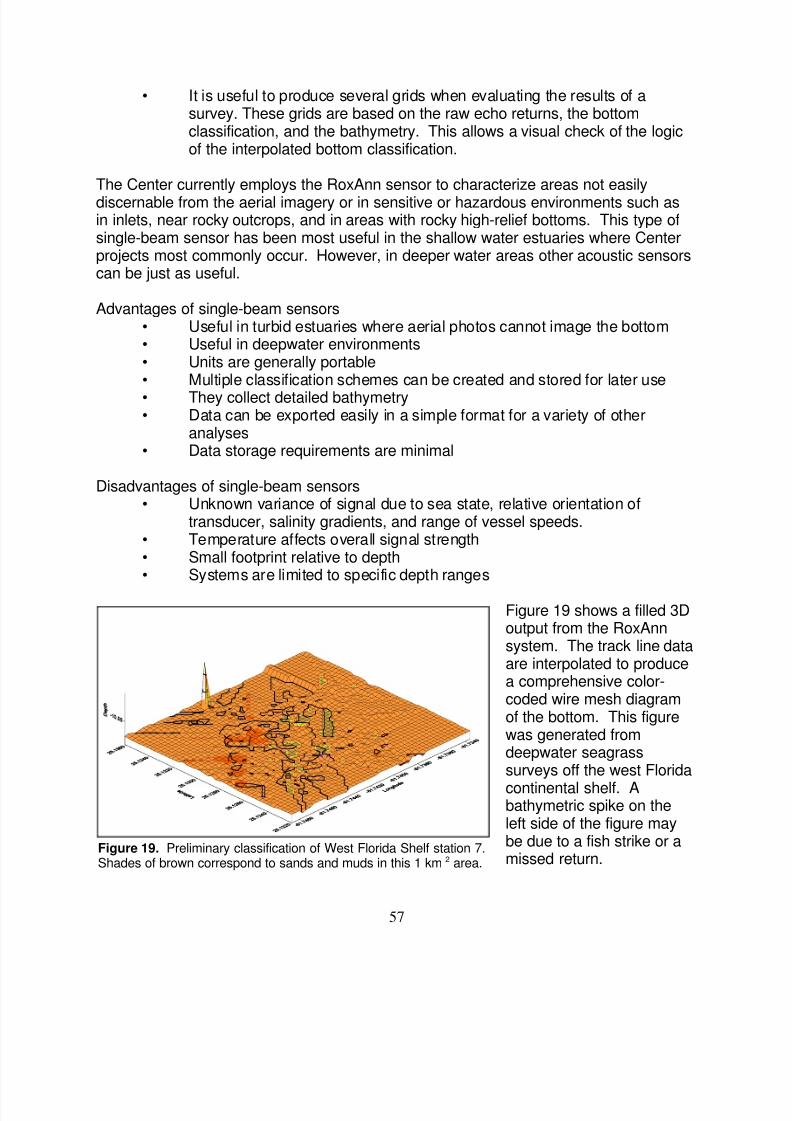
8/2/2019 Benthic Habitat Mapping Guide (NOAA)
http://slidepdf.com/reader/full/benthic-habitat-mapping-guide-noaa 61/79
57
Figure 19. Preliminary classification of West Florida Shelf station 7.Shades of brown correspond to sands and muds in this 1 km2 area.
• It is useful to produce several grids when evaluating the results of asurvey. These grids are based on the raw echo returns, the bottomclassification, and the bathymetry. This allows a visual check of the logicof the interpolated bottom classification.
The Center currently employs the RoxAnn sensor to characterize areas not easilydiscernable from the aerial imagery or in sensitive or hazardous environments such asin inlets, near rocky outcrops, and in areas with rocky high-relief bottoms. This type ofsingle-beam sensor has been most useful in the shallow water estuaries where Centerprojects most commonly occur. However, in deeper water areas other acoustic sensorscan be just as useful.
Advantages of single-beam sensors• Useful in turbid estuaries where aerial photos cannot image the bottom• Useful in deepwater environments• Units are generally portable• Multiple classification schemes can be created and stored for later use
• They collect detailed bathymetry• Data can be exported easily in a simple format for a variety of other
analyses• Data storage requirements are minimal
Disadvantages of single-beam sensors• Unknown variance of signal due to sea state, relative orientation of
transducer, salinity gradients, and range of vessel speeds.• Temperature affects overall signal strength• Small footprint relative to depth• Systems are limited to specific depth ranges
Figure 19 shows a filled 3Doutput from the RoxAnnsystem. The track line dataare interpolated to producea comprehensive color-coded wire mesh diagramof the bottom. This figurewas generated fromdeepwater seagrasssurveys off the west Florida
continental shelf. Abathymetric spike on theleft side of the figure maybe due to a fish strike or amissed return.
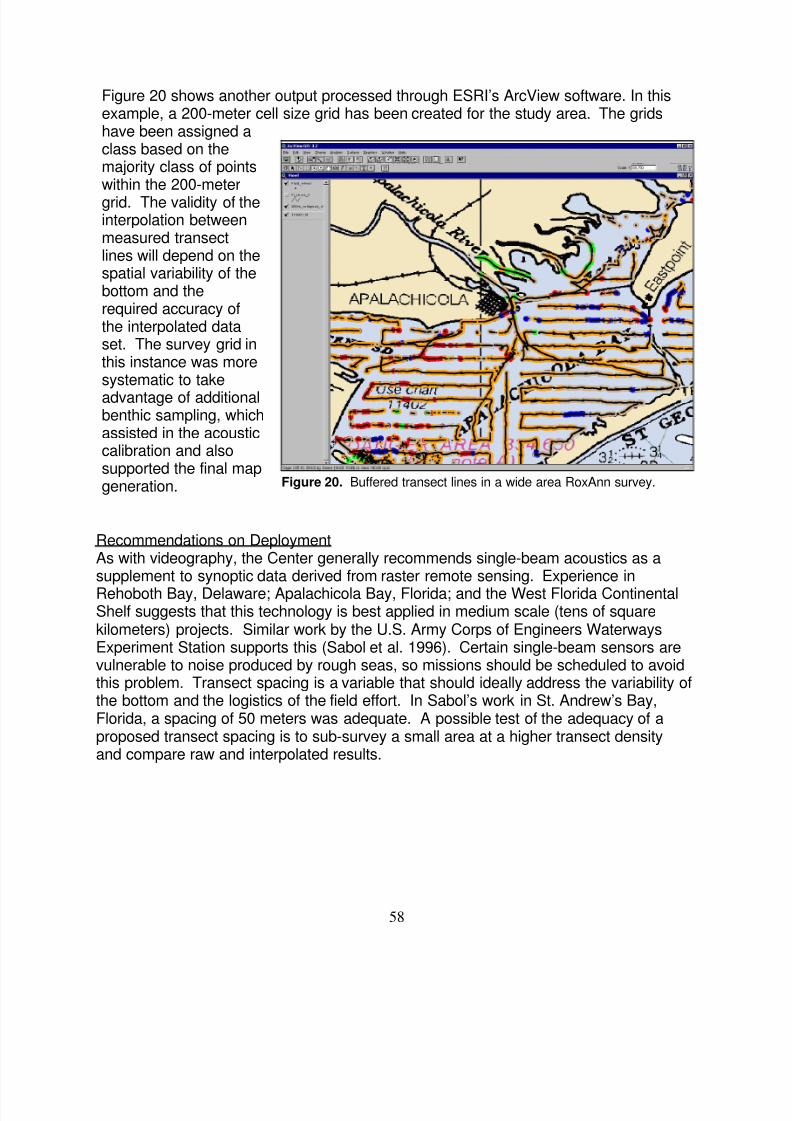
8/2/2019 Benthic Habitat Mapping Guide (NOAA)
http://slidepdf.com/reader/full/benthic-habitat-mapping-guide-noaa 62/79
58
Figure 20. Buffered transect lines in a wide area RoxAnn survey.
Figure 20 shows another output processed through ESRI’s ArcView software. In thisexample, a 200-meter cell size grid has been created for the study area. The gridshave been assigned aclass based on themajority class of pointswithin the 200-metergrid. The validity of theinterpolation betweenmeasured transectlines will depend on thespatial variability of thebottom and therequired accuracy ofthe interpolated dataset. The survey grid inthis instance was moresystematic to take
advantage of additionalbenthic sampling, whichassisted in the acousticcalibration and alsosupported the final mapgeneration.
Recommendations on DeploymentAs with videography, the Center generally recommends single-beam acoustics as asupplement to synoptic data derived from raster remote sensing. Experience in
Rehoboth Bay, Delaware; Apalachicola Bay, Florida; and the West Florida ContinentalShelf suggests that this technology is best applied in medium scale (tens of squarekilometers) projects. Similar work by the U.S. Army Corps of Engineers WaterwaysExperiment Station supports this (Sabol et al. 1996). Certain single-beam sensors arevulnerable to noise produced by rough seas, so missions should be scheduled to avoidthis problem. Transect spacing is a variable that should ideally address the variability ofthe bottom and the logistics of the field effort. In Sabol’s work in St. Andrew’s Bay,Florida, a spacing of 50 meters was adequate. A possible test of the adequacy of aproposed transect spacing is to sub-survey a small area at a higher transect densityand compare raw and interpolated results.
8/2/2019 Benthic Habitat Mapping Guide (NOAA)
http://slidepdf.com/reader/full/benthic-habitat-mapping-guide-noaa 63/79
59
DATA QUALITY REPORTING AND DOCUMENTATION
As described in the 1995 document, Quality Assurance and Quality Control from dataacquisition through final database compilation are the responsibility of each projectteam. Acceptance of the final data is contingent upon demonstration that the projectmeets the following standards. The Center’s standards of data quality are based onauthoritative references (Goodchild et al. 1990; Chrisman 1991; Lunetta et al. 1991;and Congalton 1991).
Spatial Accuracy Requirements
Change data between two vector data sets require a high level of spatial accuracy inorder to reduce the amount of change produced by simple offsets. Although early datasets were restricted in their accuracy by the quality of their base maps, the recentincreases in spatial accuracy provided by differential GPS and photogrammetricmethods for data compilation have made it possible to achieve spatial accuracy on theorder of a few meters. In order to be most useful for subsequent change analysis, it isexpected that spatial accuracy be correct to within 13 meters. This is based on analogdata development methods that rely on USGS topographic maps as a source of control.
Thematic Accuracy Requirements
Reference data for accuracy assessment must have a resolution and reliability thatmeet or exceed those of the remotely sensed data. Occasionally in satellite remotesensing efforts aerial photographs are used as reference data. However, since aerialphotography forms the primary source data for these benthic mapping methods, onlyfield observations will suffice to test the thematic accuracy of benthic habitat data.These surface-level observations must be evaluated in accordance with the imagery’sminimum detection unit and minimum mapping unit for the remote data and with theclassification system used to categorize the habitat. The simple presence of an individual species or natural feature may not, in itself, establish an area as a particular type of habitat. A number of questions need to be answered to draw a conclusionabout the appropriate cover category to assign based on the reference data: does acharacteristic species or feature meet the minimum detection unit of the remotesensor? What other characteristic species or features also are present within theminimum mapping unit?
Due to the subjectivity associated with any photointerpretation process, it is critical thatthe thematic accuracy of delineated habitat be as high as possible. The Centeremphasizes the importance of field observation and verification in any remotesensing/mapping study. Using positionally registered field observation methods,thematic accuracies over 85 percent should be obtainable by regional scientists. In
8/2/2019 Benthic Habitat Mapping Guide (NOAA)
http://slidepdf.com/reader/full/benthic-habitat-mapping-guide-noaa 64/79
60
order to be accepted into the NOAA archive, benthic habitat data should meet orexceed this overall accuracy.
Other Data Parameters
In order to facilitate fieldwork, integration with ancillary data, and incorporation withother project data, the Center requires that benthic habitat data be projected into aUniversal Transverse Mercator projection with a North American Datum of 1983 as ahorizontal datum. Units of measure should be meters and the GRS 1980 spheroidshould be used. This is a Cartesian system that is amenable to photogrammetry andthat also integrates well with other Center coastal spatial data.
Metadata
As part of a federal agency dealing with spatial data, the Center is required todocument its data in a format that is compliant with the Federal Geographic DataCommittee (FGDC) guidelines. Many state agencies are required to produce metadatain formats unique to their states. These formats may be more or less compliant with theFGDC guidelines. The Center recommends that producers of data include the followinginformation at a minimum:
• Lineage: A record of the type of data sources and the operations involvedin the creation of a database. This includes not only the primary datasource (usually aerial photography) but also supplemental sources ofinformation such as videography, existing maps, in-situ measurements,etc.
• Thematic Accuracy and Precision: The closeness of attribute values to
their true values. Expressed as overall accuracy in an error matrix thatillustrates errors of omission and commission.
• Spatial Accuracy and Precision: The positional certainty associated withpolygon, line, and point data in the project, expressed in x, y, z, units.
• Logical Consistency: The adherence of internal data structures toestablished conventions or stated rules.
• Temporal Accuracy and Precision: The time over which source materialswere acquired and observations made.
• Fitness for Use: The degree to which the data quality characteristics ofeach database and its components collectively suit an intendedapplication. Any prohibitions or warnings against inappropriate or
unsanctioned use should be documented.• Minimum Mapping Unit: This is the smallest unit discretely identified in the
data set. Objects smaller than this will have been aggregated into largerunits.
8/2/2019 Benthic Habitat Mapping Guide (NOAA)
http://slidepdf.com/reader/full/benthic-habitat-mapping-guide-noaa 65/79
8/2/2019 Benthic Habitat Mapping Guide (NOAA)
http://slidepdf.com/reader/full/benthic-habitat-mapping-guide-noaa 66/79
62
CONCLUSION
This document is intended to provide technical guidance to benthic habitat datadevelopers working with the NOAA Coastal Services Center and for state and nationallevel mapping efforts. An effort has been made to provide general guidance that is notlimited by specific hardware or software whenever possible. These methods reflecttechnologies that have been proven efficient and effective for generating benthic habitatdata in nearshore marine and tidal estuary environment. However, as existingtechnologies improve and as new technologies emerge, new technical guidance will berequired. The following principles will be used to update this guidance document:
• Seek a balance between the latest technologies and proven methodsapplicable by state-level natural resource scientists on a broad scale.
• Evaluate new technologies and facilitate their adoption by Center partnersthrough methods development.
• Emphasize comprehensive, raster format data as the preferred sourcedata structure for habitat mapping.
• Provide data that facilitate trend analysis and capture ecologicallysignificant changes in the distribution and spatial arrangement of benthichabitats.
• Provide data that integrate seamlessly with other spatial data forcomprehensive environmental analysis.
Users of this document are encouraged to consult directly with Center staff and to visitthe Center’s benthic habitat mapping project Web site for updates on methods, Centeractivities, and technical resources. It is also recommended that users contact otherCenter partners for recommendations in their region. Through this continuing dialogue,interested scientists will fill the existing data gaps in the nation’s nearshore habitatdatabase.
8/2/2019 Benthic Habitat Mapping Guide (NOAA)
http://slidepdf.com/reader/full/benthic-habitat-mapping-guide-noaa 67/79
63
REFERENCES
Aronson, R., P. Edmunds, W. Precht, D. Swanson, and D. Levitan. 1994. “Large-scale,Long-term Monitoring of Caribbean Coral Reefs: Simple, Quick, InexpensiveTechniques.” Atoll Research Bulletin . Volume 421. Pages 1 to 19.
Burns, D., C. Queen, H. Sisk, W. Mullarkey, and R. Chivers. 1989. “Rapid andConvenient Acoustic Sea-bed Discrimination for Fisheries Applications.” Proceedings of the Institute of Acoustics 11. Part 3. Pages169 to 178.
Chrisman, N. R. 1991. “The Error Component in Spatial Data.” In Maguire, D.J., M. F.Goodchild, and D. W. Rhind (eds.), Geographical Information Systems: Principles and Applications . Wiley, New York.
Coastal Services Center (NOAA CSC). 1996. “Coral Remote Sensing WorkshopProceedings and Recommendations.” Miami, Florida.
Congalton, R. G., and R. A. Mead. 1983. “A Quantitative Method to Test for Consistencyand Correctness in Photointerpretation.” Photogrammetric Engineering and Remote Sensing . Volume 49(1). Pages 69 to 74.
Congalton, R. G. 1988. “A Comparison of Sampling Schemes Used in Generating ErrorMatrices for Assessing the Accuracy of Maps Generated from Remotely Sensed Data.”Photogrammetric Engineering and Remote Sensing . Volume 54(5). Pages 593 to 600.
Congalton, R. G. July 1991. “A Review of Assessing the Accuracy of Classifications ofRemotely Sensed Data.” Remote Sensing of Environment . Volume 37, Pages 35 to 47.
Congalton, R. G., and K. Green. 1999. Assessing the Accuracy of Remotely Sensed Data: Principles and Practices. Lewis Publishers, CRC press, Inc.
Cowardin, L. M., V. Carter, F. C. Golet, and E. T. LaRoe. 1979. “Classification ofWetlands and Deepwater Habitats of the United States.” U.S. Department of theInterior, U.S. Fish and Wildlife Service. FWS/OBS-79/31.
Dobson, J. E., E. A. Bright, R. L. Ferguson, L. L. Wood, K. D. Haddad, H. Iredale III, J.R. Jensen, V. V. Klemas, R. J. Orth, and J. P. Thomas. 1995. NOAA Coastal Change Analysis Program (C-CAP): Guidance for Regional Implementation. NOAA TechnicalReport NMFS 123. U.S. Department of Commerce.
Bruce, E. M., I. G. Elliot, and D. J. Milton. 1997. “Method for Assessing the Thematicand Positional Accuracy of Seagrass Mapping.” Marine Geodesy . Volume 20. Pages175 to 193.
Ellis, M. 1978. Coastal Mapping Handbook. U.S. Government Printing Office,Washington, DC.
8/2/2019 Benthic Habitat Mapping Guide (NOAA)
http://slidepdf.com/reader/full/benthic-habitat-mapping-guide-noaa 68/79
64
Environmental Systems Research Institute. 1991. “Understanding GIS: The Arc InfoMethod.”
Felix, N., and D. L. Binney. 1989. “Accuracy Assessment of Landsat-AssistedVegetation Map of the Coastal Plain of the Arctic National Wildlife Refuge.” Photogrammetric Engineering and Remote Sensing . Volume 55(4). Pages 475 to 478.
Ferguson, R. L. , J. A. Rivera, and L. L. Wood, 1989. “Seagrasses in Southern CoreSound NC." NOAA Coastal Ocean Program Submerged Aquatic Vegetation Study(Chart).” U. S. Department of Commerce, Southeast Fisheries Science Center,Beaufort Laboratory, Beaufort, NC.
Ferguson R. L., and L. L. Wood. 1990. “Mapping Submerged Aquatic Vegetation inNorth Carolina with Conventional Aerial Photography.” In S. J. Kiraly, F.A. Cross, andJ. D. Buffington (eds.), Federal Coastal Wetland Mapping Programs . U.S. Fish andWildlife Service Biological Report 90(18). Pages 125 to 133
Ferguson, R. L., L. L. Wood, and D. B. Graham. 1992. “Detection of Change inSubmerged Coastal Habitat.” In Global Change and Education , Volume 1. Pages 70to 79. American Society for Photogrammetry and Remote Sensing. ASPRS/ ACSM 92Technical Paper, Bethesda, MD.
Ferguson, R. L., L. L. Wood, and D. B. Graham. 1993. “Monitoring Spatial Change inSeagrass Habitat with Aerial Photography.” Photogrammetric Engineering and Remote Sensing . Volume 59(6). Pages 1033 to 1038.
Ferguson, R. L., and L. L. Wood. 1994. “Rooted Vascular Beds in the Albemarle-Pamlico Estuarine System.” In EPA Albemarle-Pamlico Study . North Carolina
Department of Environment, Health, and Natural Resources. Report No. 94-02, 122pages.
Goodchild M.F., and K. K. Kemp (eds.). 1990. “ NCGIA Core Curriculum (TechnicalIssues in GIS).” 3 volumes. National Center for Geographic Information and Analysis,Santa Barbara, CA.
Florida Marine Research Institute. 1998. Benthic Habitats of the Florida Keys. FMRITechnical Report TR-4.
Florida Marine Research Institute. 1998. “Seagrass and Aquatic Habitat Assessment
Workshop Summary.” St. Petersburg, Florida.
8/2/2019 Benthic Habitat Mapping Guide (NOAA)
http://slidepdf.com/reader/full/benthic-habitat-mapping-guide-noaa 69/79
65
Hale, J., and T. Frazer. 2000. “Image Enhancements Applied to Scanned AerialPhotographs for Benthic Habitat Mapping.” Proceedings of the Sixth International Conference on Remote Sensing for Marine and Coastal Environments , Charleston, SC.May 2000.
Hay, A. M. 1979. “Sampling Designs to Test Land-Use Map Accuracy.”Photogrammetric Engineering and Remote Sensing . Volume 45(4). Pages 529 to 533.
Hopley, D., 1978. “Aerial Photography and Other Remote Sensing Techniques" in Coral Reefs: Research Methods . Stodart, D.R., and R.E. Johannes (eds.) UNESCO, Paris.Pages 23 to 44.
Klemas V., J. E. Dobson, R. L. Ferguson, and K. D. Haddad. 1993. “A Coastal LandCover Classification System for the NOAA Coastwatch Change Analysis Project.”Journal of Coastal Research . Volume 9. Pages 862 to 872.
Lillesand T., and R. Keifer. 2000. Remote Sensing and Image Interpretation . Fourth
Edition. John Wiley and Sons, Inc.
Luczkovich, J., T. Wagner, J. Michalek, and R. Stoffle. 1993. “Discrimination of CoralReefs, Seagrass Meadows, and Sand Bottom Types from Space: A DominicanRepublic Case Study.” Photogrammetric Engineering and Remote Sensing . Volume59(3). Pages 385 to 389.
Lunetta R. S., R. G. Congalton, L. K. Fenstermaker, J. R. Jensen, K. C. McGwire, andL. R. Tinney. 1991. “Remote Sensing and Geographic Information System DataIntegration: Error Sources and Research Issues.” Photogrammetric Engineering and Remote Sensing . Volume 57(6). Pages 677 to 687.
Maragos, and J., C. Cook Jr. 1995. “The 1991-1992 Rapid Ecological Assessment ofPalau’s Coral Reefs.” Coral Reefs . Volume 14(4). Pages 237 to 252.
Norris, J. G., S. Wyllie-Echeverria, T. Mumford, A. Bailey, and T. Turner. October, 1997.“Estimating Basal Area Coverage of Subtidal Seagrass Beds Using UnderwaterVideography.” Aquatic Botany . Volume 58(3,4). Pages 269 to 287.
Orth R. J., R. L. Ferguson, and K. D. Haddad. 1991. “Monitoring Seagrass Distributionand Abundance Patterns.” Coastal Wetlands, Coastal Zone ‘91 Conference . LongBeach, CA, American Society of Civil Engineers. Pages 281 to 300.
Prager, B., D. Caughey, and R. Poeckert. 1995. “Bottom Classification: OperationalResults from QTC View.” Proceedings from OCEANS ‘95 - Challenges of Our ChangingGlobal Environment Conference. San Diego, CA, October 1995.
8/2/2019 Benthic Habitat Mapping Guide (NOAA)
http://slidepdf.com/reader/full/benthic-habitat-mapping-guide-noaa 70/79
66
Rosenfield, G. H., and K. Fitzpatrick-Lins. 1986. “A Coefficient of Agreement as aMeasure of Thematic Classification Accuracy.” Photogrammetric Engineering and Remote Sensing . Volume 52(2). Pages 223-227.
Rukavina N. A. 1997. “Substrate Mapping in the Great Lakes Nearshore Zone with aRoxAnn Acoustic Seabed Classification System.” Canadian Coastal Conference, 1997.12 pages.
Sabol, B., D. Shafer, and E. Melton Jr. 1996. “ Mapping Seagrasses for DredgingOperations.” U.S. Army Corps of Engineers Waterways Experiment Station.Environmental Effects of Dredging . Volume D-96-1.
Schlagentweit, G.E.O. 1993. “Real-time Acoustic Bottom Classification: A FieldEvaluation of RoxAnn.” OCEANS ‘93. Pages III-214 to III-219.
Sciliano, D., D. Potts, B. Martini, E. Silver, and W. Pickles. 2000. “High-ResolutionHyperspectral Remote Sensing as an Environmental Monitoring Tool for Coastal andShallow Marine Habitats.” Proceedings of the Sixth International Conference on Remote Sensing for Marine and Coastal Environments . Charleston, SC, May 2000.
Sheppard, C. R. C., K. Matheson, J. Bythell, P. Murphy, C. Blair Meyers, and B. Blake,1995. “Habitat Mapping in the Caribbean for Management and Conservation: Use andAssessment of Aerial Photography.” Aquatic Conservation: Marine and Freshwater Ecosystems. Volume 5. Pages 277 to 298.
Slamma, C. C., 1980. Manual of Photogrammetry . Fourth edition. American Society ofPhotogrammetry. Falls Church, VA.
Swanson, L. W. 1949. Topographical Manual, Part 2 Photogrammetry . U.S.Department of Commerce, special publication No. 249.
Thomas J. P., and R. L. Ferguson. 1990. “National Oceanic and AtmosphericAdministration’s Habitat Mapping under the Coastal Ocean Program.” In S. J. Kiraly,F. A. Cross, and J. D. Buffington (eds.), Federal Coastal Wetland Mapping Programs .Pages 27 to 37. U.S. Fish and Wildlife Service Biological Report 90(18).
Thrower, N. J. W., and J. R. Jensen. 1976. “The Orthophoto and Orthophotomap:Characteristics, Development and Application.” American Cartographer . Volume 3(1).Pages 39 to 56.
de Vel, O., and W. Bour. 1990. “The Structural and Thematic Mapping of Coral ReefsUsing High Resolution SPOT Data: Application to Tetembia Reef, New Caledonia.”Geocarto International . Volume 5(2). Pages 27 to 34.

8/2/2019 Benthic Habitat Mapping Guide (NOAA)
http://slidepdf.com/reader/full/benthic-habitat-mapping-guide-noaa 71/79
67
Welch, R., M. Remillard, and J. Alberts. 1992. “Integration of GPS, Remote Sensing,and GIS Techniques for Coastal Resource Management.” Photogrammetric Engineering and Remote Sensing. Volume 58(11). Pages 1571 to 1578.
Zainal, A., D. Dalby, and I. Robinson. 1993. “Monitoring Marine Ecological Changes onthe East Coast of Bahrain with Landsat TM” Photogrammetric Engineering and Remote Sensing . Volume 59(3). Pages 415 to 421.

8/2/2019 Benthic Habitat Mapping Guide (NOAA)
http://slidepdf.com/reader/full/benthic-habitat-mapping-guide-noaa 72/79
68
APPENDIX 1
SAMPLE PROJECT DESIGN
General steps required to conduct a NOAA Coastal Services Center benthic habitatbaseline mapping project.
Project Scoping• Identify the regional data gap or change detection problem• Consult with local and regional scientific and management community to
shape specific project goals, objectives, and partners• Define the study area• Determine minimum feature of interest size (minimum mapping unit)• Select data development method• Refine classification system
Mission Planning/Acquisition• Identify aerial image sources• Select sensor and scale• Flight planning, including points-of-contact (POCs) for go/no-go decision• Address environmental variables (POC)• Collect and process aerial imagery
Analysis• Review imagery and conduct initial field visit, Ground Control Point (GCP)
collection or signature development (employ any needed supplementaltechnologies, such as videography or acoustics)
• Interpret aerial photography to extract water and benthic habitatinformation (Compilation of initial digital data may be concurrent with thisstep when using the photogrammetric or soft-copy data developmentmethods)
• Second field visit for mid-project verification (employ supplementaltechnologies)
Digitization/Vectorization• Transfer analog polygon data to planimetric map base (if using the analog
method)• Digitize transferred polygons (if using the analog method)• Edit and attribute digitized information (needed in all data development
methods) _____________________________________________________________________

8/2/2019 Benthic Habitat Mapping Guide (NOAA)
http://slidepdf.com/reader/full/benthic-habitat-mapping-guide-noaa 73/79
69
APPENDIX 1
SAMPLE PROJECT DESIGN (CONTINUED) _____________________________________________________________________ Data Validation
• Final field visit to determine spatial (positional) and thematic accuracy(employ supplemental technologies)
Data Production and Dissemination• Correct any final inaccuracies in the data• Generate FGDC compliant metadata• Distribute via Internet or hard-copy media• Meet with user community to facilitate integration of the data into coastal
management process ___________________________________________________________________
8/2/2019 Benthic Habitat Mapping Guide (NOAA)
http://slidepdf.com/reader/full/benthic-habitat-mapping-guide-noaa 74/79
70
APPENDIX 2
BRIEF OVERVIEW OF ALTERNATIVE MAPPING TECHNOLOGIES
The methods in this document rely strongly on optical remote sensing, specificallymetric aerial photography, and are focused on production of high-resolution data. For
this reason, they are most applicable in moderately clear to clear water systems wherethe habitats of interest occur in the photic zone, typically close to coastal land masses.A variety of alternative approaches are available for capturing information on the extentand characteristics of benthic habitats in these areas and elsewhere.The following sections briefly describe some of the other major methods for developingbenthic habitat data. Some of these have promise to supplement or even replace someof the methods recommended in this document.
Satellite Image AnalysisSatellite imagery, has been used successfully in tropical ecosystems for coral mapping(Luczkovich et al. 1993 and de Vel and Bour 1990). Satellite systems have theadvantage of being able to capture images in remote areas or over very extensivegeographies where an aircraft mission could prove difficult. They are typically affectedby the same environmental variables that affect all imaging of submerged features(clouds, sea state, tidal stage, etc.). Because of their fixed orbital paths acquisition ofsatellite imagery under optimal environmental conditions is strictly coincidental,although off-nadir viewing systems can mitigate this somewhat. Dark bottoms, deepwater and turbid areas tend to introduce confusion into satellite image mapping (Zainalet al. 1993), nevertheless, this type of remote sensing has a role in remote areas or aspart of an initial reconnaissance. A new generation of high-resolution satellite sensorssuch as the IKONOS system have the potential to produce information comparable toaerial photography when images are collected during optimal conditions.
Hyperspectral ImagingHyperspectral imaging has been a tool for terrestrial remote sensing since the 1970sand has also been applied to benthic mapping, especially in clear-water systems(Sciliano et al. 2000). Hyperspectral mapping from airborne platforms allows themission to be flown when environmental conditions are favorable. Many hyperspectralinstruments can be calibrated to collect information in the most promising parts of thespectrum for benthic mapping (usually the blue and green wavelengths) and can haveup to 224 discrete spectral bands (channels). These sensors can be flown such thatthey produce high spatial resolution data, but they are vulnerable to difficulties in thegeorectification process. Spectral image processing of these data can sometimesgenerate useful information on habitat type and condition, but extracting this informationis hampered by the other environmental conditions that affect the spectral response ofa particular bottom feature, such as water chemistry/clarity, glint, sea-state, andvariations in solar illumination. In addition, the skill level required to process this type ofimagery is very high and may be difficult to obtain.
8/2/2019 Benthic Habitat Mapping Guide (NOAA)
http://slidepdf.com/reader/full/benthic-habitat-mapping-guide-noaa 75/79
71
Several technologies are currently in an operational phase of their development andhave great promise for producing data that meet the objectives for which the followingmethods were designed. They include both optical and acoustic sensors.
Digital Aerial PhotographyThis type of imagery has the mission flexibility advantage of other airborne sensors. Inaddition, in certain systems aircraft positional information is collected concurrent withthe imagery through Inertial Motion Units (IMUs) and Global Positioning System (GPS)receivers in the aircraft. This information can greatly facilitate rectification of theimagery over extensive open-water areas or in remote locations. The imagery can becollected to produce whatever pixel size is needed to meet project requirements. Mostdigital cameras have a limited number of spectral bands (3-5) that adequately representmost benthic habitats without collecting numerous additional bands that contribute onlylimited information to a mapping effort. Digital aerial photography is also smoothlyintegrated into most soft-copy photogrammetric analysis environments. A primeadvantage of this type of imagery is the lack of chemical processing needed to producea working image. This can save time and allow reflights on short notice if conditions
warrant. A potential disadvantage of these systems is that some systems do notemploy metric cameras. This can slightly hinder the rectification process.The NOAA Coastal Services Center is currently exploring the utility of this technologyfor operational benthic habitat mapping and expects to produce technical guidance onthe collection and analysis of this data stream.
Side-Scan SonarThis swath acoustic sensing technology has been operational for many years formapping and surveying deepwater environments. They are active sensors that pulsethe bottom at an oblique angle and record the returning acoustic echoes. Many unitsrecord this information directly onto analog paper, although digital systems allow the
data to be analyzed at a later date. Different wavelengths are available depending onthe unit, and the wavelength determines the size of the feature (spatial resolution) thatwill be imaged.
Multi-Beam SonarMulti-beam sonars usually integrated with side-scan sonar to produce an image of thebottom that also has bottom topography combined with the acoustic backscatterresponse. Multi-beam systems usually incorporate Inertial Motion Unit (IMU) data toassist with registering the bathymetric and backscatter data (rectification). These unitsallow vessel position (heave, roll, pitch, and yaw) to be compensated for to reducedistorting the final bathymetric bottom profile. Both side-scan and multi-beam sonar
units have most often been deployed in deeper water environments (well beyond thephotic zone). However, new shallow-water units are becoming available that can bedeployed from small boats. These systems have great promise as an additionalbenthic mapping tool, not only for deep water areas, but also for shallow turbidestuaries. Both side-scan and multi-beam sonars have demonstrated utility for
8/2/2019 Benthic Habitat Mapping Guide (NOAA)
http://slidepdf.com/reader/full/benthic-habitat-mapping-guide-noaa 76/79
72
identifying certain sediments and consolidated bottoms. The Center is investigating thistechnology for mapping other habitat areas, such as seagrass meadows and algal flats.
All of the above methods are forms of remote sensing applicable over extensivegeographic areas. There are also point sampling methods for identifying andcharacterizing benthic habitats. These methods can be used to produce a map throughstatistical interpolation methods and have the primary advantage of producing highlydetailed information on bottom type, condition, and often biological and chemicalprocesses that are occurring there.
Benthic Grab and Core SamplingThese methods have traditionally been used to develop information on bottom types.They rely on direct collection of a portion of the bottom and are deployed from bothsmall and large vessels. They have the advantage of allowing direct observation andquantitative measurement of such characteristics as sediment type, organic content,and in-faunal presence. They are limited by their inability to capture samples in hardsubstrate areas, and they require an understanding of the spatial diversity of the bottom
for accurate interpolation over distances. This type of sampling is often made moreefficient and useful when used in conjunction with other spatial data such as thatderived from remote sensing.
Sediment Profiling ImageryA powerful tool for characterizing the benthic environment is the sediment profilingcamera. These instruments penetrate the substrate and photograph the sedimentprofile. They can be deployed from small boats but often require fixed davits foreffective deployment. This type of data provides a context for grab and core samplingand also captures structural information (layering, worm tubes, etc.) that more invasivegrabbing and coring techniques might not preserve. Some of the advantages of this
technology are the permanent record provided by the photography, and the informationabout the water-sediment interface. Some potential disadvantages are the size andcomplexity of the units, and the narrow field of view. Both this technology and thegrab/core techniques are more powerful when applied in the context of other spatialhabitat data.
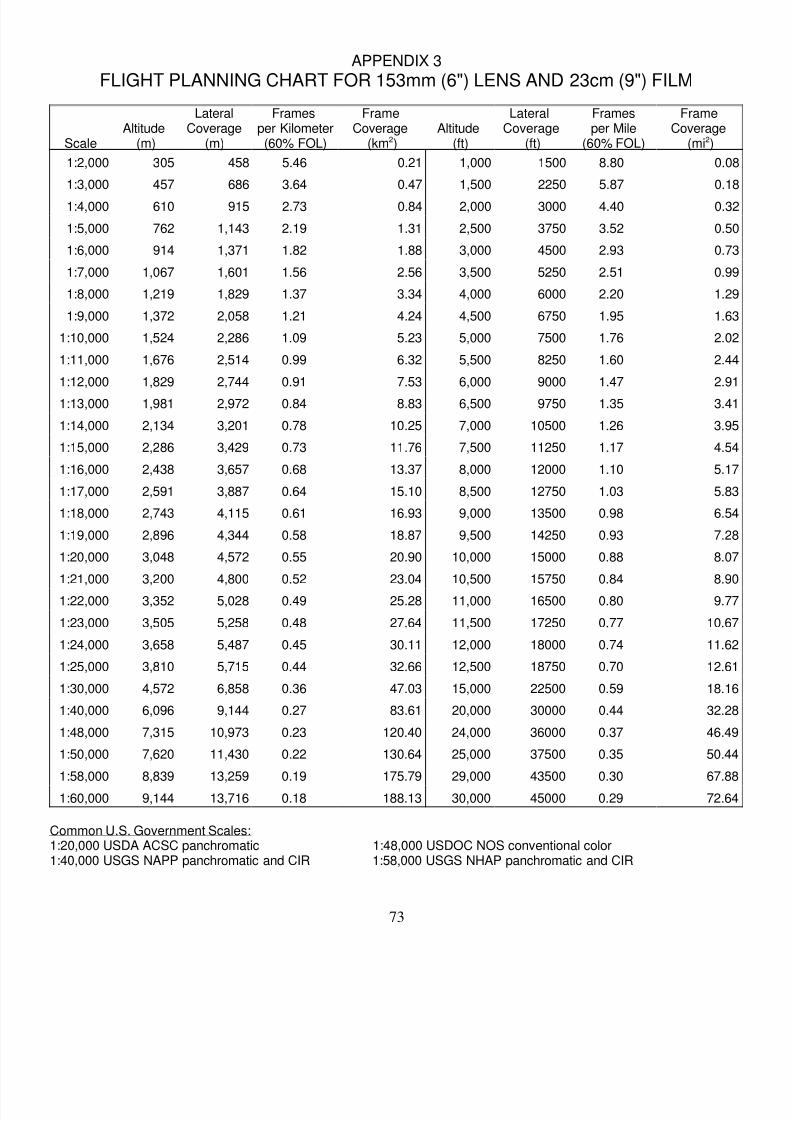
8/2/2019 Benthic Habitat Mapping Guide (NOAA)
http://slidepdf.com/reader/full/benthic-habitat-mapping-guide-noaa 77/79
73
APPENDIX 3
FLIGHT PLANNING CHART FOR 153mm (6") LENS AND 23cm (9") FILM
ScaleAltitude
(m)
LateralCoverage
(m)
Framesper Kilometer(60% FOL)
FrameCoverage
(km2)Altitude
(ft)
LateralCoverage
(ft)
Framesper Mile
(60% FOL)
FrameCoverage
(mi2)
1:2,000 305 458 5.46 0.21 1,000 1500 8.80 0.08
1:3,000 457 686 3.64 0.47 1,500 2250 5.87 0.18
1:4,000 610 915 2.73 0.84 2,000 3000 4.40 0.32
1:5,000 762 1,143 2.19 1.31 2,500 3750 3.52 0.50
1:6,000 914 1,371 1.82 1.88 3,000 4500 2.93 0.73
1:7,000 1,067 1,601 1.56 2.56 3,500 5250 2.51 0.99
1:8,000 1,219 1,829 1.37 3.34 4,000 6000 2.20 1.29
1:9,000 1,372 2,058 1.21 4.24 4,500 6750 1.95 1.63
1:10,000 1,524 2,286 1.09 5.23 5,000 7500 1.76 2.02
1:11,000 1,676 2,514 0.99 6.32 5,500 8250 1.60 2.44
1:12,000 1,829 2,744 0.91 7.53 6,000 9000 1.47 2.91
1:13,000 1,981 2,972 0.84 8.83 6,500 9750 1.35 3.41
1:14,000 2,134 3,201 0.78 10.25 7,000 10500 1.26 3.95
1:15,000 2,286 3,429 0.73 11.76 7,500 11250 1.17 4.54
1:16,000 2,438 3,657 0.68 13.37 8,000 12000 1.10 5.17
1:17,000 2,591 3,887 0.64 15.10 8,500 12750 1.03 5.83
1:18,000 2,743 4,115 0.61 16.93 9,000 13500 0.98 6.54
1:19,000 2,896 4,344 0.58 18.87 9,500 14250 0.93 7.28
1:20,000 3,048 4,572 0.55 20.90 10,000 15000 0.88 8.07
1:21,000 3,200 4,800 0.52 23.04 10,500 15750 0.84 8.90
1:22,000 3,352 5,028 0.49 25.28 11,000 16500 0.80 9.77
1:23,000 3,505 5,258 0.48 27.64 11,500 17250 0.77 10.67
1:24,000 3,658 5,487 0.45 30.11 12,000 18000 0.74 11.62
1:25,000 3,810 5,715 0.44 32.66 12,500 18750 0.70 12.61
1:30,000 4,572 6,858 0.36 47.03 15,000 22500 0.59 18.16
1:40,000 6,096 9,144 0.27 83.61 20,000 30000 0.44 32.28
1:48,000 7,315 10,973 0.23 120.40 24,000 36000 0.37 46.49
1:50,000 7,620 11,430 0.22 130.64 25,000 37500 0.35 50.44
1:58,000 8,839 13,259 0.19 175.79 29,000 43500 0.30 67.88
1:60,000 9,144 13,716 0.18 188.13 30,000 45000 0.29 72.64
Common U.S. Government Scales:1:20,000 USDA ACSC panchromatic 1:48,000 USDOC NOS conventional color1:40,000 USGS NAPP panchromatic and CIR 1:58,000 USGS NHAP panchromatic and CIR
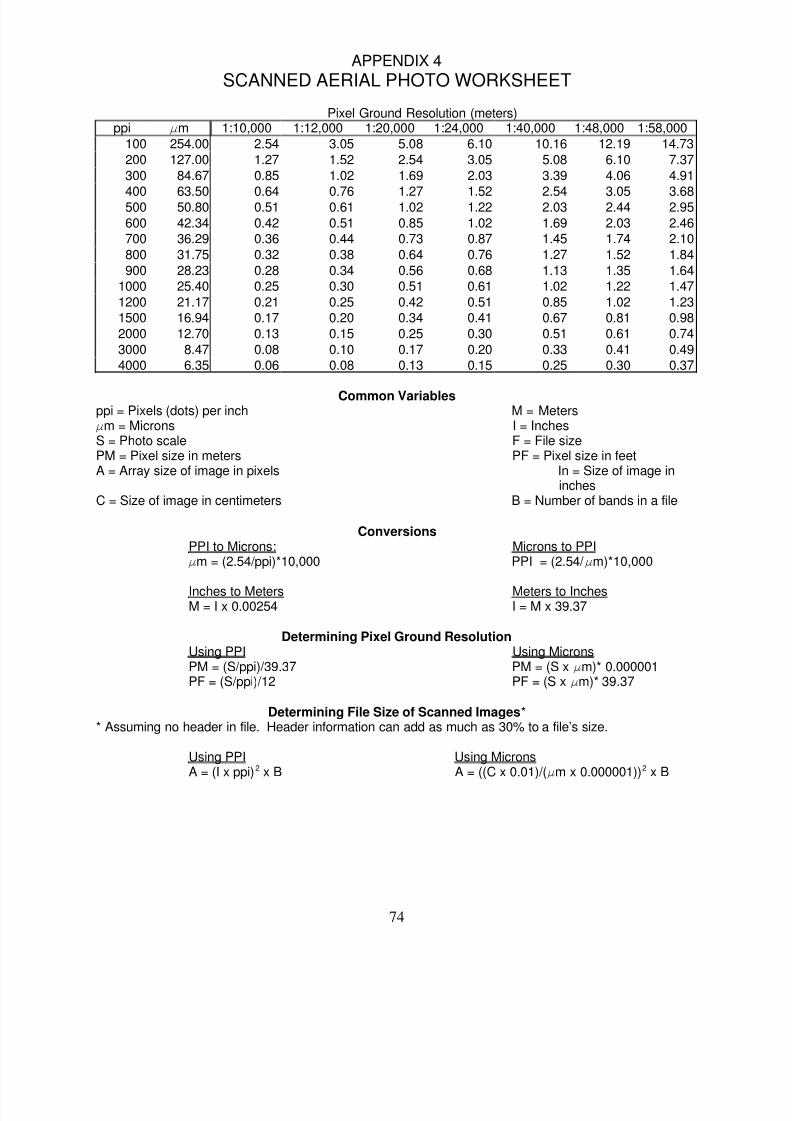
8/2/2019 Benthic Habitat Mapping Guide (NOAA)
http://slidepdf.com/reader/full/benthic-habitat-mapping-guide-noaa 78/79
74
APPENDIX 4
SCANNED AERIAL PHOTO WORKSHEET
Pixel Ground Resolution (meters)ppi .m 1:10,000 1:12,000 1:20,000 1:24,000 1:40,000 1:48,000 1:58,000
100 254.00 2.54 3.05 5.08 6.10 10.16 12.19 14.73
200 127.00 1.27 1.52 2.54 3.05 5.08 6.10 7.37
300 84.67 0.85 1.02 1.69 2.03 3.39 4.06 4.91
400 63.50 0.64 0.76 1.27 1.52 2.54 3.05 3.68500 50.80 0.51 0.61 1.02 1.22 2.03 2.44 2.95
600 42.34 0.42 0.51 0.85 1.02 1.69 2.03 2.46
700 36.29 0.36 0.44 0.73 0.87 1.45 1.74 2.10
800 31.75 0.32 0.38 0.64 0.76 1.27 1.52 1.84
900 28.23 0.28 0.34 0.56 0.68 1.13 1.35 1.64
1000 25.40 0.25 0.30 0.51 0.61 1.02 1.22 1.47
1200 21.17 0.21 0.25 0.42 0.51 0.85 1.02 1.23
1500 16.94 0.17 0.20 0.34 0.41 0.67 0.81 0.98
2000 12.70 0.13 0.15 0.25 0.30 0.51 0.61 0.74
3000 8.47 0.08 0.10 0.17 0.20 0.33 0.41 0.49
4000 6.35 0.06 0.08 0.13 0.15 0.25 0.30 0.37
Common Variablesppi = Pixels (dots) per inch M = Meters.m = Microns I = InchesS = Photo scale F = File sizePM = Pixel size in meters PF = Pixel size in feetA = Array size of image in pixels In = Size of image in
inchesC = Size of image in centimeters B = Number of bands in a file
ConversionsPPI to Microns: Microns to PPI.m = (2.54/ppi)*10,000 PPI = (2.54/ .m)*10,000
Inches to Meters Meters to InchesM = I x 0.00254 I = M x 39.37
Determining Pixel Ground ResolutionUsing PPI Using MicronsPM = (S/ppi)/39.37 PM = (S x .m)* 0.000001PF = (S/ppi)/12 PF = (S x .m)* 39.37
Determining File Size of Scanned Images** Assuming no header in file. Header information can add as much as 30% to a file’s size.
Using PPI Using MicronsA = (I x ppi)2 x B A = ((C x 0.01)/(.m x 0.000001))2 x B
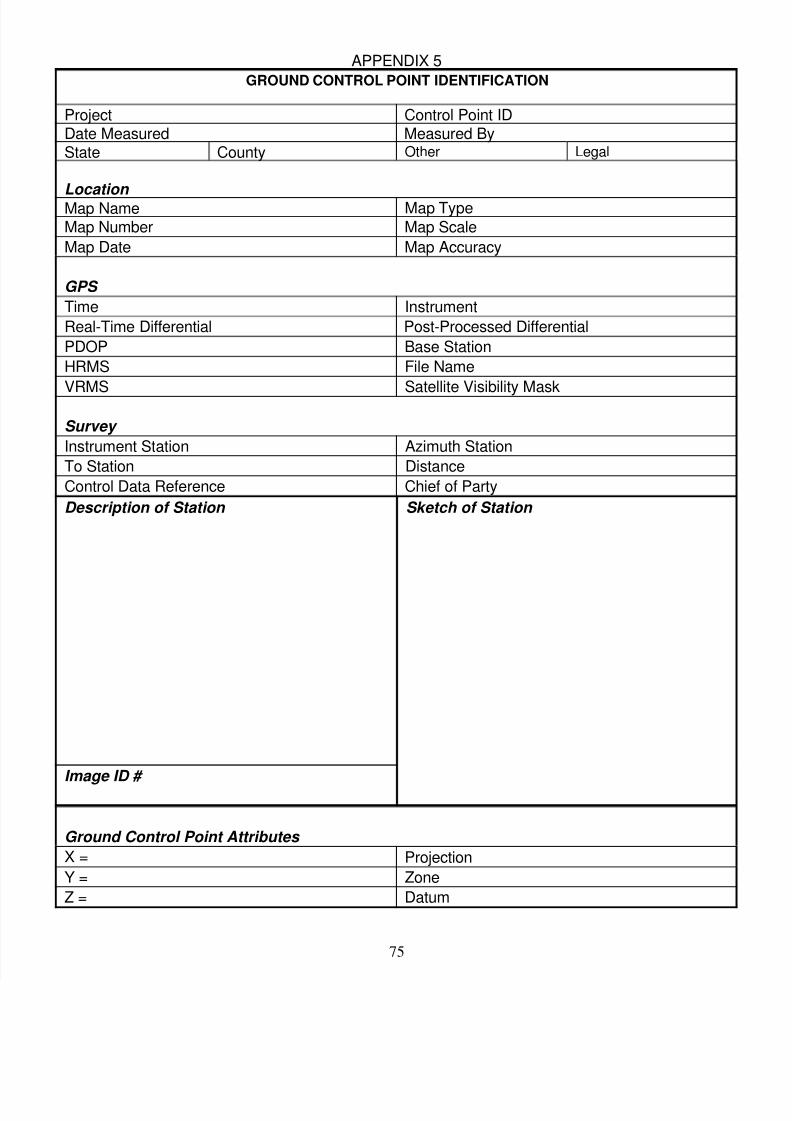
8/2/2019 Benthic Habitat Mapping Guide (NOAA)
http://slidepdf.com/reader/full/benthic-habitat-mapping-guide-noaa 79/79
APPENDIX 5
GROUND CONTROL POINT IDENTIFICATION
Project Control Point IDDate Measured Measured ByState County Other Legal
Location Map Name Map Type
Map Number Map Scale
Map Date Map Accuracy
GPS
Time Instrument
Real-Time Differential Post-Processed Differential
PDOP Base Station
HRMS File Name
VRMS Satellite Visibility Mask
Survey
Instrument Station Azimuth Station
To Station Distance
Control Data Reference Chief of Party
Description of Station Sketch of Station
I ID #


