Marine Benthic Habitat Mapping in the Golden Gate National Recreational Area H. Gary Greene 1 , Tamara Williams 2 , Brian Edwards 3 , Bryan Dieter 4 , Charlie Endris 4 Holly Ryan 3 , Eric Niven 4 , Eleyne Phillips 3 , Patrick Barnard 3 , and Fraka Harmsen 5 1 Center for Habitat Studies, Moss Landing Marine Labs, Moss Landing, CA & Tombolo, Orcas Island, WA, Email: [email protected]2 National Parks Serivice, Golden Gate National Recreational Area, San Francisco, CA 3 U.S. Geological Survey, Menlo Park, CA 4 Center for Habitat Studies, Moss Landing Marine Labs, Moss Landing, CA 5 California University, Fresno, Fresno, CA Introduction For generations maps have told tales that words and numbers alone cannot. Maps guided us to the New World, helped us navigate from its edges into its interior. Vague, undefined maps showed Lewis & Clark where to go next – and in turn gave us fresher, more accurate maps that fueled further explorations. Maps outline the frontier for settlement and showed us where to find the silver, the gold and the coal that made us prosperous. Computer mapping helps businesses expand, prosper, and find new customers (Anthony, 2009). And it can be said that maps of the sea floor can aid in the understanding, conservation and exploitation of our marine resources. Therefore, in response to the U.S. National Parks Service’s (NPS) interest to map the submerged lands within park boundaries and to understand the aquatic processes that play a role in the formation, distribution and disturbances of both coastal and submarine resources in and around park boundaries, we embarked in the construction of marine thematic maps that can be used by NPS personnel to manage resources. The tasks involved the compilation of all available seafloor mapping data in and around the Golden Gate National Recreational Area (GGNRA) that include, but are not necessarily limited to, marine acoustical data, such as multibeam echosounder (MBES) bathymetry and backscatter data, side-scan sonar mosaics, and sediment sample information, the interpretation of recently collected data; and the construction of habitat and geologic maps. Goal The objective of this project was to compile available regional seafloor mapping data for San Francisco Bay and to interpret newly collected data provided through the California State Mapping Program (CSMP) and the United States Geological Survey (USGS) to construct benthic habitat and geologic maps of the submerged lands of the GGNRA. The habitat maps were constructed using the same habitat classification scheme and mapping code presently being used for the development of the CSMP habitat maps (Greene et al., 1999, 2005, 2007a). The maps comprise an integration of previous seafloor maps such as the San Francisco Bay anthropogenic habitat disturbance maps (Greene et al., 2007b). 1
Transcript
Marine Benthic Habitat Mapping in the Golden Gate National Recreational Area
H. Gary Greene1, Tamara Williams2, Brian Edwards3, Bryan Dieter4, Charlie Endris4 Holly Ryan3, Eric Niven4, Eleyne Phillips3, Patrick Barnard3, and Fraka Harmsen5
1Center for Habitat Studies, Moss Landing Marine Labs, Moss Landing, CA & Tombolo, Orcas Island, WA, Email: [email protected]
2National Parks Serivice, Golden Gate National Recreational Area, San Francisco, CA 3U.S. Geological Survey, Menlo Park, CA 4Center for Habitat Studies, Moss Landing Marine Labs, Moss Landing, CA 5California University, Fresno, Fresno, CA Introduction For generations maps have told tales that words and numbers alone cannot. Maps guided us to the New World, helped us navigate from its edges into its interior. Vague, undefined maps showed Lewis & Clark where to go next – and in turn gave us fresher, more accurate maps that fueled further explorations. Maps outline the frontier for settlement and showed us where to find the silver, the gold and the coal that made us prosperous. Computer mapping helps businesses expand, prosper, and find new customers (Anthony, 2009). And it can be said that maps of the sea floor can aid in the understanding, conservation and exploitation of our marine resources. Therefore, in response to the U.S. National Parks Service’s (NPS) interest to map the submerged lands within park boundaries and to understand the aquatic processes that play a role in the formation, distribution and disturbances of both coastal and submarine resources in and around park boundaries, we embarked in the construction of marine thematic maps that can be used by NPS personnel to manage resources. The tasks involved the compilation of all available seafloor mapping data in and around the Golden Gate National Recreational Area (GGNRA) that include, but are not necessarily limited to, marine acoustical data, such as multibeam echosounder (MBES) bathymetry and backscatter data, side-scan sonar mosaics, and sediment sample information, the interpretation of recently collected data; and the construction of habitat and geologic maps. Goal The objective of this project was to compile available regional seafloor mapping data for San Francisco Bay and to interpret newly collected data provided through the California State Mapping Program (CSMP) and the United States Geological Survey (USGS) to construct benthic habitat and geologic maps of the submerged lands of the GGNRA. The habitat maps were constructed using the same habitat classification scheme and mapping code presently being used for the development of the CSMP habitat maps (Greene et al., 1999, 2005, 2007a). The maps comprise an integration of previous seafloor maps such as the San Francisco Bay anthropogenic habitat disturbance maps (Greene et al., 2007b).
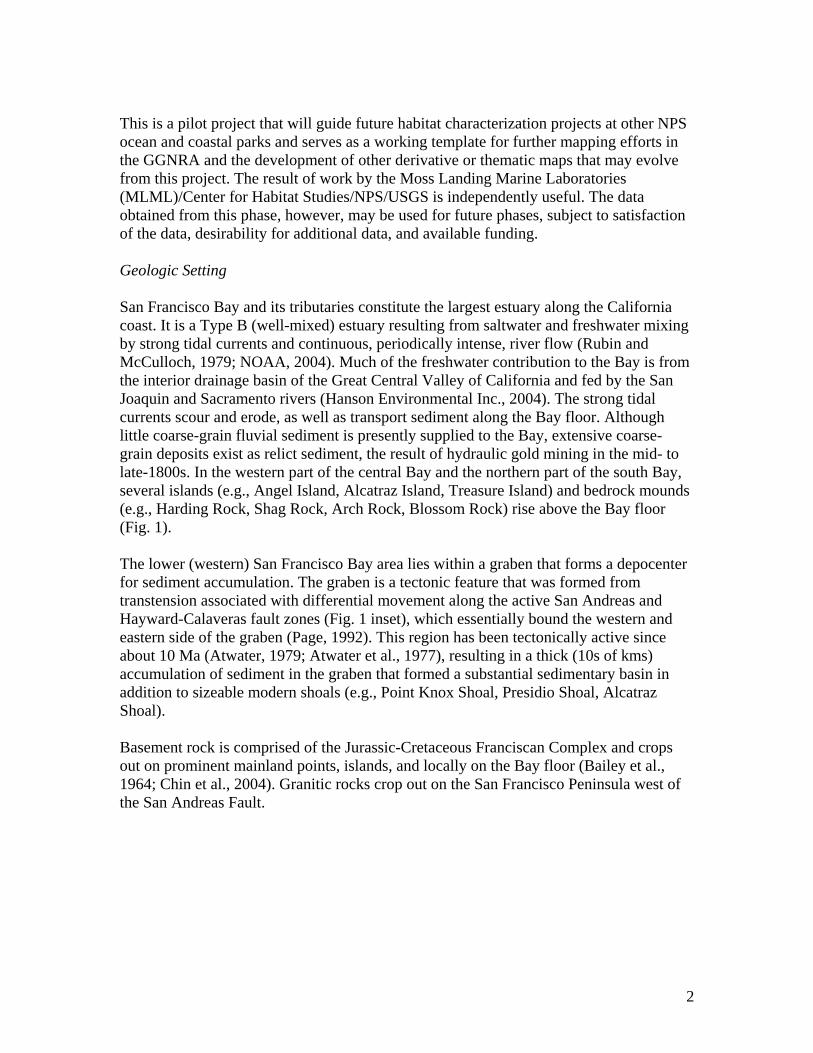
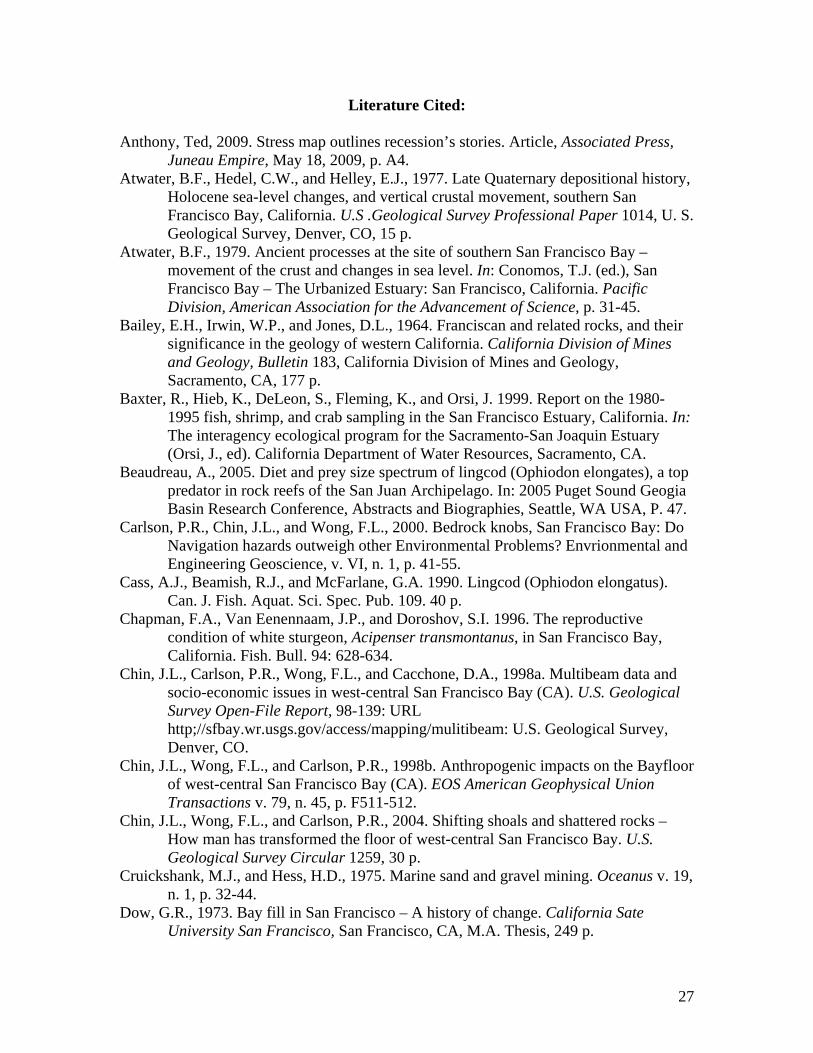
This is a pilot project that will guide future habitat characterization projects at other NPS ocean and coastal parks and serves as a working template for further mapping efforts in the GGNRA and the development of other derivative or thematic maps that may evolve from this project. The result of work by the Moss Landing Marine Laboratories (MLML)/Center for Habitat Studies/NPS/USGS is independently useful. The data obtained from this phase, however, may be used for future phases, subject to satisfaction of the data, desirability for additional data, and available funding. Geologic Setting San Francisco Bay and its tributaries constitute the largest estuary along the California coast. It is a Type B (well-mixed) estuary resulting from saltwater and freshwater mixing by strong tidal currents and continuous, periodically intense, river flow (Rubin and McCulloch, 1979; NOAA, 2004). Much of the freshwater contribution to the Bay is from the interior drainage basin of the Great Central Valley of California and fed by the San Joaquin and Sacramento rivers (Hanson Environmental Inc., 2004). The strong tidal currents scour and erode, as well as transport sediment along the Bay floor. Although little coarse-grain fluvial sediment is presently supplied to the Bay, extensive coarse-grain deposits exist as relict sediment, the result of hydraulic gold mining in the mid- to late-1800s. In the western part of the central Bay and the northern part of the south Bay, several islands (e.g., Angel Island, Alcatraz Island, Treasure Island) and bedrock mounds (e.g., Harding Rock, Shag Rock, Arch Rock, Blossom Rock) rise above the Bay floor (Fig. 1). The lower (western) San Francisco Bay area lies within a graben that forms a depocenter for sediment accumulation. The graben is a tectonic feature that was formed from transtension associated with differential movement along the active San Andreas and Hayward-Calaveras fault zones (Fig. 1 inset), which essentially bound the western and eastern side of the graben (Page, 1992). This region has been tectonically active since about 10 Ma (Atwater, 1979; Atwater et al., 1977), resulting in a thick (10s of kms) accumulation of sediment in the graben that formed a substantial sedimentary basin in addition to sizeable modern shoals (e.g., Point Knox Shoal, Presidio Shoal, Alcatraz Shoal). Basement rock is comprised of the Jurassic-Cretaceous Franciscan Complex and crops out on prominent mainland points, islands, and locally on the Bay floor (Bailey et al., 1964; Chin et al., 2004). Granitic rocks crop out on the San Francisco Peninsula west of the San Andreas Fault.
2
Figure 1. USGS MBES bathymetry artificially sun-illuminated image of San Francisco Bay floor showing morphologic features, islands, and rocks (after Greene et al., 2007b).
3
Unconformably overlying the basement rocks are Tertiary sedimentary rocks comprised primarily of marine sedimentary deposits of sandstones, siltstones, mudstones, and conglomerates. Locally derived modern sediment is supplied to the Bay region through erosion of basement rock, bedrock and unconsolidated alluvial deposits exposed around the periphery of the Bay and on the Bay floor. However, this contribution is insignificant because source material (rock outcrops) is now limited and artificial sediment impediments are in place on streams and creeks that drain into the Bay. The San Francisco Bay region is a high-density urban area with little natural drainage paths. The largest sediment supply to the Bay comes from the Sacramento River and this contribution is primarily fine-grain sediment because many of the pathways for coarse-grain sediment have been anthropogenically disrupted (Chin et al., 2004). Coarse-grain sediment in the form of coarse sand, gravels, pebbles, and cobbles exist in the Bay, but these are primarily relic deposits that have been reworked by the present-day current regime. Large bedforms, such as sediment waves and dunes, are common in the Bay, especially in northern Raccoon Strait, on Presidio/Alcatraz Shoal, north of Alcatraz Island, and south of Point Knox Shoal (Fig. 1). Chin et al. (2004) noted two major areas, southwest of Point Knox Shoal and south of the Presidio/Alcatraz Shoal, that have been anthropogenically disturbed by past aggregate mining (Fig. 1). The dynamic geology of the San Francisco Bay region has created several estuarine habitats (i.e., eelgrass beds, rock banks, sand shoals, previously existing oyster reefs, and tidal channels) that support a variety of fishes and invertebrates and constitute nursery grounds for several commercially important species (NOAA, 2004). These habitats, however, are currently at risk because of a variety of stressors, including increased coastal development, mining, and expansion of marine transportation systems. Previous Work San Francisco bay is a well-studied estuary, with research studies ranging from geology, biology and invasive species to aggregate mining and Bay land filling (Chin et al., 1998b; NOAA, 2004; Hanson et al., 2004). Although extensive work has been done in describing and mapping intertidal habitats, little effort has been devoted to deep estuarine habitats. The local effects of hydraulic mining in the Sierra Nevada, associated with placer gold mining of the mid-1800s, were described in detail by Gilbert (1917) and later discussed by Cruickshank and Hess (1975) and Hanson Environmental, Inc. (2004). The practice of using mud and other materials to create land and restore wetland habitats has been described by Dow (1973) and Goldbeck (1999). Rubin and McCulloch (1979) first detailed the extensive existence of large bedforms (sand waves) in the Bay and these features were clearly delineated in multibeam bathymetric images produced by the U.S. Geological Survey (Grahm and Pike, 1997). Environmental problems associated with lowering of rock outcrops near navigation channels and seafloor disturbances by dredging and mining on the Bay floor were reported upon by Chin et al. (1998a, b, 2004) and Carlson et al. (2000). Carlson et al. (2000) first mentioned deep-water habitats of the Bay, but no associated Bay floor map was constructed. Additionally, although the environmental report of Hanson et al. (2004) detailed dredging impacts on the Bay floor,
4
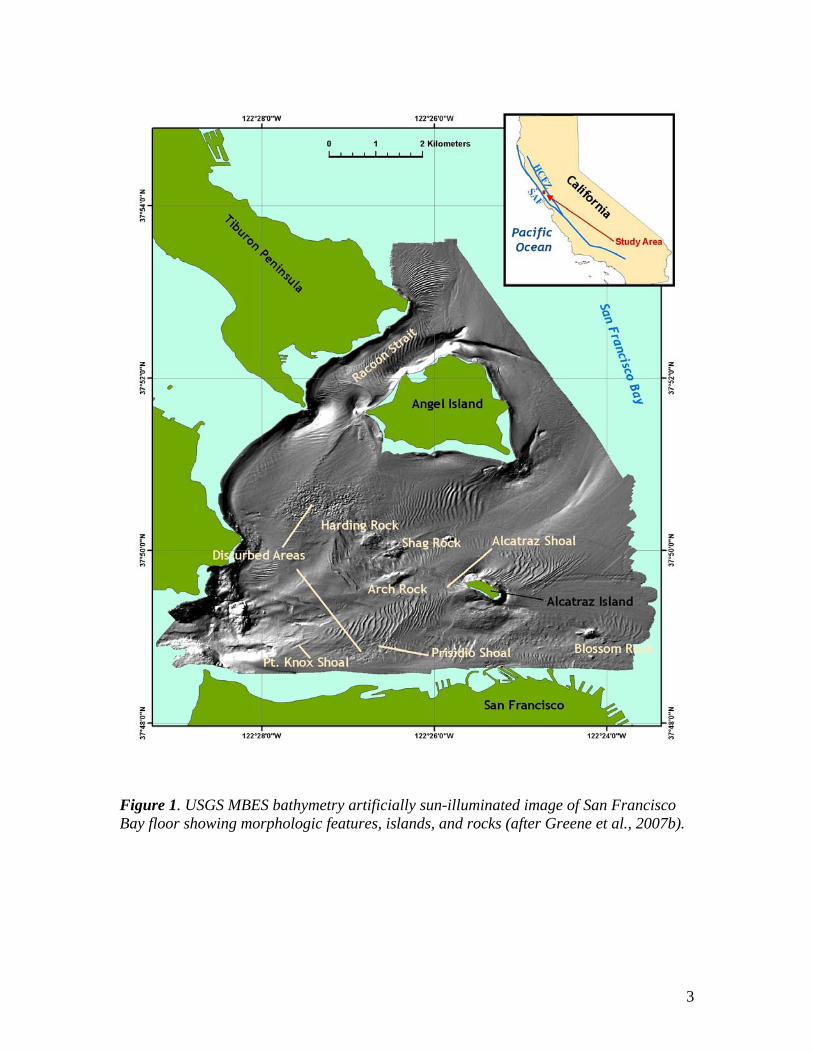
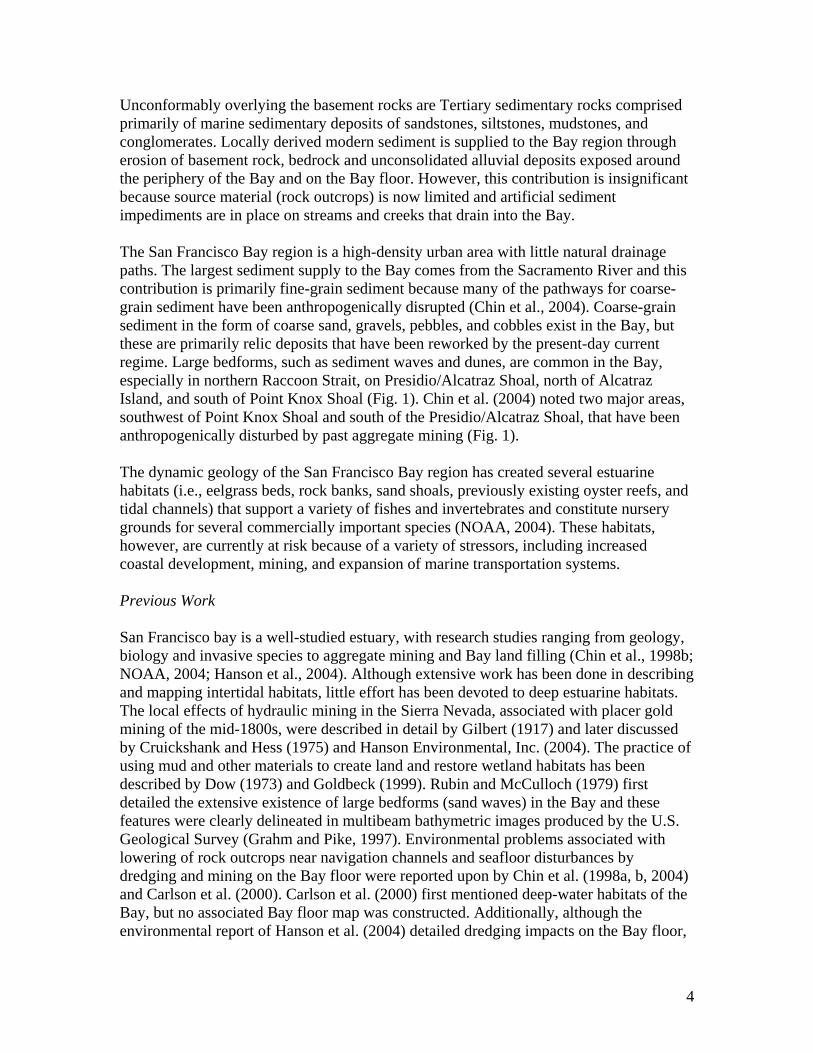
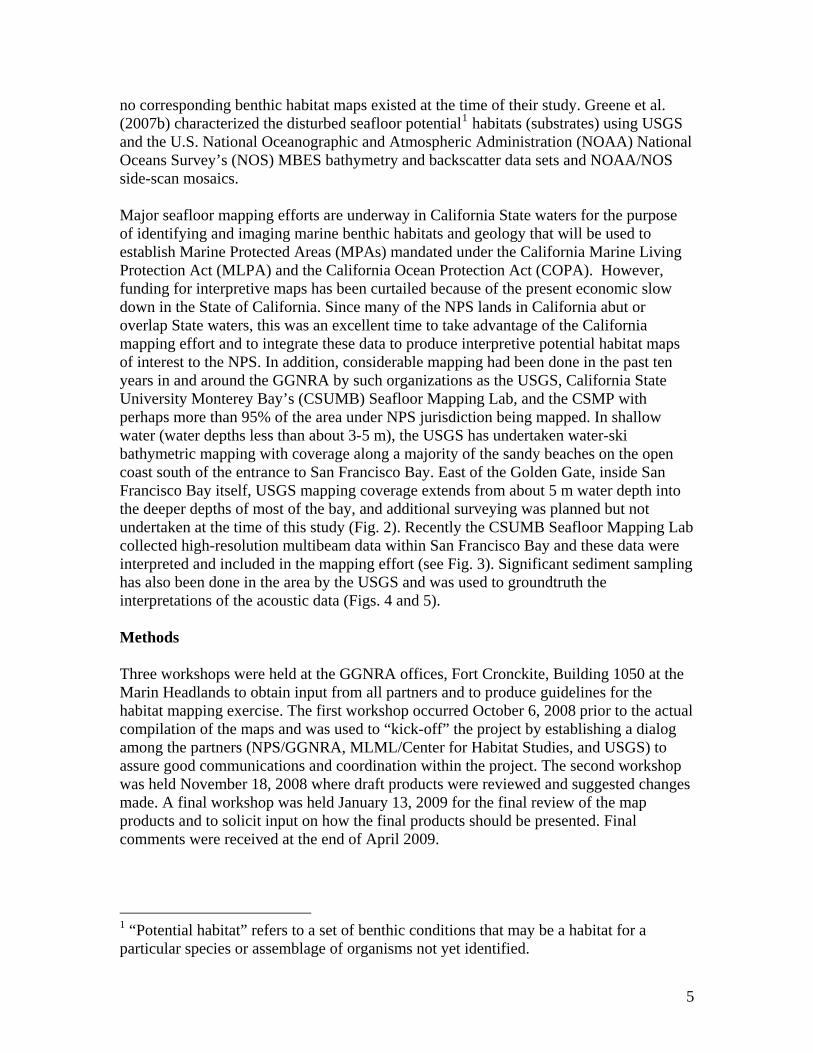
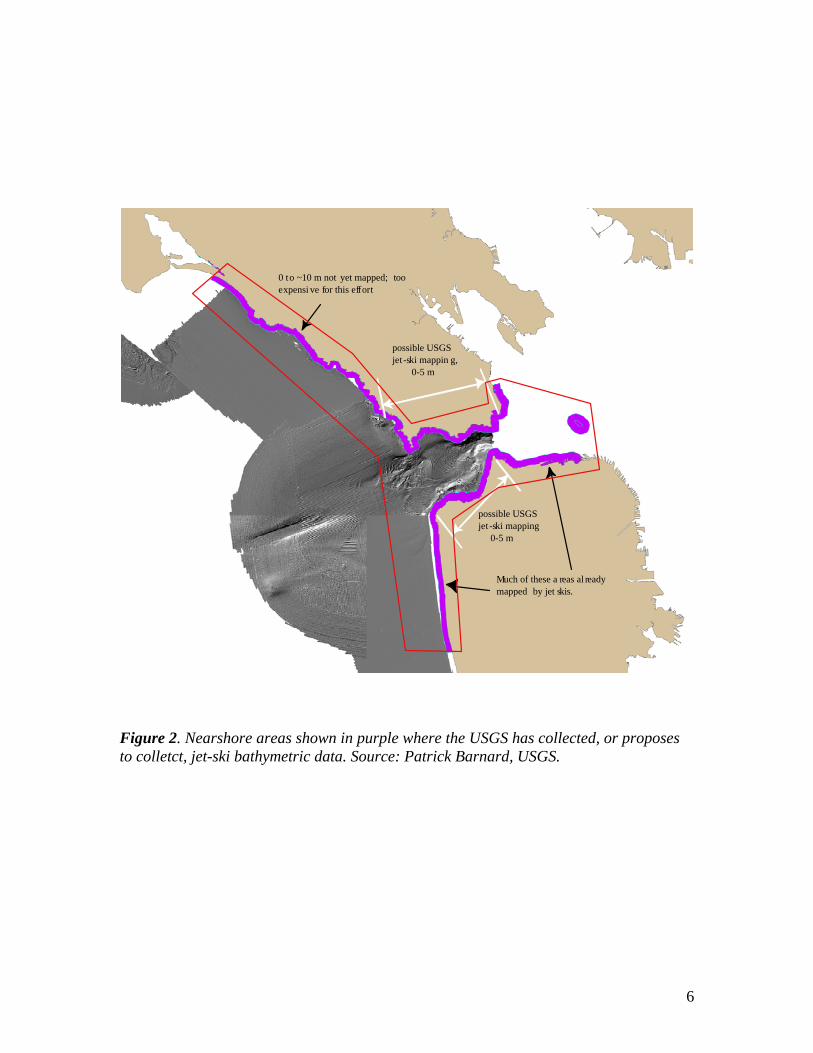
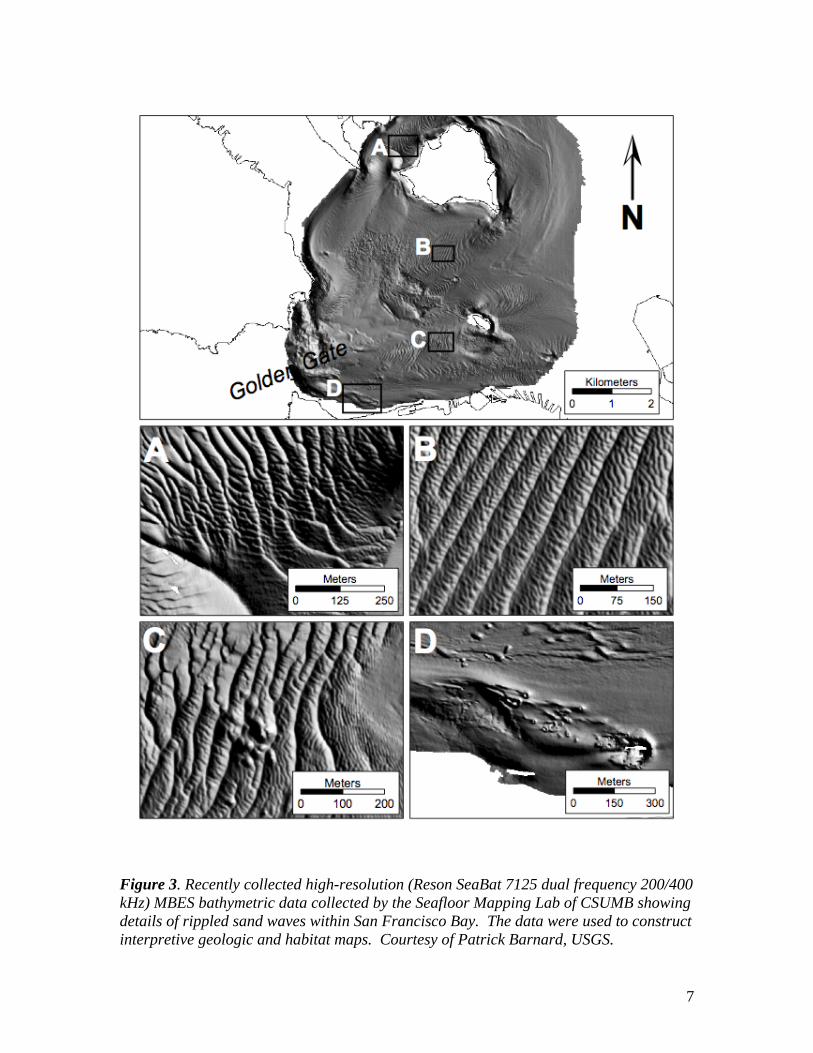
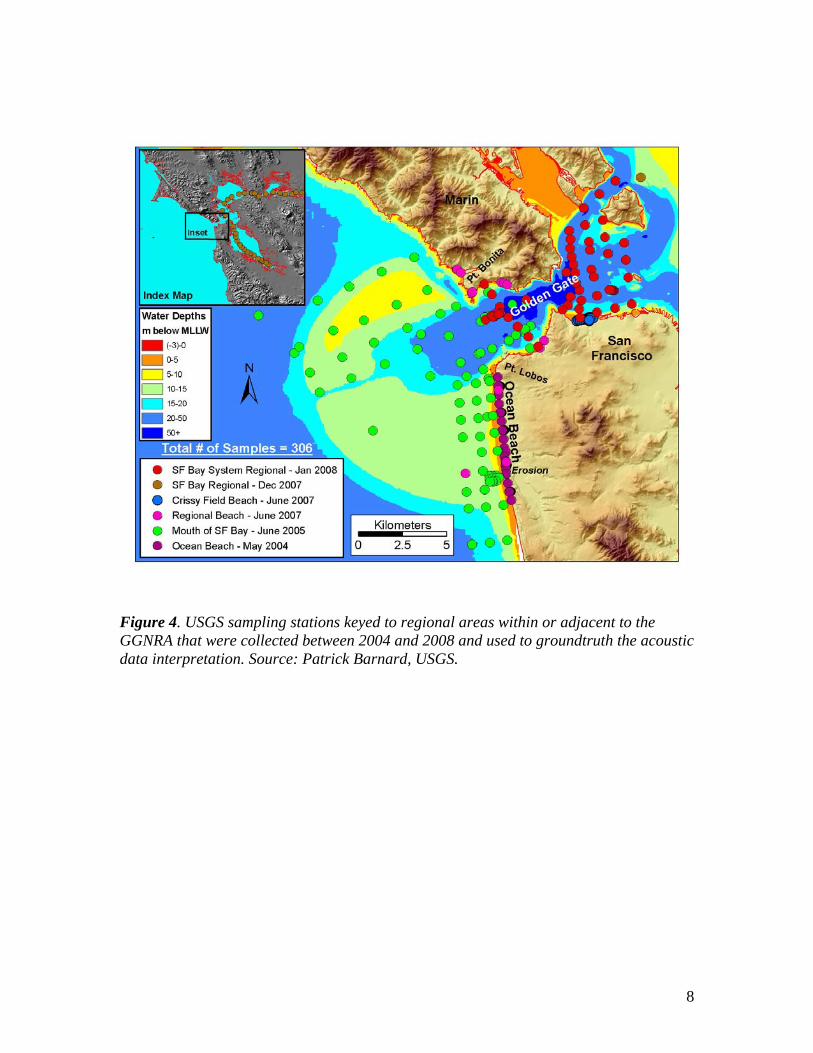
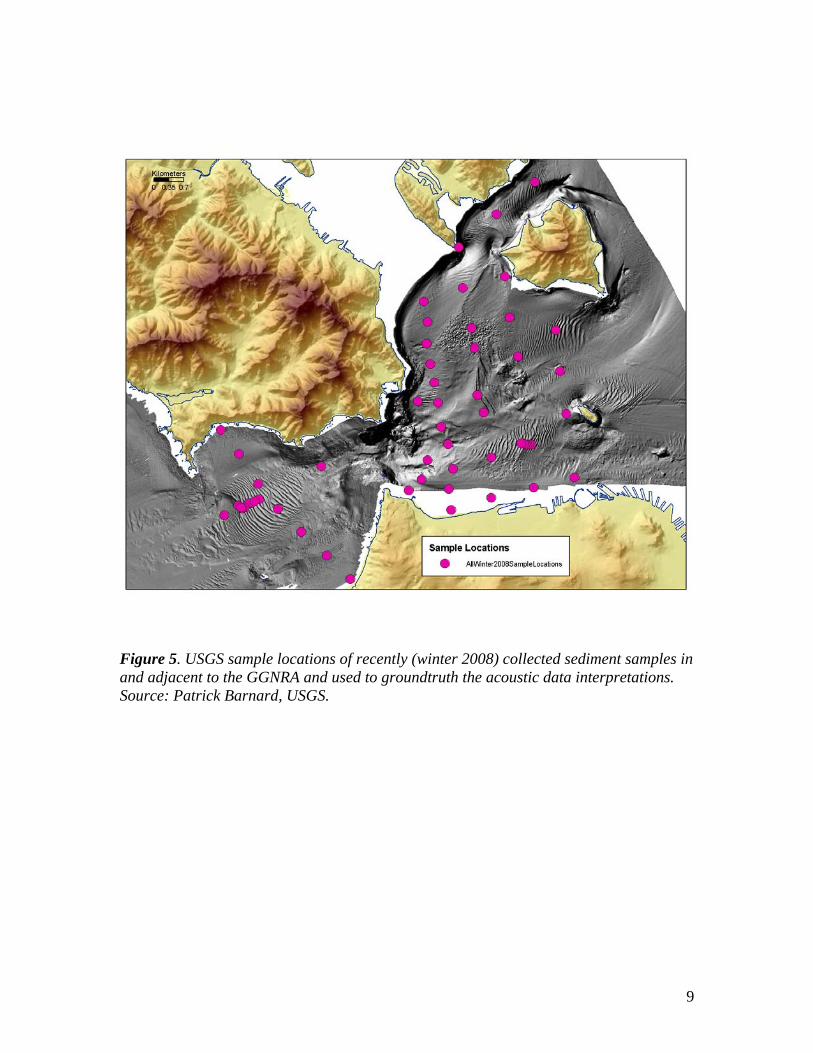
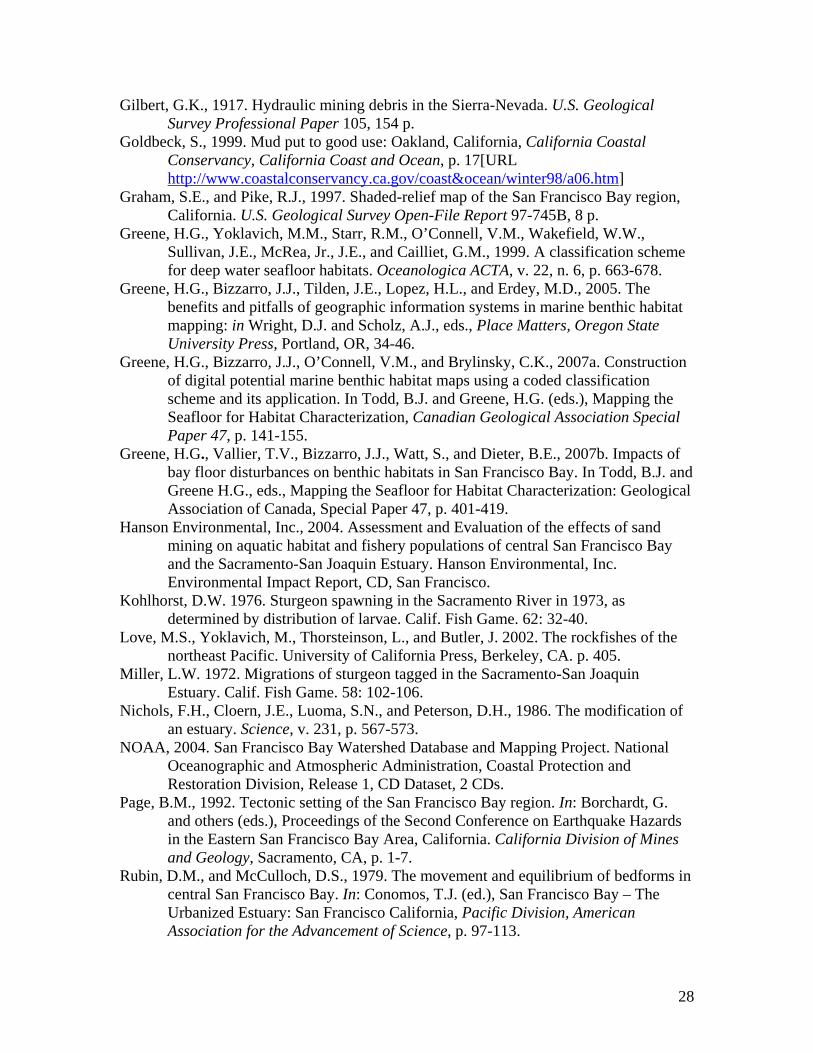
no corresponding benthic habitat maps existed at the time of their study. Greene et al. (2007b) characterized the disturbed seafloor potential1 habitats (substrates) using USGS and the U.S. National Oceanographic and Atmospheric Administration (NOAA) National Oceans Survey’s (NOS) MBES bathymetry and backscatter data sets and NOAA/NOS side-scan mosaics. Major seafloor mapping efforts are underway in California State waters for the purpose of identifying and imaging marine benthic habitats and geology that will be used to establish Marine Protected Areas (MPAs) mandated under the California Marine Living Protection Act (MLPA) and the California Ocean Protection Act (COPA). However, funding for interpretive maps has been curtailed because of the present economic slow down in the State of California. Since many of the NPS lands in California abut or overlap State waters, this was an excellent time to take advantage of the California mapping effort and to integrate these data to produce interpretive potential habitat maps of interest to the NPS. In addition, considerable mapping had been done in the past ten years in and around the GGNRA by such organizations as the USGS, California State University Monterey Bay’s (CSUMB) Seafloor Mapping Lab, and the CSMP with perhaps more than 95% of the area under NPS jurisdiction being mapped. In shallow water (water depths less than about 3-5 m), the USGS has undertaken water-ski bathymetric mapping with coverage along a majority of the sandy beaches on the open coast south of the entrance to San Francisco Bay. East of the Golden Gate, inside San Francisco Bay itself, USGS mapping coverage extends from about 5 m water depth into the deeper depths of most of the bay, and additional surveying was planned but not undertaken at the time of this study (Fig. 2). Recently the CSUMB Seafloor Mapping Lab collected high-resolution multibeam data within San Francisco Bay and these data were interpreted and included in the mapping effort (see Fig. 3). Significant sediment sampling has also been done in the area by the USGS and was used to groundtruth the interpretations of the acoustic data (Figs. 4 and 5). Methods Three workshops were held at the GGNRA offices, Fort Cronckite, Building 1050 at the Marin Headlands to obtain input from all partners and to produce guidelines for the habitat mapping exercise. The first workshop occurred October 6, 2008 prior to the actual compilation of the maps and was used to “kick-off” the project by establishing a dialog among the partners (NPS/GGNRA, MLML/Center for Habitat Studies, and USGS) to assure good communications and coordination within the project. The second workshop was held November 18, 2008 where draft products were reviewed and suggested changes made. A final workshop was held January 13, 2009 for the final review of the map products and to solicit input on how the final products should be presented. Final comments were received at the end of April 2009.
1 “Potential habitat” refers to a set of benthic conditions that may be a habitat for a particular species or assemblage of organisms not yet identified.
5
Much of these a reas al ready mapped by jet skis.
possible USGSjet-ski mapping 0-5 m
possible USGSjet-ski mappin g, 0-5 m
0 to ~10 m not yet mapped; tooexpensi ve for this effort
Figure 2. Nearshore areas shown in purple where the USGS has collected, or proposes to colletct, jet-ski bathymetric data. Source: Patrick Barnard, USGS.
6
Figure 3. Recently collected high-resolution (Reson SeaBat 7125 dual frequency 200/400 kHz) MBES bathymetric data collected by the Seafloor Mapping Lab of CSUMB showing details of rippled sand waves within San Francisco Bay. The data were used to construct interpretive geologic and habitat maps. Courtesy of Patrick Barnard, USGS.
7
Figure 4. USGS sampling stations keyed to regional areas within or adjacent to the GGNRA that were collected between 2004 and 2008 and used to groundtruth the acoustic data interpretation. Source: Patrick Barnard, USGS.
8
Figure 5. USGS sample locations of recently (winter 2008) collected sediment samples in and adjacent to the GGNRA and used to groundtruth the acoustic data interpretations. Source: Patrick Barnard, USGS.
9
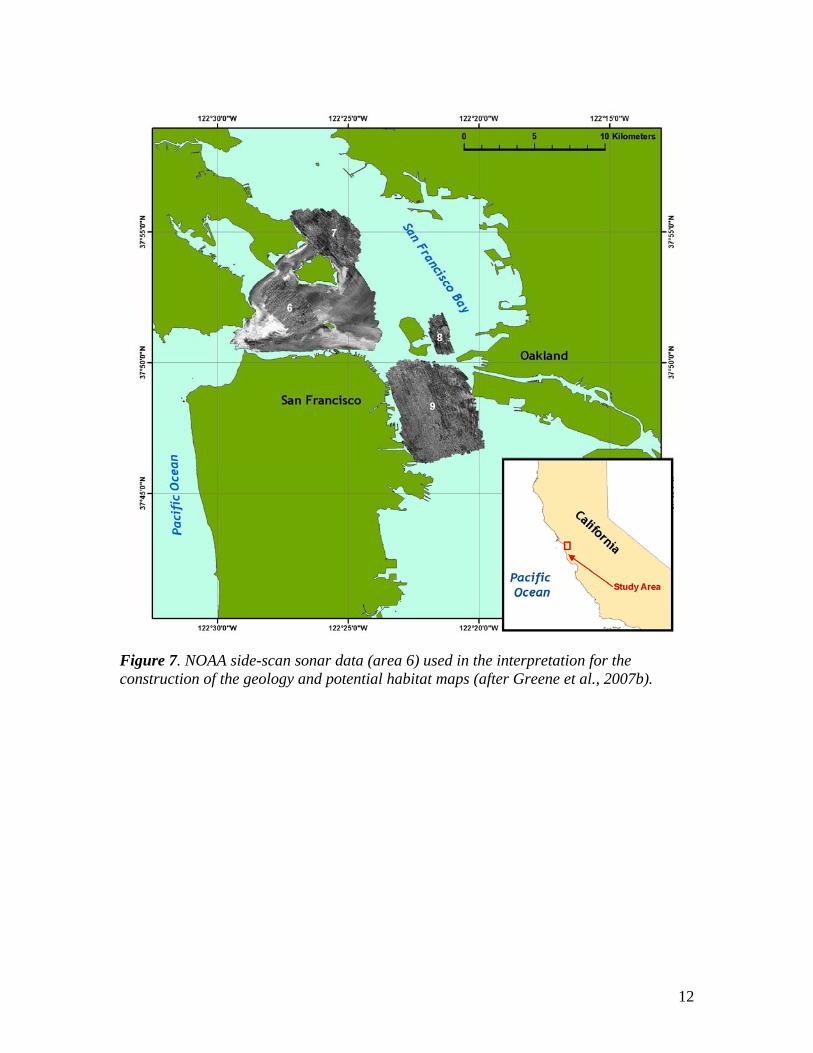
As a base for our interpretations, we used the habitat map constructed from the USGS MBES data set and the NOAA’s MBES and side-scan sonar data sets to modify the previous habitat interpretations and to extend the mapping into shallow water (Figs. 6-8). Data used to create the potential benthic habitat map and geologic map consist of multibeam bathymetry, acoustic backscatter, and sediment samples. Geophysical Data Sets We used four NOAA major data sets, USGS jet-ski bathymetry data, and the newly acquired CSUMB Seafloor Mapping Lab’s San Francisco Bay MBES data set as a basis for geology and habitat interpretations (Figs. 3, 6, and 7). These data are: 1) United States Geological Survey (USGS) multibeam bathymetry and backscatter data collected around Alcatraz and Angel islands and obtained from the USGS Web site (n = 1), 2) disparate patches of multibeam bathymetry collected sporadically during the past 10 years by the National Ocean Survey (NOS) of the National Oceanic and Atmospheric Administration (NOAA; n = 3), and 3) side-scan sonar data collected by NOS/NOAA in the central bay around Angle Island (n = 1). The jet-ski single beam bathymetry and bay floor sediment samples were collected along Ocean Beach and the southwestern nearshore parts of the Bay in 1998 and 2002-2008 by USGS.
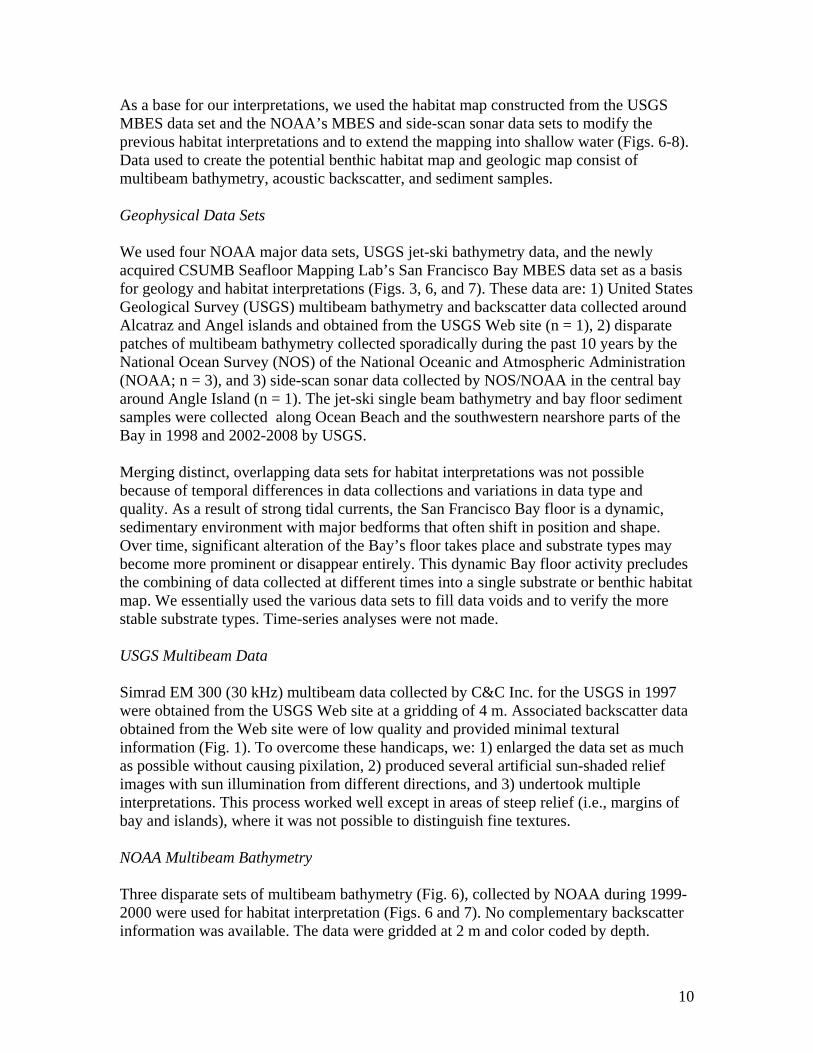
Merging distinct, overlapping data sets for habitat interpretations was not possible because of temporal differences in data collections and variations in data type and quality. As a result of strong tidal currents, the San Francisco Bay floor is a dynamic, sedimentary environment with major bedforms that often shift in position and shape. Over time, significant alteration of the Bay’s floor takes place and substrate types may become more prominent or disappear entirely. This dynamic Bay floor activity precludes the combining of data collected at different times into a single substrate or benthic habitat map. We essentially used the various data sets to fill data voids and to verify the more stable substrate types. Time-series analyses were not made. USGS Multibeam Data Simrad EM 300 (30 kHz) multibeam data collected by C&C Inc. for the USGS in 1997 were obtained from the USGS Web site at a gridding of 4 m. Associated backscatter data obtained from the Web site were of low quality and provided minimal textural information (Fig. 1). To overcome these handicaps, we: 1) enlarged the data set as much as possible without causing pixilation, 2) produced several artificial sun-shaded relief images with sun illumination from different directions, and 3) undertook multiple interpretations. This process worked well except in areas of steep relief (i.e., margins of bay and islands), where it was not possible to distinguish fine textures. NOAA Multibeam Bathymetry Three disparate sets of multibeam bathymetry (Fig. 6), collected by NOAA during 1999-2000 were used for habitat interpretation (Figs. 6 and 7). No complementary backscatter information was available. The data were gridded at 2 m and color coded by depth.
10
Figure 6. NOAA MBES bathymetry in areas 1, 3, and 4 used in the interpretation of the geology and potential habitat maps (after Greene et al., 2007b).
11
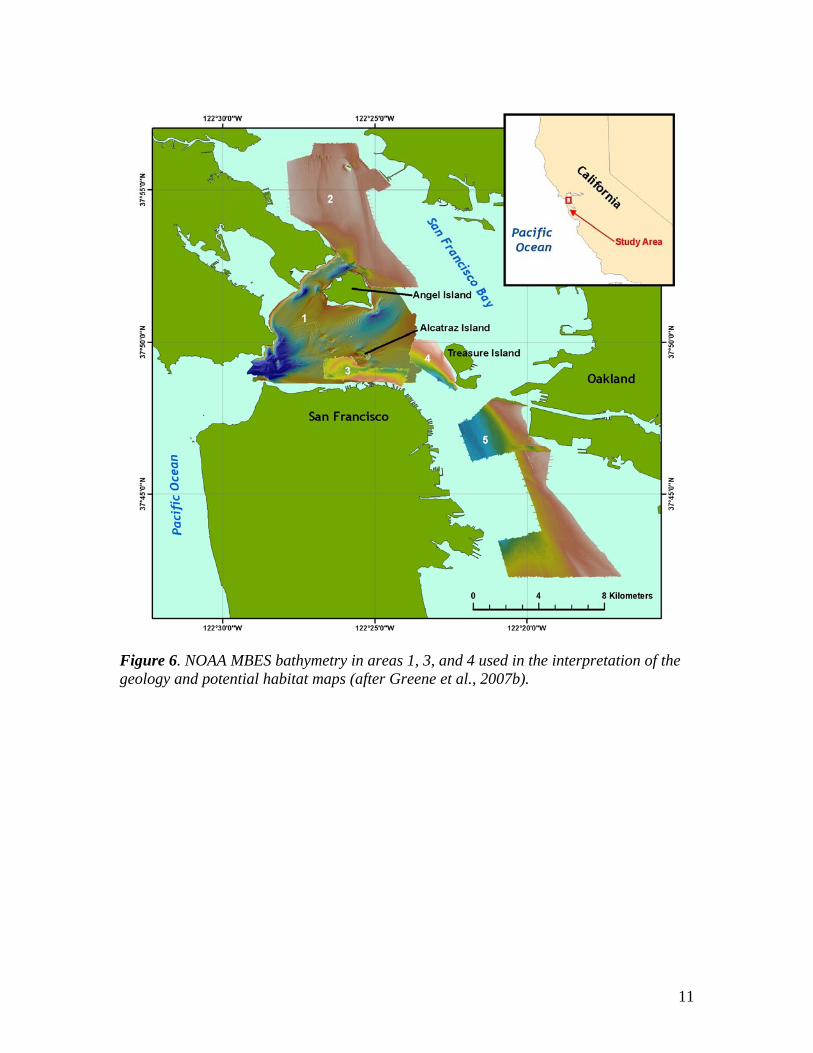
Figure 7. NOAA side-scan sonar data (area 6) used in the interpretation for the construction of the geology and potential habitat maps (after Greene et al., 2007b).
12
Figure 8. Previously generated potential habitat map of the San Francisco Bay area that
was modified using new geophysical, bathymetric, and sampling data to produce the GGNRA geology and potential habitat and geologic maps.
13
Although resolution was poor and no grayscale images or grids were available, we were able to confidently interpret Bay floor habitats and produced maps that appear to correlate well with the known geology. CSUMB Multibeam Bathymetry A Reson SeaBat 7125 dual freguency (200/400 kHz) MBES system was used to collect bathymetric data in the central San Francisco Bay area where repeated coverage was made of the USGS MBES survey area. Depth grids created from bathymetric surveys were processed to a horizontal resolution of one to two meters. Backscatter intensities were processed into mosaics with a one-meter resolution. All data were compiled and displayed for interpretation using ESRI ArcGIS® software, ArcMap® v.9.2. The process edits a shapefile within ArcMap, beginning with the construction of polygons to delineate benthic features. A feature is an area with common characteristics, which can be characterized as a single potential habitat type or geologic type. The boundaries and extents of these features were determined from the bathymetric data. Generally, interpretations were made at a scale of 1:5,000 or greater west of the Golden Gate, and approximately 1:2,000 east of the Golden Gate. All areas within the offshore park boundary were interpreted at less than 1:2000. USGS Jet-Ski Data Bathymetric data (single beam echosounder) collected by the USGS using jet skis were used to interpret the seafloor conditions in the shallow water where conventional geophysical data collection was not possible. These data were previously collected and processed by the USGS and provided to us as bathymetric shapefiles. The data were collected along Ocean Beach and along the southern part of the shoreline from the Golden Gate westward in water depths of 0-5 m (Fig. 2). NOAA Side-Scan Sonar Data Side-scan sonar data collected by NOAA during the summer of 2002 were also interpreted to create maps of Bay-floor habitats. These data were collected using a Klein™ 3000 dual frequency (nominal 100 and 500 kHz) sea floor mapping system in the region around Angel Island (Fig. 7). These data were generally of high quality and facilitated interpretation of the textural characteristics of the Bay-floor region depicted. Strong nadir stripping reduced the aesthetic quality of some data, although interpretations of reasonable confidence could be made regardless of this interference. USGS Sediment Samples Sediment sample information obtained by a van Veen-like sediment grab (penetrating between 5 and15 cm into the sediment) provided by the USGS were used to validate the acoustic geophysical data interpretation and to groundtruth the geology and potential habitat types. The combination of acoustic backscatter data and "groundtruthed" sediment samples were used to delineate seafloor sediment types within areas identified as "soft
14
(s)" induration. Initially, groundtruth data, in the form of grab sample descriptions and average grain size measurements, were categorized into four grain-size categories: mud (m), muddy sand (s/m), sand (s), and sandy gravel (s/g). Backscatter data were then classified into four intensity categories (low, medium, high, very high) that are assumed to correspond to relative grain sizes. The aim was to develop an intensity classification of the seafloor that correlated with the data collected from the sediment samples. Thus, the combination of remotely observed data (acoustic backscatter) and directly observed data (sediment grab samples) translates to higher confidence in our ability to interpret broad areas of the seafloor. Nonetheless, we caution against using our sediment type interpretations as anything more than "best-guess" due to the following issues: characterization of contiguous sediment bodies is a difficult procedure since even small areas can exhibit a wide spectrum of backscatter intensity values that lack distinct boundaries; backscatter intensity can be affected by depth, vegetation, water column conditions, and seafloor relief; and directly observed sediment data, in the form of sediment samples, represents a very small area relative to remotely observed data, requiring broad areas of interpolation. These methods primarily pertain to the area east of the Golden Gate where the quality and resolution of backscatter data was very high. Unfortunately, the majority of backscatter data west of the Golden Gate was considered substandard for making confident interpretations of the sediment type. Results Interpretations High-resolution multibeam sonar data in the form of bathymetric depth grids (seafloor digital elevation models, referred to as the "bathymetry") were the primary data used to interpret potential habitat types. Shaded relief imagery ("hillshade") allows for visualization of the terrain and interpretation of submarine landforms. Based on these hillshades, areas of rock were identified by their often sharply defined edges and high relative relief; these may be contiguous outcrops, isolated portions of outcrop protruding through sediment cover (pinnacles and rocks), or isolated boulders. Although these types of features can be confidently characterized as exposed rock, it is not uncommon to find areas within or around a rocky feature that appears to be covered by a thin veneer of sediment. These areas are identified as "mixed" induration, containing both rock and sediment. Broad areas of the seafloor lacking sharp and angular characteristics are considered to be sediment. Sedimentary features may contain erosional or depositional characteristics recognizable in the bathymetry, such as dynamic bedforms (dunes or sand waves). General morphologic features such as scours, mounds, and depressions were also identified using the hillshade relief imagery. Fifty-two potential benthic habitat types were defined from the interpreted data sets using the most recent version of the deep-water marine benthic habitat characterization mapping code developed by Greene et al. (1999, 2005, 2007a) and adapted specifically for estuary conditions (see Appendix I). Potential habitats ranged from hard bedrock outcrops on island and mainland flanks and some Bay floor regions, to soft, very dynamic bedforms consisting of sediment waves and ripples. Soft sediment ranged from mud and
15
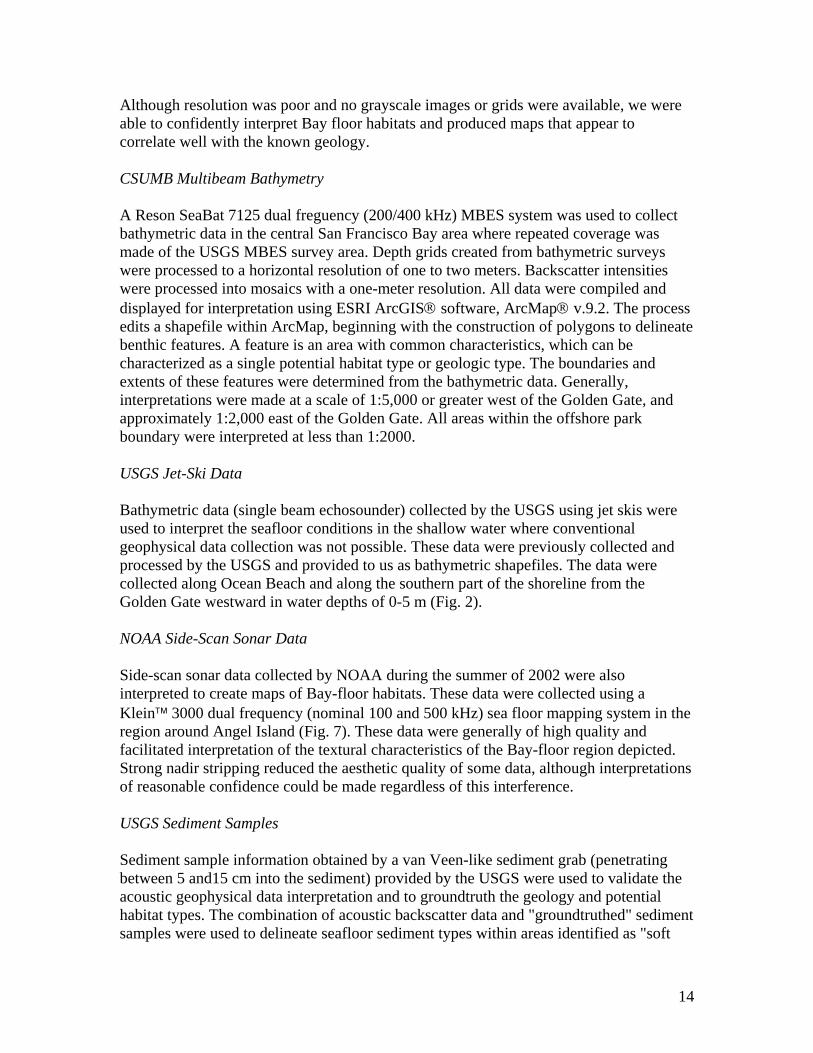
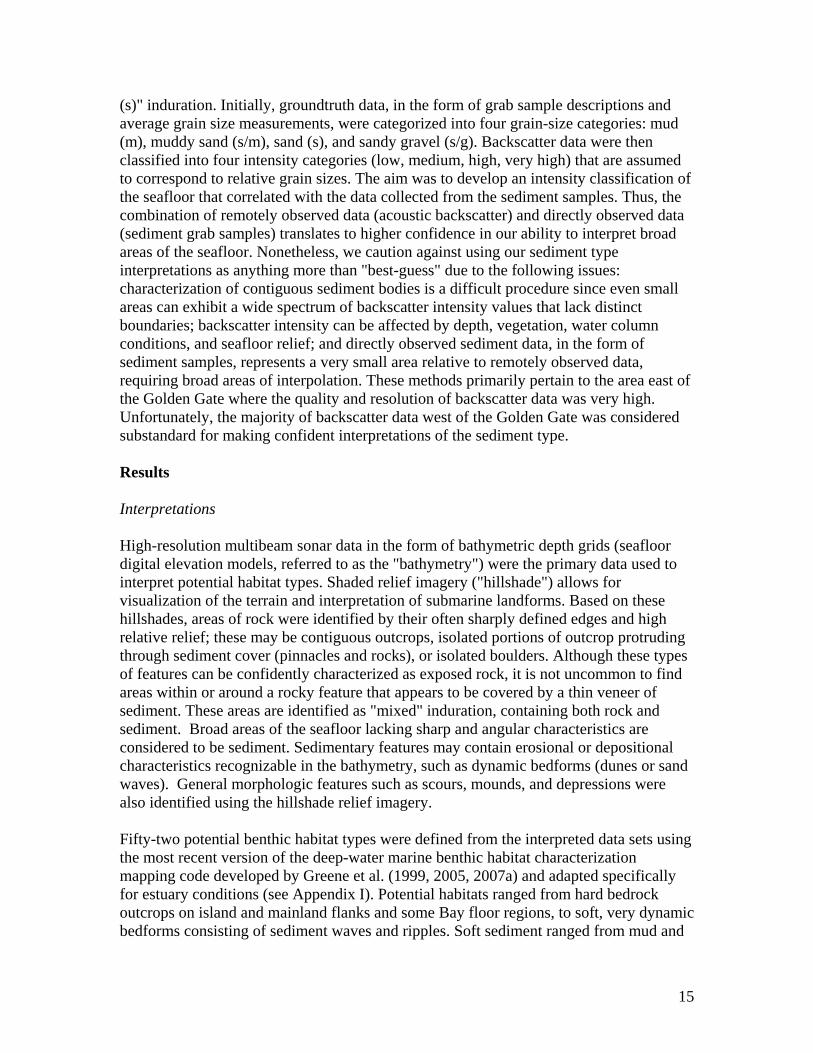
sand to bimodal (two or more grain sizes) sediment of gravel, pebbles, and cobbles. In addition, considerable anthropogenic features (i.e., pipelines, bridge abutments, dredged channels, dump sites) were distinguished. Of the 52 potential marine benthic habitat types mapped, 24 were of unconsolidated sediment with five of these comprised of dynamic bedforms or sediment waves and dunes, five of mixed (soft over hard) substrate type, six of hard substrate or rock outcrop, 13 of anthropogenically disturbed areas and four hard anthropogenic features. Rock outcrops and rubble are considered the primary habitat type for rockfish and lingcod (Cass et al., 1990; Love et al., 2002). Dynamic bedforms such as sand waves are considered potential foraging habitat for juvenile lingcod and possibly migratory fishes (Beaudreau, 2005). The potential habitat types are mapped within two megahabitat types after Greene et al. (2007a) – Estuary (E) and continental Shelf (S). On the continental shelf, the unconsolidated sediment substrate type makes up 94% of the total potential habitat types mapped of which 14% is dynamic bedforms or sediment waves. The remaining potential habitat types are 3% hard substrate, 2% mixed substrate and 1% anthropogenic disturbance (Fig. 9). In San Francisco Bay the unconsolidated sediment substrate type makes up 74% of the total potential habitat type of which 49% is dynamic bedforms or sediment wave fields.The remaining potential habitat types are 9% anthropogenic disturbed substrate or structures, 5% hard substrate or rock outcrop, and 2% mixed (soft over hard) substrate type (Fig. 10). The primary result of this work is the construction of a series of maps for the GGNRA that included MBES bathymetry seafloor relief images or digital elevation models (DEM), acoustic backscatter, interpretive potential marine benthic habitat, and surficial seafloor geology maps. The title of the map series is “Golden Gate National Recreational Area Seabed Classification Map Series,” edited by H. Gary Greene with multiple authors for each map sheet. Five map sheets and one inset, or “Areas of Interest” sheet, are included in the series as listed below: Sheet 1. Endris, C, Dieter, B., and Niven, E., 2009. Sun-illuminated (315o azimuth)
Bathymetry, Map 1 of 5. In Greene, H.G., (ed.), Golden Gate National Recreation Area, Seabed Classification Map Series Final Report to NPS/GGNRA, San Francisco, scale 1:24,000.
Sheet 2. Endris, C., Dieter, B., and Niven, E., 2009. Color-coded Bathymetry with
Contours, Map 2 of 5. In Greene, H.G., (ed.), Golden Gate National Recreation Area, Seabed Classification Map Series Final Report to NPS/GGNRA, San Francisco, scale 1:24,000.
Sheet 3. Endris, C., Dieter, B., and Niven, E.. 2009. Acoustic Backscatter Imagery,
Map 3 of 5. In Greene, H.G., (ed.), Golden Gate National Recreation Area, Seabed Classification Map Series Final Report to NPS/GGNRA, San Francisco, scale 1:24,000.
16
Figure 9. Percentage of potential habitat types (substrate) mapped on the continental shelf (top).
Figure 10. Percentage of potential habitat types (substrate) mapped in San FranciscoBay (bottom).
17
Sheet 4. Niven, E., C., Greene, H.G., Endris, C., Dieter, B., and Ryan, H., 2009. Onshore-Offshore Geology Map, Map 4 of 5. In Greene, H.G., (ed.), Golden Gate National Recreation Area, Seabed Classification Map Series Final Report to NPS/GGNRA, San Francisco, scale 1:24,000.
Sheet 5. Endris, C., Greene, H.G., Dieter, B., Niven, E., Barnard, P., and Phillips,
E., 2009. Potential Marine Benthic Habitats, Map 5 of 5. In Greene, H.G., (ed.), Golden Gate National Recreation Area, Seabed Classification Map Series Final Report to NPS/GGNRA, San Francisco, scale 1:24,000.
Sheet 6. Endris, C., Dieter, B., Niven, E., Greene, H.G., Barnard, P., and Phillips, E., 2009. Areas of Interest (inset maps). In Greene, H.G., (ed.), Golden Gate National Recreation Area, Seabed Classification Map Series Final Report to NPS/GGNRA, San Francisco, scale (insets) 1:7,500. Geologic Map The San Francisco Bay area, including the area shown in the map, is located on the transform boundary between the Pacific and North American plates. The San Andreas Fault Zone represents this boundary with concealed traces of faults (shown on the Geologic Map), oriented and extending offshore northwest from land (Ryan et al., in press). In addition, the San Gregorio Fault (an ancillary fault to the San Andreas Fault Zone) connects to the San Andreas Fault north of the mapped area and is considered part of this major fault zone. Seafloor geology, both in the San Francisco Bay (estuary) and in the offshore (continental shelf), is primarily composed of Quaternary unconsolidated sediment dominated by sand, and in many places dynamic bedforms, such as sediment waves and dunes. In the high-energy wave zone where bedrock and basement rocks crop out along the coastline, rock exposures comprised of the Franciscan Complex are present on the seafloor. These outcrops remain unburied and smoothed by the swift tidal currents and entrained sediment flowing through the Golden Gate. Along the outer coast south of the Golden Gate, steep bluffs and the long Ocean Beach are composed of sand. Beach nourishment appears to occur from sediment deposited and transported from the horseshoe bar (a broad shoal area shown in the bathymetry map, Map 1 or 1) west of the Golden Gate. In San Francisco Bay, Angel and Alcatraz islands, as well as locally scattered submarine rocks, are comprised of the Franciscan Complex. Designation of offshore geologic features Quaternary units are identified as Quaternary (Holocene) if they are actively evolving features or materials deposited in the Quaternary time. Bathymetric data used to create the geologic map show differences in extent and sizes of 'mobile sediment depressions' ['Q(g)s']. Other units identified as Quaternary only cannot be conclusively interpreted as active based on the data and information available at the time of this study, but are likely not completely static. The symbol 'Q(g)s' is also used wherever sediment is identified as
18
coarser than mud, silt or fine-grained sand based on acoustic backscatter intensities. The symbol 'Qsed' refers to all areas of sediment that are acoustically uniform and morphologically smooth, flat, or featureless. Groundtruthing data such as sediment samples and seafloor video are often used to verify the interpretations from geophysical data and are available for many point locations within the mapping area, but the resolution of that information is too sparse to fully characterize the large expanse of the mapped Quaternary sediments. Generally 'Qsed' areas are comprised of mud and sand with biogenic clasts interspersed. Bedded strata of Tertiary age are identified at both the north and south ends on the shelf areas west of the Golden Gate. Identification of Pliocene Purisima ('Tp') and Miocene Monterey ('Tm') formations, as well as the unnamed Paleocene unit ('Tss'), is made by a combination of terrestrially mapped units that extend offshore along known structural boundaries (faults) where bedded outcrops are identifiable. Differentiation between Monterey and Purisima formations offshore is possible due to the juxtaposition of their distinct stratigraphy along fault contacts (contacts which reflect similar lithostratigraphic differences on land). The Purisima formation is more massively bedded and is generally less folded than the thinner more tightly inter-layered and folded Monterey and Santa Cruz Mudstone formations, which is evident in the multibeam imagery. The symbol 'TKu', or ‘QTu?’ is used where the likelihood of Cretaceous to Tertiary age rocks are expected to be found based on the mapped unit’s stratigraphic relationship to adjacent units and when good rock samples of the unit are not available. Generally these are isolated boulders or pinnacles of bedrock protruding through sediment cover. When these features are located in the vicinity of mapped onshore and trans-terrestrial landslides, it may be possible to identify them as landslide debris. At several coastal localities, the 'TKu' or ‘QTu?’ designation is used where it is not possible to identify a rock type due to indistinct morphology as well as discontinuous or heterogeneous outcrops and no good relationship to adjacent terrestrial units. This is especially true in the southern areas of the geologic map where there exist both Tertiary sedimentary rocks and Cretaceous crystalline basement rocks. The Cretaceous crystalline basement rocks are granite or granodiorite and are characteristic of the Salinian tectonostratigraphic terrane, which is bound in this region by the San Andreas Fault Zone on the east and the San Gregorio Fault Zone on the west. The granitic rocks have a distinct crosshatch, subangular surface texture, which is identifiable in several outcrops along the San Mateo County coast ('Kgr'). Several outcrops are also located where granitic basement rocks are presumed to occur but lack the very distinctive granite morphology and texture, so these features are given a questionable designation ('Kgr?'). North and east of the northwest-southeast trending San Andreas Fault Zone is the highly heterogeneous metamorphosed rocks offscraped from the earlier downgoing subduction slab known as the Franciscan Complex ('KJf'). A variety of protolithic rock types, including greywacke, limestone, serpentinite, shale, basalt, and gabbro, were subjected to deep burial and metamorphism during plate subduction. The metamorphosed form of
19
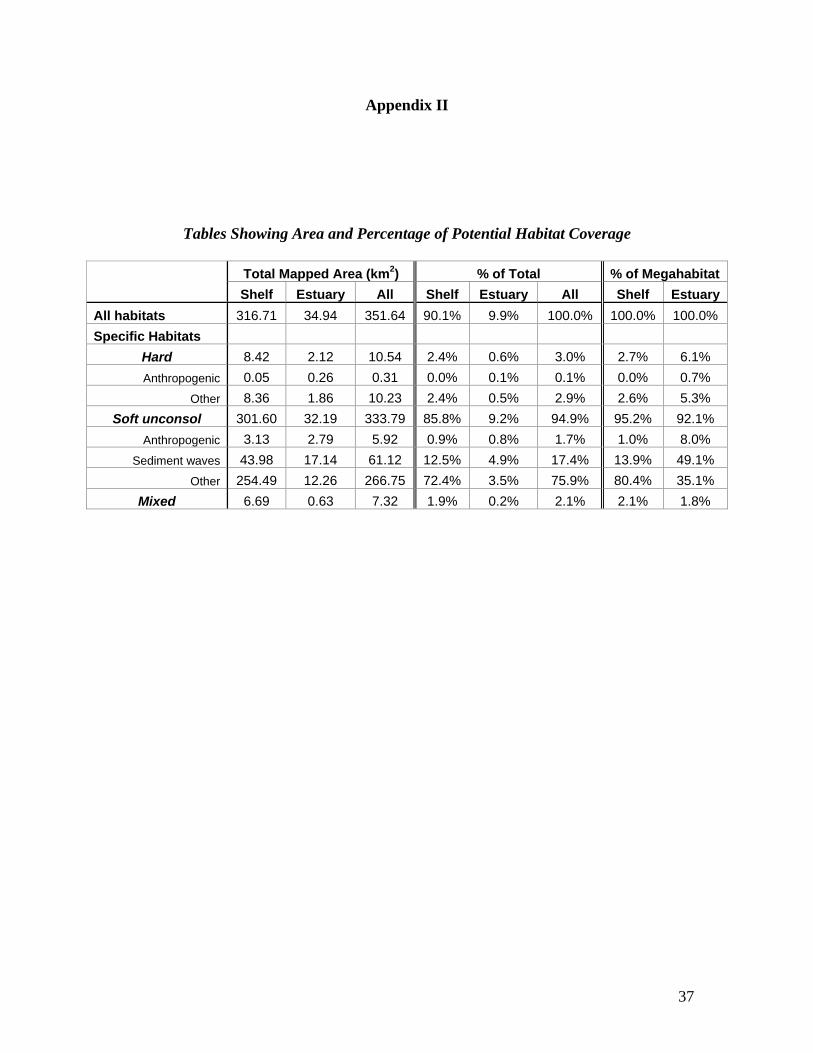
these rocks as well as mélange units comprises the Franciscan Complex and has been dated as Jurassic to Cretaceous in age. However, the various lithologies or rock types that make up the Franciscan Complex cannot be mapped independently using the acoustic data, therefore the unit mapped as Franciscan Complex is based on the heterogeneous nature of the rock exposure on the seafloor and its relationship, stratigraphically and structurally, to adjacent offshore and onshore units. Anthropogenic units were identified based on appearance in multibeam bathymetric hillshaded relief imagery, combined with information about known activities past and present occurring in the region. Shipping and extraction industry are the primary source of anthropogenic disturbed areas offshore ('a') while seawalls, structures, revetments, and outflow pipes are the primary types of hard anthropogenic features seen adjacent to shore ('ahs'). Habitat Map The characterization of marine benthic habitats is closely correlated with geology. Based on physiography, geomorphology, and substrate types, 52 potential habitat types were identified and mapped in an area of 351.94 km2 with 316.71 km2 (or 90.07% of total area mapped) located offshore on the continental shelf and 34.94 km2 (9.93% of total area mapped) found in the Bay (see Appendix II). Of the total habitat types mapped, six consisted of hard rock outcrops or substrate that covers 10.54 km2 (3.0% of the total area mapped) with 8.42 km2 (2.39% of total mapped area) located offshore on the shelf and 2.12 km2 (0.6% of total area mapped) found in the Bay. Soft unconsolidated sediment covers 333.79 km2 (94.92% of total area mapped) with 301.60 km2 outside of the Bay on the continental shelf (85.77% of total mapped area) and 32.19 km2 (9.15% of total area mapped) in the Bay, while 62.12 km2 (17.38% of total area mapped) is comprised of dynamic bedforms (sediment wave or dune fields); 44.0 km2 (12.51% of total area mapped) located on the continental shelf and 17.14 km2 (4.87% of total area mapped) found in the Bay. Human disturbance is extensive in the mapped area, especially in San Francisco Bay, where 0.26 km2 (0.07% of total area mapped) is disturbed; offshore, on the continental shelf only (0.05 km2 (0.01% of total area mapped) consist of anthropogenic disturbances. Rockfish (Sebastes spp.) and other bottomfish, such as greenlings and lingcod, prefer the hard rocky areas while flatfish and crustaceans can be found on the relatively flat unconsolidated sediment floors. The diversity of habitat types is higher in the Bay than in the offshore areas. While the offshore is primarily dominated by soft unconsolidated sediment, mainly sand, local areas of hard bedrock outcrops can be found in the shallow coastal parts of the coast along the northern side of the Golden Gate and north along the open coast. Designation of benthic marine habitats Two megahabitat codes were used to identify seafloor features within the region mapped. The megahabitat "Shelf (S)" has been applied to all polygons west of the Golden Gate,
20
while "Estuary (E)" has been applied to all polygons east of the Golden Gate. This was primarily a subjective demarcation between the two megahabitat types in an attempt to satisfy all interested parties. One argument for a more western demarcation suggests that benthic faunal species, characteristic of estuaries, occur west of the Golden Gate Bridge. Meanwhile, those in favor of the present demarcation cite the entrance area to the west of the bridge as exposed to the open ocean swell, characteristic of a "shelf" zone. Moreover, the Golden Gate Bridge marks the shortest distance across the Golden Gate Channel. Thus, we decided to leave the demarcation as the Golden Gate Bridge, and acknowledge that this is a compromise among several different interpretations. Please refer to Greene et al. (2007a) for more information regarding the Benthic Marine Potential Habitat Classification Scheme and the codes used to represent various seafloor types. Also, see the Classification Code Key in Appendix I for an expanded code. Metadata for all maps constructed in this work are listed in Appendix III. CMECS – Application of the Coastal and Marine Ecological Classification Standard (CMECS) to the NPS/GGNRA Habitat Mapping Exercise One of the tasks of this mapping exercise was to coordinate the habitat mapping code used in the construction of the GGNRA habitat map with the CMECS mapping code. A suggested modification of the CMECS code is shown in Table 1. Version III of the Coastal and Marine Ecological Classification Standard (CMECS) is a hierarchical classification scheme whose structure is based on five broad components: Water Column, Biotic Cover, Surface Geology, Sub-Benthic and GeoForm components. Based on terrestrial wetlands and uplands systems, this standard is constructed as a top-down hierarchy with salinity (Water Column) and biology (Biotic Cover) at its upper levels and geology (Surface Geology) and geomorphology (GeoForm) at its lower levels. This type of habitat classification system works best for describing terrestrial and coastal regions where biology dominates. We found CMECS to be a bit cumbersome to use in mapping in the deep marine waters as the absence of light precludes the domination of biology; geology, in the form of substrate types, and geomorphology are predominant. In addition, modern technology (e.g., multibeam echosounder bathymetry and backscatter systems) images the seafloor morphology and substrate best and provides a rapid methodology to map benthic habitats. Therefore, a bottom-up classification of the marine benthic habitats was made where the CMECS’ geoforms and surface geology components were used to define potential habitat types, skipping over the upper hierarchical levels. A draft of the table of CMECS III GeoForm Component Classifiers was provided by Becky Allee of NOAA’s Coastal Services Center for use in our study to compare CMECS with the classification system used in the NPS mapping effort (after Greene et al., 2007a). In addition, Becky Allee provided us with a draft table of classifiers to be used for the Benthic Cover Component, but since we did not have the biology at our disposal we were not able to incorporate the CMECS III Biotic Cover Component in our mapping effort.
21
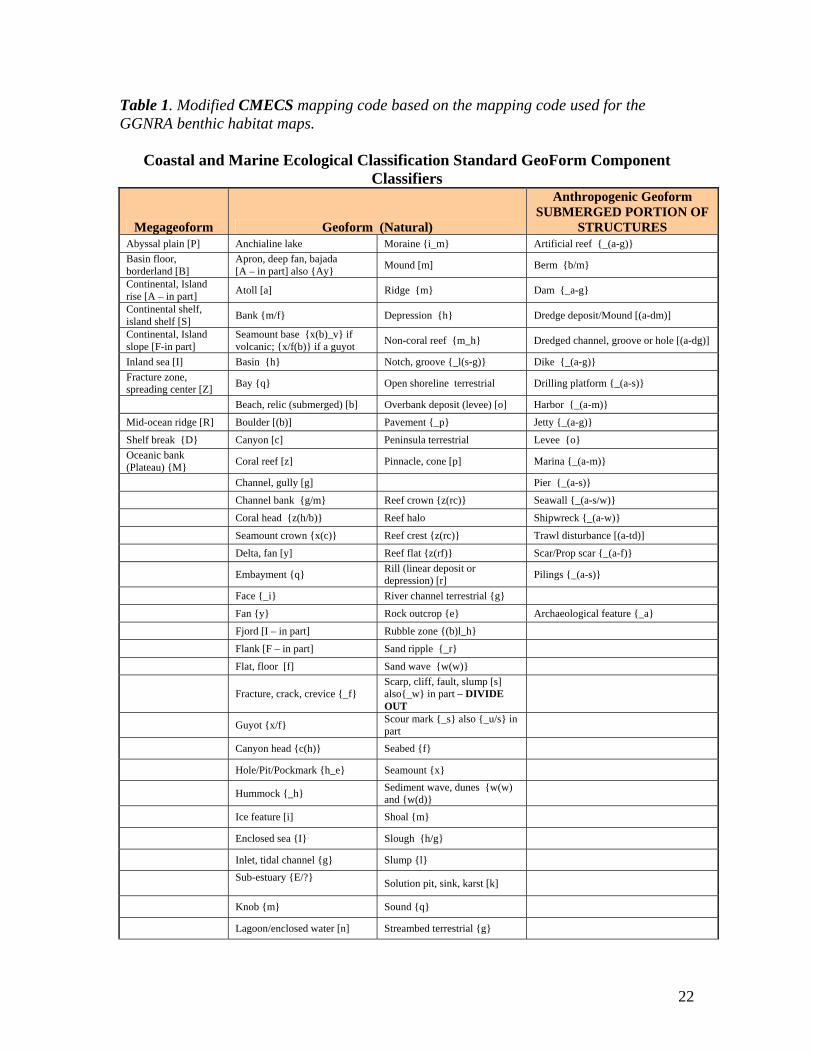
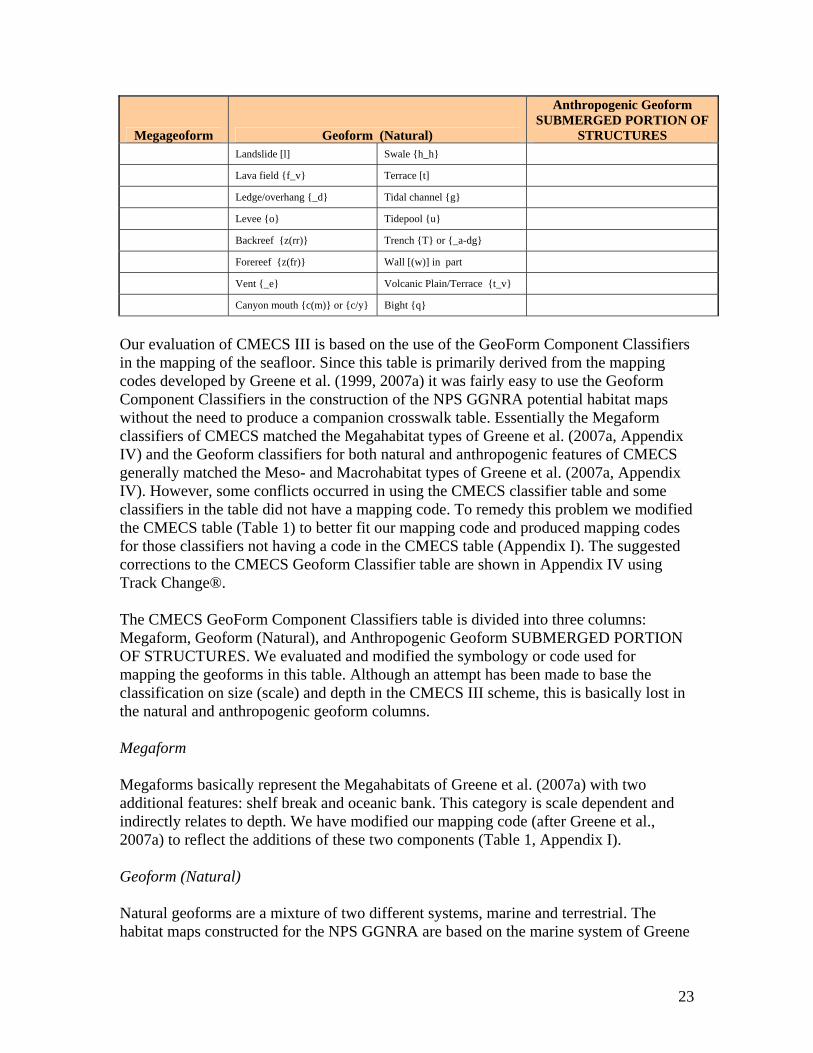
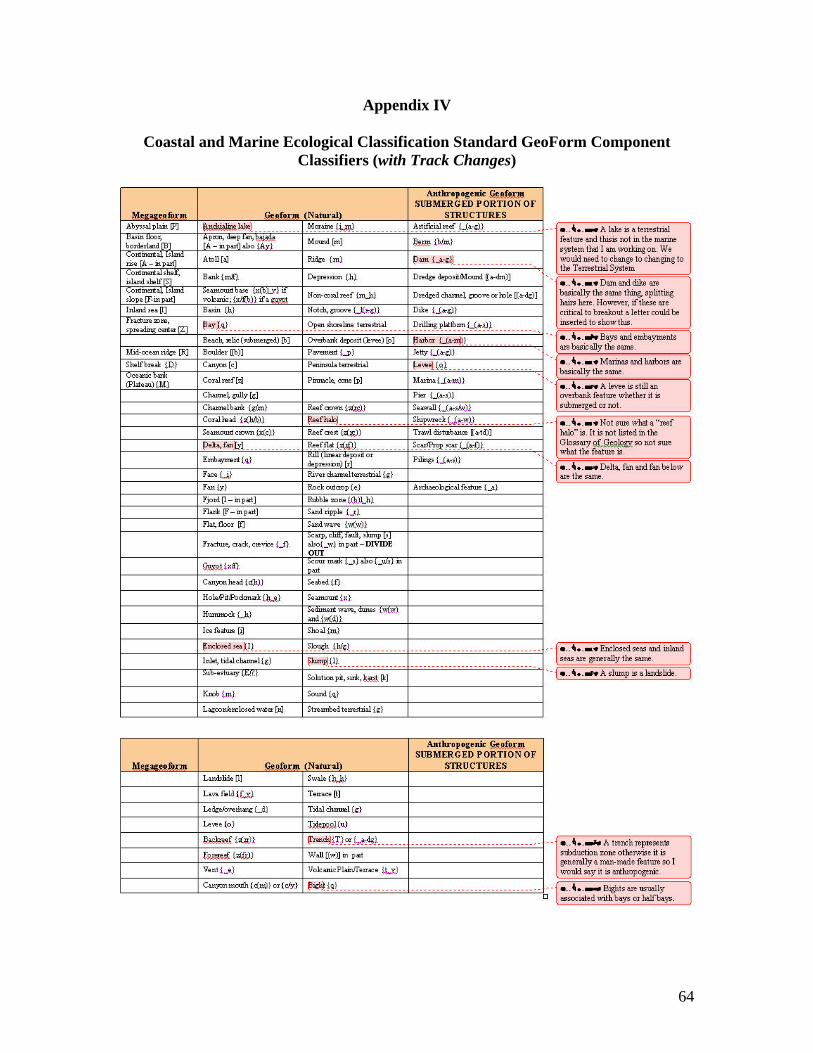
Table 1. Modified CMECS mapping code based on the mapping code used for the GGNRA benthic habitat maps.
Coastal and Marine Ecological Classification Standard GeoForm Component Classifiers
Our evaluation of CMECS III is based on the use of the GeoForm Component Classifiers in the mapping of the seafloor. Since this table is primarily derived from the mapping codes developed by Greene et al. (1999, 2007a) it was fairly easy to use the Geoform Component Classifiers in the construction of the NPS GGNRA potential habitat maps without the need to produce a companion crosswalk table. Essentially the Megaform classifiers of CMECS matched the Megahabitat types of Greene et al. (2007a, Appendix IV) and the Geoform classifiers for both natural and anthropogenic features of CMECS generally matched the Meso- and Macrohabitat types of Greene et al. (2007a, Appendix IV). However, some conflicts occurred in using the CMECS classifier table and some classifiers in the table did not have a mapping code. To remedy this problem we modified the CMECS table (Table 1) to better fit our mapping code and produced mapping codes for those classifiers not having a code in the CMECS table (Appendix I). The suggested corrections to the CMECS Geoform Classifier table are shown in Appendix IV using Track Change®. The CMECS GeoForm Component Classifiers table is divided into three columns: Megaform, Geoform (Natural), and Anthropogenic Geoform SUBMERGED PORTION OF STRUCTURES. We evaluated and modified the symbology or code used for mapping the geoforms in this table. Although an attempt has been made to base the classification on size (scale) and depth in the CMECS III scheme, this is basically lost in the natural and anthropogenic geoform columns. Megaform Megaforms basically represent the Megahabitats of Greene et al. (2007a) with two additional features: shelf break and oceanic bank. This category is scale dependent and indirectly relates to depth. We have modified our mapping code (after Greene et al., 2007a) to reflect the additions of these two components (Table 1, Appendix I). Geoform (Natural) Natural geoforms are a mixture of two different systems, marine and terrestrial. The habitat maps constructed for the NPS GGNRA are based on the marine system of Greene
23
et al. (2007a) and thus no mapping code was created for the terrestrial features listed in the GeoForm Component Classifiers table. Although not plentiful, the terrestrial classifiers in the table include Anchialine lake, Open shoreline, Peninsula, and River channel. These geoforms probably should be removed from the table as all other features listed, in both the Natural and Anthropogenic columns, are seafloor features. In addition, some duplication exists in this column. For example, Bays and Embayments, Enclosed seas and Inland seas, and Slump and Landslides are basically the same features and can be characterized using a common code. Anthropogenic Geoform Similar to the natural geoform column, duplications of features are found in this column. For example, Dams and Dikes, Levee and Overbank deposits, and Harbors and Marinas can be mapped using a common code. If it is deemed necessary to distinguish the differences between these two features a sub-code can be developed. Surface Geology The one critical component missing in the CMECS III GeoForm Component Classifiers table is substrate type and induration (hardness), a critical component characterizing seafloor types. This component is shown in the Surface Geology level of the Standard but no intuitive mapping codes are shown in a table that could be used to code out the substrate types. It appears that the surface geology classification is based on terrestrial habitat characterization and as such is not adaptable to the deep-water marine seafloor characterization. We think this is a critical weakness with CMECS III. Conclusions Five 1:24,000 scale map sheets and one high resolution 1:7,500 scale selected inset maps sheet have been constructed for this project. These sheets represent the MBES bathymetric images and backscatter or acoustic intensity data sets used to construct the geologic and habitat maps sheets. Habitat types are characterized as potential habitats that may represent true habitats for a particular species or assemblage of organisms but biological information is needed to confirm the true habitat types. Fifty-two distinct habitat types and 15 geologic units have been mapped. Of the potential habitat types mapped on the continental shelf, 94% of the total represents unconsolidated sediment substrate, with 14% of this substrate type being dynamic bedforms or sediment waves; the remaining 3% is hard substrate (2% mixed substrate, and 1% anthropogenic features; see Fig. 9). In San Francisco Bay, 74% of the total potential habitat or substrate type consists of unconsolidated sediment, with 49% being dynamic bedforms or sediment wave fields; the remaining 9% is anthropogenic disturbed substrate or structures, (5% hard substrate or rock outcrop, and 2% mixed, soft over hard, substrate type; see Fig. 10). San Francisco Bay, a major seaport fringed with high-density urban development, is a highly disturbed environment. Unnatural disturbances to bay and estuary floors impact
24
the ecology significantly in the form of altering benthic habitats that reduce the propagation and sustainability of demersal organisms and associated fisheries. The shallow bay or estuary margins, such as wetlands or tidelands, and associated flora, provide critical habitat for a multitude of fauna including birds, fishes, mammals and amphibians (Nichols et al., 1986). However, few investigations of the deeper parts of these inlets have been undertaken even though human disturbances of biotic and abiotic resources are increasing and altering natural processes (Greene et al., 2007b). One of the goals, therefore, of the maps constructed for this project is an attempt to identify potentially important benthic habitat types (especially for rockfish, lingcod, and other recreationally important fisheries habitats) that could merit protection to sustain the local natural ecology and economically important fisheries. Sediment Distribution A large volume of sediment released from the western foothills of the Sierra-Nevada Mountain Range as a result of hydraulic gold mining of placer deposits between 1850 and 1900 was swept into the Sacramento River and transported into San Francisco Bay (Gilbert, 1917; Carlson et al., 2000). This activity was environmentally destructive severely altering the local ecology as this large slug of sediment clogged the river, producing shallows and burying prime benthic habitat used for foraging and refuge by fishes and other organisms (Nichols et al., 1986). As the sediment slug worked its way through the Bay, sand and gravel was extracted providing a cheap source of aggregate for urban development for the Francisco Bay metropolitan region (Hanson Environmental, Inc., 2004). This sediment supply is now nearly exhausted and new sources are being sought to sustain a cheap, local supply of aggregate for building in the region (Greene et al., 2007b). The project maps show the areas where sediment is accumulating and scouring is occurring. A large volume of sediment is stored in the horseshoe bar offshore of the Golden Gate and may be supplying sediment to Ocean Beach and the coast to the south. Fisheries Habitats Commercial fishing in San Francisco Bay is generally limited to crab and shrimp fisheries. Sportfishers and charter boat operators have reported that although effort has declined in recent years, as many as 40 drift fishing charter boats may compete for position over or near bedrock knobs. Striped bass is the primary target species, but other demersal fishes such as rockfish, lingcod and halibut are also fished in these areas (Carlson et al., 2000). The project maps show various hard rock and boulder regions within the Bay and on the continental shelf, which appear to have a textural complexity or rugosity that would provide suitable habitat for rockfish and lingcod. These potential habitats are scattered around the peripheries of Alcatraz, Yuba Buena, and Angel Islands, at Red Rock in the north, in the vicinity of the Golden Gate, and along the northwestern margin of the Bay, around the submerged rocks of the bay and along the coast north of the Golden Gate. The prime potential habitat type for rockfish and lingcod are likely the greywacke (dirty
25
unsorted sandstone), shale and siltstone and bedded chert bedrock knobs of the Franciscan Complex and the blasted remnant rubble of angular boulders scattered across their crests and bases (Bailey et al., 1964; Schlocker, 1966; Carlson et al., 2000; Greene et al., 2007b). Foraging Habitats Sand wave fields may provide important foraging habitat for demersal fishes. Diet of juvenile lingcod in the San Juan Channel of the San Juan Islands region of Washington State was 100% sand lance (Ammodytes hexapterus; Beaudreau, 2005). Greene et al. (2007b) observed the presence of juvenile lingcod on the sand wave fields of the San Juan Channel,which led to an extensive study of the field. This observation suggested that perhaps the sand wave field is a foraging habitat for juvenile lingcod and the source for much of their early feeding. Similar schooling forage fish may be using the dynamic bedforms of the San Francisco Bay region for refuge and could be preyed on by lingcod, rockfish, salmon and birds, similar to the patterns observed in the San Juan Archipelago. The watershed surrounding San Francisco Bay provides important habitat for migratory fishes, such as salmon (Oncorhyncus spp.) and sturgeon (Acipenser spp.). Sturgeon reside in the Bay (Miller, 1972; Chapman et al., 1996), whereas salmon are oceanic, using the region seasonally for reproductive activities (Yoshiyama et al., 1998; Baxter et al., 1999). Adults of these species transit through San Francisco Bay in route to spawning and nursery grounds in the Sacramento and San Joaquin Rivers (Kohlhorst, 1976; Stevens and Miller, 1983). Benthic habitats that allow migrating fish to rest and conserve energy from the strong ebb tides of the Bay, such as the lee slopes of sand waves, may be important to the success of migrating fish reaching their spawning grounds (Greene et al., 2007b). The results of this work constitute the most comprehensive deep-water benthic habitat interpretation to date of a substantial portion of San Francisco Bay and the adjacent offshore continental shelf.
26
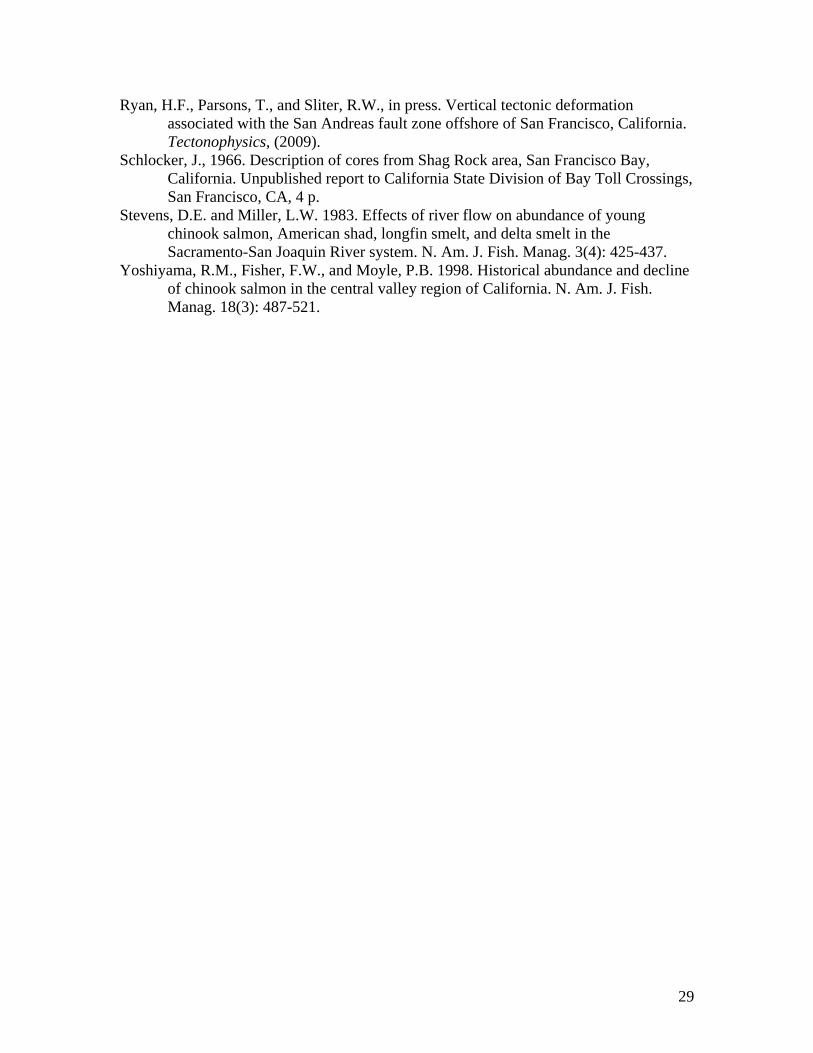
Literature Cited: Anthony, Ted, 2009. Stress map outlines recession’s stories. Article, Associated Press, Juneau Empire, May 18, 2009, p. A4. Atwater, B.F., Hedel, C.W., and Helley, E.J., 1977. Late Quaternary depositional history, Holocene sea-level changes, and vertical crustal movement, southern San Francisco Bay, California. U.S .Geological Survey Professional Paper 1014, U. S. Geological Survey, Denver, CO, 15 p. Atwater, B.F., 1979. Ancient processes at the site of southern San Francisco Bay – movement of the crust and changes in sea level. In: Conomos, T.J. (ed.), San Francisco Bay – The Urbanized Estuary: San Francisco, California. Pacific Division, American Association for the Advancement of Science, p. 31-45. Bailey, E.H., Irwin, W.P., and Jones, D.L., 1964. Franciscan and related rocks, and their significance in the geology of western California. California Division of Mines and Geology, Bulletin 183, California Division of Mines and Geology, Sacramento, CA, 177 p. Baxter, R., Hieb, K., DeLeon, S., Fleming, K., and Orsi, J. 1999. Report on the 1980-
1995 fish, shrimp, and crab sampling in the San Francisco Estuary, California. In: The interagency ecological program for the Sacramento-San Joaquin Estuary (Orsi, J., ed). California Department of Water Resources, Sacramento, CA.
Beaudreau, A., 2005. Diet and prey size spectrum of lingcod (Ophiodon elongates), a top predator in rock reefs of the San Juan Archipelago. In: 2005 Puget Sound Geogia Basin Research Conference, Abstracts and Biographies, Seattle, WA USA, P. 47. Carlson, P.R., Chin, J.L., and Wong, F.L., 2000. Bedrock knobs, San Francisco Bay: Do Navigation hazards outweigh other Environmental Problems? Envrionmental and Engineering Geoscience, v. VI, n. 1, p. 41-55. Cass, A.J., Beamish, R.J., and McFarlane, G.A. 1990. Lingcod (Ophiodon elongatus).
Can. J. Fish. Aquat. Sci. Spec. Pub. 109. 40 p. Chapman, F.A., Van Eenennaam, J.P., and Doroshov, S.I. 1996. The reproductive
condition of white sturgeon, Acipenser transmontanus, in San Francisco Bay, California. Fish. Bull. 94: 628-634.
Chin, J.L., Carlson, P.R., Wong, F.L., and Cacchone, D.A., 1998a. Multibeam data and socio-economic issues in west-central San Francisco Bay (CA). U.S. Geological Survey Open-File Report, 98-139: URL http;//sfbay.wr.usgs.gov/access/mapping/mulitibeam: U.S. Geological Survey, Denver, CO. Chin, J.L., Wong, F.L., and Carlson, P.R., 1998b. Anthropogenic impacts on the Bayfloor of west-central San Francisco Bay (CA). EOS American Geophysical Union Transactions v. 79, n. 45, p. F511-512. Chin, J.L., Wong, F.L., and Carlson, P.R., 2004. Shifting shoals and shattered rocks – How man has transformed the floor of west-central San Francisco Bay. U.S. Geological Survey Circular 1259, 30 p. Cruickshank, M.J., and Hess, H.D., 1975. Marine sand and gravel mining. Oceanus v. 19, n. 1, p. 32-44. Dow, G.R., 1973. Bay fill in San Francisco – A history of change. California Sate University San Francisco, San Francisco, CA, M.A. Thesis, 249 p.
27
Gilbert, G.K., 1917. Hydraulic mining debris in the Sierra-Nevada. U.S. Geological Survey Professional Paper 105, 154 p. Goldbeck, S., 1999. Mud put to good use: Oakland, California, California Coastal Conservancy, California Coast and Ocean, p. 17[URL http://www.coastalconservancy.ca.gov/coast&ocean/winter98/a06.htm] Graham, S.E., and Pike, R.J., 1997. Shaded-relief map of the San Francisco Bay region, California. U.S. Geological Survey Open-File Report 97-745B, 8 p. Greene, H.G., Yoklavich, M.M., Starr, R.M., O’Connell, V.M., Wakefield, W.W., Sullivan, J.E., McRea, Jr., J.E., and Cailliet, G.M., 1999. A classification scheme for deep water seafloor habitats. Oceanologica ACTA, v. 22, n. 6, p. 663-678. Greene, H.G., Bizzarro, J.J., Tilden, J.E., Lopez, H.L., and Erdey, M.D., 2005. The benefits and pitfalls of geographic information systems in marine benthic habitat mapping: in Wright, D.J. and Scholz, A.J., eds., Place Matters, Oregon State University Press, Portland, OR, 34-46. Greene, H.G., Bizzarro, J.J., O’Connell, V.M., and Brylinsky, C.K., 2007a. Construction of digital potential marine benthic habitat maps using a coded classification scheme and its application. In Todd, B.J. and Greene, H.G. (eds.), Mapping the Seafloor for Habitat Characterization, Canadian Geological Association Special Paper 47, p. 141-155. Greene, H.G., Vallier, T.V., Bizzarro, J.J., Watt, S., and Dieter, B.E., 2007b. Impacts of bay floor disturbances on benthic habitats in San Francisco Bay. In Todd, B.J. and Greene H.G., eds., Mapping the Seafloor for Habitat Characterization: Geological Association of Canada, Special Paper 47, p. 401-419. Hanson Environmental, Inc., 2004. Assessment and Evaluation of the effects of sand mining on aquatic habitat and fishery populations of central San Francisco Bay and the Sacramento-San Joaquin Estuary. Hanson Environmental, Inc. Environmental Impact Report, CD, San Francisco. Kohlhorst, D.W. 1976. Sturgeon spawning in the Sacramento River in 1973, as
determined by distribution of larvae. Calif. Fish Game. 62: 32-40. Love, M.S., Yoklavich, M., Thorsteinson, L., and Butler, J. 2002. The rockfishes of the
northeast Pacific. University of California Press, Berkeley, CA. p. 405. Miller, L.W. 1972. Migrations of sturgeon tagged in the Sacramento-San Joaquin
Estuary. Calif. Fish Game. 58: 102-106. Nichols, F.H., Cloern, J.E., Luoma, S.N., and Peterson, D.H., 1986. The modification of an estuary. Science, v. 231, p. 567-573. NOAA, 2004. San Francisco Bay Watershed Database and Mapping Project. National Oceanographic and Atmospheric Administration, Coastal Protection and Restoration Division, Release 1, CD Dataset, 2 CDs. Page, B.M., 1992. Tectonic setting of the San Francisco Bay region. In: Borchardt, G. and others (eds.), Proceedings of the Second Conference on Earthquake Hazards in the Eastern San Francisco Bay Area, California. California Division of Mines and Geology, Sacramento, CA, p. 1-7. Rubin, D.M., and McCulloch, D.S., 1979. The movement and equilibrium of bedforms in central San Francisco Bay. In: Conomos, T.J. (ed.), San Francisco Bay – The Urbanized Estuary: San Francisco California, Pacific Division, American Association for the Advancement of Science, p. 97-113.
Ryan, H.F., Parsons, T., and Sliter, R.W., in press. Vertical tectonic deformation associated with the San Andreas fault zone offshore of San Francisco, California. Tectonophysics, (2009). Schlocker, J., 1966. Description of cores from Shag Rock area, San Francisco Bay, California. Unpublished report to California State Division of Bay Toll Crossings, San Francisco, CA, 4 p. Stevens, D.E. and Miller, L.W. 1983. Effects of river flow on abundance of young
chinook salmon, American shad, longfin smelt, and delta smelt in the Sacramento-San Joaquin River system. N. Am. J. Fish. Manag. 3(4): 425-437.
Yoshiyama, R.M., Fisher, F.W., and Moyle, P.B. 1998. Historical abundance and decline of chinook salmon in the central valley region of California. N. Am. J. Fish. Manag. 18(3): 487-521.
29
Appendix I
Key to Habitat Mapping Code System – Marine Includes Tropical Sub-system
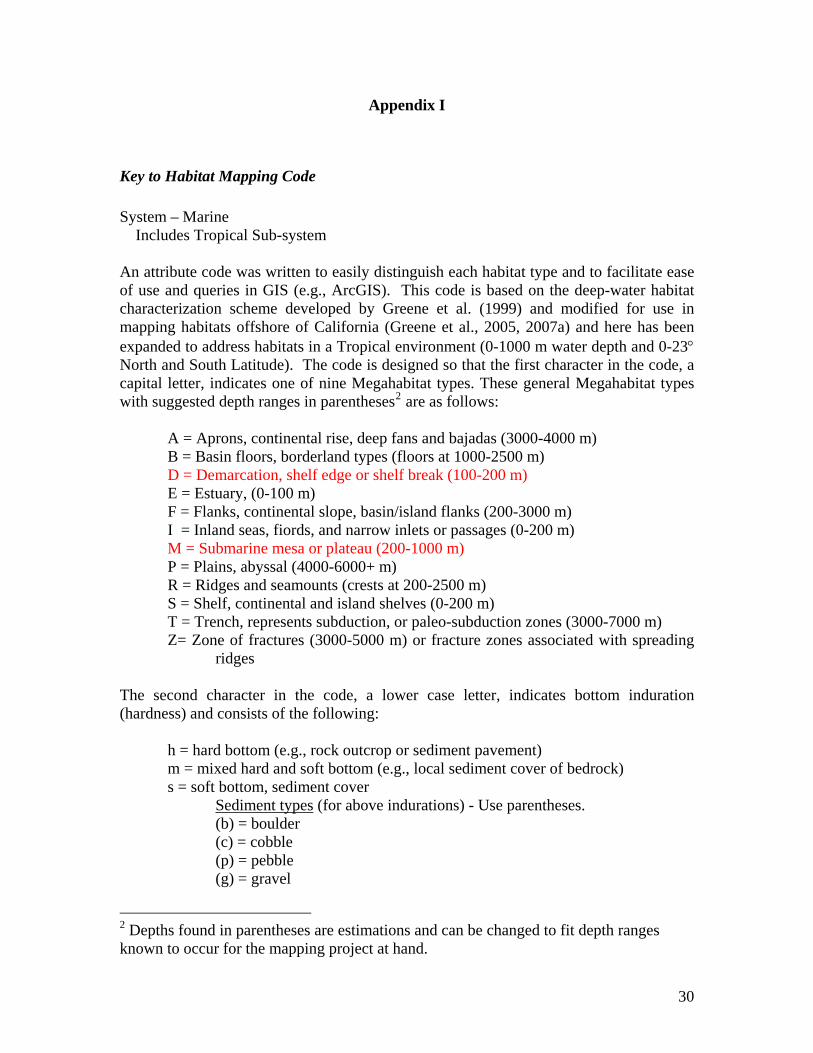
An attribute code was written to easily distinguish each habitat type and to facilitate ease of use and queries in GIS (e.g., ArcGIS). This code is based on the deep-water habitat characterization scheme developed by Greene et al. (1999) and modified for use in mapping habitats offshore of California (Greene et al., 2005, 2007a) and here has been expanded to address habitats in a Tropical environment (0-1000 m water depth and 0-23° North and South Latitude). The code is designed so that the first character in the code, a capital letter, indicates one of nine Megahabitat types. These general Megahabitat types with suggested depth ranges in parentheses2 are as follows:
A = Aprons, continental rise, deep fans and bajadas (3000-4000 m) B = Basin floors, borderland types (floors at 1000-2500 m) D = Demarcation, shelf edge or shelf break (100-200 m) E = Estuary, (0-100 m) F = Flanks, continental slope, basin/island flanks (200-3000 m) I = Inland seas, fiords, and narrow inlets or passages (0-200 m) M = Submarine mesa or plateau (200-1000 m) P = Plains, abyssal (4000-6000+ m) R = Ridges and seamounts (crests at 200-2500 m) S = Shelf, continental and island shelves (0-200 m) T = Trench, represents subduction, or paleo-subduction zones (3000-7000 m) Z= Zone of fractures (3000-5000 m) or fracture zones associated with spreading ridges
The second character in the code, a lower case letter, indicates bottom induration (hardness) and consists of the following: h = hard bottom (e.g., rock outcrop or sediment pavement)
m = mixed hard and soft bottom (e.g., local sediment cover of bedrock) s = soft bottom, sediment cover
2 Depths found in parentheses are estimations and can be changed to fit depth ranges known to occur for the mapping project at hand.
30
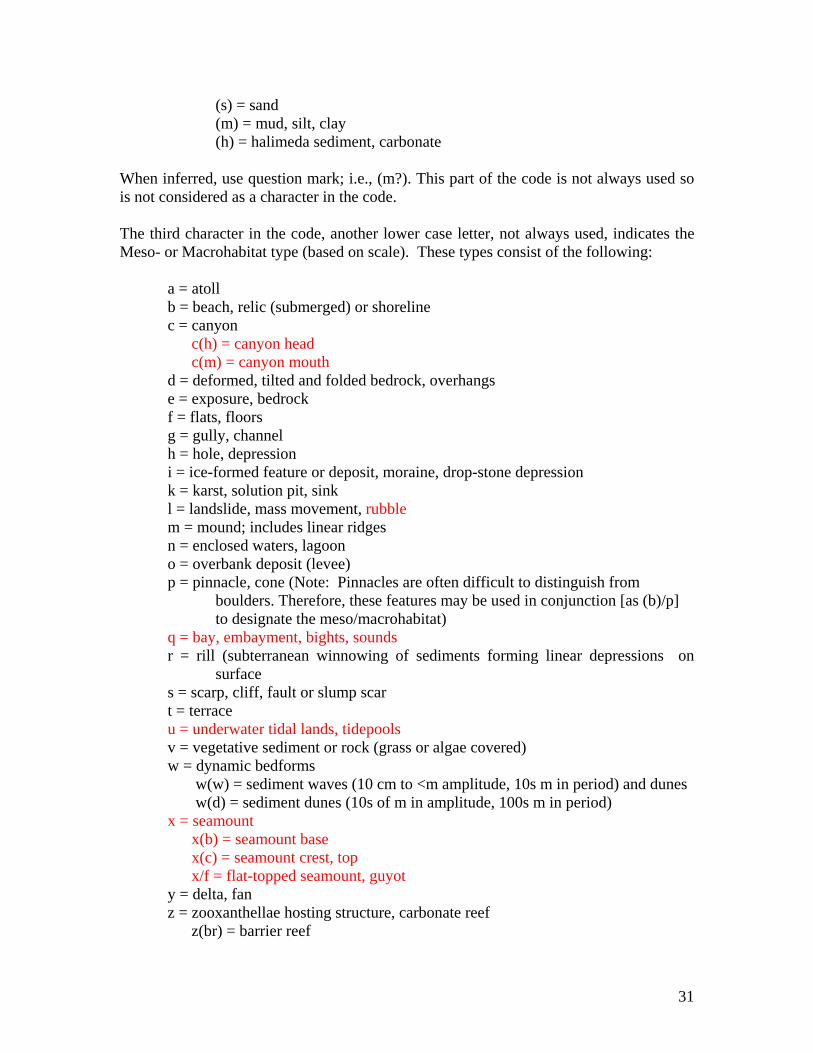
(s) = sand (m) = mud, silt, clay (h) = halimeda sediment, carbonate When inferred, use question mark; i.e., (m?). This part of the code is not always used so is not considered as a character in the code. The third character in the code, another lower case letter, not always used, indicates the Meso- or Macrohabitat type (based on scale). These types consist of the following: a = atoll b = beach, relic (submerged) or shoreline
c = canyon c(h) = canyon head c(m) = canyon mouth d = deformed, tilted and folded bedrock, overhangs e = exposure, bedrock f = flats, floors g = gully, channel h = hole, depression
i = ice-formed feature or deposit, moraine, drop-stone depression k = karst, solution pit, sink l = landslide, mass movement, rubble m = mound; includes linear ridges n = enclosed waters, lagoon o = overbank deposit (levee) p = pinnacle, cone (Note: Pinnacles are often difficult to distinguish from boulders. Therefore, these features may be used in conjunction [as (b)/p] to designate the meso/macrohabitat) q = bay, embayment, bights, sounds
r = rill (subterranean winnowing of sediments forming linear depressions on surface
s = scarp, cliff, fault or slump scar t = terrace u = underwater tidal lands, tidepools v = vegetative sediment or rock (grass or algae covered)
w = dynamic bedforms w(w) = sediment waves (10 cm to <m amplitude, 10s m in period) and dunes w(d) = sediment dunes (10s of m in amplitude, 100s m in period) x = seamount x(b) = seamount base x(c) = seamount crest, top x/f = flat-topped seamount, guyot
y = delta, fan z = zooxanthellae hosting structure, carbonate reef
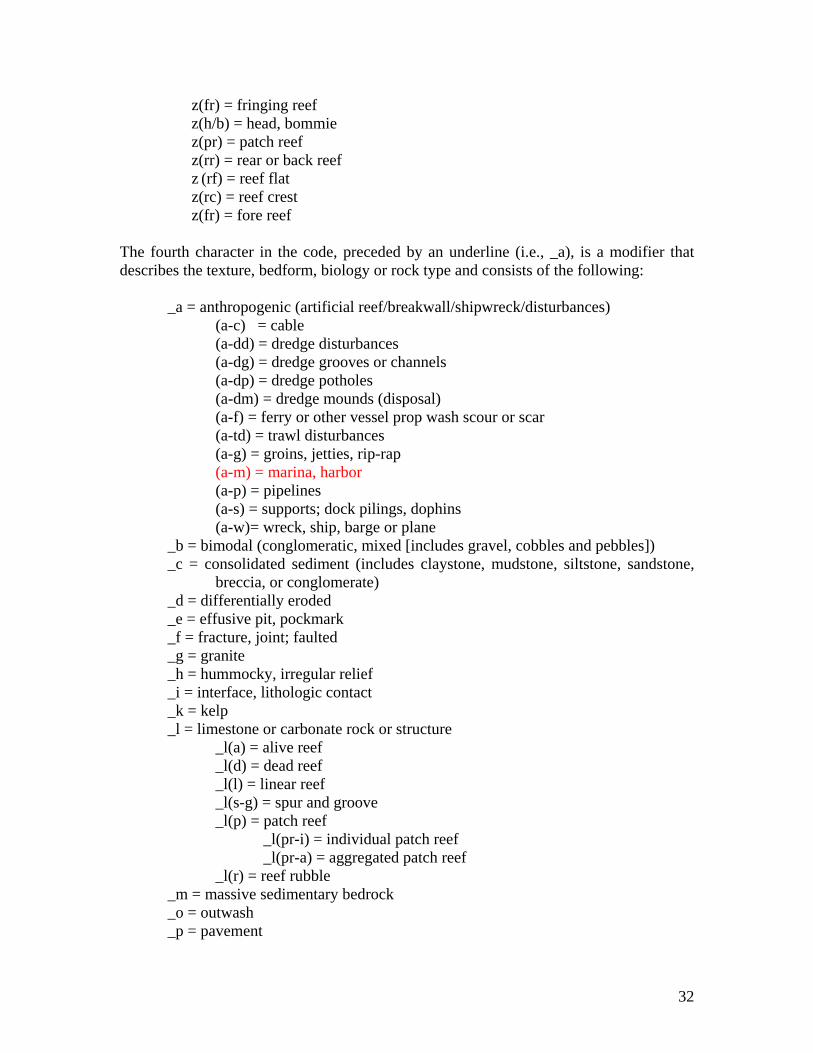
z(br) = barrier reef
31
z(fr) = fringing reef z(h/b) = head, bommie z(pr) = patch reef z(rr) = rear or back reef z (rf) = reef flat z(rc) = reef crest z(fr) = fore reef The fourth character in the code, preceded by an underline (i.e., _a), is a modifier that describes the texture, bedform, biology or rock type and consists of the following: _a = anthropogenic (artificial reef/breakwall/shipwreck/disturbances) (a-c) = cable (a-dd) = dredge disturbances (a-dg) = dredge grooves or channels (a-dp) = dredge potholes (a-dm) = dredge mounds (disposal) (a-f) = ferry or other vessel prop wash scour or scar (a-td) = trawl disturbances (a-g) = groins, jetties, rip-rap (a-m) = marina, harbor (a-p) = pipelines (a-s) = supports; dock pilings, dophins (a-w)= wreck, ship, barge or plane
_k = kelp _l = limestone or carbonate rock or structure _l(a) = alive reef _l(d) = dead reef _l(l) = linear reef _l(s-g) = spur and groove _l(p) = patch reef _l(pr-i) = individual patch reef _l(pr-a) = aggregated patch reef _l(r) = reef rubble _m = massive sedimentary bedrock _o = outwash _p = pavement
32
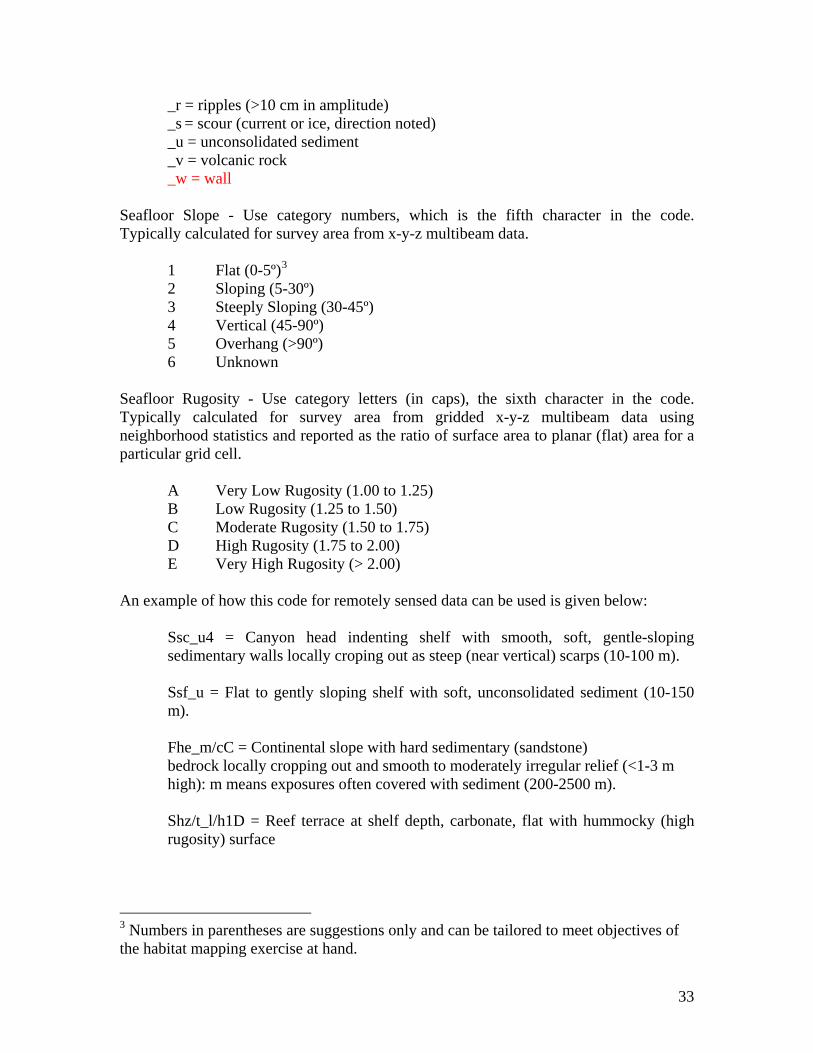
_r = ripples (>10 cm in amplitude) _s = scour (current or ice, direction noted)
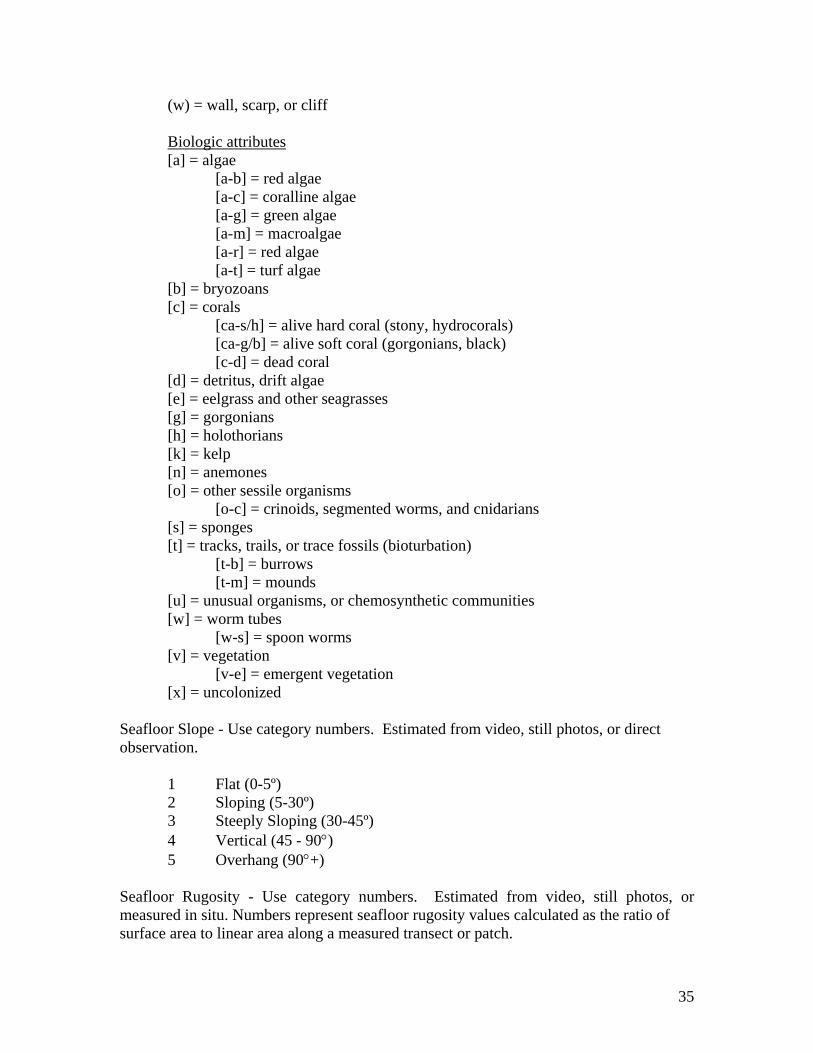
_u = unconsolidated sediment _v = volcanic rock _w = wall Seafloor Slope - Use category numbers, which is the fifth character in the code. Typically calculated for survey area from x-y-z multibeam data.
Seafloor Rugosity - Use category letters (in caps), the sixth character in the code. Typically calculated for survey area from gridded x-y-z multibeam data using neighborhood statistics and reported as the ratio of surface area to planar (flat) area for a particular grid cell.
A Very Low Rugosity (1.00 to 1.25) B Low Rugosity (1.25 to 1.50) C Moderate Rugosity (1.50 to 1.75) D High Rugosity (1.75 to 2.00) E Very High Rugosity (> 2.00) An example of how this code for remotely sensed data can be used is given below:
Ssc_u4 = Canyon head indenting shelf with smooth, soft, gentle-sloping sedimentary walls locally croping out as steep (near vertical) scarps (10-100 m). Ssf_u = Flat to gently sloping shelf with soft, unconsolidated sediment (10-150 m).
Fhe_m/cC = Continental slope with hard sedimentary (sandstone) bedrock locally cropping out and smooth to moderately irregular relief (<1-3 m high): m means exposures often covered with sediment (200-2500 m). Shz/t_l/h1D = Reef terrace at shelf depth, carbonate, flat with hummocky (high rugosity) surface
3 Numbers in parentheses are suggestions only and can be tailored to meet objectives of the habitat mapping exercise at hand.
33
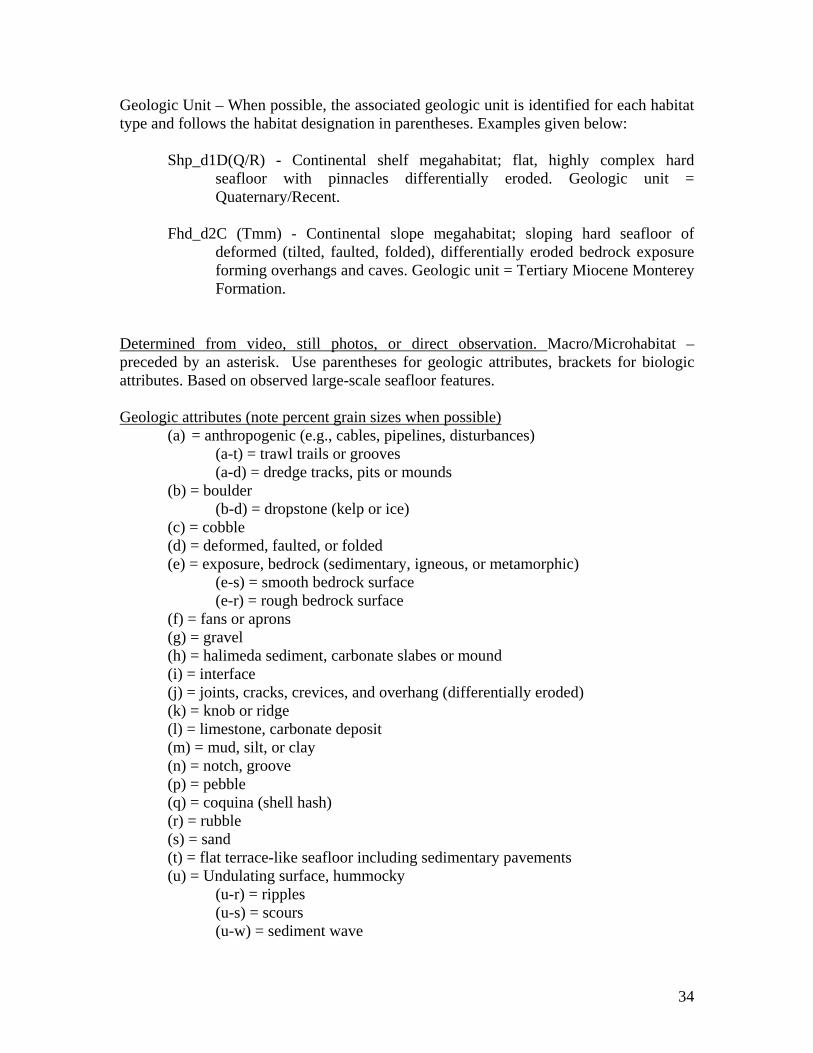
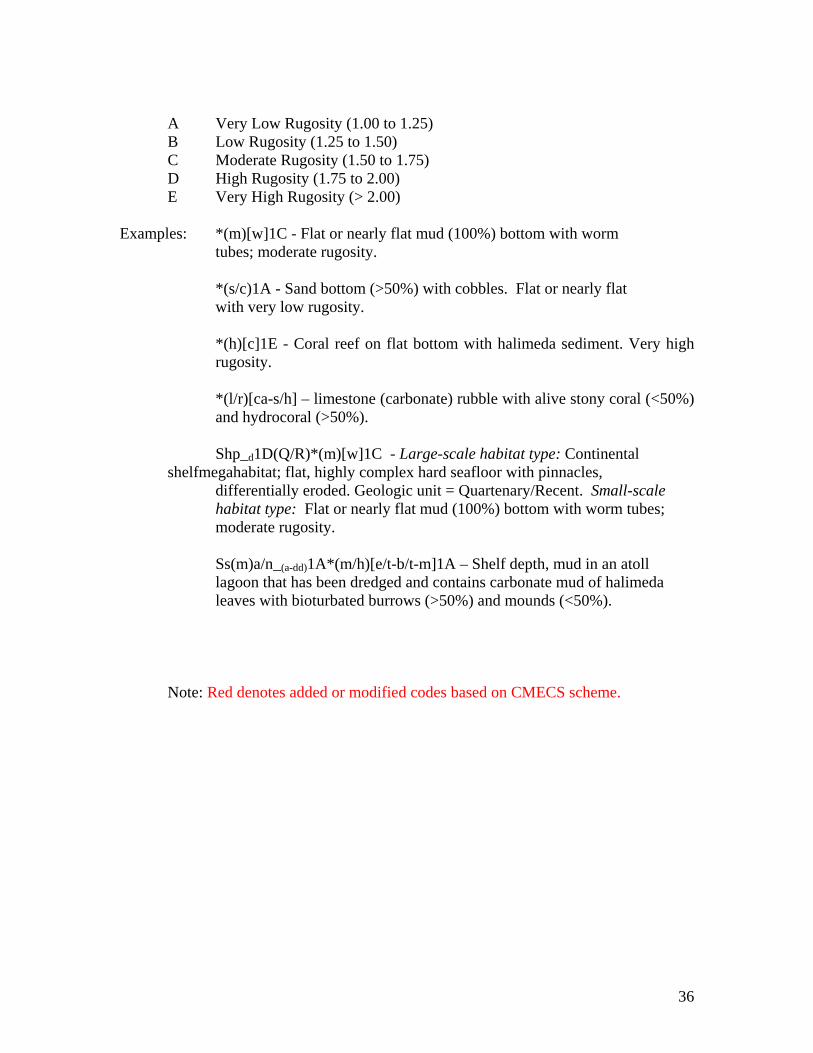
Geologic Unit – When possible, the associated geologic unit is identified for each habitat type and follows the habitat designation in parentheses. Examples given below:
Shp_d1D(Q/R) - Continental shelf megahabitat; flat, highly complex hard seafloor with pinnacles differentially eroded. Geologic unit = Quaternary/Recent.
Fhd_d2C (Tmm) - Continental slope megahabitat; sloping hard seafloor of deformed (tilted, faulted, folded), differentially eroded bedrock exposure forming overhangs and caves. Geologic unit = Tertiary Miocene Monterey Formation.
Determined from video, still photos, or direct observation. Macro/Microhabitat – preceded by an asterisk. Use parentheses for geologic attributes, brackets for biologic attributes. Based on observed large-scale seafloor features. Geologic attributes (note percent grain sizes when possible)
(a) = anthropogenic (e.g., cables, pipelines, disturbances) (a-t) = trawl trails or grooves (a-d) = dredge tracks, pits or mounds
Seafloor Rugosity - Use category numbers. Estimated from video, still photos, or measured in situ. Numbers represent seafloor rugosity values calculated as the ratio of surface area to linear area along a measured transect or patch.
35
A Very Low Rugosity (1.00 to 1.25)
B Low Rugosity (1.25 to 1.50) C Moderate Rugosity (1.50 to 1.75) D High Rugosity (1.75 to 2.00) E Very High Rugosity (> 2.00) Examples: *(m)[w]1C - Flat or nearly flat mud (100%) bottom with worm tubes; moderate rugosity. *(s/c)1A - Sand bottom (>50%) with cobbles. Flat or nearly flat
with very low rugosity.
*(h)[c]1E - Coral reef on flat bottom with halimeda sediment. Very high rugosity. *(l/r)[ca-s/h] – limestone (carbonate) rubble with alive stony coral (<50%) and hydrocoral (>50%).
shelfmegahabitat; flat, highly complex hard seafloor with pinnacles, differentially eroded. Geologic unit = Quartenary/Recent. Small-scale habitat type: Flat or nearly flat mud (100%) bottom with worm tubes; moderate rugosity.
Ss(m)a/n_(a-dd)1A*(m/h)[e/t-b/t-m]1A – Shelf depth, mud in an atoll
lagoon that has been dredged and contains carbonate mud of halimeda leaves with bioturbated burrows (>50%) and mounds (<50%).
Note: Red denotes added or modified codes based on CMECS scheme.
36
Appendix II
Tables Showing Area and Percentage of Potential Habitat Coverage
Total Mapped Area (km2) % of Total % of Megahabitat Shelf Estuary All Shelf Estuary All Shelf Estuary All habitats 316.71 34.94 351.64 90.1% 9.9% 100.0% 100.0% 100.0% Specific Habitats
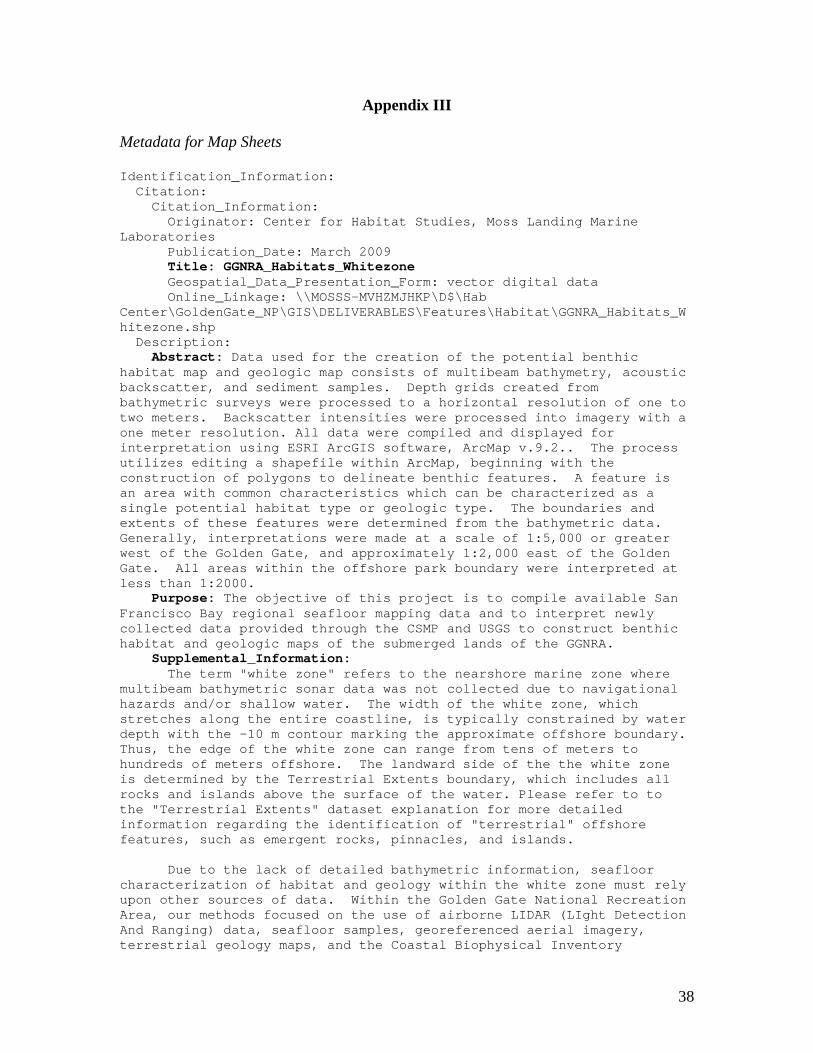
Metadata for Map Sheets Identification_Information: Citation: Citation_Information: Originator: Center for Habitat Studies, Moss Landing Marine Laboratories Publication_Date: March 2009 Title: GGNRA_Habitats_Whitezone Geospatial_Data_Presentation_Form: vector digital data Online_Linkage: \\MOSSS-MVHZMJHKP\D$\Hab Center\GoldenGate_NP\GIS\DELIVERABLES\Features\Habitat\GGNRA_Habitats_Whitezone.shp Description: Abstract: Data used for the creation of the potential benthic habitat map and geologic map consists of multibeam bathymetry, acoustic backscatter, and sediment samples. Depth grids created from bathymetric surveys were processed to a horizontal resolution of one to two meters. Backscatter intensities were processed into imagery with a one meter resolution. All data were compiled and displayed for interpretation using ESRI ArcGIS software, ArcMap v.9.2.. The process utilizes editing a shapefile within ArcMap, beginning with the construction of polygons to delineate benthic features. A feature is an area with common characteristics which can be characterized as a single potential habitat type or geologic type. The boundaries and extents of these features were determined from the bathymetric data. Generally, interpretations were made at a scale of 1:5,000 or greater west of the Golden Gate, and approximately 1:2,000 east of the Golden Gate. All areas within the offshore park boundary were interpreted at less than 1:2000. Purpose: The objective of this project is to compile available San Francisco Bay regional seafloor mapping data and to interpret newly collected data provided through the CSMP and USGS to construct benthic habitat and geologic maps of the submerged lands of the GGNRA. Supplemental_Information: The term "white zone" refers to the nearshore marine zone where multibeam bathymetric sonar data was not collected due to navigational hazards and/or shallow water. The width of the white zone, which stretches along the entire coastline, is typically constrained by water depth with the -10 m contour marking the approximate offshore boundary. Thus, the edge of the white zone can range from tens of meters to hundreds of meters offshore. The landward side of the the white zone is determined by the Terrestrial Extents boundary, which includes all rocks and islands above the surface of the water. Please refer to to the "Terrestrial Extents" dataset explanation for more detailed information regarding the identification of "terrestrial" offshore features, such as emergent rocks, pinnacles, and islands. Due to the lack of detailed bathymetric information, seafloor characterization of habitat and geology within the white zone must rely upon other sources of data. Within the Golden Gate National Recreation Area, our methods focused on the use of airborne LIDAR (LIght Detection And Ranging) data, seafloor samples, georeferenced aerial imagery, terrestrial geology maps, and the Coastal Biophysical Inventory
38
completed by the Pacific Coast Science and Learning Center in 2007 . The following describes how we used the various datasets to create a white zone benthic habitat and geology interpretation. Sun-illuminated DEM's were created from the LIDAR datasets (3.8 m resolution) and were primarily used for the assessment of coastal topography and large islands. LIDAR was not useful for interpreting any submerged features. See the metadata for the LIDAR dataset for more details. Approximately 15 seafloor grab samples, taken within the white zone, helped to establish seafloor induration (hardness). The most comprehensive dataset was the georeferenced aerial imagery, publicly available from the USGS Microsoft Terraserver, http://terraserver-usa.com/ (USGS/ Terraserver Urban Areas 30cm color photographs, NAD 83 datum, UTM projection). Images were downloaded at 0.5 m resolution. 223 image tiles, at approximately 0.4 x 0.5 km, were used to cover the entire length of the mapped coastline, including Alcatraz Is. The images were loaded into ArcMap v.9.2 and provided good detail of the coastline environment. See more information regarding the Terraserver images in the "Terrestrial Extents" metadata file. Useful information gathered from the image tiles was the presence, or absence, of frothy water tens of meters offshore areas where coastal bluffs and rocky headlands were apparent. Zones of turbulent water suggest the presence of barely submerged rocky features, such as boulders and/or bedrock pinnacles. Also apparent in the image tiles are steep, non-vegetated coastal bluffs which suggest recurring episodes of weathering and failure. The base of these bluffs, and likely the nearshore zones, are typically strewn with boulders and other landslide debris (colluvium), and would be characterized as such. Alongshore beach transects, completed in 2007 by the Pacific Coast Science & Learning Center in cooperation with the Point Reyes National Seashore and the Golden Gate National Recreation Area, were helpful in determining the dominant substrate in the subtidal environment. See document "CBI_Protocol_Draft_071708" for more information regarding this dataset. The CBI transects provided direct observations that could be correlated with visual analysis of the satellite images. Seafloor characterization of the white zone required extensive interpolation from existing datasets. For the onshore side, digital geological maps were overlayed (with transparency) above a hillshaded relief terrestrial DEM. Similarly, interpretive geology and habitat layers offshore were overlayed above a hillshaded relief bathymetric DEM. Features such as rocky promontories on the land side are connected to adjacent outcrops visible in the bathymetric data, using an arbitrary line drawn across the white zone, creating a polygon. Beaches are connected to areas of sandy seafloor in similar fashion. Where samples had been obtained, this data could be used to corroborate the interpolation and provide information used to attribute the interpretive polygon. In places, the aerial imagery showed water with sufficient clarity to reveal bathymetric features. Where a feature could be isolated in the imagery as a submerged feature, it was identified as
39
such and given geological and habitat-type characterization. (Where areas within the imagery could be observed as emergent or a part of the land not covered in water at the time the image was recorded, they were isolated and removed from the white zone area and not interpreted based on interpolated attributes. Instead these features were designated as terrestrial. See the Terrestrial Extents explanation for more detail on this process.) Geological attributes of submerged features visible in the aerial imagery were based on the geologic maps of the adjacent coastline. For areas of the coast interpreted as subunits of the Franciscan formation (greywacke, chert, metavolcanics, etc.), rocky areas of the white zone were generalized as Franciscan Formation (KJF) as there is little homogeneity within this lithology so only in-situ data would provide lithological determinations. The habitat type for these is hard, deformed sedimentary rock which is consolidated and differentially eroded, for both shelf and estuary regions (Shd_c/d and Ehd_c/d). For the most part, the interpolation of data for the white zone using the adjacent terrestrial and bathymetric datasets provides reasonably reliable divisions of the region into distinct features. Subsequent interpretation is entirely based on known characteristics of adjoining seafloor or terrestrial areas. Nothing is assumed about the white zone which is not found elsewhere in the data used for the map. However, all demarcations and boundaries for the interpolated area are completely subjective and arbitrary, and should be seen as approximate, queried, and uncertain. Time_Period_of_Content: Time_Period_Information: Single_Date/Time: Calendar_Date: March 2009 Currentness_Reference: ground condition Status: Progress: REQUIRED: The state of the data set. Maintenance_and_Update_Frequency: REQUIRED: The frequency with which changes and additions are made to the data set after the initial data set is completed. Spatial_Domain: Bounding_Coordinates: West_Bounding_Coordinate: -122.647851 East_Bounding_Coordinate: -122.419505 North_Bounding_Coordinate: 37.898496 South_Bounding_Coordinate: 37.565183 Keywords: Theme: Theme_Keyword_Thesaurus: REQUIRED: Reference to a formally registered thesaurus or a similar authoritative source of theme keywords. Theme_Keyword: Benthic marine habitat Theme_Keyword: Offshore geology Theme_Keyword: Seafloor mapping Theme_Keyword: GIS Theme_Keyword: Multibeam bathymetry Place: Place_Keyword: San Francisco Bay Place_Keyword: Golden Gate National Recreation Area
40
Access_Constraints: REQUIRED: Restrictions and legal prerequisites for accessing the data set. Use_Constraints: REQUIRED: Restrictions and legal prerequisites for using the data set after access is granted. Point_of_Contact: Contact_Information: Contact_Person_Primary: Contact_Person: H. Gary Greene Contact_Organization: Center for Habitat Studies, Moss Landing Marine Laboratories Contact_Position: Principal Investigator Contact_Address: Address_Type: mailing address Address: Center for Habitat Studies Address: 8272 Moss Landing Rd. City: Moss Landing State_or_Province: CA Postal_Code: 95039 Country: USA Contact_Voice_Telephone: 831-771-4141 Contact_Facsimile_Telephone: 831-633-7264 Contact_Electronic_Mail_Address: [email protected] Native_Data_Set_Environment: Microsoft Windows XP Version 5.1 (Build 2600) Service Pack 3; ESRI ArcCatalog 9.2.6.1500 Data_Quality_Information: Lineage: Process_Step: Process_Description: Dataset copied. Process_Step: Process_Description: Metadata imported. Source_Used_Citation_Abbreviation: C:\DOCUME~1\hab_2\LOCALS~1\Temp\xmlF.tmp Process_Date: 20090309 Process_Time: 11583100 Spatial_Data_Organization_Information: Direct_Spatial_Reference_Method: Vector Point_and_Vector_Object_Information: SDTS_Terms_Description: SDTS_Point_and_Vector_Object_Type: G-polygon Point_and_Vector_Object_Count: 307 Spatial_Reference_Information: Horizontal_Coordinate_System_Definition: Planar: Grid_Coordinate_System: Grid_Coordinate_System_Name: Universal Transverse Mercator Universal_Transverse_Mercator: UTM_Zone_Number: 10 Transverse_Mercator: Scale_Factor_at_Central_Meridian: 0.999600 Longitude_of_Central_Meridian: -123.000000 Latitude_of_Projection_Origin: 0.000000 False_Easting: 500000.000000 False_Northing: 0.000000 Planar_Coordinate_Information: Planar_Coordinate_Encoding_Method: coordinate pair Coordinate_Representation: Abscissa_Resolution: 0.000000
Address: 8272 Moss Landing Rd. Resource_Description: Downloadable Data Standard_Order_Process: Digital_Form: Digital_Transfer_Information: Transfer_Size: 0.734 Metadata_Reference_Information: Metadata_Date: 20090421 Metadata_Contact: Contact_Information: Contact_Person_Primary: Contact_Person: Charlie Endris Contact_Organization: Center for Habitat Studies, Moss Landing Marine Laboratories Contact_Organization_Primary: Contact_Organization: REQUIRED: The organization responsible for the metadata information. Contact_Person: REQUIRED: The person responsible for the metadata information. Contact_Position: Geologist/GIS Analyst Contact_Address: Address_Type: mailing address Address: Center for Habitat Studies, Moss Landing Marine Laboratories Address: 8272 Moss Landing Rd. City: Moss Landing State_or_Province: CA Postal_Code: 95039 Country: USA Contact_Voice_Telephone: 831-771-4141 Contact_Facsimile_Telephone: 831-633-7264 Contact_Electronic_Mail_Address: [email protected] Metadata_Standard_Name: FGDC Content Standards for Digital Geospatial Metadata Metadata_Standard_Version: FGDC-STD-001-1998 Metadata_Time_Convention: local time Metadata_Extensions: Online_Linkage: http://www.esri.com/metadata/esriprof80.html Profile_Name: ESRI Metadata Profile Identification_Information: Citation: Citation_Information: Originator: Center for Habitat Studies, Moss Landing Marine Laboratories Publication_Date: March 2009 Title: GGNRA_Habitats Geospatial_Data_Presentation_Form: vector digital data Online_Linkage: \\MOSSS-MVHZMJHKP\D$\Hab Center\GoldenGate_NP\GIS\DELIVERABLES\Features\Habitat\GGNRA_Habitats.shp Description: Abstract: Data used for the creation of the potential benthic habitat map and geologic map consists of multibeam bathymetry, acoustic
43
backscatter, and sediment samples. Depth grids created from bathymetric surveys were processed to a horizontal resolution of one to two meters. Backscatter intensities were processed into imagery with a one meter resolution. All data were compiled and displayed for interpretation using ESRI ArcGIS software, ArcMap v.9.2.. The process utilizes editing a shapefile within ArcMap, beginning with the construction of polygons to delineate benthic features. A feature is an area with common characteristics which can be characterized as a single potential habitat type or geologic type. The boundaries and extents of these features were determined from the bathymetric data. Generally, interpretations were made at a scale of 1:5,000 or greater west of the Golden Gate, and approximately 1:2,000 east of the Golden Gate. All areas within the offshore park boundary were interpreted at less than 1:2000. Purpose: The objective of this project is to compile available San Francisco Bay regional seafloor mapping data and to interpret newly collected data provided through the CSMP and USGS to construct benthic habitat and geologic maps of the submerged lands of the GGNRA. Supplemental_Information: Designation of benthic marine habitats: High resolution multibeam sonar data in the form of bathymetric depth grids (seafloor digital elevation models, referred to as the "bathymetry") were the primary data used in the interpretation of potential habitat types. Shaded relief imagery ("hillshade") allows for visualization of the terrain and interpretation of submarine landforms. Based on these hillshades, areas of rock were identified by their often sharply defined edges and high relative relief; these may be contiguous outcrops, isolated portions of outcrop protruding through sediment cover (pinnacles), or isolated boulders. Although these types of features can be confidently characterized as exposed rock, it is not uncommon to find areas within or around the rocky feature that appear to be covered by a thin veneer of sediment. These areas are identified as "mixed" induration, containing both rock and sediment. Broad areas of the seafloor lacking sharp and angular characteristics are considered to be sediment. Sedimentary features may contain erosional or depositional characteristics recognizable in the bathymetry, such as dynamic bedforms (dunes or sand waves). General morphologic features such as scours, mounds, and depressions were also identified using the hillshade relief imagery. The combination of acoustic backscatter data and "groundtruthed" sediment samples were used to delineate seafloor sediment types within areas identified as "soft (s)" induration. Initially, groundtruth data, in the form of grab sample descriptions and average grain size measurements, were categorized into four grain-size categories: mud (m), muddy sand (s/m), sand (s), and sandy gravel (s/g). Backscatter data was then classified into four intensity categories (low, med, high, very high) that are assumed to correspond to relative grain sizes. The aim was to develop an intensity classification of the seafloor that correlated with the data collected from the sediment samples. Thus, the combination of remotely observed data (acoustic backscatter) and directly observed data (sediment grab samples) translates to higher confidence in our ability to interpret broad areas of the seafloor. Nonetheless, we caution against using our sediment type interpretations as anything more than "best-guess" due to the following issues: characterization of contiguous sediment bodies is a difficult procedure since even small areas can exhibit a wide spectrum
44
of backscatter intensity values that lack distinct boundaries; backscatter intensity can be affected by depth, vegetation, water column conditions, and seafloor relief; and directly observed sediment data, in the form of sediment samples, represents a very small area relative to remotely observed data, requiring broad areas of interpolation. The methods previously outlined primarily pertain to the area east of the Golden Gate where the quality and resolution of backscatter data was very high. Unfortunately, the majority of backscatter data west of the Golden Gate was considered substandard for making confident interpretations of the sediment type. Two mega-habitat codes were used to identify seafloor features within the region mapped. The mega-habitat "Shelf (S)" has been applied to all polygons west of the Golden Gate, while "Estuary (E)" has been applied to all polygons east of the Golden Gate. This was primarily a subjective demarcation between the two mega-habitat types in an attempt to satisfy all interested parties. One argument for a more western demarcation suggests that benthic faunal species, characteristic of estuaries, do occur west of the Golden Gate Bridge. Meanwhile, those in favor of the present demarcation cite the entrance area to the west of the bridge as exposed to the open ocean swell, characteristic of a "shelf" zone. Moreover, the Golden Gate Bridge marks the shortest distance across the Golden Gate Channel. Thus, we decided to leave the demarcation as the Golden Gate Bridge, and acknowledge that this is only a compromise between several different interpretations. Please refer to Greene et al. (2007) for more information regarding the Benthic Marine Potential Habitat Classification Scheme and the codes used to represent various seafloor features. Time_Period_of_Content: Time_Period_Information: Single_Date/Time: Calendar_Date: March 2009 Currentness_Reference: ground condition Status: Progress: REQUIRED: The state of the data set. Maintenance_and_Update_Frequency: REQUIRED: The frequency with which changes and additions are made to the data set after the initial data set is completed. Spatial_Domain: Bounding_Coordinates: West_Bounding_Coordinate: -122.696084 East_Bounding_Coordinate: -122.414062 North_Bounding_Coordinate: 37.897134 South_Bounding_Coordinate: 37.540236 Keywords: Theme: Theme_Keyword_Thesaurus: REQUIRED: Reference to a formally registered thesaurus or a similar authoritative source of theme keywords. Theme_Keyword: Benthic marine habitat Theme_Keyword: Offshore geology Theme_Keyword: Seafloor mapping Theme_Keyword: GIS Theme_Keyword: Multibeam bathymetry Place:
45
Place_Keyword: San Francisco Bay Place_Keyword: Golden Gate National Recreation Area Access_Constraints: REQUIRED: Restrictions and legal prerequisites for accessing the data set. Use_Constraints: REQUIRED: Restrictions and legal prerequisites for using the data set after access is granted. Point_of_Contact: Contact_Information: Contact_Person_Primary: Contact_Person: H. Gary Greene Contact_Organization: Center for Habitat Studies, Moss Landing Marine Laboratories Contact_Position: Geologist/Principal Investigator Contact_Address: Address_Type: mailing address Address: Center for Habitat Studies Address: Moss Landing Marine Labs Address: 8272 Moss Landing Rd. City: Moss Landing State_or_Province: CA Postal_Code: 95039 Country: USA Contact_Voice_Telephone: 831-771-4141 Contact_Facsimile_Telephone: 831-633-7264 Contact_Electronic_Mail_Address: [email protected] Data_Set_Credit: Center for Habitat Studies, Moss Landing Marine Laboratories Native_Data_Set_Environment: Microsoft Windows XP Version 5.1 (Build 2600) Service Pack 3; ESRI ArcCatalog 9.2.6.1500 Data_Quality_Information: Lineage: Process_Step: Process_Description: Dataset copied. Spatial_Data_Organization_Information: Direct_Spatial_Reference_Method: Vector Point_and_Vector_Object_Information: SDTS_Terms_Description: SDTS_Point_and_Vector_Object_Type: G-polygon Point_and_Vector_Object_Count: 1862 Spatial_Reference_Information: Horizontal_Coordinate_System_Definition: Planar: Grid_Coordinate_System: Grid_Coordinate_System_Name: Universal Transverse Mercator Universal_Transverse_Mercator: UTM_Zone_Number: 10 Transverse_Mercator: Scale_Factor_at_Central_Meridian: 0.999600 Longitude_of_Central_Meridian: -123.000000 Latitude_of_Projection_Origin: 0.000000 False_Easting: 500000.000000 False_Northing: 0.000000 Planar_Coordinate_Information: Planar_Coordinate_Encoding_Method: coordinate pair Coordinate_Representation: Abscissa_Resolution: 0.000000 Ordinate_Resolution: 0.000000
Attribute_Label: MODIFIER Attribute_Definition: Modifier description Attribute: Attribute_Label: Hab_Desc Attribute_Definition: Habitat description Distribution_Information: Resource_Description: Downloadable Data Standard_Order_Process: Digital_Form: Digital_Transfer_Information: Transfer_Size: 6.117 Metadata_Reference_Information: Metadata_Date: 20090421 Metadata_Contact: Contact_Information: Contact_Organization_Primary: Contact_Organization: Center for Habitat Studies, Moss Landing Marine Laboratories Contact_Person: Charlie Endris Contact_Position: Geologist/GIS Analyst Contact_Address: Address_Type: mailing address Address: Center for Habitat Studies, Moss Landing Marine Laboratories Address: 8272 Moss Landing Rd. City: Moss Landing State_or_Province: CA Postal_Code: 95039 Country: USA Contact_Voice_Telephone: 831-771-4141 Contact_Facsimile_Telephone: 831-633-7264 Contact_Electronic_Mail_Address: [email protected] Metadata_Standard_Name: FGDC Content Standards for Digital Geospatial Metadata Metadata_Standard_Version: FGDC-STD-001-1998 Metadata_Time_Convention: local time Metadata_Extensions: Online_Linkage: http://www.esri.com/metadata/esriprof80.html Profile_Name: ESRI Metadata Profile Identification_Information: Citation: Citation_Information: Originator: REQUIRED: The name of an organization or individual that developed the data set. Publication_Date: REQUIRED: The date when the data set is published or otherwise made available for release. Title: GOGA coastline_high resolution Geospatial_Data_Presentation_Form: vector digital data Online_Linkage: \\MOSSS-MVHZMJHKP\D$\Hab Center\GoldenGate_NP\GIS\DELIVERABLES\Features\BoundaryFiles\GOGA coastline_high resolution.shp Description:
48
Abstract: This high resolution "coastline" file was created for two purposes: to delineate the boundary between area suitable for interpretation of potential marine benthic habitat vs. area considered terrestrial; to better define the offshore rocks and islands within the managed lands of the Golden Gate National Recreation Area. Aerial imagery, available from the USGS TerraServer, was downloaded at 25-50 cm resolution, and served as the basis for our best-guess interpretation of the demarcation between land and sea. This file does NOT represent an interpretation of the coastline at mean high water. Purpose: This high resolution "coastline" file was created for two purposes: to delineate the boundary between area suitable for interpretation of potential marine benthic habitat vs. area considered terrestrial; to better define the offshore rocks and islands within the managed lands of the Golden Gate National Recreation Area. Supplemental_Information: Existing coastline datasets were found to be inaccurate, of insufficient resolution, and/or outdated to support the high resolution interpretative characterization of marine benthic features for this project. An additional level of interpretation was required to delineate what would be considered terrestrial and therefore not subject to interpretation for potential marine habitat. In order to create a more accurate assessment of the nature and location of the shoreline position, aerial photographs were downloaded via the Terraserver website (a joint production of the USGS and Microsoft Corporation - see below). From these images, a line was drawn indicating the extent of the surface of the water at the time the photographic image was created. As such, there will be places in which wave or tide action at the time the photograph was taken has moved the extent of the water's surface farther off shore or onshore, away from a mean or modal position such as Mean High Water or Mean Low Water. The line was drawn simply to separate what was above water and what was below at the time the aerial photograph was taken. Further, there is no coordination made with tidal position, so the position of the coastline is inconsistent across the region with tidal position. Data To delineate and isolate terrestrial areas and the creation of a shapefile for this purpose, the 30cm resolution USGS High Resolution Orthoimages were the best suited and most accessible high-resolution data publically available for GIS utilization. The overall dataset can be found at: http://terraserver-usa.com/image.aspx?T=4&S=17&Z=10&X=21&Y=162&W=3 The images were collected 27 February 2004, and subsequently processed and orthorectified for correct geographic display. An explanation of the processing from the data description page associated with the USGS 'Urban Areas' set of aerial photographs: (http://gisdata.usgs.gov/edc_catalog/fetch_layer_docs.php?LayerName=Orthoimagery Urban Areas) "An orthoimage is remotely sensed image data in which displacement of features in the image caused by terrain relief and sensor orientation have been mathematically removed. Orthoimagery combines the image characteristics of a photograph with the geometric qualities of a map. For this dataset, the natural color orthoimages were produced at 0.3-meter pixel resolution (approximately 1-foot). The design accuracy is estimated not to exceed 3-meter diagonal RMSE (2.12m
49
RMSE in X or Y). Each orthoimage provides imagery for a 1500- by 1500-meter block on the ground. The projected coordinate system is UTM with a NAD83 datum. There is no image overlap been adjacent files. The naming convention is based on the U.S. National Grid (USNG), taking the coordinates of the SW corner of the orthoimage." Methods Once assembled onto a digital data project map in ArcGIS, a transparent editing layer was created for the entire mapping region, and overlain onto the aerial imagery. Using ArcEditor extension, the polygon was cut according to what areas of the imagery were dry land (including offshore boulders) and what areas appeared to be underwater. The final shapefile contains a main land polygon and many hundreds of offshore boulder and island polygons. These represent the non-marine areas of the map and therefore not interpreted for potential marine benthic habitat; terrestrial areas were interpreted for geological characteristics (see explanation and methodology for Terrestrial Geology layer). Interpretation was completed using a 1:2000 scale. At this scale there are several areas of boulders or highly complex areas where there is simply not enough resolution to encircle each feature that is not submerged. Usually these are areas under fifty meters in extent containing features generally not larger than five meters across. If the area is only separated from the adjacent shore land by wave run-up or swash, it was included with the main land polygon. Another potential inconsistency appears at the base of cliff areas where airborne-based imagery is not able to capture an oblique image, so there are only shadows or cropped terrestrial features such as the cliff edge. Correct positioning of the edge of the water for these areas is often ambiguous but the areas in question are less than five meters in lateral extent, so accuracy to ±5 meters is maintained and the line is constrained between sub-tidal and supra-tidal zones. Time_Period_of_Content: Time_Period_Information: Single_Date/Time: Calendar_Date: April 2009 Currentness_Reference: ground condition Status: Progress: REQUIRED: The state of the data set. Maintenance_and_Update_Frequency: REQUIRED: The frequency with which changes and additions are made to the data set after the initial data set is completed. Spatial_Domain: Bounding_Coordinates: West_Bounding_Coordinate: -123.108751 East_Bounding_Coordinate: -122.352316 North_Bounding_Coordinate: 37.929205 South_Bounding_Coordinate: 37.564846 Keywords: Theme: Theme_Keyword_Thesaurus: REQUIRED: Reference to a formally registered thesaurus or a similar authoritative source of theme keywords. Theme_Keyword: Coastline, GIS, Golden Gate National Recreation Area, orthoimagery
50
Access_Constraints: REQUIRED: Restrictions and legal prerequisites for accessing the data set. Use_Constraints: REQUIRED: Restrictions and legal prerequisites for using the data set after access is granted. Point_of_Contact: Contact_Information: Contact_Person_Primary: Contact_Person: H. Gary Greene Contact_Organization: Center for Habitat Studies, Moss Landing Marine Labs Contact_Position: Geologist/Principal Investigator Contact_Address: Address_Type: mailing address Address: Center for Habitat Studies, Moss Landing Marine Labs Address: 8272 Moss Landing Rd. City: Moss Landing State_or_Province: CA Postal_Code: 95039 Country: USA Contact_Voice_Telephone: 831-771-4141 Contact_Facsimile_Telephone: 831-633-7264 Contact_Electronic_Mail_Address: [email protected] Native_Data_Set_Environment: Microsoft Windows XP Version 5.1 (Build 2600) Service Pack 3; ESRI ArcCatalog 9.2.6.1500 Data_Quality_Information: Lineage: Process_Step: Process_Description: Dataset copied. Source_Used_Citation_Abbreviation: H:\Common_Files\NPS_HMP\GIS\Shapefiles\Coast\sf_fariscoastutm_polygon Process_Step: Process_Description: Dataset copied. Source_Used_Citation_Abbreviation: H:\Common_Files\NPS_HMP\GIS\Shapefiles\Coast\GGNRA_Coast_SatImageEdits Process_Step: Process_Description: Dataset copied. Source_Used_Citation_Abbreviation: H:\Common_Files\NPS_HMP\GIS\Shapefiles\Coast\GGNRA_Coast_CHSedits_Final Process_Step: Process_Description: Dataset copied. Source_Used_Citation_Abbreviation: H:\Common_Files\NPS_HMP\GIS\Shapefiles\Coast\GGNRA_Coast_CHSedits_Final2 Process_Step: Process_Description: Dataset copied. Source_Used_Citation_Abbreviation: V:\GIS\Shapefiles\Coast\Final_Coast_24k_extents Process_Step: Process_Description: Dataset copied. Source_Used_Citation_Abbreviation: D:\Hab Center\GoldenGate_NP\GIS\Shapefiles\Habitat\Final_Habitats\Final_Coast_24k_extents Process_Step: Process_Description: Dataset copied. Source_Used_Citation_Abbreviation: F:\Hab Center\GoldenGate_NP\GIS\Scratch\coast_union_Clip Process_Step:
Attribute_Label: area Attribute: Attribute_Label: TYPE Attribute: Attribute_Label: COUNTY Attribute: Attribute_Label: NAME Attribute: Attribute_Label: Area Distribution_Information: Resource_Description: Downloadable Data Standard_Order_Process: Digital_Form: Digital_Transfer_Information: Transfer_Size: 0.954 Metadata_Reference_Information: Metadata_Date: 20090421 Metadata_Contact: Contact_Information: Contact_Organization_Primary: Contact_Organization: Center for Habitat Studies, Moss Landing Marine Labs Contact_Person: Charlie Endris Contact_Position: GIS Analyst/ Geologist Contact_Address: Address_Type: mailing address Address: Center for Habitat Studies, Moss Landing Marine Labs Address: 8272 Moss Landing Rd. City: Moss Landing State_or_Province: CA Postal_Code: 95039 Country: USA Contact_Voice_Telephone: 831-771-4141 Contact_Facsimile_Telephone: 831-633-7264 Contact_Electronic_Mail_Address: [email protected] Metadata_Standard_Name: FGDC Content Standards for Digital Geospatial Metadata Metadata_Standard_Version: FGDC-STD-001-1998 Metadata_Time_Convention: local time Metadata_Extensions: Online_Linkage: http://www.esri.com/metadata/esriprof80.html Profile_Name: ESRI Metadata Profile Identification_Information: Citation: Citation_Information: Originator: Center for Habitat Studies, Moss Landing Marine Laboratories Publication_Date: March 2009 Title: OffshoreGeology_GGNRA Geospatial_Data_Presentation_Form: vector digital data Online_Linkage: \\MOSSS-MVHZMJHKP\D$\Hab Center\GoldenGate_NP\GIS\DELIVERABLES\Features\Geology\OffshoreGeology_GGNRA.shp
53
Description: Abstract: Data used for the creation of the potential benthic habitat map and geologic map consists of multibeam bathymetry, acoustic backscatter, and sediment samples. Depth grids created from bathymetric surveys were processed to a horizontal resolution of one to two meters. Backscatter intensities were processed into imagery with a one meter resolution. All data were compiled and displayed for interpretation using ESRI ArcGIS software, ArcMap v.9.2.. The process utilizes editing a shapefile within ArcMap, beginning with the construction of polygons to delineate benthic features. A feature is an area with common characteristics which can be characterized as a single potential habitat type or geologic type. The boundaries and extents of these features were determined from the bathymetric data. Generally, interpretations were made at a scale of 1:5,000 or greater west of the Golden Gate, and approximately 1:2,000 east of the Golden Gate. All areas within the offshore park boundary were interpreted at less than 1:2000. Purpose: The objective of this project is to compile available San Francisco Bay regional seafloor mapping data and to interpret newly collected data provided through the CSMP and USGS to construct benthic habitat and geologic maps of the submerged lands of the GGNRA. Supplemental_Information: Designation of offshore geologic features: Anthropogenic units were identified based on appearance in multibeam bathymetric hillshaded relief imagery, combined with information about known activities past and present occurring in the region. Shipping and extraction industry are the primary source of sedimentary features offshore ('a') while seawalls, structures, revetments, and outflow pipes are the primary types of hard features seen adjacent to shore ('ahs'). Quaternary units are identified as Quaternary (Holocene) in the table if they are known to still be actively evolving features. Bathymetric data used to create the geologic interpreation show differences in extent and sizes of 'mobile sediment depressions' ('Q(g)s'). Other units identified as Quaternary only are not demonstrably active using data and information available, but are likely not static. 'Q(g)s' is also used wherever sediment is identified as coarser than average based on acoustic reflectance properties as revealed in backscatter imagery. 'Qsed' refers to all areas of sediment which are acoustically uniform and morphologically smooth, flat, or featureless; no specifics can be attributed without in situ groundtruthing data. These data do exist in point locations, but the resolution of that information is too sparse to characterize these areas. Generally 'Qsed' areas are comprised of mud and sand with biogenic clasts interspersed; characterization beyond that is speculation. Tertiary bedded strata are identified at both the north and south ends of the interpreted area in the shelf areas west of the Golden Gate entrance. Identification of Pliocene Purisima ('Tp') and Miocene Monterey ('Tm') formations, as well as the unnamed Paleocene unit ('Tss'), is made by a combination of extending terrestrially mapped units offshore along known structural boundaries (faults) where bedding outcrops are identifiable. Differentiation between Monterey and Purisma formations offshore is possible due to the juxtaposition of their distinct bedding morphology across fault contacts (contacts which
54
reflect similar lithostratigraphic boundaries occurring elsewhere). The Purisma formation is more massively bedded and is generally less folded than the thinner, more tightly interleaved bedding of Monterey formation rocks, and this is evident in the multibeam imagery. 'TKu' is used where no other identifiable information can be interpreted from the acoustic imagery. Generally these are isolated boulders or pinnacles of bedrock protruding through sediment cover, but the rock type is generally unidentifiable without a specimen. When these features are located in the vicinity of mapped terrestrial and cross-shore landslides it may be possible to identify them as landslide debris. At several coastal localities, the 'TKu' designation is used where it is not possible to identify a rock type due to indistinct morphology as well as discontinuous or heterogeneous geological identifications of adjacent terrestrial units. This is especially true in the southern areas of the map where there exist both Tertiary sedimentary rocks and Cretaceous crystalline basement rocks. The Cretaceous crystalline basement rocks are granite or granodiorite and are characteristic of the Salinian tectonostratigraphic terrane, which is bound in this region by the San Andreas Fault Zone on the east and the San Gregorio Fault Zone on the west. The granitic rocks have a distinct cross-hatched, subrounded morphology which is identifiable in several outcrops along the San Mateo County coast ('Kgr'). Several outcrops are also located where granitic basement could be presumed to occur but lack the very distinctive morphology, so these features are given a questionable designation ('Kgr?'). North and east of the northwest-southeast trending San Andreas Fault Zone is the highly heterogenous metamorphic subduction complex known as the Franciscan Complex ('KJf'). A variety of protolith rock types, including greywacke, limestone, serpentinite, shale, basalt, and gabbro, were subjected to deep burial and metamorphism during plate subduction. The metamorphosed form of these as well as mélange units comprise the Franciscan complex and have been dated to both Jurassic and Cretaceous periods but were subsequently jumbled so the chronological association is illegible. As such, these are units are not differentiated for the offshore map. While terrestrial maps can confidently delineate each unit, to do so offshore is impossible without extensive in situ observation. However, based on the combination of terrestrial mapped information with accurately positioned faults offshore, it is possible to assign a Franciscan designation based on their location. Time_Period_of_Content: Time_Period_Information: Single_Date/Time: Calendar_Date: March 2009 Currentness_Reference: ground condition Status: Progress: REQUIRED: The state of the data set. Maintenance_and_Update_Frequency: REQUIRED: The frequency with which changes and additions are made to the data set after the initial data set is completed. Spatial_Domain: Bounding_Coordinates: West_Bounding_Coordinate: -122.696084
55
East_Bounding_Coordinate: -122.414062 North_Bounding_Coordinate: 37.897134 South_Bounding_Coordinate: 37.540236 Keywords: Theme: Theme_Keyword_Thesaurus: REQUIRED: Reference to a formally registered thesaurus or a similar authoritative source of theme keywords. Theme_Keyword: Benthic marine habitat Theme_Keyword: Offshore geology Theme_Keyword: Seafloor mapping Theme_Keyword: GIS Theme_Keyword: Multibeam bathymetry Place: Place_Keyword: San Francisco Bay Place_Keyword: Golden Gate National Recreation Area Access_Constraints: REQUIRED: Restrictions and legal prerequisites for accessing the data set. Use_Constraints: REQUIRED: Restrictions and legal prerequisites for using the data set after access is granted. Point_of_Contact: Contact_Information: Contact_Person_Primary: Contact_Person: H. Gary Greene Contact_Organization: Center for Habitat Studies, Moss Landing Marine Laboratories Contact_Position: Geologist/Principal Investigator Contact_Address: Address_Type: mailing address Address: Center for Habitat Studies Address: Moss Landing Marine Labs Address: 8272 Moss Landing Rd. City: Moss Landing State_or_Province: CA Postal_Code: 95039 Country: USA Contact_Voice_Telephone: 831-771-4141 Contact_Facsimile_Telephone: 831-633-7264 Contact_Electronic_Mail_Address: [email protected] Data_Set_Credit: Center for Habitat Studies, Moss Landing Marine Laboratories Native_Data_Set_Environment: Microsoft Windows XP Version 5.1 (Build 2600) Service Pack 3; ESRI ArcCatalog 9.2.6.1500 Data_Quality_Information: Lineage: Process_Step: Process_Description: Dataset copied. Process_Step: Process_Description: Metadata imported. Source_Used_Citation_Abbreviation: C:\DOCUME~1\hab_2\LOCALS~1\Temp\xml12.tmp Process_Date: 20090309 Process_Time: 12443100 Spatial_Data_Organization_Information: Direct_Spatial_Reference_Method: Vector Point_and_Vector_Object_Information: SDTS_Terms_Description:
Contact_Organization: Center for Habitat Studies, Moss Landing Marine Laboratories Contact_Person: Charlie Endris Contact_Position: Geologist/GIS Analyst Contact_Address: Address_Type: mailing address Address: Center for Habitat Studies, Moss Landing Marine Laboratories Address: 8272 Moss Landing Rd. City: Moss Landing State_or_Province: CA Postal_Code: 95039 Country: USA Contact_Voice_Telephone: 831-771-4141 Contact_Facsimile_Telephone: 831-633-7264 Contact_Electronic_Mail_Address: [email protected] Metadata_Standard_Name: FGDC Content Standards for Digital Geospatial Metadata Metadata_Standard_Version: FGDC-STD-001-1998 Metadata_Time_Convention: local time Metadata_Extensions: Online_Linkage: http://www.esri.com/metadata/esriprof80.html Profile_Name: ESRI Metadata Profile Identification_Information: Citation: Citation_Information: Originator: Center for Habitat Studies, Moss Landing Marine Laboratories Publication_Date: March 2009 Title: OffshoreGeology_Whitezone_GGNRA Geospatial_Data_Presentation_Form: vector digital data Online_Linkage: \\MOSSS-MVHZMJHKP\D$\Hab Center\GoldenGate_NP\GIS\DELIVERABLES\Features\Geology\OffshoreGeology_Whitezone_GGNRA.shp Description: Abstract: Data used for the creation of the potential benthic habitat map and geologic map consists of multibeam bathymetry, acoustic backscatter, and sediment samples. Depth grids created from bathymetric surveys were processed to a horizontal resolution of one to two meters. Backscatter intensities were processed into imagery with a one meter resolution. All data were compiled and displayed for interpretation using ESRI ArcGIS software, ArcMap v.9.2.. The process utilizes editing a shapefile within ArcMap, beginning with the construction of polygons to delineate benthic features. A feature is an area with common characteristics which can be characterized as a single potential habitat type or geologic type. The boundaries and extents of these features were determined from the bathymetric data. Generally, interpretations were made at a scale of 1:5,000 or greater west of the Golden Gate, and approximately 1:2,000 east of the Golden Gate. All areas within the offshore park boundary were interpreted at less than 1:2000. Purpose: The objective of this project is to compile available San Francisco Bay regional seafloor mapping data and to interpret newly
58
collected data provided through the CSMP and USGS to construct benthic habitat and geologic maps of the submerged lands of the GGNRA. Supplemental_Information: The term "white zone" refers to the nearshore marine zone where multibeam bathymetric sonar data was not collected due to navigational hazards and/or shallow water. The width of the white zone, which stretches along the entire coastline, is typically constrained by water depth with the -10 m contour marking the approximate offshore boundary. Thus, the edge of the white zone can range from tens of meters to hundreds of meters offshore. The landward side of the the white zone is determined by the Terrestrial Extents boundary, which includes all rocks and islands above the surface of the water. Please refer to to the "Terrestrial Extents" dataset explanation for more detailed information regarding the identification of "terrestrial" offshore features, such as emergent rocks, pinnacles, and islands. Due to the lack of detailed bathymetric information, seafloor characterization of habitat and geology within the white zone must rely upon other sources of data. Within the Golden Gate National Recreation Area, our methods focused on the use of airborne LIDAR (LIght Detection And Ranging) data, seafloor samples, georeferenced aerial imagery, terrestrial geology maps, and the Coastal Biophysical Inventory completed by the Pacific Coast Science and Learning Center in 2007 . The following describes how we used the various datasets to create a white zone benthic habitat and geology interpretation. Sun-illuminated DEM's were created from the LIDAR datasets (3.8 m resolution) and were primarily used for the assessment of coastal topography and large islands. LIDAR was not useful for interpreting any submerged features. See the metadata for the LIDAR dataset for more details. Approximately 15 seafloor grab samples, taken within the white zone, helped to establish seafloor induration (hardness). The most comprehensive dataset was the georeferenced aerial imagery, publicly available from the USGS Microsoft Terraserver, http://terraserver-usa.com/ (USGS/ Terraserver Urban Areas 30cm color photographs, NAD 83 datum, UTM projection). Images were downloaded at 0.5 m resolution. 223 image tiles, at approximately 0.4 x 0.5 km, were used to cover the entire length of the mapped coastline, including Alcatraz Is. The images were loaded into ArcMap v.9.2 and provided good detail of the coastline environment. See more information regarding the Terraserver images in the "Terrestrial Extents" metadata file. Useful information gathered from the image tiles was the presence, or absence, of frothy water tens of meters offshore areas where coastal bluffs and rocky headlands were apparent. Zones of turbulent water suggest the presence of barely submerged rocky features, such as boulders and/or bedrock pinnacles. Also apparent in the image tiles are steep, non-vegetated coastal bluffs which suggest recurring episodes of weathering and failure. The base of these bluffs, and likely the nearshore zones, are typically strewn with boulders and other landslide debris (colluvium), and would be characterized as such. Alongshore beach transects, completed in 2007 by the Pacific Coast Science & Learning Center in cooperation with the Point Reyes National Seashore and the Golden Gate National Recreation Area, were helpful in determining the dominant substrate in the subtidal
59
environment. See document "CBI_Protocol_Draft_071708" for more information regarding this dataset. The CBI transects provided direct observations that could be correlated with visual analysis of the satellite images. Seafloor characterization of the white zone required extensive interpolation from existing datasets. For the onshore side, digital geological maps were overlayed (with transparency) above a hillshaded relief terrestrial DEM. Similarly, interpretive geology and habitat layers offshore were overlayed above a hillshaded relief bathymetric DEM. Features such as rocky promontories on the land side are connected to adjacent outcrops visible in the bathymetric data, using an arbitrary line drawn across the white zone, creating a polygon. Beaches are connected to areas of sandy seafloor in similar fashion. Where samples had been obtained, this data could be used to corroborate the interpolation and provide information used to attribute the interpretive polygon. In places, the aerial imagery showed water with sufficient clarity to reveal bathymetric features. Where a feature could be isolated in the imagery as a submerged feature, it was identified as such and given geological and habitat-type characterization. (Where areas within the imagery could be observed as emergent or a part of the land not covered in water at the time the image was recorded, they were isolated and removed from the white zone area and not interpreted based on interpolated attributes. Instead these features were designated as terrestrial. See the Terrestrial Extents explanation for more detail on this process.) Geological attributes of submerged features visible in the aerial imagery were based on the geologic maps of the adjacent coastline. For areas of the coast interpreted as subunits of the Franciscan formation (greywacke, chert, metavolcanics, etc.), rocky areas of the white zone were generalized as Franciscan Formation (KJF) as there is little homogeneity within this lithology so only in-situ data would provide lithological determinations. The habitat type for these is hard, deformed sedimentary rock which is consolidated and differentially eroded, for both shelf and estuary regions (Shd_c/d and Ehd_c/d). For the most part, the interpolation of data for the white zone using the adjacent terrestrial and bathymetric datasets provides reasonably reliable divisions of the region into distinct features. Subsequent interpretation is entirely based on known characteristics of adjoining seafloor or terrestrial areas. Nothing is assumed about the white zone which is not found elsewhere in the data used for the map. However, all demarcations and boundaries for the interpolated area are completely subjective and arbitrary, and should be seen as approximate, queried, and uncertain. Time_Period_of_Content: Time_Period_Information: Single_Date/Time: Calendar_Date: March 2009 Currentness_Reference: ground condition Status: Progress: REQUIRED: The state of the data set.
60
Maintenance_and_Update_Frequency: REQUIRED: The frequency with which changes and additions are made to the data set after the initial data set is completed. Spatial_Domain: Bounding_Coordinates: West_Bounding_Coordinate: -122.647851 East_Bounding_Coordinate: -122.419505 North_Bounding_Coordinate: 37.898496 South_Bounding_Coordinate: 37.565183 Keywords: Theme: Theme_Keyword_Thesaurus: REQUIRED: Reference to a formally registered thesaurus or a similar authoritative source of theme keywords. Theme_Keyword: Benthic marine habitat Theme_Keyword: Offshore geology Theme_Keyword: Seafloor mapping Theme_Keyword: GIS Theme_Keyword: Multibeam bathymetry Place: Place_Keyword: San Francisco Bay Place_Keyword: Golden Gate National Recreation Area Access_Constraints: REQUIRED: Restrictions and legal prerequisites for accessing the data set. Use_Constraints: REQUIRED: Restrictions and legal prerequisites for using the data set after access is granted. Point_of_Contact: Contact_Information: Contact_Person_Primary: Contact_Person: H. Gary Greene Contact_Organization: Center for Habitat Studies, Moss Landing Marine Laboratories Contact_Position: Principal Investigator Contact_Address: Address_Type: mailing address Address: Center for Habitat Studies Address: 8272 Moss Landing Rd. City: Moss Landing State_or_Province: CA Postal_Code: 95039 Country: USA Contact_Voice_Telephone: 831-771-4141 Contact_Facsimile_Telephone: 831-633-7264 Contact_Electronic_Mail_Address: [email protected] Native_Data_Set_Environment: Microsoft Windows XP Version 5.1 (Build 2600) Service Pack 3; ESRI ArcCatalog 9.2.6.1500 Data_Quality_Information: Lineage: Process_Step: Process_Description: Dataset copied. Spatial_Data_Organization_Information: Direct_Spatial_Reference_Method: Vector Point_and_Vector_Object_Information: SDTS_Terms_Description: SDTS_Point_and_Vector_Object_Type: G-polygon Point_and_Vector_Object_Count: 236 Spatial_Reference_Information: