BEST PRACTICES FOR MODELING AND SIMULATION OF CO 2 STORAGE Plains CO2 Reduction (PCOR) Partnership Phase III Task 9 – Deliverable D69 Prepared for: William W. Aljoe National Energy Technology Laboratory U.S. Department of Energy 626 Cochrans Mill Road PO Box 10940 Pittsburgh, PA 15236-0940 Cooperative Agreement No. DE-FC26-05NT42592 Prepared by: Nicholas W. Bosshart Lawrence J. Pekot Neil Wildgust Charlie D. Gorecki José A. Torres Lu Jin Jun Ge Tao Jiang Loreal V. Heebink Marc D. Kurz Chantsalmaa Dalkhaa Wesley D. Peck Shaughn A. Burnison Energy & Environmental Research Center University of North Dakota 15 North 23rd Street, Stop 9018 Grand Forks, ND 58202-9018 May 2017 Revised March 2018 2018-EERC-03-13 Approved
Transcript
BEST PRACTICES FOR MODELING AND SIMULATION OF CO2 STORAGE Plains CO2 Reduction (PCOR) Partnership Phase III Task 9 – Deliverable D69 Prepared for: William W. Aljoe National Energy Technology Laboratory U.S. Department of Energy 626 Cochrans Mill Road PO Box 10940 Pittsburgh, PA 15236-0940 Cooperative Agreement No. DE-FC26-05NT42592
Prepared by:
Nicholas W. Bosshart Lawrence J. Pekot
Neil Wildgust Charlie D. Gorecki
José A. Torres Lu Jin
Jun Ge Tao Jiang
Loreal V. Heebink Marc D. Kurz
Chantsalmaa Dalkhaa Wesley D. Peck
Shaughn A. Burnison
Energy & Environmental Research Center University of North Dakota
15 North 23rd Street, Stop 9018 Grand Forks, ND 58202-9018
May 2017
Revised March 2018 2018-EERC-03-13 Approved
EERC DISCLAIMER LEGAL NOTICE This research report was prepared by the Energy & Environmental Research Center (EERC), an agency of the University of North Dakota, as an account of work sponsored by the U.S. Department of Energy (DOE) National Energy Technology Laboratory (NETL). Because of the research nature of the work performed, neither the EERC nor any of its employees makes any warranty, express or implied, or assumes any legal liability or responsibility for the accuracy, completeness, or usefulness of any information, apparatus, product, or process disclosed or represents that its use would not infringe privately owned rights. Reference herein to any specific commercial product, process, or service by trade name, trademark, manufacturer, or otherwise does not necessarily constitute or imply its endorsement or recommendation by the EERC. ACKNOWLEDGMENT This material is based upon work supported by DOE NETL under Award Number DE-FC26-05NT42592. DOE DISCLAIMER This report was prepared as an account of work sponsored by an agency of the United States Government. Neither the United States Government, nor any agency thereof, nor any of their employees, makes any warranty, express or implied, or assumes any legal liability or responsibility for the accuracy, completeness, or usefulness of any information, apparatus, product, or process disclosed, or represents that its use would not infringe privately owned rights. Reference herein to any specific commercial product, process, or service by trade name, trademark, manufacturer, or otherwise does not necessarily constitute or imply its endorsement, recommendation, or favoring by the United States Government or any agency thereof. The views and opinions of authors expressed herein do not necessarily state or reflect those of the United States Government or any agency thereof.
i
TABLE OF CONTENTS LIST OF FIGURES ........................................................................................................................ ii LIST OF TABLES ......................................................................................................................... iii EXECUTIVE SUMMARY ........................................................................................................... iv 1.0 INTRODUCTION ................................................................................................................. 1 2.0 GEOLOGIC STORAGE ....................................................................................................... 2 3.0 PCOR PARTNERSHIP AMA .............................................................................................. 3 4.0 MODELING AND SIMULATION OVERVIEW ................................................................ 5
4.1 Project Definition ......................................................................................................... 5 4.2 Modeling and Simulation Workflows ......................................................................... 6 4.3 Model Development .................................................................................................... 8
4.4 Simulating CO2 Storage ............................................................................................... 9 5.0 BEST PRACTICES AND LESSONS LEARNED ............................................................. 11
5.1 Model Extent and Grid Cell Dimensions................................................................... 11 5.2 Data Considerations: Seismic .................................................................................... 13 5.3 Property Distribution and Uncertainty Analysis ........................................................ 18 5.4 Simulation Design and Forecasting for CO2 Storage ................................................ 22
5.4.1 Simulating CO2 Injection .............................................................................. 22 5.4.2 CO2 Trapping Mechanisms and Determining the Fate of Injected CO2 ....... 24
6.0 STATE OF BEST PRACTICE ........................................................................................... 37
6.1 Modeling .................................................................................................................... 37 6.2 Simulation .................................................................................................................. 37 6.3 Summary of Modeling and Simulation Lessons Learned .......................................... 38
LIST OF FIGURES 1 The PCOR Partnership region ............................................................................................... 1 2 PCOR Partnership AMA for CO2 storage project development ........................................... 3 3 General relationship between cell size and simulated CO2 injection rate ........................... 12 4 Seismic amplitude summation map for a thin, clastic reservoir ......................................... 16 5 4-D difference root mean square amplitude map ................................................................ 17 6 Schematic vertical section showing probabilistic structural surfaces created from
structural uncertainty analysis ............................................................................................. 19 7 Multiple rock-type distributions for an eolian sandstone reservoir with interdune
carbonates, to address uncertainty in facies proportions and connectivity ......................... 20 8 Low-, mid-, and high-case porosity distributions created to address uncertainty in
petrophysical property distributions .................................................................................... 21 9 Conceptual increase of CO2 trapping strength with time .................................................... 25 10 Gas per area maps developed from numerical simulation at different time steps ............... 28 11 Relative permeability curves for CO2 in the drainage and imbibition processes
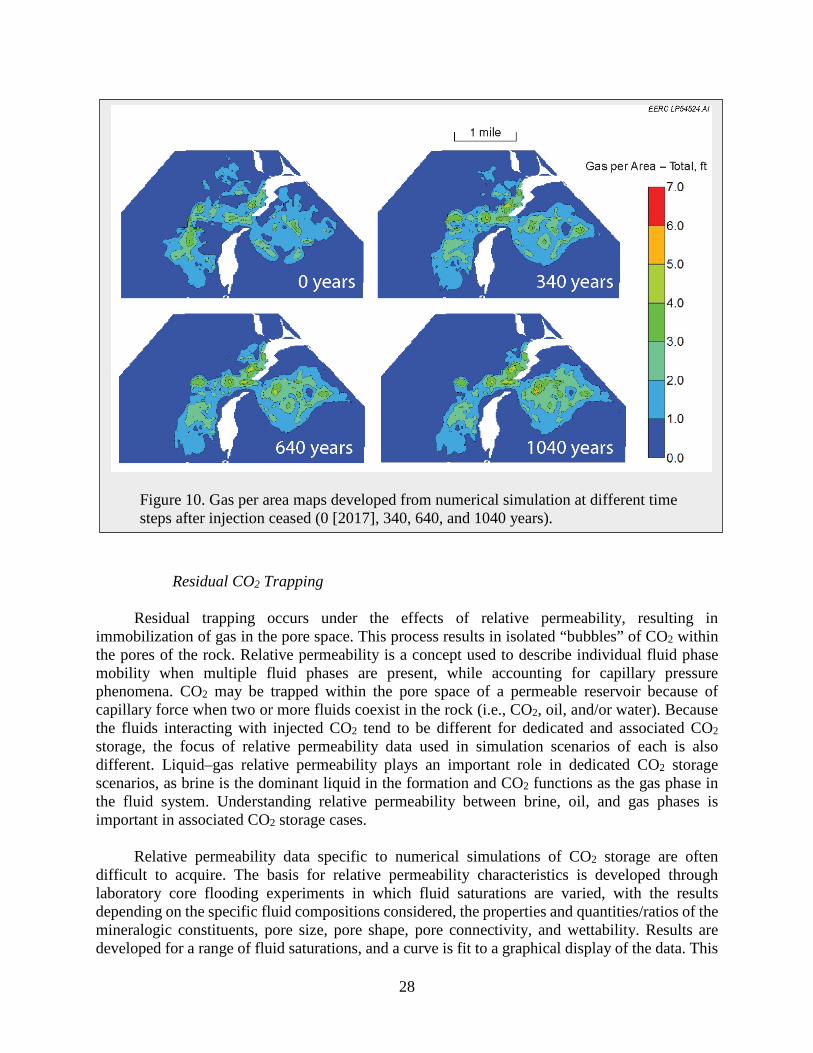
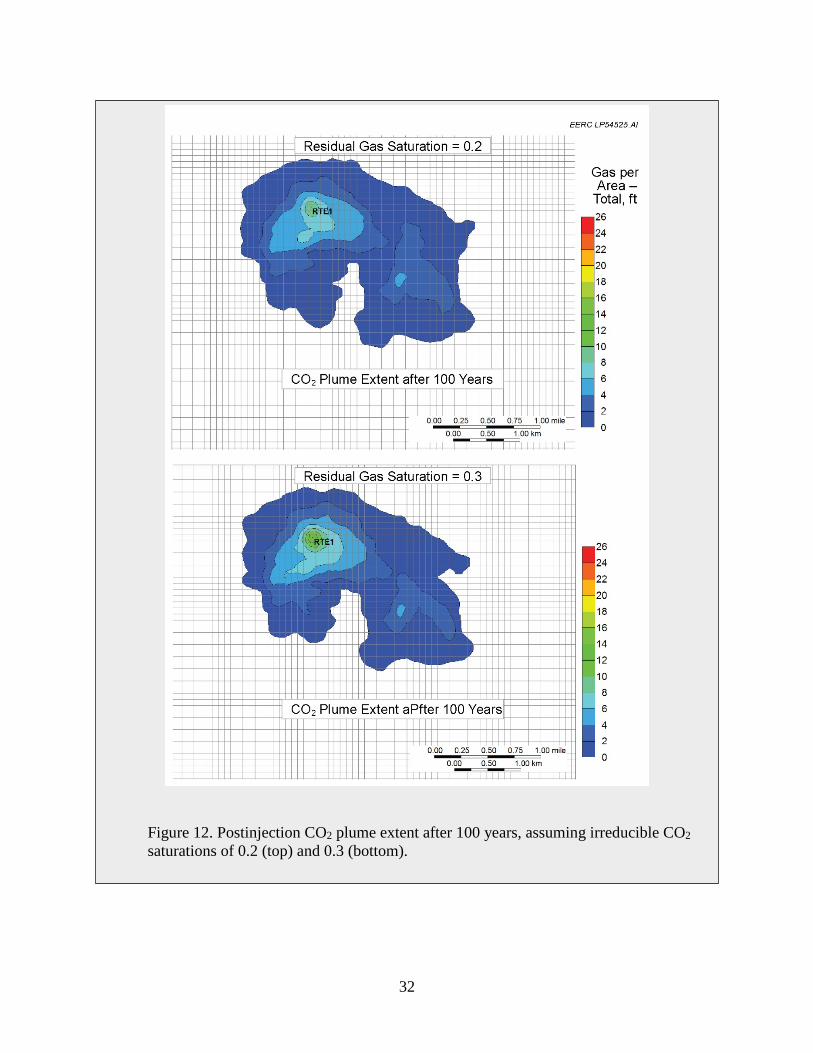
showing a clear hysteretic effect ......................................................................................... 30 12 Postinjection CO2 plume extent after 100 years assuming irreducible CO2
saturations of 0.2 and 0.3 .................................................................................................... 32 13 Comparison of simulated dissolved CO2 for cases with different grid cell dimensions ..... 35 14 Results of CO2 solubility sensitivity cases with varying salinity and temperature ............. 36
iii
LIST OF TABLES 1 AMA Technical Element Summary ...................................................................................... 4 2 AMA Project Phase Summary .............................................................................................. 4
iv
BEST PRACTICES FOR MODELING AND SIMULATION OF CO2 STORAGE EXECUTIVE SUMMARY The purpose of this best practices manual (BPM) is to describe lessons learned and best practices for modeling and simulation of carbon dioxide (CO2) geologic storage (herein “storage”) projects. Information presented here is derived from laboratory and field storage project activities conducted by the Plains CO2 Reduction (PCOR) Partnership. Modeling and simulation collectively comprise one of four technical elements of the adaptive management approach (AMA) formalized by the PCOR Partnership for storage project development. The other technical elements are site characterization; risk assessment; and monitoring, verification, and accounting (MVA) of injected CO2. Modeling is defined here as the collation of subsurface data into a 3-dimensional representation of the subsurface geology and hydrogeology of a CO2 storage site and surrounding area. Simulation refers to the process of using specialized software to create quantitative predictions of the dynamic effects of CO2 injection, including migration of CO2 and other formation fluids; pressure and temperature behavior; and the long-term fate of injected CO2 within the modeled volume. Modeling and simulation can be undertaken at a variety of scales, from regional to site-specific, and levels of complexity and should be developed according to the “fit-for-purpose” philosophy that is central to AMA. The application of modeling and simulation to two types of CO2 storage projects are considered: deep saline formation (DSF) storage and associated storage that takes place as a consequence of enhanced oil recovery (EOR) projects. Many best practices are the same for both types of projects, but different considerations that may exist for associated storage are highlighted. Modeling A typical geologic (or static) model being constructed to support simulation of injection will depict the storage reservoir formation(s) and confining zones (seals), together with structural features such as faults, fractures, and folds. The basis for model construction, invariably in digital form, is a combination of measured subsurface characteristics and geological interpretation. A general workflow for geologic model construction is widely understood among modeling professionals and is applicable to storage projects. A general workflow is described at a high level but details are not discussed. This BPM provides focuses on aspects of modeling that are unique or critical to CO2 storage projects. A key lesson learned through PCOR Partnership experience is that data availability to inform model construction, especially during early stages of a project, can vary widely between dedicated
v
and associated storage projects. Dedicated storage projects that target DSFs often have sparse well control or other characterization data. In contrast, storage associated with CO2 EOR projects typically allows access to production history and an extensive network of wells and accompanying data records. Key best practices recommended for modeling include the following:
• Information gathered from the site characterization program and incorporated into the static model provides an excellent way to gain understanding before starting any simulation work.
• Conducting uncertainty analyses will convey the level of confidence in a model’s structural framework, facies characteristics in interwell areas, and petrophysical property distributions. A series of realizations may be constructed and subjected to numerical simulation, providing a range of possible outcomes that may better inform project design and convey the likelihood of conducting a safe, effective, and successful CO2 storage operation.
Simulation Simulation is the best tool available for supporting engineering judgment and decision-making processes such as technical and economic feasibility studies, optimization of operations, identifying subsurface risks or development of effective MVA. A clear definition of objectives should be developed to frame simulations in support of overall storage project goals. The accuracy and reliability of simulation outputs depend heavily on the quality of data input, including the geologic model. An understanding of underlying uncertainties of available data and interpretations is essential to constrain simulation results. Similar to modeling, a general workflow for simulation is widely understood among simulation professionals and is also applicable to storage projects. Again, a general workflow is described at a high level, but details are not discussed. This BPM focuses on aspects of simulation that are unique or critical to CO2 storage projects. Key best practices recommended for simulation include the following:
• A model grid should be created to capture the reservoir and confining zones of interest within the anticipated project area. Inclusion of cap rock in numerical simulation enables accurate prediction of the effects of structural trapping and also enables the effects of vertical brine egress through the cap rock to be quantified.
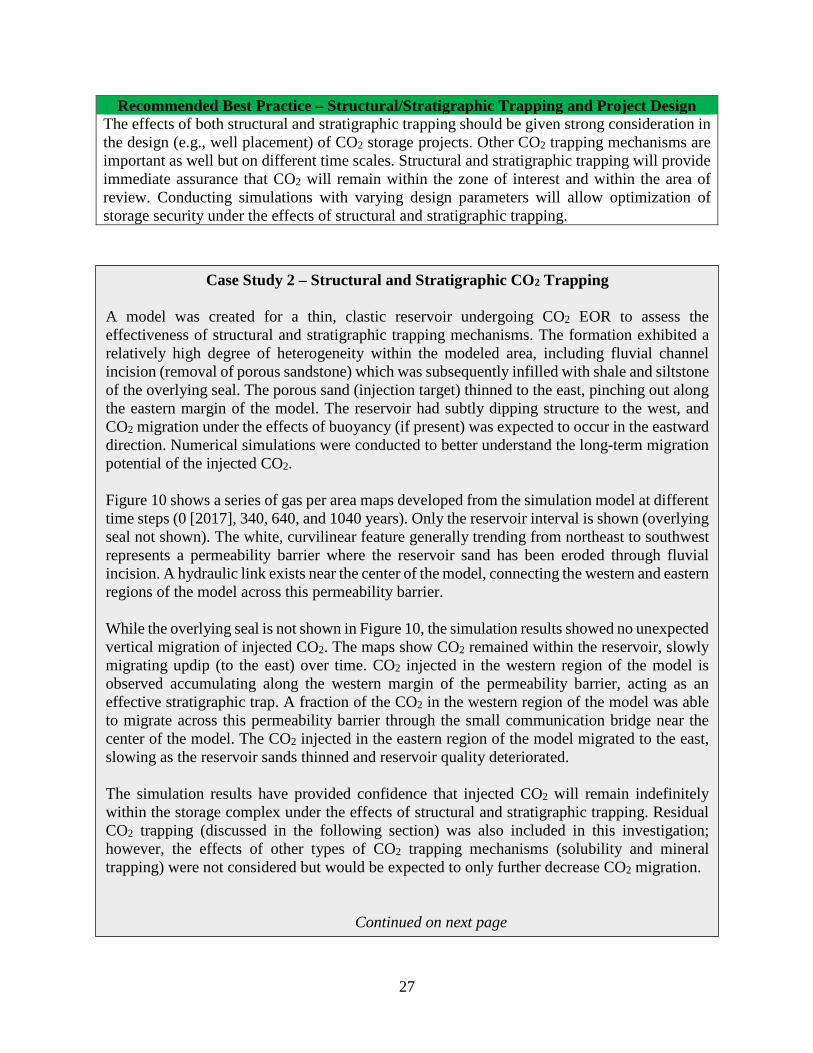
• The effects of both structural and stratigraphic trapping can be assessed with numerical simulation efforts, and the results should be given strong consideration in the design of CO2 storage projects (e.g., well placement). Other CO2 trapping mechanisms are important as well but on different time scales. Structural and stratigraphic trapping will provide immediate assurance that CO2 will remain within the storage complex. Conducting simulations with varying design parameters will allow optimization of storage security under the effects of structural and stratigraphic trapping.
• Relative permeability hysteresis is important to understand and integrate in numerical simulation investigations of CO2 storage, as the effect is usually pronounced when liquid and gas occupy the same system and may have direct implications to CO2 migration and residual trapping of CO2 in the pore space.
1
BEST PRACTICES FOR MODELING AND SIMULATION OF CO2 STORAGE 1.0 INTRODUCTION In 2003, the U.S. Department of Energy (DOE) established the Regional Carbon Sequestration Partnerships (RCSP) Initiative to help develop technology, infrastructure, and regulations needed to facilitate large-scale carbon dioxide (CO2) geologic storage (herein “storage”) and support deployment of commercial carbon capture and storage (CCS) projects. The Plains CO2 Reduction (PCOR) Partnership, led and managed by the Energy & Environmental Research Center (EERC), is one of seven partnerships created by this program. The PCOR Partnership includes over 120 public and private sector stakeholders and covers an area of over 1.4 million square miles (3.6 million square kilometers) in the central interior of North America, including portions of Canada and the United States (Figure 1).
A series of best practices manuals (BPMs) is being published for each of the four PCOR Partnership-defined primary technical elements of a storage project:
• Site characterization • Modeling and simulation • Risk assessment • Monitoring, verification, and
accounting (MVA) These BPMs are derived from extensive PCOR Partnership regional characterization and field demonstration experience acquired via activities conducted throughout the PCOR Partnership region. An additional BPM is also being developed that encompasses best practices for integrating these technical elements into an iterative, fit-for-purpose adaptive management approach (AMA) for commercial storage project deployment. This document is intended to provide guidance to project
Figure 1. The PCOR Partnership region (Ayash and others, 2016).
2
developers, regulators, and others interested in evaluating and developing CO2 storage opportunities and serve as a useful reference for CO2 storage technical specialists. This BPM describes modeling and simulation activities and their application throughout the five PCOR Partnership AMA-defined life cycle phases of a storage project:
The technical terms used in this document are in general agreement with the definitions of Canadian Standards Association (2012) CSA Group Standard Z741-12, a joint Canada–U.S. initiative. 2.0 GEOLOGIC STORAGE Geologic storage projects can be broadly divided into two types. Dedicated storage involves the underground injection of anthropogenic CO2 solely for the purpose of greenhouse gas (GHG) mitigation. The Sleipner project in the Norwegian North Sea has been injecting approximately 1 million tonnes of CO2 per year since 1995 into a deep saline formation (DSF), and several other dedicated storage projects are now operating at a similarly large scale around the world (Global CCS Institute, 2017). Associated storage occurs as a result of CO2 injection for other purposes, most commonly, CO2 enhanced oil recovery (EOR). CO2 EOR was first undertaken in Texas in the 1970s, and over 100 CO2 EOR sites are now operational in the United States (Oil & Gas Journal, 2014). The technology is also being deployed in other countries, including Canada, Brazil, Mexico, and Saudi Arabia (Global CCS Institute, 2017). Although predominantly linked to CO2 EOR, associated storage could also result from enhanced coalbed methane (ECBM) or enhanced gas recovery (EGR) operations; however, these scenarios remain unproven at industrial scale. Despite associated storage being a direct result of CO2 EOR, in many cases, operators of such sites might not seek recognition of GHG mitigation benefits because of various economic, regulatory, or legal factors. CO2 EOR projects are driven by the economic benefit of producing oil that may otherwise not be recoverable by primary or secondary production methods. Storage of CO2 is a consequence of the EOR process, rather than the process goal. During EOR operations, a significant portion of injected CO2 is produced along with oil, separated and purified as needed, and reinjected for additional oil recovery. As a result of the separation and recycle operations applied at EOR sites, CO2 storage accounting may be more complex than in dedicated storage scenarios. The PCOR Partnership region encompasses significant CO2 storage resources, with large-scale operational CCS projects including both dedicated and associated storage (Peck and others, 2016). Extensive regional and site modeling and simulation activities for both dedicated and associated storage scenarios have been undertaken by the PCOR Partnership, including activities
focused on Bell Creek Field in southeastern Montana, the Fort Nelson Field Demonstration Site in northwestern Alberta, Northwest McGregor Field in North Dakota, the Aquistore site in southern Saskatchewan, and many others. This experience has informed the writing of this BPM. Although the best practices described herein have been drawn from lessons learned in the PCOR Partnership region, many of the recommendations are applicable to other storage environments and scenarios, including offshore projects. 3.0 PCOR PARTNERSHIP AMA The PCOR Partnership has formalized and implemented an AMA for assessment, development, and deployment of commercial storage projects (Ayash and others, 2016). The AMA represents a fit-for-purpose approach, ensuring that the necessary technical elements are appropriately and cost-effectively applied to generate the knowledge needed to enable project implementation. The AMA architecture is shown in Figure 2. The core of the AMA consists of four key technical elements (Table 1), conducted with varying scopes and levels of intensity as a project moves through each of the five life cycle phases of commercial development (Table 2).
Figure 2. PCOR Partnership AMA for CO2 storage project development (Ayash and others, 2016).
4
Table 1. AMA Technical Element Summary Technical Element Goal/Purpose Example Methods Site Characterization
Develop an understanding of surface and subsurface environment properties and characteristics relevant for storage project.
Collect, analyze, and interpret existing data, and acquire field data (e.g., logs) and/or samples (e.g., cores, fluids) for analysis or experimentation.
Modeling and Simulation
Model key subsurface features, and predict movement and behavior of injected CO2.
3-D geologic base models can be developed to support numerical flow models for various injection scenarios.
Risk Assessment Identify, monitor, and manage project risks.
Risks can be assessed and prioritized using qualitative or semiquantitative frameworks based on expert panel judgment.
MVA Track behavior of injected CO2, and monitor for potential changes in surface and subsurface environments.
Seismic surveys, pulsed-neutron logs, production data, pressure monitoring, and groundwater sampling.
Table 2. AMA Project Phase Summary Project Phase Goal/Purpose Typical Technical Activities Site Screening Identify one or more candidate
storage project sites. Primarily site characterization, informed and supported by modeling/simulation and risk assessment as appropriate.
Feasibility Assess technical/economic viability of candidate storage sites; identify viable site(s) for advancement to design.
Site characterization, modeling/simulation, and risk assessment.
Design Complete detailed design to derive definitive project cost and time line estimates, secure required permits, and make go/no-go decision on construction.
Detailed modeling/simulation, risk assessment, and MVA design to support regulatory permit applications and investment decisions.
Construction/ Operation
Build and operate facilities to achieve project CO2 injection and storage objectives.
MVA plan implementation including baseline data collection prior to injection, routine history-matching of MVA data with simulation results, and regular review of risk assessment.
Closure/ Postclosure
Cease CO2 injection, and demonstrate CO2 containment in the storage complex.
MVA program continuance (in line with simulation and risk models) to demonstrate compliance with regulatory requirements prior to permit surrender.
5
As shown in Figure 2, multiple go/no-go decision points along the development pathway illustrate where the developer may review project status and confirm that progress is adequate to advance to the next phase. The goal of the AMA is to efficiently deploy and integrate the four technical elements as needed throughout a storage project to cost-effectively meet the technical, economic, and regulatory objectives and requirements of each phase, thereby maximizing potential for successful project implementation. Summary descriptions of the five project phases are presented in Table 2, and additional information can be found in Ayash and others (2016). 4.0 MODELING AND SIMULATION OVERVIEW
4.1 Project Definition Prior to initiating any site evaluation or development work for a potential storage project, the project should be adequately defined. The following are examples of key project elements to define:
• Overall goal. What is the desired project outcome? • Scope. What are the key project objectives and steps/procedures to be used in achieving
the objectives?
• CO2 source – How much CO2 is or will be captured? – What is the CO2 content and composition of the injection stream? – Will the captured CO2 amount and composition be relatively consistent throughout the
anticipated project duration or subject to significant fluctuation?
• Storage target – What storage capacity is required? – Is the project team interested in dedicated or associated storage or is a combination a
viable option? – If associated storage (i.e., CO2 EOR) is a viable option, can the project handle
fluctuating demand from the partner oil company? Can the partner oil company handle fluctuating supply?
• Finances
– What level of financial commitment is available? – Is the project trying to get credit for stored CO2? – Which partners are contributing financially to the project? – Are the sources of income stable in the short and long term?
• Time line
– Will key regulatory requirement deadlines need to be met? – What is the project construction schedule? – What are the lengths of the injection period and subsequent monitoring period?
6
– If targeting associated storage, when is the partner company expecting CO2 to be available for delivery?
– What are the deliverable dates for modeling and simulation results? These key elements provide necessary guidance for subsequent modeling and simulation efforts, which collectively represent a core technical activity within AMA. For the purposes of this BPM, Modeling refers to the collation of subsurface data into a 3-D representation of the subsurface geology and hydrogeology of the storage site and surrounding area, including storage reservoir(s), seal(s), and pertinent structural data such as faults or fractures. The resulting geologic model(s) will typically include stratigraphic and structural interpretation along with physical, chemical, geomechanical, and fluid flow characteristics of the relevant geologic formations and subsurface environment. Simulation refers to the process of using specialized software to create quantitative predictions of the dynamic effects of CO2 injection, including migration of CO2 and other formation fluids, pressure and temperature behavior, and the long-term fate of injected CO2 within the modeled volume.
4.2 Modeling and Simulation Workflows The general workflows for performing both modeling and simulation are well known and applicable to CO2 storage projects. These workflows and best practices have been previously addressed in detail in many sources and are only briefly noted here. This BPM attempts to give more attention to modeling and simulation considerations specifically related to CO2 storage. Data availability tends to vary between dedicated and associated CO2 storage project types. Dedicated CO2 storage activities may target DSFs with little or no previous beneficial use, and so in many cases, few wells or other data sources may be available. This decreased subsurface data density tends to make model construction more challenging, resulting in greater uncertainty in modeling products. Associated CO2 storage (EOR) scenarios generally occur in mature oil fields with production history and an existing array of wells. The resulting (relatively) high subsurface data density is more conducive to modeling activities and generally yields greater confidence in modeling products. Regardless of whether modeling efforts are related to dedicated or associated CO2 storage, the models constructed for each are expected to provide similar simulation inputs, For modeling, the general workflow might be described as:
1) Literature review. 2) Data compilation. 3) Data review (quality assurance and control), formatting, and input to modeling software. 4) Well data interpretation. 5) Geophysical analysis. 6) Structural framework and geocellular grid construction. 7) Property distribution and uncertainty analysis. 8) Grid upscaling and preparation for numerical simulation.
Regarding simulation, the discussion of data availability is similar to that noted above for modeling. Dedicated storage projects typically have limited or no dynamic data (flow rate and pressure changes over time) with which to calibrate the simulation. This adds to the uncertainty of the simulated result. In contrast, associated CO2 storage project areas may have a very large
7
quantity of dynamic data because of the operating history of the oil field. Although such a quantity of data may allow detailed calibration of the simulation and provide an associated high level of confidence, the data base can be so large as to create a challenge to its effective use within project time and budget limitations. History matching of the existing data can consume much more effort than simulation construction and the associated CO2 storage investigations combined. A general workflow might be described as:
1) Selecting an appropriate domain size and grid system from the geologic model. 2) Developing fluid characterization properties tailored to the storage process. 3) Integrating rock and fluid properties. 4) Estimating initial and boundary conditions for the reservoir. 5) Incorporating operational settings for wells. 6) Performing numerical tuning for computational efficiency and accuracy. 7) Undertaking production/injection performance analysis. 9) History matching of production/injection data where available.
10) Assessing reservoir performance with various operational methods. 11) Predicting long-term performance under multiple scenarios.
Modeling and simulation can be undertaken at a variety of scales, from region to site-specific, and levels of complexity, according to specific purposes. For example, site screening may be possible with basic or regional geologic models in combination with the use of storage efficiency factors to estimate storage capacity, whereas a regulatory permit application will likely require detailed modeling and simulation of the proposed storage project, allowing long-term predictions of storage performance and security. Models and simulations should be constructed according to the fit-for-purpose philosophy, which is central to AMA. The areal extent of geologic models and simulations created for storage projects should be fit for their investigative purposes. This often requires more than one model or simulation for a single site in order to evaluate different aspects of the project. They will typically encompass, at a minimum, the area of review (AOR) as defined by law or regulation; however, some models may extend beyond the AOR to capture the regional geologic setting. The vertical extent of models and simulations will depend on their purpose; for example, efforts to support risk assessment or MVA design may encompass the entire stratigraphic sequence above (and below) a storage reservoir, whereas a model to support simulation of only CO2 injection may be limited to only the storage formation. Continued advances in computing power and software systems enable a high and increasing degree of precision to be applied to modeling and simulation efforts. However, inherent uncertainties, including those caused by the availability and accuracy of characterization data, should always be understood, acknowledged, and used to constrain the results of modeling and simulation. Higher precision in modeling does not ensure greater accuracy. Reduction in uncertainty of modeling and simulation takes higher priority in CO2 injection projects than for conventional oil and gas projects because of the regulatory, academic and public acceptance scrutiny faced by CO2 injection projects. Modeling and simulation activities are undertaken on an iterative basis, especially during storage operations, as MVA data allow history matching and calibration of predictive simulations with the associated reductions in project uncertainty.
8
4.3 Model Development The purpose of designing and constructing the static model is to create a digital representation of the subsurface based on geophysical and geological observations. Such models are constructed for use in numerical simulation and evaluation of dynamic storage potential, as well as assessment of risk. Numerical simulations based upon constructed models enable an image of the expected behavior and fate of simulated injected CO2 in specific reservoirs or storage complexes. A storage complex refers to a geologic system comprising a storage unit and primary (and sometimes secondary) seal(s), extending laterally to the defined limits of the CO2 storage operation(s) (Canadian Standards Association, 2012). Some specific objectives for modeling of each storage scenario are described below.
4.3.1 Dedicated Storage Modeling objectives for dedicated CO2 storage may include the following:
• Characterize reservoir(s) and seal(s) that could form the storage complex.
• Characterize shallower water resources that may have potential for beneficial use and their potential interaction with injected CO2.
• Estimate initial boundary conditions, including pressure, temperature, and aquifer
contact, if any, with the injection project area.
• Inform AOR determination for a specific CO2 storage complex needed to satisfy storage regulations and permitting (e.g., Class VI wells in the United States).
• Inform the selection of an appropriate number and location of injection and potential brine
extraction wells for planning and economic assessments.
• Assist in determining the long-term fate of injected CO2 by assessing fluid migration potential and verifying containment/conformity.
4.3.2 Associated Storage
The modeling objectives for associated CO2 storage are similar to those for dedicated storage listed above. The focus of this BPM is on storage and, therefore, associated storage in the context of CO2 EOR operations. Nevertheless, modeling efforts for associated storage may also provide the basis for assessment of EOR optimization, for example, to help determine:
• Effectiveness of continuous CO2 injection (CCI)/continuous gas injection (CGI) vs. water alternating gas (WAG) injection and optimal WAG intervals.
• Visualization of injected CO2 accumulations in the oil reservoir as may be indicated from
geophysical data sources and reconciliation with characterization data.
9
• Pressure maintenance and injection pressure, as it pertains to the type of flood design (miscible vs. immiscible flooding).
• EOR estimated ultimate recovery (EUR) and providing insight into sweep efficiency.
• Optimal infill drilling. • Necessary CO2 purchase quantities and estimating recycled CO2 quantities.
• Oil composition evolution during EOR operations.
4.4 Simulating CO2 Storage
The primary purposes for developing simulations are to investigate project development alternatives, estimate future operational capabilities or constraints, and predict the movement or behavior of injected CO2 and other fluids in the subsurface. Simulation is a valuable tool for supporting decision-making processes. Examples of activities supported by simulation results are technical and economic feasibility studies, surface facility design, optimization of operational scenarios to increase capacity or minimize risks, and development of effective monitoring strategies. Prior to initiating any simulation calculations, the characteristics of the geologic formations (reservoirs and seals), the fluids contained in the reservoir, the wellbore designs, operating history, and development plans should be adequately described and incorporated either via the geologic model or as direct inputs to the simulation software (Section 6). As with any computational science field, the quality of the input data will determine, to a large extent, the accuracy and reliability of the simulation output. Data gathered from the site characterization activities and validation efforts become key requisites for any successful simulation project. Dynamic simulations allow the ability to gain greater insight on storage capacity, formation injectivity (how fast the CO2 can be injected), and containment (risks associated with potential leakage from the reservoir or storage complex). The specific goals of the simulation work may change throughout the phases of a CO2 storage project (Steadman and others, 2011; Hamling and others, 2013; Delprat-Jannaud and others, 2013; Jin and others, 2016). The use of modeling and simulation from the start of the project helps to inform the entire project and requires a rigorous data management system. Iterative approaches are used to develop confidence in the simulation predictions. The following are examples of goals for simulation as storage projects move through their phases of development:
• Feasibility assessment and design phase – Predict CO2 plume migration and the effectiveness of trapping mechanisms.
10
– Provide data to inform technical and economic feasibility studies. – Provide data to inform surface facilities design and development of effective
monitoring strategies. – Provide an objective way to evaluate the relative merits of different operational
strategies before starting the construction phase. – Estimate the possible effects and potential risks associated with the natural uncertainty
present in geologic structures.
• Operation phase – Provide inputs for risk identification, and guide MVA techniques to effectively
monitor the behavior of injected CO2 and reservoir fluids as the project progresses. – Assist with targeted deployment of MVA data acquisitions at optimal surface and
subsurface locations at the relevant time and cost for efficiency in risk management. – Identify a change in risk state or early indicators of out-of-zone migration and provide
feedback to the operator. – Validate that CO2 is securely contained within the storage complex. – Compare simulated and monitored plume migration, refine and calibrate the model,
and update forecasts of plume migration. – Investigate optimization scenarios such as minimization of plume extent or
maximization of CO2 storage efficiency.
• Closure/postclosure phase – Predict postinjection plume behavior with a primary focus on plume movement and
quantifying the secondary trapping mechanisms that will eventually immobilize the CO2.
Reservoir and storage system simulations are a cost-effective means to examine how the project risk profile evolves over time. Simulations help to determine storage capacity, formation injectivity, and storage integrity (Nunez-Lopez, 2013). Combined with monitoring and operational data, the simulation results are also employed to determine the role of different mechanisms that may affect the CO2 storage process. The following are examples of important aspects investigated for storage projects (Delprat-Jannaud and others, 2013):
• Optimal well location(s) and completion(s) • Seal (cap rock) and wellbore integrity • The importance of secondary seals/barriers • Effects of unplanned hydraulic fracturing as a result of CO2 injection • Pathways that may allow CO2 to migrate out of the main storage reservoir • Impacts of thermal/compositional gradients in the reservoir • Temporal and spatial migration of the injected CO2 plume • Effects of geochemical reactions on CO2 trapping and long-term porosity and
permeability behavior While the geologic model provides a framework for describing the geologic structure and the rock properties, reservoir simulation incorporates a variety of additional characterization data for describing the pressure distribution and the fluid mobilization response to injection or
11
production processes. Fluid characterization parameters obtained through special pressure, volume, temperature (PVT) experiments; rock–fluid interaction parameters (relative permeability and capillary pressure data) obtained through special core analysis; well location; completion design; and operational history are important to simulation activities (Saini and others, 2012). These types of data and the role they play in CCS are discussed in greater detail in the PCOR Partnership’s Best Practices Manual (BPM) for Site Characterization (Glazewski and others, 2017). Simulations provide a means to quantitatively describe the transport and behavior of CO2 in reservoirs and storage complexes, determined not only by the geologic structure and reservoir properties but also by the well design and operational strategies (Mattax and Dalton, 1990). Simulation results also provide a means to evaluate the sweep and storage efficiency and the applicability of various monitoring activities related to CO2 storage, enabling increased understanding about the prediction of the behavior of injected fluids over the injection and postinjection periods. However, proper simulation studies require a series of steps to ensure the reliability and accuracy of the results. In general, these steps are performed in iterative cycles starting from building an initial reservoir model (or base case that is constructed with good scientific and engineering assumptions) before performing the validation tests. When operational monitoring data (production well logs, flow rates, etc.) are available, history matching is a key prerequisite for gaining confidence on predictions of reservoir performance. Upon model validation, the simulation is considered ready for performing predictions and evaluation of possible operational scenarios pertaining to fluid migration and pressure response within the reservoir. 5.0 BEST PRACTICES AND LESSONS LEARNED The following sections attempt to highlight key modeling and simulation concepts that are specific to, and/or very important to, investigations of CO2 storage. The discussion in the following sections is not meant to elaborate a step-by-step workflow for modeling and numerical simulation activities as they relate to CO2 storage. These workflows are readily available in literature and are, therefore, beyond the scope of this document. Similarly, many of the modeling and simulation activities conducted for CO2 storage are nonunique, with similar activities regularly conducted for modeling and simulation for oil and gas production. Therefore, modeling and simulation commonalities for these different purposes will not be discussed in detail. Key topics of the following sections include model extent and cell dimensions, data considerations, property distribution and uncertainty analyses, simulation design and forecasting for CO2 storage, and CO2 trapping mechanisms.
5.1 Model Extent and Grid Cell Dimensions To begin model construction, one of the first considerations to be addressed is proper extent (model area and thickness, as it relates to the stratigraphy included). A summary of characteristics of an optimally sized grid system include:
• A grid should be created to capture the reservoir and confining zones of interest within the anticipated project area.
12
• A model grid should adequately capture all injection, production, and monitoring well locations within the anticipated project area.
• A model grid should extend laterally to encompass areas likely to experience substantive
changes in pressure during operational activities.
• A grid system should be developed in consideration of workstation capability and desired computational intensity. – Computational intensity generally increases as the total cell count increases, resulting
in longer property distribution actions and numerical simulation duration, thereby directly affecting project schedule and budget.
Decisions related to balancing grid cell dimensions and total cell count will be made early in the model construction process, and the outcome will directly affect the efficiency of model construction and manipulation. Cell size upscaling may be needed after a model has been constructed to further reduce total cell count and enable efficient simulation. An additional consideration, however, is that cell size within a simulation model may have direct effects on the simulation’s results through numerical dispersion (Bell and Shubin, 1985). Larger grid cells generally result in lower injection rates (and cumulative injected gas mass; Figure 3). Other parameters, such as the degree of CO2 dissolution into pore fluids, is also affected by grid cell size. Resolving this challenge with statistical support, rather than arbitrarily choosing a cell size, may be achieved by conducting a cell size sensitivity analysis to determine an optimal cell size. Cell size sensitivity analyses involve the construction of multiple grids with the same volumetric extent but varying cell dimensions. Each grid is subjected to simulations of CO2 injection with the same number of wells, numerical settings, and constraints. The results are then graphically compared. The trend illustrated in Figure 3 is interpreted as an artifact of the simulation software’s calculation of CO2 saturation as a function of CO2-brine relative permeability. CO2 saturation in larger cells tends to build more slowly. CO2 permeability, calculated from CO2-brine relative
Figure 3. General relationship between cell size and simulated CO2 injection rate.
13
permeability curves input to simulations, is “held back” by slowed CO2 saturation buildup in the models composed of larger cells. This behavior may be mitigated by the use of local grid refinement around wells in the simulation.
This inverse relationship between cell size and simulated CO2 injection rate/mass is
important for two reasons. The first reason is that saline formation modeling activities often lack production/injection data for history matching to compensate for this effect. If history matching were to be implemented, such an effect might be addressed by adjusting the overall permeability distribution or the CO2-brine relative permeability curves. The second reason is that realistic CO2 injection simulations would likely stop short of achieving ultimate storage capacity, instead being conducted for the more limited estimated lifespan of a CO2 source plus some length of the closure/postclosure phase. The ultimate storage capacity would likely be similar between models of the same volumetric extent but differing in cell dimensions, as the results would be closely related to rock compressibility, fluid compressibility, pore volume, and pressure differential between initial and final pressures, which would be equal between the models. However, if simulations planned for CO2 storage investigations are designed to optimize CO2 storage in a relatively short time frame (i.e., 50-year time frame) rather than achieving ultimate storage capacity, this relationship between cell size and CO2 injection rate/mass is a concern.
In summary, arbitrarily choosing grid cell dimensions may introduce uncertainty as to the
validity of numerical simulation results. Conducting a cell size sensitivity analysis is recommended if numerical simulations will not include history matching and if simulations will be stopping short of achieving ultimate storage capacity.
Lesson Learned – Model Upscaling Poor cell size selection may adversely affect simulation results due to numerical dispersion, resulting in inaccurate saturation responses and the injection rate profile. Conducting a cell size sensitivity analysis will assist in defining an acceptable degree of upscaling and reduce numerical dispersion to an acceptable level.
5.2 Data Considerations: Seismic
A key lesson learned through PCOR Partnership experience is that data availability to inform model construction, especially during early stages of a project, can vary widely between dedicated and associated storage projects. Dedicated storage projects that target deep saline formations often have sparse well coverage and/or other characterization data. In contrast, CO2 storage scenarios associated with EOR projects typically allow access to production history and an extensive network of well records. A project’s site characterization program may provide additional site-specific data needed to reduce technical uncertainties in subsurface characteristics, enable more accurate model construction, inform simulation design, and allow for the selection of relevant simulation cases. The types of characterization data most useful in CO2 injection modeling and simulation efforts include depths to formations of interest, well logs and geologic core samples which may be analyzed for petrophysical properties, fluid samples which can be analyzed in compositional analyses and geochemical investigations, and temperature and pressure measurements. The
14
acquisition of these data requires the drilling of a characterization well and represents unavoidable initial investment. However, aside from providing direct modeling and simulation inputs, these types of data may help satisfy injection well-permitting requirements and identify cost-effective courses of action at early phases of the project. Data review and quality control measures ensure a sound foundation for developed models and simulation results, which is important for accurately predicting injectivity, pressure response, and subsurface migration and accumulation of CO2. Elaboration on each of the types of data integrated in modeling efforts is well documented in literature across a multitude of references. Only geophysical data are elaborated upon (below), as these data have particular usefulness in model construction, simulation history matching, and monitoring injected CO2.
Lesson Learned – Modeling Data Availability Data availability to inform model construction can vary widely between dedicated and associated storage projects. Dedicated storage projects that target deep saline formations often have sparse well coverage and/or other characterization data. In contrast, CO2 storage scenarios associated with EOR projects typically allow access to production history and an extensive network of well records.
Recommended Best Practice – Preliminary Understanding
Information gathered from the site characterization program and incorporated into the static model provides an excellent way to gain understanding before starting any simulation work. Previous knowledge about the reservoir and fluid characteristics will help to better plan the simulation work, select plausible simulation scenarios, and identify cost-effective courses of action at early phases of the project.
Among the different data types used in CO2 storage modeling and simulation, geophysical data (with an emphasis on seismic data) has proven versatility. Well data provide 1-D subsurface measurements at specific locations, whereas seismic data provide increased visibility of interwell heterogeneity. Combining well and seismic data enables improved 3-D modeling of the subsurface. Seismic data depending on the vintage and quality can be very important inputs in structural framework creation, petrophysical property distributions, guiding simulation history matching, and for use in MVA programs developed for CO2 storage.
Seismic data can be a very useful tool for baseline subsurface characterization (prior to CO2 injection operations). Additionally, time-lapse 4-D seismic investigations, comparing a baseline seismic survey and repeat/monitor surveys may be used in MVA activities during injection operations. Changes in subsurface pressure and fluid saturations may produce measurable change in seismic amplitude. This change in amplitude is, in some circumstances, easily seen in 4-D seismic investigations, enabling visibility of changes due to CO2 injection (commingled response of CO2 and pressure plumes). This process may allow improved modeling during operational phases; for example, identification of permeability barriers and preferential fluid flow pathways may be identified in 4-D seismic investigations, which may otherwise be ambiguous in 3-D seismic surveys.
15
Seismic data can give very specific subsurface structural information. Seismic horizons can be extracted to create more accurate model structures. 3-D seismic data are particularly useful in identifying any structural features (faults, folds, fractures), as well as lateral geologic heterogeneity, and aiding in the interpretation of the geologic processes through which they were created.
Seismic surface attribute maps, volumetric inversions, and amplitude-versus-offset (AVO) analyses may also be used to create advanced learnings of the subsurface and produce direct modeling inputs, including geobody distributions (volumes of rock with similar geologic properties). In particular, seismic applications can aid in the identification of several parameters:
• Formation dip
• Stratigraphic boundaries between formations
• Geobodies from seismic data that may help with structural modeling and petrophysical
property distributions
• Potential CO2 migration pathways such as fractures and faults
• Presence and geometry of structural features that may serve as CO2 traps
16
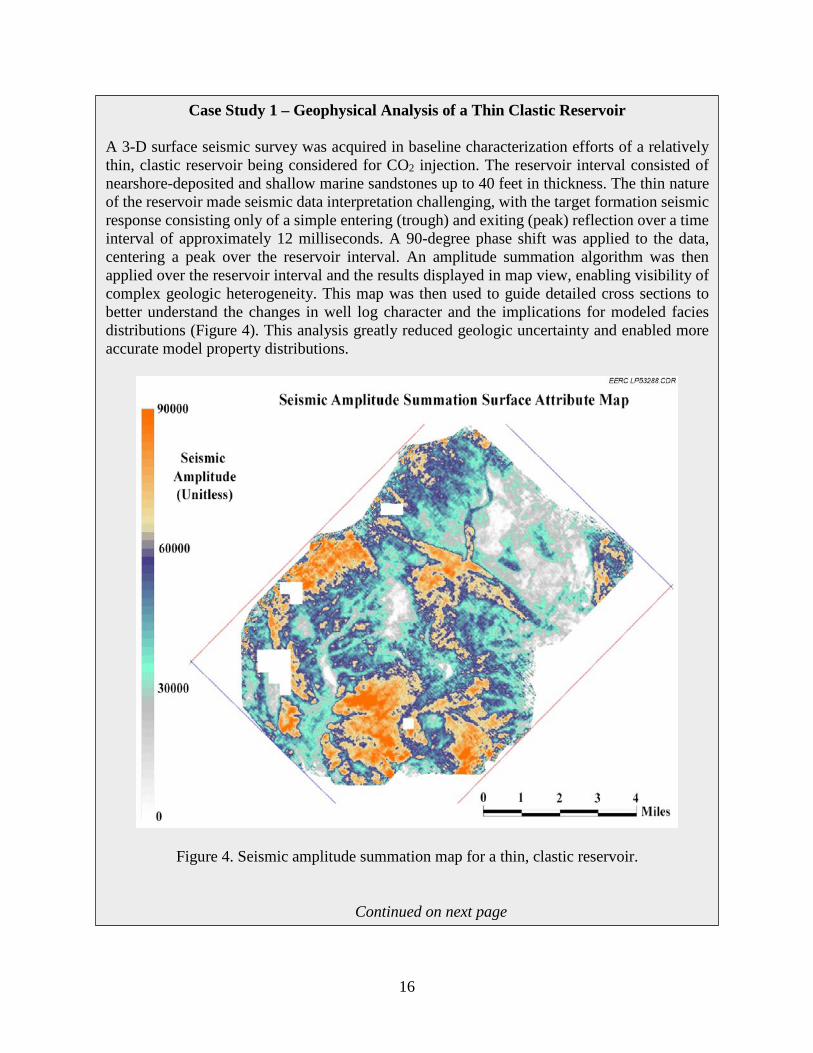
Case Study 1 – Geophysical Analysis of a Thin Clastic Reservoir A 3-D surface seismic survey was acquired in baseline characterization efforts of a relatively thin, clastic reservoir being considered for CO2 injection. The reservoir interval consisted of nearshore-deposited and shallow marine sandstones up to 40 feet in thickness. The thin nature of the reservoir made seismic data interpretation challenging, with the target formation seismic response consisting only of a simple entering (trough) and exiting (peak) reflection over a time interval of approximately 12 milliseconds. A 90-degree phase shift was applied to the data, centering a peak over the reservoir interval. An amplitude summation algorithm was then applied over the reservoir interval and the results displayed in map view, enabling visibility of complex geologic heterogeneity. This map was then used to guide detailed cross sections to better understand the changes in well log character and the implications for modeled facies distributions (Figure 4). This analysis greatly reduced geologic uncertainty and enabled more accurate model property distributions.
Figure 4. Seismic amplitude summation map for a thin, clastic reservoir.
Continued on next page
17
Additionally, baseline and repeat seismic surveys may provide visibility of time-lapse changes due to CO2 injection. Comparison of the baseline 3-D seismic survey with a subsequent 3-D seismic survey enabled a 4-D difference analysis. The two surveys were cross-equalized for geologic units above and below the reservoir. The root mean square (RMS) difference between the two surveys was then calculated over the reservoir interval and displayed as a map (Figure 5). Changes in reservoir pressure and CO2 saturation were identified with spatial accuracy. Similarly, areas within the reservoir with little pressure and/or CO2 saturation changes were identified, illuminating a pair of perpendicular permeability barriers, which were unable to be definitively located through 3-D seismic analysis alone. These results were then used to augment petrophysical property distributions within the model, guide simulation history-matching efforts and, ultimately, contribute increased confidence in the accuracy of predictive numerical simulation results.
Figure 5. 4-D difference RMS amplitude map. Warmer colors represent greater difference in amplitude between baseline and repeat seismic surveys, attributed to changes in pressure and CO2 saturation within the reservoir because of injection. Cooler colors represent little change in reservoir pressure and fluid saturation between baseline and repeat seismic surveys. It should be noted that some minor amplitude differences along the northern margins of the image may be due to statistical artifacts.
18
5.3 Property Distribution and Uncertainty Analysis Assignment of modeling parameters for dedicated or associated CO2 storage scenarios are generally similar to standard practices of oil and gas production modeling. A listing of necessary distributed properties for numerical simulations of CO2 injection include 1) facies/lithology (bodies of rock with similar geologic characteristics), which is used to assign relative permeability data, 2) effective porosity, 3) matrix permeability, 4) fracture networks (if applicable) and their corresponding porosity and permeability characteristics, 5) fluid saturations (water/oil/gas), 6) temperature, and 7) pressure. Uncertainty analyses are an additional commonality between modeling for CO2 storage and hydrocarbon production, undertaken to assess the likelihood of favorable outcomes across a range of realizations. However, the thought process behind uncertainty analyses is fundamentally different for CO2 storage. Uncertainty in oil and gas models is largely focused on quantifying the location and size of reserves, estimating recoveries, and optimal production methods, all of which are important for operators’ financial/economic investigations. Uncertainty analyses in CO2 storage modeling instead focus on determining the suitability of a particular scenario, an optimal deployment of MVA techniques for the scale of the operation, determining storage capacity, and the likelihood of achieving safe and successful storage, all of which are important to build public assurance and acceptance. Uncertainty translates to increased project risks. If the model being constructed is challenged by low data resolution (e.g., few wells for structural control and/or few or no core data sets available to guide property distributions), uncertainty analyses should be conducted to assess the range and probability of possible geologic scenarios. Such uncertainty analyses commonly include structural uncertainty, facies uncertainty, and uncertainty in petrophysical property distributions. Common nomenclature for such analyses include probabilistic realizations with statistical support, P10/P50/P90, or more arbitrary “low/mid/high” realizations for situations lacking statistical significance. Structural uncertainty analysis may be prudent if only a small number of structural control points exist or if there are few or no structural control points in key model locations. As a general rule, injected CO2, at depths greater than 800 m, will experience temperature and pressure conditions needed to remain in a supercritical phase (dense, as in a liquid, but with negligible surface tension). Even in the supercritical state, CO2 will be less dense than native formation brine and will tend to undergo gravity segregation under the effects of buoyancy. Because of this, subtle structural characteristics may have a significant impact on the migration and accumulation of injected CO2. Additionally, injection formation thickness relates directly to pore volume, which may affect CO2 plume extent and the formation’s overall ability to receive the intended volume of stored CO2. The structural uncertainty process generally involves assessing standard deviation of a structural surface, using other existing wells’ structural information, and applying this knowledge to the confidence interval desired and a structural uncertainty map covering the area of interest. Multiple structural surfaces are created through this process, which will affect the overall thickness and volume of associated formations/zones. The resulting structural uncertainty surfaces should remain in agreement with structural control data points (there should be no significant uncertainty in control point location or depth) but will vary smoothly with distance away from the control points (Figure 6).
19
Figure 6. Schematic vertical section showing probabilistic structural surfaces created from structural uncertainty analysis. There is no significant uncertainty in structure at previously drilled wells (i.e., “Well 1” in the figure above), resulting in little difference in reservoir top surfaces. At a planned well location, the effect of structural uncertainty is more pronounced. Mid (P50) refers to the most likely thickness, while there are calculated 90% probabilities that the reservoir will be thicker than illustrated by the thin (P10) surface and thinner than the thick (P90) surface.
Uncertainty assessment in facies distribution may also be necessary to plan for a range of CO2 storage scenarios. The relative proportions of facies being modeled often have a significant amount of uncertainty, as the geologic units being modeled often have few sampled locations in comparison to the volume of rock being modeled. The lateral and vertical heterogeneity of the injection formation will partly determine system boundary definition (i.e., open, closed, semiclosed), which is a controlling factor in fluid migration and pressure buildup. Poor
20
connectivity of reservoir-quality facies will cause the injection formation to act in a more “closed” manner, resulting in rapid pressure buildup. Inaccurate estimation of facies connectivity and the resulting pressure response may result in underestimation of the number of wells needed to inject CO2 at the desired rate (i.e., inability to inject CO2 at the necessary rate because of bottomhole pressure (BHP) constraints emplaced to avoid fracturing the rock), ineffective surface infrastructure designs (e.g., CO2 compression system), and inaccurate cost estimates for the project. The available facies data from core and well logs will give expected ratios and trends that can be duplicated in facies distributions to give the expected outcome, with the assumption that the interwell areas have similar facies proportions and associations. However, poor data resolution may make these assumptions invalid, giving greater importance to preparing for a range of facies distribution realizations. Multiple facies distributions may be achieved to span a range of proportions, heterogeneity, and resulting connectivity of facies (Figure 7).
Figure 7. Multiple rock-type distributions for an eolian (wind-blown) sandstone reservoir with interdune carbonates to address uncertainty in facies proportions and connectivity.
An uncertainty analysis of petrophysical properties within each component of the storage complex (storage formation and sealing units) may also be necessary. Petrophysical properties such as porosity and permeability will play a role in determining the target formation’s ability to receive CO2 at the desired rate and store the intended volume of CO2. Petrophysical characteristics will also determine CO2 migration pathways, injected CO2 plume extent, and pressure buildup
21
(factors included in AOR determination). Furthermore, sealing units’ petrophysical characteristics will determine their effectiveness in containing CO2 within the storage complex. The source of petrophysical uncertainty relates generally to the small number of measurements available in comparison to the volume of rock being modeled. The data that do commonly exist, in the form of well log data and core sample analyses, may not be located where information is desired. Additionally, a sampling bias may be observed in available data from oil and gas wells, as there is often a tendency to sample desirable cored intervals (zones with relatively high porosity, high permeability) in comparison to undesirable intervals (zones with relatively low porosity, low permeability). Although understanding the petrophysical characteristics within the particular zone of interest is important, accurately capturing the poor- or nonreservoir components is also important in creating an accurate understanding of fluid flow and pressure response. To address the uncertainty in petrophysical property distributions, confidence intervals are set and used to guide the frequency of certain values within each facies during distribution (Figure 8).
Figure 8. Low-, mid-, and high-case porosity distributions created to address uncertainty in petrophysical property distributions.
22
Uncertainty, as mentioned earlier, translates to increased project risk. The uncertainty analyses discussed above attempt to decrease risk associated with storage capacity, injectivity, injected CO2 plume extent, and wellhead pressure necessary for injection. Uncertainty analyses will highlight data gaps and provide support for the acquisition of such data in future characterization activities. A case matrix may be developed, populated with combinations of model properties resulting from uncertainty analyses, and used ultimately to guide a suite of numerical simulations. The simulation outputs from the range of cases may provide additional confidence in the likelihood of project success and perhaps assist in other aspects of project planning (i.e., infrastructure design, financial/economic assessments).
Recommended Best Practice – Conduct Uncertainty Analyses to Inform Project Design Conducting uncertainty analyses will convey the level of confidence in a model’s structural framework, facies characteristics in interwell areas, and petrophysical property distributions. A series of realizations may be constructed and subjected to numerical simulation, providing a range of possible outcomes to better inform project design and convey the likelihood of conducting a safe, effective, and successful CO2 storage operation.
5.4 Simulation Design and Forecasting for CO2 Storage
Simulation efforts are commonly employed in the oil and gas industry to estimate and optimize recovery through changing simulated operational practices. Similar to the discussion included above regarding risk and uncertainty, numerical simulation is important for operators’ financial/economic investigations. Numerical simulation for CO2 storage is also important for economic reasons, but focus is also placed on determining the suitability of a particular storage complex, estimates of injection pressure and rate, sealing effectiveness, and the likelihood of achieving safe and successful storage. All of these aspects are important to build public assurance and acceptance, and simulation results are certainly useful in reducing uncertainty in infrastructure and operational designs. More specifically, numerical simulations conducted for the investigation of dedicated and associated CO2 storage attempt to 1) provide an understanding of the process through which CO2 will be introduced to the subsurface and enable visibility of the consequences of CO2 injection (e.g., reservoir pressure response, potential geochemical reactions which may affect petrophysical characteristics, recoverable hydrocarbons in associated CO2 storage scenarios) and 2) provide an understanding of the fate of injected CO2 (migration and accumulation) while accounting for the various CO2 trapping mechanisms at work in the subsurface.
5.4.1 Simulating CO2 Injection Well operational settings are a critical factor for simulation of both dedicated and associated storage projects. The well settings are vital in ensuring the subsurface simulation results are achieved through normal or expected operation of wells and surface process facilities. Well locations in the simulation domain, their completion designs, and operational constraints must be specified. The well management history and future operating strategy, sometimes referred to as well schedule, require specifying the field’s historical production/injection data and premises to guide future performance.
23
Two operating scenarios are commonly applied for simulation of CO2 injection wells. The actual or desired injection rate may be chosen as the physical constraint, and BHP is the calculated variable. This method is commonly employed when CO2 supply rather than geologic characteristics is expected to limit injectivity. Alternatively, a maximum BHP may be specified, and the injection rate becomes the calculated variable. This method is often chosen when geologic characteristics are expected to limit injectivity, and the specified pressure constraint must be implemented to avoid excessive injection pressures which may initiate fractures within the rock. History matching of existing injection/production well data (if available) is an important process for associated CO2 storage scenarios. This process entails conducting numerical simulations of historical production/injection operations to achieve results that match well and/or field operational observations (e.g., production/injection rates and volumes, BHP). Key model parameters may be modified through this process to enable better history matching, including permeability, fluid saturation, and relative permeability. With model parameters able to support simulations that closely match quality historical observations and data, increased accuracy is to be expected in further predictive forecasts. This process is generally followed in simulations of associated CO2 storage, as CO2 EOR is usually considered as a tertiary recovery operation (primary and secondary recovery data can be used in history matching). However, numerical simulation activities focused on dedicated CO2 storage are generally planned in such a manner as to limit the number of wellbores contacted (potential vertical migration pathways) and to avoid impacting hydrocarbon reserves. As such, existing operational data are generally limited or nonexistent when conducting simulations during the site screening, feasibility, or design phases (Figure 2). Yet while history matching may be impossible prior to the commencement of injection in a dedicated storage project, the acquisition of monitoring and operational data during the early operational phase may be used in history-matching efforts. If an observation well(s) is employed, data from the well may be used along with the injection well(s) for history-matching the acquisition of pressure, temperature, and fluid saturation data. This may result in more accurate simulation predictions of CO2 plume extent and the extent of elevated pressure within the target formation. Additionally, results from 4-D seismic investigations may enable visibility of changes in pressure and CO2 saturation within the reservoir. Thus 4-D seismic derivatives may be used in history-matching efforts to more accurately predict the CO2 saturation footprint. With regard to simulations of dedicated CO2 storage, initial forecasting is still useful and necessary for project planning purposes even if the operational data needed for history matching are unavailable. A suite of simulations may be conducted instead, focusing on the results of uncertainty analyses (see Section 5.3) to produce a range of potential outcomes. Thickness, porosity, and permeability may be varied, as well as other numerical values, to determine a range of outputs, including the size and shape of the accumulation, the evolution of injected CO2 plumes, and pressure response throughout the life of the project (during the construction/operation and closure/postclosure phases). Modification of critical parameters may enable optimization of the project’s design, with potential implications to the injected accumulation’s size, shape, and potential movement. This is an important objective of simulation forecasting for CO2 storage.
24
Recommended Best Practice – Initial Simulation of Dedicated Storage Despite typically lacking operational data for history matching, simulation forecasting for initial assessment of dedicated storage should be undertaken. With reference to uncertainty analysis, such simulation work may be used to optimize project design.
Critical parameters involved in CO2 storage design and forecasting include:
• Maximum allowed bottomhole injection pressure: excessive pressure may cause unintended hydraulic fracturing of injection layer and/or confining layers (seals).
• Tubing size: tubing should not be so large as to provide a flow capacity that is too great for the injection formation to accept, resulting in excessive well construction costs.
can cause a localized reduction of in situ formation stresses with unintended formation fracturing consequences.
• Well spacing and pattern: the well plan should be laid out to take advantage of favorable
geologic conditions, minimize pressure interference between wells, and maximize efficiency of surface facilities.
• Use of water extraction wells: extractors may be very helpful in CO2 storage project
design, but handling, use, or disposal of the produced brine may present a new set of challenges, especially in on-shore environments (IEA Greenhouse Gas R&D Programme, 2012).
• Placement and depth of monitoring wells: simulation efforts assist with design of a CO2
storage project’s MVA plan.
• Surface constraints: land surface conditions and cultural features may strongly influence storage designs.
• Migration path of the accumulation: injected CO2 may migrate a significant distance in
the subsurface over many years. The interaction of the storage project needs and constraints lead not only to the simulated capacity and injectivity design but also have direct impact on other parts of the project, including the monitoring program, project risk analysis, wellhead injection pressure and, therefore, also compression and transportation designs.
5.4.2 CO2 Trapping Mechanisms and Determining the Fate of Injected CO2 Beyond usefulness for storage project design, simulation forecasting is also critical for estimation of the long-term disposition of the injected CO2. As discussed previously, the density and viscosity of injected CO2 are less than that of the native pore fluid. Over time, the CO2 will seek to migrate vertically until meeting impermeable rock. CO2 will also migrate laterally along
25
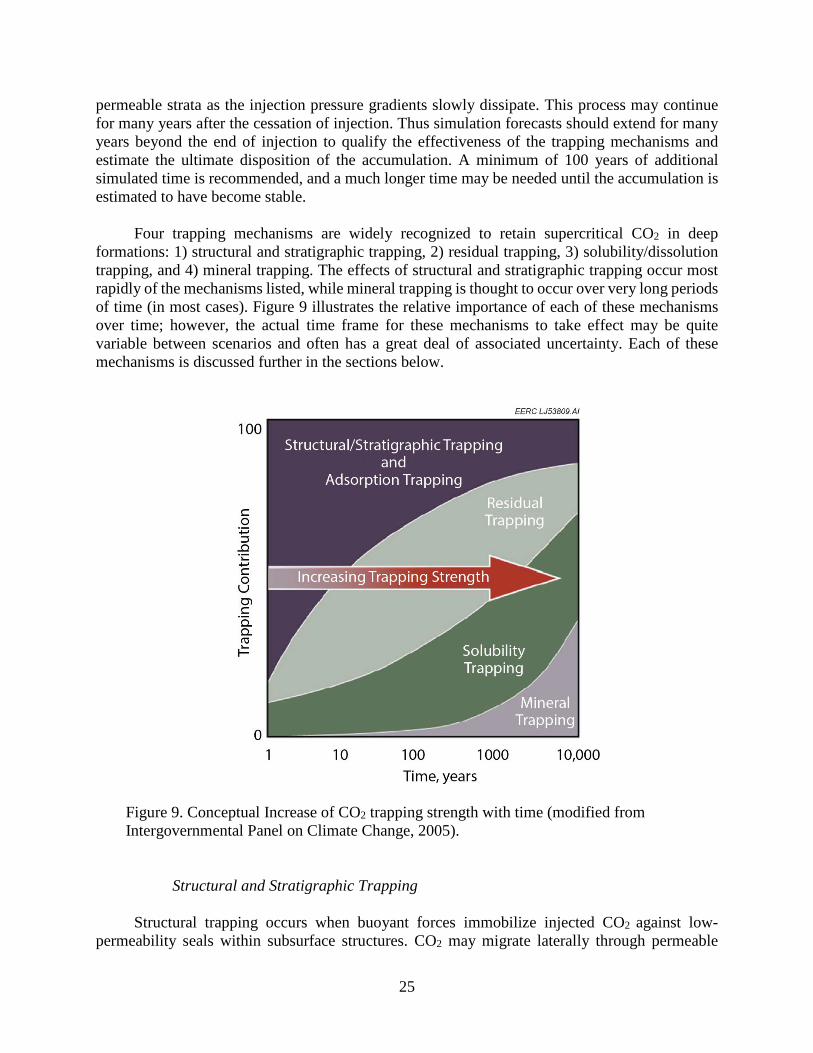
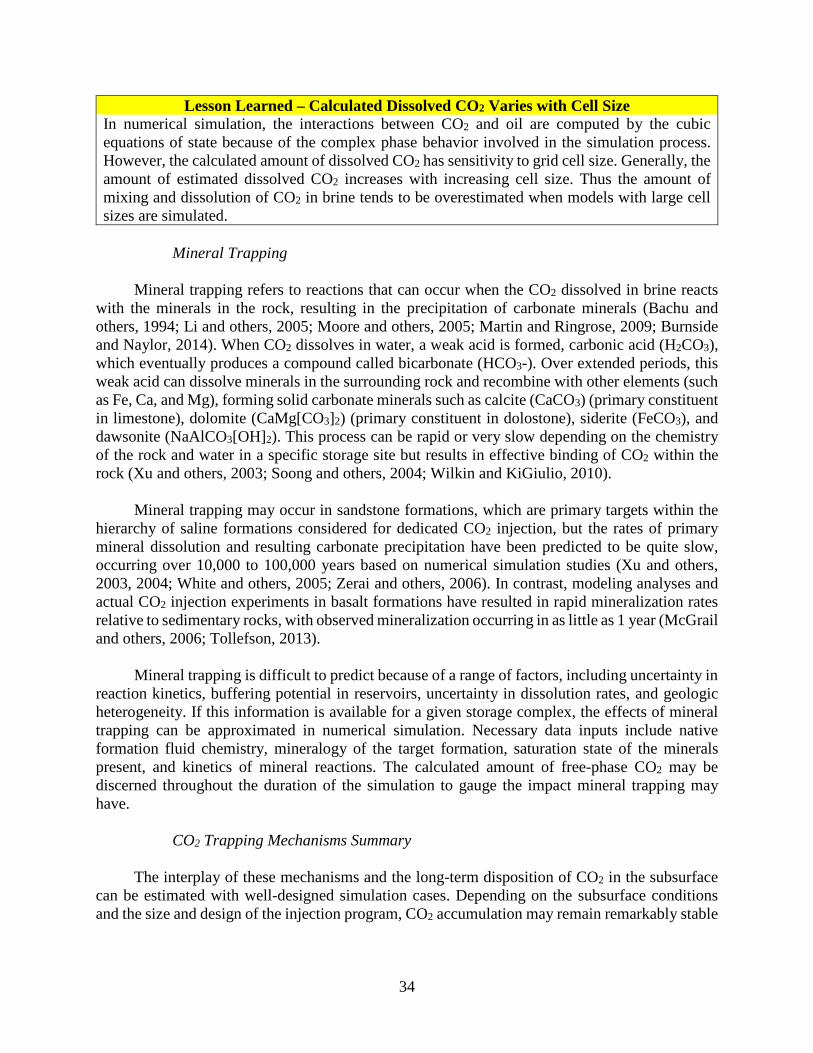
permeable strata as the injection pressure gradients slowly dissipate. This process may continue for many years after the cessation of injection. Thus simulation forecasts should extend for many years beyond the end of injection to qualify the effectiveness of the trapping mechanisms and estimate the ultimate disposition of the accumulation. A minimum of 100 years of additional simulated time is recommended, and a much longer time may be needed until the accumulation is estimated to have become stable. Four trapping mechanisms are widely recognized to retain supercritical CO2 in deep formations: 1) structural and stratigraphic trapping, 2) residual trapping, 3) solubility/dissolution trapping, and 4) mineral trapping. The effects of structural and stratigraphic trapping occur most rapidly of the mechanisms listed, while mineral trapping is thought to occur over very long periods of time (in most cases). Figure 9 illustrates the relative importance of each of these mechanisms over time; however, the actual time frame for these mechanisms to take effect may be quite variable between scenarios and often has a great deal of associated uncertainty. Each of these mechanisms is discussed further in the sections below.
Figure 9. Conceptual Increase of CO2 trapping strength with time (modified from Intergovernmental Panel on Climate Change, 2005).
Structural and Stratigraphic Trapping Structural trapping occurs when buoyant forces immobilize injected CO2 against low-permeability seals within subsurface structures. CO2 may migrate laterally through permeable
26
strata below a sealing unit but vertical migration is inhibited, as CO2 is not able to overcome capillary forces in tight, water-saturated sealing units (Zhou and others, 2008; Birkholzer and others, 2009; Cavanagh and Wildgust, 2011; Bachu, 2015). Subtle structural character can have a rather significant impact on the migration and accumulation of gas in the subsurface. The idea of stratigraphic trapping deals with heterogeneity, both vertical and lateral, in which reservoir-quality rock transitions to impermeable facies, such as a structural updip pinch-out of a sandstone bed against underlying and overlying shale units. Stratigraphic traps may be formed through lateral facies migration during deposition, erosional truncation, natural hydrodynamics, and diagenesis (Gerard, 2009).
Numerical simulation will take into account the density (and buoyancy) of injected CO2. The
structural framework of a model will determine the effects of structural trapping. As mentioned in Section 5.2, a grid should be created to capture the reservoir and confining zones of interest within the anticipated project area. Accurate prediction of the effects of structural trapping requires cap rock to be included in simulation. Additionally, inclusion of cap rock in numerical simulation enables the effects of vertical brine egress through the cap rock to be quantified. As previously discussed, vertical migration of CO2 is inhibited by capillary forces in sealing units. However, the physical properties immobilizing CO2 do not apply to brine, which is able to migrate vertically through connected pore space, albeit at a rather slow pace. Accounting for this in simulation is important, as vertical brine egress from the reservoir may result in pressure dissipation, especially when considered over large areas and over long periods of time (Birkholzer and Zhou, 2009; IEA Greenhouse Gas R&D Programme, 2014).
Recommended Best Practice – Include Overlying Seal in Simulation A model grid should be created to capture the reservoir and confining zones of interest within the anticipated project area. Inclusion of cap rock in numerical simulation enables accurate prediction of the effects of structural trapping and also enables the effects of vertical brine egress through the cap rock to be quantified.
The distribution of petrophysical properties within a model, most importantly permeability, will determine the effects of stratigraphic trapping during numerical simulation. Similar to the effects described above related to inhibition of vertical CO2 migration by cap rock permeability and capillary barriers, a lateral transition from reservoir quality rock to poor- or nonreservoir facies will slow or terminate lateral migration. The effects of both structural and stratigraphic trapping should be given strong consideration in the design of CO2 storage projects. Other CO2 trapping mechanisms discussed below are important as well, but on different time scales. Structural and stratigraphic trapping will provide immediate assurance that CO2 will remain within the storage complex, but other trapping mechanisms may take tens to hundreds, even thousands, of years to take effect. This understanding underscores the importance of planning CO2 storage projects with careful consideration given to subsurface structure. Ideal scenarios, in terms of structural and stratigraphic trapping, include geologic examples of structural closure such as domes or anticlinal folds lacking pervasive faulting/fracturing.
27
Recommended Best Practice – Structural/Stratigraphic Trapping and Project Design The effects of both structural and stratigraphic trapping should be given strong consideration in the design (e.g., well placement) of CO2 storage projects. Other CO2 trapping mechanisms are important as well but on different time scales. Structural and stratigraphic trapping will provide immediate assurance that CO2 will remain within the zone of interest and within the area of review. Conducting simulations with varying design parameters will allow optimization of storage security under the effects of structural and stratigraphic trapping.
Case Study 2 – Structural and Stratigraphic CO2 Trapping A model was created for a thin, clastic reservoir undergoing CO2 EOR to assess the effectiveness of structural and stratigraphic trapping mechanisms. The formation exhibited a relatively high degree of heterogeneity within the modeled area, including fluvial channel incision (removal of porous sandstone) which was subsequently infilled with shale and siltstone of the overlying seal. The porous sand (injection target) thinned to the east, pinching out along the eastern margin of the model. The reservoir had subtly dipping structure to the west, and CO2 migration under the effects of buoyancy (if present) was expected to occur in the eastward direction. Numerical simulations were conducted to better understand the long-term migration potential of the injected CO2. Figure 10 shows a series of gas per area maps developed from the simulation model at different time steps (0 [2017], 340, 640, and 1040 years). Only the reservoir interval is shown (overlying seal not shown). The white, curvilinear feature generally trending from northeast to southwest represents a permeability barrier where the reservoir sand has been eroded through fluvial incision. A hydraulic link exists near the center of the model, connecting the western and eastern regions of the model across this permeability barrier. While the overlying seal is not shown in Figure 10, the simulation results showed no unexpected vertical migration of injected CO2. The maps show CO2 remained within the reservoir, slowly migrating updip (to the east) over time. CO2 injected in the western region of the model is observed accumulating along the western margin of the permeability barrier, acting as an effective stratigraphic trap. A fraction of the CO2 in the western region of the model was able to migrate across this permeability barrier through the small communication bridge near the center of the model. The CO2 injected in the eastern region of the model migrated to the east, slowing as the reservoir sands thinned and reservoir quality deteriorated. The simulation results have provided confidence that injected CO2 will remain indefinitely within the storage complex under the effects of structural and stratigraphic trapping. Residual CO2 trapping (discussed in the following section) was also included in this investigation; however, the effects of other types of CO2 trapping mechanisms (solubility and mineral trapping) were not considered but would be expected to only further decrease CO2 migration.
Continued on next page
28
Residual CO2 Trapping Residual trapping occurs under the effects of relative permeability, resulting in immobilization of gas in the pore space. This process results in isolated “bubbles” of CO2 within the pores of the rock. Relative permeability is a concept used to describe individual fluid phase mobility when multiple fluid phases are present, while accounting for capillary pressure phenomena. CO2 may be trapped within the pore space of a permeable reservoir because of capillary force when two or more fluids coexist in the rock (i.e., CO2, oil, and/or water). Because the fluids interacting with injected CO2 tend to be different for dedicated and associated CO2 storage, the focus of relative permeability data used in simulation scenarios of each is also different. Liquid–gas relative permeability plays an important role in dedicated CO2 storage scenarios, as brine is the dominant liquid in the formation and CO2 functions as the gas phase in the fluid system. Understanding relative permeability between brine, oil, and gas phases is important in associated CO2 storage cases. Relative permeability data specific to numerical simulations of CO2 storage are often difficult to acquire. The basis for relative permeability characteristics is developed through laboratory core flooding experiments in which fluid saturations are varied, with the results depending on the specific fluid compositions considered, the properties and quantities/ratios of the mineralogic constituents, pore size, pore shape, pore connectivity, and wettability. Results are developed for a range of fluid saturations, and a curve is fit to a graphical display of the data. This
Figure 10. Gas per area maps developed from numerical simulation at different time steps after injection ceased (0 [2017], 340, 640, and 1040 years).
29
testing is generally difficult and expensive and yields results with a relatively high degree of associated uncertainty. However, the data are important to modeling efforts of oil and gas operators, making availability of relative permeability data more likely for associated CO2 storage investigations. Relative permeability data for dedicated CO2 storage investigations often do not exist, as the types of formations in consideration for storage generally have little commercial value and, thus, are less likely to be targeted for analytical investigations. If relative permeability data are unavailable, generic relative permeability data or data from a similar type of formation (similar lithology and petrophysical characteristics) may be found in the literature and substituted (Bennion and Bachu, 2008). An additional complexity is that the shape of relative permeability curves may be different depending on the directionality of changing fluid saturations (drainage versus imbibition), termed relative permeability hysteresis. The replacement of in situ liquid by injected CO2 is termed drainage (nonwetting CO2 replaces the wetting liquid phase). Imbibition is simply the opposite, occurring when brine migrates back into the pore space as CO2 flows away (liquid phase replacing CO2). Hysteresis occurs under the effects of wettability and capillary pressure when CO2 is present. This is important to understand in investigations of CO2 storage, as the effect is usually pronounced when liquid and gas occupy the same system. Hysteresis may have direct implications to CO2 migration and the trapping of CO2 in the pore space (Burnside and Naylor, 2014). Figure 11 shows an example of relative permeability hysteresis data.
Recommended Best Practice – Hysteresis in Simulation Activities The shape of relative permeability curves may be different depending on the directionality of changing fluid saturations (imbibition versus drainage), termed relative permeability hysteresis. Hysteresis occurs under the effects of wettability and the effects of capillary pressure when CO2 is present. This is important to understand and integrate in numerical simulation investigations of CO2 storage, as the effect is usually pronounced when liquid and gas occupy the same system and may have direct implications to CO2 migration and residual trapping of CO2 in the pore space.
30
Figure 11. Relative permeability curves for CO2 in the drainage and imbibition processes showing a clear hysteretic effect.
Relative permeability curves are specified in numerical simulation. Simulated injection will result in increasing near-wellbore CO2 saturation accompanied by a decrease in brine saturation, in which case the fraction of the overall permeability available to CO2 increases. During simulated postinjection periods, CO2 continues migrating farther from the injection point, and the CO2 saturation will decrease (accompanied by an increase in brine saturation), in which case the fraction of the overall permeability available to CO2 decreases. As CO2 saturation decreases, a “residual” saturation will eventually be reached at which CO2 is effectively immobilized and, therefore, considered stabilized under the effects of residual CO2 trapping. However, CO2 injected into strata with simple dip structure may migrate away in the updip direction for hundreds to thousands of years before stabilizing under the effects of residual trapping. This lends greater support for conducting long-term postinjection simulations (a minimum of 100 years’ postinjection is suggested, as mentioned in Section 5.4.2) to gain an understanding of the vector (direction and rate) of any lateral migration.
31
Case Study 3 – Residual CO2 Trapping Long-term CO2 migration and the implications for storage security were investigated in numerical simulation efforts. This work considered the role of the relative permeability on the post-injection plume expansion. This assessment required assumptions of irreducible (“residual”) CO2 saturation. As injected CO2 disperses, CO2 saturation decreases until reaching this irreducible saturation, at which point the remaining CO2 is effectively immobilized. Figure 12 shows postinjection CO2 migration after 100 years while irreducible CO2 saturation end points of 0.2 and 0.3 are considered. Figure 12 shows that increasing irreducible CO2 saturation results in decreased lateral CO2 migration and containment of CO2 within a smaller area. While the two maps appear similar, small differences are noted in plume extent and saturation distribution within the plumes. In this case, an assumed irreducible CO2 saturation of 0.2 resulted in a CO2 plume extending approximately 1.5 miles from the injection well toward the southeast after 100 years, whereas assuming 0.3 for irreducible CO2 saturation resulted in a CO2 plume extending approximately 1.3 miles from the injection wells. Residual gas saturation assumptions often have a high degree of uncertainty. Measurements from rock samples may provide an initial estimate; however, residual gas saturation in the reservoir will vary with heterogeneity. Conducting numerical simulation sensitivity cases with varying residual gas saturations will provide information necessary for an AOR determination and optimal monitoring technology deployment and will contribute greater confidence in the long-term disposition of injected CO2.
Continued on next page
32
Figure 12. Postinjection CO2 plume extent after 100 years, assuming irreducible CO2 saturations of 0.2 (top) and 0.3 (bottom).
33
Solubility Trapping CO2 dissolves in other formation fluids when injected into a reservoir, the result of which is termed solubility trapping. Similar to residual trapping, solubility trapping may occur rapidly as CO2 contacts liquids. The primary benefit of solubility trapping is the negation of buoyant forces when free-phase CO2 is converted to solute in brine or oil. The solubility of CO2 depends on several factors, including temperature, pressure, salinity, and oil composition (if present). The solubility of CO2 in brine increases with decreasing temperature and/or salinity or increasing pressure. Diffusion results in migration of dissolved CO2 outward from the immediate contact zone, although this process is slow (Jin and others, 2016). The densities of oil and water increase when CO2 is dissolved in the fluids, which may create gravitational instability in the reservoir, leading to convective mixing of fluids. The mixing of fluids with differing dissolved CO2 content will further enhance the dissolution process in the long run (Szulczewski and others, 2013). CO2 dissolution is considered a significant trapping mechanism in DSFs, with potential to permanently store considerable amounts of CO2 (Bachu and Adams, 2003; Metz and others, 2005; Ampomah and others, 2016). CO2–oil interaction has been studied extensively by the petroleum industry. CO2 dissolution in oil is the primary mechanism for CO2 EOR, in which dissolved CO2 changes the oil’s physical properties, yielding important benefits to recovery. Through this process, oil swells with CO2 in solution, and oil viscosity is reduced, effectively increasing oil mobility (thus, oil recovery). However, the results of this process differ with changing pressure, oil composition, and impurities in the CO2 stream. Additionally, injection gas composition and schedule may change over time through operational practices (e.g., recycled gas injection). Another complication is posed by changing fluid saturations within the reservoir (decreasing oil saturation relative to water saturation). Within the oil phase specifically, the CO2 EOR process preferentially mobilizes “lighter” hydrocarbon species (short-chain hydrocarbons) in comparison to “heavier” hydrocarbon species (long-chain hydrocarbons) (Hawthorne and others, 2014). This results in changing oil composition over time. Therefore, understanding CO2 dissolution in oil is critical for successful CO2 flooding projects. Several correlations have been developed to calculate CO2 solubility in oil, including those of Simon and Graue (1965), Mehrotra and Svrcek (1982), Chung and others (1988), Emera and Sarma (2007), Al-Jarba and Al-Anazi (2009). In numerical simulation, the interactions between CO2 and oil are computed by the cubic equations of state because of the complex phase behavior involved in the simulation process. CO2 solubility in the aqueous phase is calculated using Henry’s Law (Mulliken and Sandler, 1980; Li and Nghiem, 1986; Computer Modelling Group, 2014). However, cell size has some effect on simulation results (discussed in Section 5.2 above); the calculated amount of dissolved CO2 does have sensitivity to grid cell size. Generally, the amount of calculated dissolved CO2 increases with increasing cell size. Thus the amount of mixing and dissolution of CO2 in brine tends to be overestimated when models with large cell sizes are simulated.
34
Lesson Learned – Calculated Dissolved CO2 Varies with Cell Size In numerical simulation, the interactions between CO2 and oil are computed by the cubic equations of state because of the complex phase behavior involved in the simulation process. However, the calculated amount of dissolved CO2 has sensitivity to grid cell size. Generally, the amount of estimated dissolved CO2 increases with increasing cell size. Thus the amount of mixing and dissolution of CO2 in brine tends to be overestimated when models with large cell sizes are simulated.
Mineral Trapping
Mineral trapping refers to reactions that can occur when the CO2 dissolved in brine reacts with the minerals in the rock, resulting in the precipitation of carbonate minerals (Bachu and others, 1994; Li and others, 2005; Moore and others, 2005; Martin and Ringrose, 2009; Burnside and Naylor, 2014). When CO2 dissolves in water, a weak acid is formed, carbonic acid (H2CO3), which eventually produces a compound called bicarbonate (HCO3-). Over extended periods, this weak acid can dissolve minerals in the surrounding rock and recombine with other elements (such as Fe, Ca, and Mg), forming solid carbonate minerals such as calcite (CaCO3) (primary constituent in limestone), dolomite (CaMg[CO3]2) (primary constituent in dolostone), siderite (FeCO3), and dawsonite (NaAlCO3[OH]2). This process can be rapid or very slow depending on the chemistry of the rock and water in a specific storage site but results in effective binding of CO2 within the rock (Xu and others, 2003; Soong and others, 2004; Wilkin and KiGiulio, 2010). Mineral trapping may occur in sandstone formations, which are primary targets within the hierarchy of saline formations considered for dedicated CO2 injection, but the rates of primary mineral dissolution and resulting carbonate precipitation have been predicted to be quite slow, occurring over 10,000 to 100,000 years based on numerical simulation studies (Xu and others, 2003, 2004; White and others, 2005; Zerai and others, 2006). In contrast, modeling analyses and actual CO2 injection experiments in basalt formations have resulted in rapid mineralization rates relative to sedimentary rocks, with observed mineralization occurring in as little as 1 year (McGrail and others, 2006; Tollefson, 2013). Mineral trapping is difficult to predict because of a range of factors, including uncertainty in reaction kinetics, buffering potential in reservoirs, uncertainty in dissolution rates, and geologic heterogeneity. If this information is available for a given storage complex, the effects of mineral trapping can be approximated in numerical simulation. Necessary data inputs include native formation fluid chemistry, mineralogy of the target formation, saturation state of the minerals present, and kinetics of mineral reactions. The calculated amount of free-phase CO2 may be discerned throughout the duration of the simulation to gauge the impact mineral trapping may have.
CO2 Trapping Mechanisms Summary The interplay of these mechanisms and the long-term disposition of CO2 in the subsurface can be estimated with well-designed simulation cases. Depending on the subsurface conditions and the size and design of the injection program, CO2 accumulation may remain remarkably stable
35
Case Study 3 – Solubility CO2 Trapping Numerical simulations including CO2 dissolution provide insight regarding the fate and stability of injected CO2. Removal of free-phase CO2 through dissolution reduces vertical migration potential due to buoyancy. Dissolved CO2 is also more likely to be mineralized through interaction with other dissolved solids (see following section discussing mineral trapping). Numerical simulation CO2 solubility sensitivity studies were conducted to investigate the factors affecting calculated CO2 solubility. Multiple cases were simulated with varying parameters, including grid cell size, salinity, and temperature. The effects of cell size on CO2 solubility were investigated by creating and simulating four models with the same volumetric extent but differing cell dimensions (139 m [456 ft], 250 m [820 ft], 417 m [1368 ft], and 1250 m [4101 ft]). The effects of temperature and salinity were investigated by assuming a base case with brine salinity of 20,000 mg/L total dissolved solids (TDS) and a temperature of 75.7°C (168°F) and comparing simulation results with models assuming higher brine salinities (100,000 mg/L and 200,000 mg/L TDS) and variations in temperatures (55.7°C [132°F] and 95.7°C [204°F]). The results of the CO2 solubility sensitivity studies are shown in Figures 13 and 14. Figure 13 shows calculated CO2 solubility generally increases with increasing grid cell dimensions. Large grid cells tend to overestimate injected CO2 plumes (and, therefore, dissolved CO2); smaller cells are able to better-match the injected CO2 saturation profiles and
Figure 13. Comparison of simulated dissolved CO2 for cases with different grid cell dimensions. Increasing cell size results in overestimation of dissolved CO2.
Continued on next page
36
over thousands of years or may migrate many miles in the subsurface. Naturally occurring CO2 reservoirs have existed in the deep subsurface for millions of years (Allis and others, 2001; White and others, 2005), demonstrating that, under the right conditions, engineered CO2 storage sites may contain CO2 in deep geologic formations for a very long time. However, ideal geologic conditions are not always present. Thus the potential for long-term free-phase CO2 trapping, dissolution, or movement must be assessed for any storage project.
Figure 14. Results of CO2 solubility sensitivity cases with varying salinity and temperature.
replicate interaction between the CO2 and brine. Salinity has an inverse relationship with CO2 solubility: increasing salinity results in lower CO2 solubility. Temperature also has an inverse relationship with CO2 solubility: increasing temperature results in lower CO2 solubility. And although results are not shown here, pressure holds a direct relationship with CO2 solubility: increasing pressure results in greater CO2 solubility. To reiterate the importance of understanding CO2 dissolution potential, conditions favorable for CO2 dissolution will result in more rapid stabilization of injected CO2. Dissolved CO2 may still migrate laterally with natural groundwater movement, but vertical migration due to buoyant force is eliminated. As the next section discusses, dissolved CO2 may be converted to carbonate minerals, trapping CO2 indefinitely. Thus numerical simulations incorporating CO2 dissolution may provide important information regarding CO2 containment within the storage complex and storage permanence.
37
6.0 STATE OF BEST PRACTICE
6.1 Modeling Modeling may be defined as the collation of characterization data into a 3-dimensional representation of the subsurface geology and hydrogeology of the storage site and surrounding area. Simulation refers to the quantitative prediction within a geologic model of the dynamic effects of CO2 injection, including migration of CO2 and other formation fluids; pressure and temperature effects; geomechanical and geochemical responses; and the long-term fate of injected CO2. Modeling and simulation can be undertaken at a variety of scales and levels of complexity and should be developed according to the fit-for-purpose philosophy that is central to AMA. A typical geologic (or static) model being constructed to support simulation of injection will depict the reservoir formation(s) and confining zones (seals) within the storage complex together with structural features such as dip, faults, fractures, and folds. The basis for construction of models is a combination of measured subsurface characteristics and geological interpretation. In the sedimentary rock sequences which invariably host dedicated and associated storage projects, geological interpretation would include knowledge of the typical spatial relationships between various rock types caused by relevant depositional processes. A key lesson learned through PCOR Partnership experience is that data availability to inform model construction, especially during early stages of a project, can vary widely between dedicated and associated storage projects. Dedicated storage projects that target deep saline formations often have sparse well coverage or other characterization data. In contrast, associated storage with CO2 EOR projects typically allows access to production history and an extensive network of well records. Uncertainty analyses may be conducted to express the level of confidence in a model’s structural framework, facies characteristics in interwell areas, and petrophysical property distributions. A series of realizations may be constructed and subjected to numerical simulation, providing a range of possible outcomes which may better inform project design and convey the likelihood of conducting a safe, effective, and successful CO2 storage operation.
6.2 Simulation Simulation is a valuable tool for supporting engineering judgement and decision-making processes such as technical and economic feasibility studies, optimization of operations, or development of effective MVA. A clear definition of objectives should always frame simulation efforts. The accuracy and reliability of simulation outputs depend heavily on the quality of data inputs, including the geologic model, so an understanding of underlying uncertainties is essential to constrain simulation results. Simulation forecasting is critical for estimation of the long-term disposition of the injected CO2. Four trapping mechanisms are widely recognized as having significant impact upon the subsurface migration, accumulation, and stabilization of injected CO2: 1) structural and stratigraphic trapping, 2) residual trapping, 3) solubility/dissolution trapping, and 4) mineral trapping. Simulations should extend for many years beyond the end of injection to qualify the
38
effectiveness of the trapping mechanisms that will eventually immobilize CO2 and estimate the ultimate disposition of the accumulation. A minimum of 100 years of additional simulated time is recommended, and a much longer time may be needed until the accumulation is estimated to have become stable.
6.3 Summary of Modeling and Simulation Lessons Learned
Lesson Learned – Modeling Data Availability Data availability to inform model construction can vary widely between dedicated and associated storage projects. Dedicated storage projects that target deep saline formations often have sparse well coverage and/or other characterization data. In contrast, CO2 storage scenarios associated with EOR projects typically allow access to production history and an extensive network of well records.
Lesson Learned – Model Upscaling
Cell size will most likely affect simulation results, such as saturation response and the injection rate profile. Conducting a cell size sensitivity analysis will assist in defining an acceptable degree of upscaling.
Lesson Learned – Calculated Dissolved CO2 Varies with Cell Size
In numerical simulation, the interactions between CO2 and oil are computed by the cubic equations of state because of the complex phase behavior involved in the simulation process. However, the calculated amount of dissolved CO2 has sensitivity to grid cell size. Generally, the amount of calculated dissolved CO2 increases with increasing cell size. Thus the amount of mixing and dissolution of CO2 in brine tends to be overestimated when models with large cell sizes are stimulated.
Recommended Best Practice – Preliminary Understanding
Information gathered from the site characterization program and incorporated into the static model provides an excellent way to gain understanding before any simulation work is begun. Previous knowledge about the reservoir and fluid characteristics will help to better plan the simulation work, select plausible simulation scenarios, and identify cost-effective courses of action at early phases of the project.
Recommended Best Practice – Conduct Uncertainty Analyses to Inform Project Design
Conducting uncertainty analyses will convey the level of confidence in a model’s structural framework, facies characteristics in interwell areas, and petrophysical property distributions. A series of realizations may be constructed and subjected to numerical simulation, providing a range of possible outcomes to better inform project design and convey the likelihood of conducting a safe, effective, and successful CO2 storage operation.
Recommended Best Practice – Initial Simulation of Dedicated Storage
Despite typically lacking operational data for history matching, simulation forecasting for initial assessment of dedicated storage should be undertaken. With reference to uncertainty analysis, such simulation work may be used to optimize project design.
39
Recommended Best Practice – Include Overlying Seal in Simulation A model grid should be created to capture the reservoir and confining zones of interest within the anticipated project area. Inclusion of cap rock in numerical simulation enables accurate prediction of the effects of structural trapping and also enables the effects of vertical brine egress through the cap rock to be quantified.
Recommended Best Practice – Structural/Stratigraphic Trapping and Project Design
The effects of both structural and stratigraphic trapping should be given strong consideration in the design (e.g., well placement) of CO2 storage projects. Other CO2 trapping mechanisms are important as well but on different time scales. Structural and stratigraphic trapping will provide immediate assurance that CO2 will remain within the zone of interest and within the area of review. Conducting simulations with varying design parameters will allow optimization of storage security under the effects of structural and stratigraphic trapping.
Recommended Best Practice – Hysteresis in Simulation Activities
The shape of relative permeability curves may be different depending on the directionality of changing fluid saturations (imbibition versus drainage), termed relative permeability hysteresis. Hysteresis occurs under the effects of wettability and the effects of capillary pressure when CO2 is present. This is important to understand and integrate in numerical simulation investigations of CO2 storage, as the effect is usually pronounced when liquid and gas occupy the same system and may have direct implications to CO2 migration and residual trapping of CO2 in the pore space.
7.0 REFERENCES Al-Jarba, M., and Al-Anazi, B.D., 2009, A comparison study of the of the CO2-oil physical
properties—literature correlations accuracy using visual basic modeling technique: Oil and Gas Business, May 30.
Allis, R., Chidsey, T., Gwynn, W., Morgan, C., White, S., Adams, M., and Moore, J., 2001, Natural CO2 reservoirs on the Colorado Plateau and southern Rocky Mountains—candidates for CO2 sequestration, in 1st National Conference on Carbon Sequestration: Washington, D.C., May 14–17, 2001, Proceedings: U.S. Department of Energy National Energy Technology Laboratory.
Ampomah, W., Balch, R., Cather, M., Rose-Coss, D., Dai, Z., Heath, J., Dewers, T., and Mozley, P., 2016, Evaluation of CO2 storage mechanisms in CO2 enhanced oil recovery sites—application to Morrow sandstone reservoir: Energy & Fuels, v. 30, no. 10, p. 8545–8555.
Ayash, S.C., Nakles, D.V., Peck, W.D., Sorensen, J.A., Glazewski, K.A., Aulich, T.R., Klapperich, R.J., Azzolina, N.A., and Gorecki, C.D., 2016, Best practice for the commercial deployment of carbon dioxide geologic storage—adaptive management approach: Plains CO2 Reduction (PCOR) Partnership Phase III draft Task 13 Deliverable D102/Milestone M59 for U.S. Department of Energy National Energy Technology Laboratory Cooperative Agreement No. DE-FC26-05NT42592, Grand Forks, North Dakota, Energy & Environmental Research Center, August.
40
Bachu, S., 2015, Review of CO2 storage efficiency in deep saline aquifers: International Journal of Greenhouse Gas Control, v. 40, p. 188–202.
Bachu, S., and Adams, J.J., 2003, Sequestration of CO2 in geological media in response to climate change—capacity of deep saline aquifers to sequester CO2 in solution: Energy Conversion and Management, v. 44, no. 20, p. 3151–75.
Bachu, S., Gunter, W.D., and Perkins, E.H., 1994, Aquifer disposal of CO2 – hydrodynamic and mineral trapping: Energy Conversion and Management, v. 35, no. 4, p. 269–279.
Bell, J.B., and Shubin, G.R, 1985, Higher-order Godunov methods for reducing numerical dispersion in reservoir simulation: SPE 13514, p. 179.
Bennion, D.B, and Bachu, S., 2008, Drainage and imbibition relative permeability relationships for supercritical CO2/brine and H2S/brine systems in intergranular sandstone, carbonate, shale and anhydrite rocks: SPE Reservoir Evaluation & Engineering, v. 11, no. 03, p. 687.
Birkholzer, J.T., and Zhou, Q., 2009, Basin-scale hydrogeologic impacts of CO2 storage—capacity and regulatory implications: International Journal of Greenhouse Gas Control, published online on 8/8/2009, DOI: 10.1016/j.ijggc.2009.07.002.
Birkholzer, J.T., Zhou, Q., and Tsang, C.F., 2009, Large-scale impact of CO2 storage in deep saline aquifers—a sensitivity study on pressure response in stratified systems: International Journal of Greenhouse Gas Control, v. 3, p. 181–194.
Burnside, N.M., and Naylor, M., 2014, Review and implications of relative permeability of CO2/brine systems and residual trapping of CO2: International Journal of Greenhouse Gas Control, v. 23, p. 1–11.
Canadian Standards Association, 2012, CSA Group Z741-12 geologic storage of carbon dioxide: Mississauga, Ontario, Canada, October.
Cavanagh, A.J., and Wildgust, N., 2011, Pressurization and brine displacement issues for deep saline formation CO2 storage: Energy Procedia, v. 4, p. 4814–4821, DOI:10.1016/j.egypro. 2011.02.447.
Chung, F.T., Jones, R.A., and Nguyen, H.T., 1988, Measurements and correlations of the physical properties of CO2-heavy crude oil mixtures: SPE Reservoir Engineering, v. 3, no. 3, p. 822–828.
Computer Modelling Group Ltd., 2014, WinProp. user guide—phase behavior & fluid property program, Version 2014.
Delprat-Jannaud, F., Korre, A., Shi, J.Q., McConnell, B., Arvanitis, A., Boavida, D., Car, M., Gastine, M., Grunnaleite, I., Bateman, K., Poulsen, N., Sinayus, C., Vähäkuopus, T., Vercelli, S., and Wójcicki, A., 2013, State-of-the-art review of CO2 storage site selection and characterisation methods, in Korre, A., McConnell, B., and Delprat-Jannaud, F., eds., CGS Europe Report No. D3.3: September, 116 p.
41
Emera, M.K., and Sarma, H.K., 2007, Prediction of CO2 solubility in oil and the effects on the oil physical properties: Energy Sources, Part A. v. 29, no. 13, p. 1233–1242.
Gerard, J., 2009, Stratigraphic traps—quantitative approach based upon a producing field database: American Association of Petroleum Geologists, Search and Discovery Article #40436, AAPG Annual Convention, Denver, Colorado, June 7–10.
Glazewski, K.A., Aulich, T.R., Wildgust, N., Nakles, D.V., Hamling, J.A., Burnison, S.A., Livers, A.J., Salako, O., Sorensen, J.A., Ayash, S.C., Pekot, L.J., Bosshart, N.W., Gorz, A.J., Peck, W.D., and Gorecki, C.D., 2017, Best practices manual (BPM) for site characterization: Plains CO2 Reduction (PCOR) Partnership Phase III draft Task 4 Deliverable D35 for U.S. Department of Energy National Energy Technology Laboratory Cooperative Agreement No. DE-FC26-05NT42592, Grand Forks, North Dakota, Energy & Environmental Research Center, March.
Global CCS Institute, 2017, www.globalccsinstitute.com/projects (accessed May 2017).
Hamling, J.A., Gorecki, C.D., Klapperich, R.J., Saini, D., and Steadman, E.N., 2013, Overview of the Bell Creek combined CO2 storage and CO2 enhanced oil recovery project: Energy Procedia, v. 37, p. 6402–6411.
Hawthorne, S.B., Miller, D.J., Gorecki, C.D., Sorensen, J.A., Hamling, J.A., Roen, T.D., Harju, J.A., and Melzer, S., 2014, A rapid method for determining CO2/Oil MMP and visual observations of CO2/oil interactions at reservoir conditions: Energy Procedia, v. 63, p. 7724–7731.
IEA Greenhouse Gas R&D Programme, 2014, CO2 storage efficiency in deep saline formations—a comparison of volumetric and dynamic storage resource estimation methods: 2014-09, October.
IEA Greenhouse Gas R&D Programme, 2012, Extraction of formation water from CO2 storage: 2012/12.
Intergovernmental Panel on Climate Change, 2005, IPCC special report on carbon dioxide capture and storage: Prepared by Working Group III of the Intergovernmental Panel on Climate Change, Metz, B., Davidson, O., de Coninck, H.C., Loos, M., and Meyer, L.A., eds., Cambridge University Press, Cambridge, United Kingdom and New York, NY, USA, 442 p.
Jin, L., Bosshart, N.W., Oster, B.S., Hawthorne, S.B., Peterson, K.J., Burton-Kelly, M.E., Feole, I.K., Jiang, T., Pekot, L.J., Peck, W.D., Ayash, S.C., and Gorecki, C.D., 2016, Bell Creek test site – simulation report: Plains CO2 Reduction (PCOR) Partnership Phase III draft Task 9 Deliverable D66 (Update 5) executive summary for U.S. Department of Energy National Energy Technology Laboratory Cooperative Agreement No. DE-FC26-05NT42592, Grand Forks, North Dakota, Energy & Environmental Research Center, August.
Li, Y.K., and Nghiem, L.X., 1986, Phase equilibria of oil, gas and water/brine mixtures from a cubic equation of state and Henry’s law: The Canadian Journal of Chemical Engineering, v. 64, no. 3, p. 486–496.
42
Li, S., Dong, M., Li, Z., Huang, S., Qing, H., and Nickel, E., 2005, Gas breakthrough pressure for hydrocarbon reservoir seal rocks—implications for the security of long-term CO2 storage in the Weyburn Field: Geofluids, v. 5, no. 4, p. 326–334.
Marini, L., 2006, Geological sequestration of carbon dioxide—thermodynamics, kinetics, and reaction path modeling: Elsevier, v. 11.
Martin, I., and Ringrose, P., 2009, Evaluating the impact of fractures on the long-term performance of the In Salah CO2 storage site: Energy Procedia, v. 1, no. 1, p. 2021–2028.
Mattax, C.C., and Dalton, R.L., 1990, Reservoir simulation, in SPE monograph series, v. 13: Society of Petroleum Engineers, 187 p.
McGrail, B.P., Schaef, H.T., Ho, A.M., Chien, Y-J., Dooley, J.J., and Davidson, C.L., 2006, Potential for carbon dioxide sequestration in flood basalts: Journal of Geophysical Research: Solid Earth, v. 111.B12.
Mehrotra, A.K., and Svrcek, W.Y., 1982, Correlations for properties of bitumen saturated with CO2, CH4 and N2, and experiments with combustion gas mixtures: Journal of Canadian Petroleum Technology, v. 21, no. 06.
Metz, B., Davidson, O., De Coninck, H., Loos, M., and Meyer, L., 2005, IPCC special report on carbon dioxide capture and storage: Intergovernmental Panel on Climate Change, Geneva (Switzerland), Working Group III, July 1.
Moore, J., Adams, M., Allis, R., Lutz, S., and Rauzi, S., 2005, Mineralogical and geochemical consequences of the long-term presence of CO2 in natural reservoirs—an example from the Springerville–St. Johns Field, Arizona, and New Mexico, USA: Chemical Geology, v. 217, no. 3, p. 365–385.
Mulliken, C.A., and Sandler, S.I., 1980, The prediction of CO2 solubility and swelling factors for enhanced oil recovery: Industrial & Engineering Chemistry Process Design and Development, v. 19, no. 4, p. 709–711.
Nunez-Lopez, V., 2013, Fundamentals of modelling CO2 movement underground: Presented at the Global CCS Institute, October 2, 2013, GCCC Digital Publication Series No. 13-23.
Oil and Gas Journal, 2014, 2014 worldwide EOR survey: www.ogj.com/articles/print/volume-112/issue-4/special-report-eor-heavy-oil-survey/2014-worldwide-eor-survey.html (accessed March 2017).
Peck, W.D., Battle E.P., Grove, M.M., and Glazewski, K.A., compilers and creators, 2016, Plains CO2 Reduction (PCOR) Partnership atlas (5th ed.): Prepared for the U.S. Department of Energy National Energy Technology Laboratory and the PCOR Partnership, Grand Forks, North Dakota, Energy & Environmental Research Center.
Saini, D., Braunberger, J.R., Pu, H., Bailey, T.P., Ge, J., Crotty, C.M., Liu, G., Hamling, J., Gorecki, C.D., Steadman, E.N., and Harju, J.A., 2012, Bell Creek test site – simulation report: Plains CO2 Reduction (PCOR) Partnership Phase III Task 9 Deliverable D66 for U.S. Department of Energy National Energy Technology Laboratory Cooperative Agreement
43
No. DE-FC26-05NT42592, EERC Publication 2013-EERC-01-12, Grand Forks, North Dakota, Energy & Environmental Research Center, August.
Simon, R., and Graue, D.J., 1965, Generalized correlations for predicting solubility, swelling and viscosity behavior of CO2-crude oil systems: Journal of Petroleum Technology, v. 17, no. 01, p. 102–106.
Soong, Y., Goodman, A.L., McCarthy-Jones, J.R., and Baltrus, J.P., 2004, Experimental and simulation studies on mineral trapping of CO2 with brine: Energy Conversion and Management, v. 45, no. 11.
Steadman, E.N., Anagnost, K.K., Botnen, B.W., Botnen, L.S., Daly, D.J., Gorecki, C.D., Harju, J.A., Jensen, M.D., Peck, W.D., Romuld, L., Smith, S.A., Sorensen, J.A., and Votava, T.J., 2011, The Plains CO2 Reduction (PCOR) Partnership—developing carbon management options for the central interior of North America: Energy Procedia, v. 4, p. 6061–6068.
Szulczewski, M.L., Hesse, M.A., and Juanes, R., 2013, Carbon dioxide dissolution in structural and stratigraphic traps: Journal of Fluid Mechanics. v. 736, p. 287–315.
Tollefson, J., 2013, Pilot projects bury carbon dioxide in basalt: Nature, v. 500, p. 18.
White, S.P., Allis, R.G., Moore, J., Chidsey, T., Morgan, C., Gwynn, W., and Adams, M., 2005, Simulation of reactive transport of injected CO2 on the Colorado Plateau, Utah, USA: Chemical Geology, v. 217, no. 3–4, p. 387–405.
Wilkin, R.T., and KiGiulio, D.C., 2010, Geochemical impacts to groundwater from geologic carbon sequestration—controls on pH and inorganic carbon concentrations from reaction path and kinetic modeling: Environmental Science & Technology, v. 44, no. 12.
Xu, T., Apps, J.A., and Pruess, K., 2003, Reactive geochemical transport simulation to study mineral trapping for CO2 disposal in deep arenaceous formations: Journal of Geophysical Research: Solid Earth, v. 108.B2.
Xu, T., Apps, J.A., and Pruess, K., 2004, Numerical simulation of CO2 disposal by mineral trapping in deep aquifers: Applied Geochemistry, v. 19, no. 6.
Xu, T., Apps, J.A., Pruess, K., and Yamamoto, H., 2007, Numerical modeling of injection and mineral trapping of CO2 with H2S and SO2 in a sandstone formation: Chemical Geology, v. 242, no. 3.
Xu, T., Zheng, L., and Tian, H., 2011, Reactive transport modeling for CO2 geological sequestration: Journal of Petroleum Science and Engineering, v. 78, no. 3.
Zerai, B., Saylor, B.Z., and Matisoff, G., 2006, Computer simulation of CO2 trapped through mineral precipitation in the Rose Run Sandstone, Ohio: Applied Geochemistry, v. 21, no. 2.
Zhou, Q., Birkholzer, J.T., Tsang, C.-F., and Rutqvist, J., 2008, A method for quick assessment of CO2 storage capacity in closed and semi-closed saline formations: International Journal of Greenhouse Gas Control, v. 2, no. 4, p. 626–639.