Understand the basis for International Financial Reporting Standards (IFRS).
Have a basic acquaintance with the differences between IFRS and U.S. Generally Accepted Accounting Principles (US GAAP), as well as with some of the challenges resulting from multiple financial rule sets.
Appreciate how the BI360 corporate performance management suite can be employed to manage the presentation of simultaneous financial statements and supporting reports under IFRS and U.S. GAAP.
Overview of International Financial Reporting Standards
International Financial Reporting Standards (IFRS) are an integrated set of authoritative
accounting pronouncements promulgated by the International Accounting Standards Board
(IASB). The IASB is an independent standard-setting body organized to “develop a single set of
high quality, understandable, enforceable and globally accepted International Financial
Reporting Standards (IFRS).”1
Among the advantages of a globally-applied set of high-quality accounting standards are the
following:
Increased comparability of company results and transparency in financial reporting.
Improved access to capital, as investors are not required to be well-versed in varying local Generally Accepted Accounting Principles (GAAP) to evaluate investment candidates. Also financial statements will be acceptable to different national exchanges without restatement.
Simplified financial reporting for multinational organizations since subsidiary statements will no longer require restatement from local GAAP prior to consolidation.
Lowered cost of financial reporting as a worldwide accounting staff may be flexibly assigned.
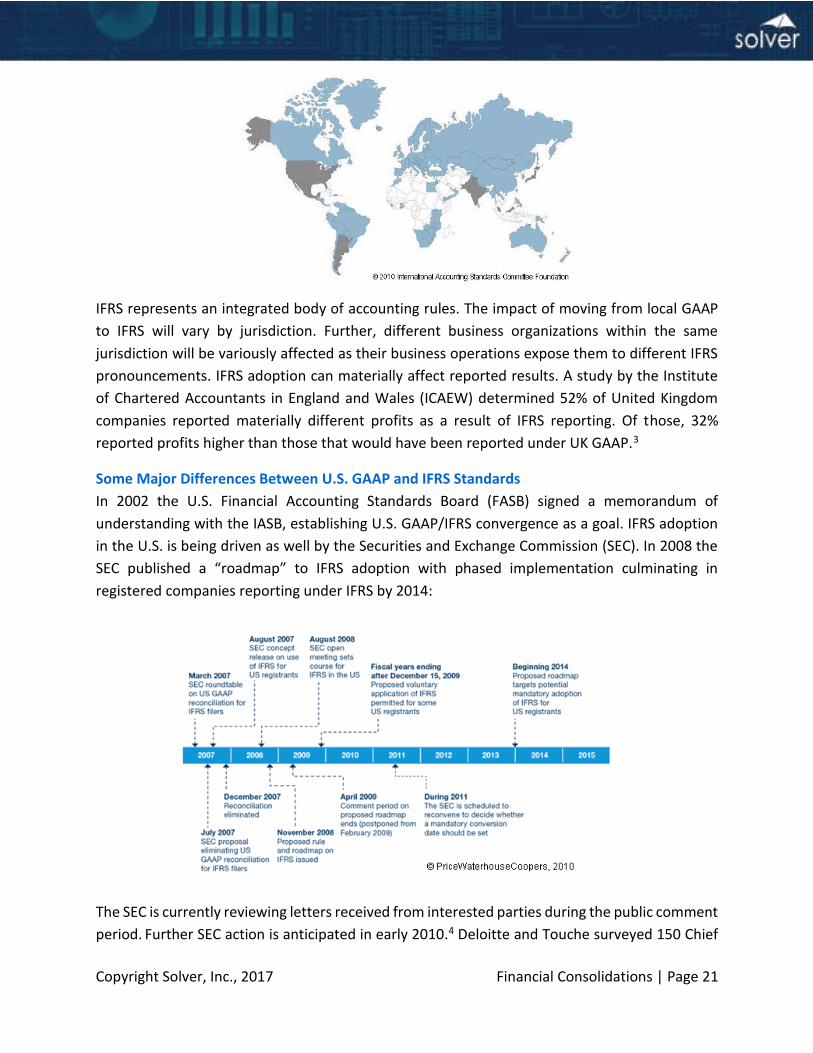
IFRS has substantial global momentum. Since 2001, almost 120 countries have required or
permitted the use of IFRS. In the figure below, blue areas indicate countries that require or permit
reporting under IFRS as of 2010; grey areas indicate countries seeking convergence with or
Financial Officers and other finance professionals in October 2009 and found that 70% supported
the adoption of IFRS based on the roadmap.5
A detailed discussion of the differences between U.S. GAAP and IFRS is well beyond the scope of
this paper. However, two general theoretical distinctions can be stated. First, IFRS tends to be
principle-based while U.S. GAAP is more rule-based. U.S. GAAP guidance most often relies on
precise definitions and thresholds, with deviations discouraged. IFRS pronouncements are more
frequently based on suggested standards with various optional presentations based on context.
Under IFRS, choices of presentation based on the preparers informed judgment should be
supported by documentation of the reasoning behind the judgment. This type of referential
documentation is less important under U.S. GAAP so long as the rules are followed.
Second, while U.S. GAAP favors historical valuations when available, IFRS supports fair-value
carriage. This can introduce added volatility into reported profitability since the fluctuations in
fair-values are generally reflected in the income statement. Debt covenants drafted under the
auspices of U.S. GAAP could be breeched as a direct result, or as a consequence of debt-equity
ratio effects.
Determining the specific requirements for an individual firm for presentation under IFRS will be
a major effort, requiring the attention of the finance and accounting function, auditors, specialist
advisors and tax preparers. Some major areas which will affect many firms include the following:
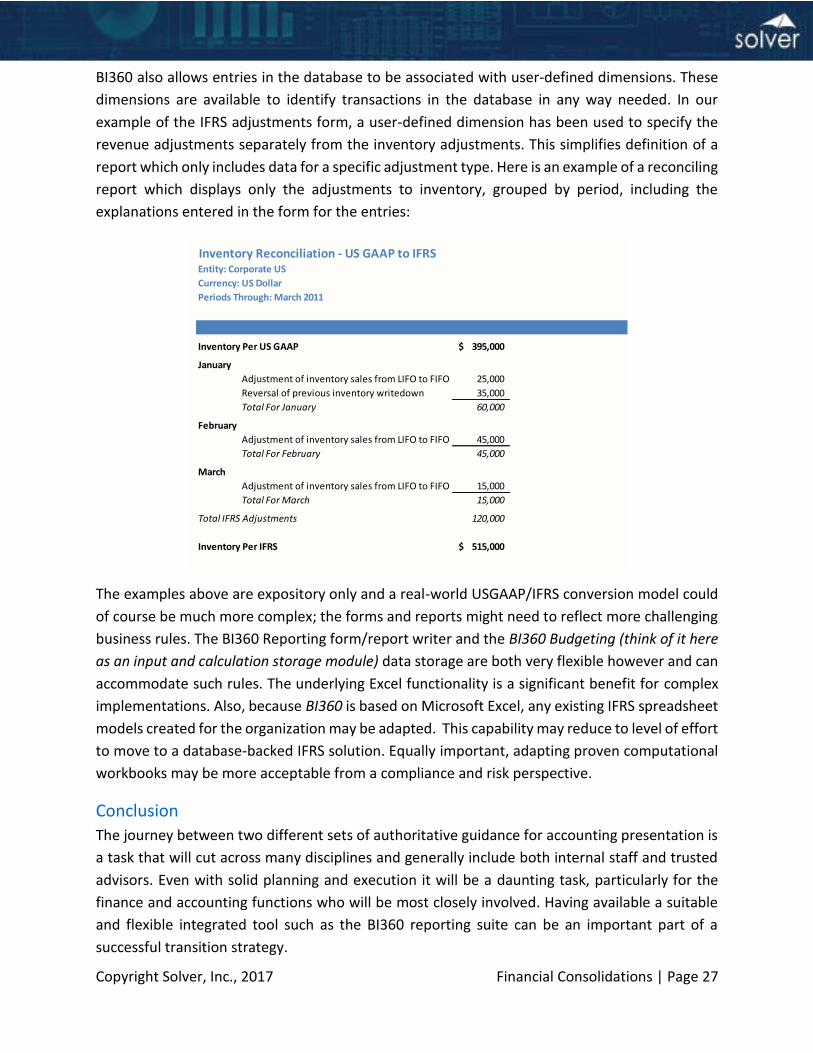
Revenue Recognition: For multi-period revenue contracts, U.S. GAAP is generally more conservative in allowing revenue to be recognized in prior periods compared to IFRS.
Inventory: Under U.S. GAAP, either the Last In, First Out (LIFO) or First In, First Out (FIFO) computation may be elected. IFRS does not allow LIFO, which will create additional reported income (and cash tax payments) for most U.S. firms that hold inventory. This is a significant area of controversy.6 In addition, inventory write-downs under U.S. GAAP are permanent; while IFRS inventory write-downs are reversible.
Leases: U.S. GAAP provides detailed technical guidance for classification of leases. These rules in turn allow the possibility of “synthetic” leases, which critics claim can create misleading balance sheets by inappropriately excluding liabilities. IFRS takes a more conceptual approach by classifying leases based on the substance of the agreement.
Consolidation: U.S. GAAP uses an economic benefit test to determine whether an entity should be consolidated. IFRS favors a control model to determine consolidation status.7 Therefore, Variable Interest Entities (VIE’s) and other units consolidated under U.S. GAAP may be presented separately under IFRS or vice versa.
Owner’s Equity: Various differences exist, for example U.S. GAAP allows shares with the put option feature to be carried in equity, while IFRS suggests a liability classification.
Most jurisdictions adopting IFRS have dictated a period of reconciled parallel presentation,
including both local GAAP and IFRS financial statements. A similar requirement will probably be
adjustment or complete replacement. For example, consider compliance testing for leases. If a
system is based on definite specifications used with U.S. GAAP “bright line” rules, and these rules
are replaced by conceptual principles under IFRS, significant revisions will be needed.9 Many
business function revisions will require support from information technology staff, so always
consider the potential impact these revisions will have on other IT projects as well.
Examples of IFRS Presentation Using BI360
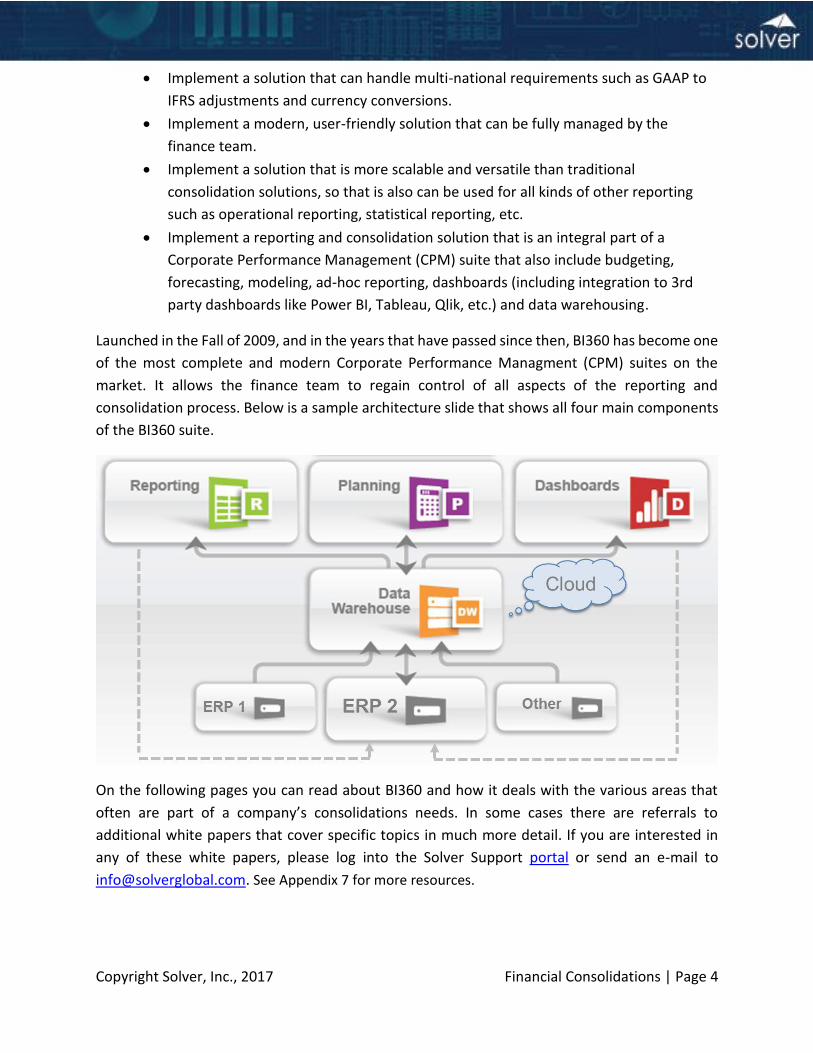
BI360 is a corporate performance management suite well suited to producing financial
statements in multiple accounting standards.9 BI360’s relevant features include:
Choice between cloud and on-premise deployment based on what fits the corporate consolidation process the best.
An Excel-based form and report writer which allows flexible implementation of required business logic.
Web portal for easy access and management of the overall BI360 application.
A dedicated relational Data Warehouse hosted on Microsoft’s SQL Server database. The Data Warehouse is preconfigured with separate modules including the general ledger.
A dimensional storage model for entries to the Data Warehouse fact table, including an unlimited number of transaction categories, which allows for different ways of classifying data. In addition to the preconfigured dimensions, the Data Warehouse supports up to 40 user-defined dimensions as well.
Automated currency and consolidation technology.
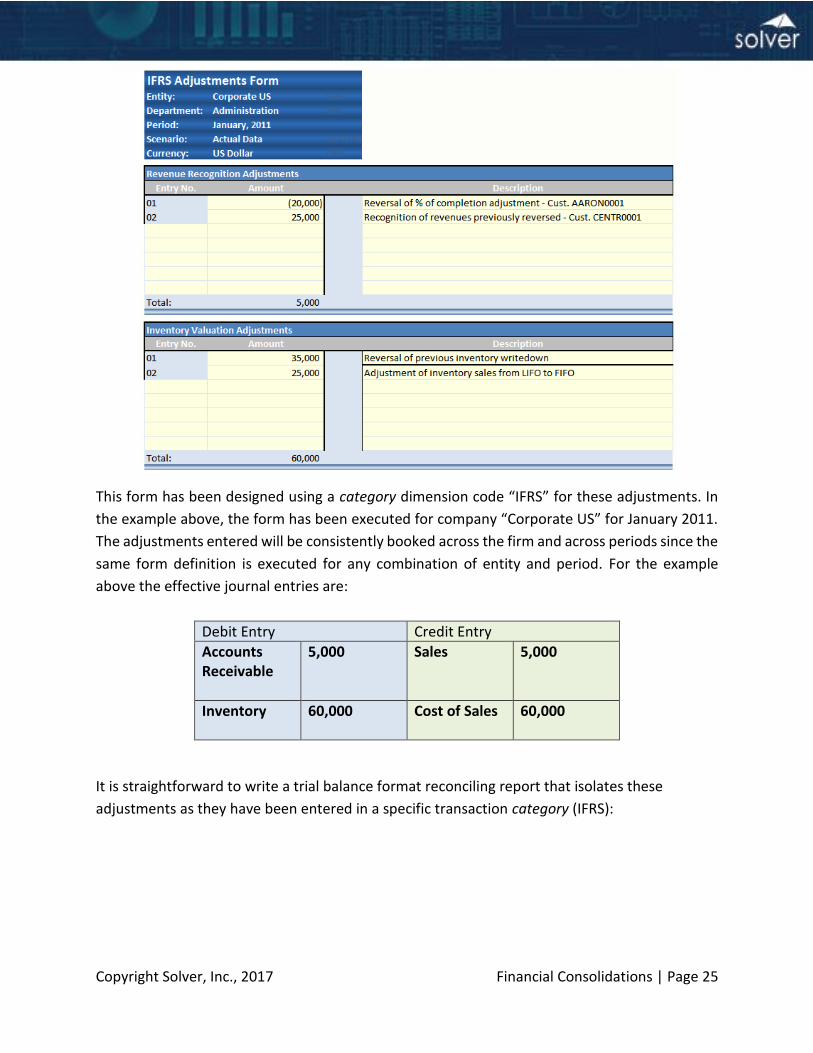
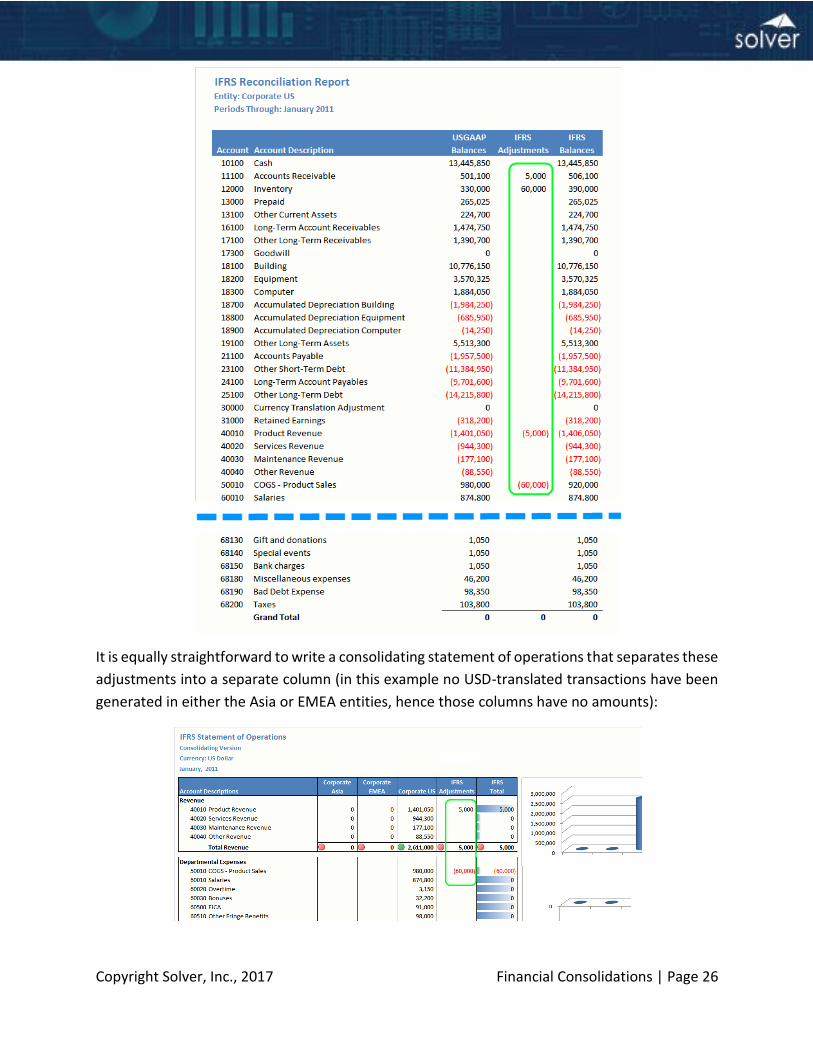
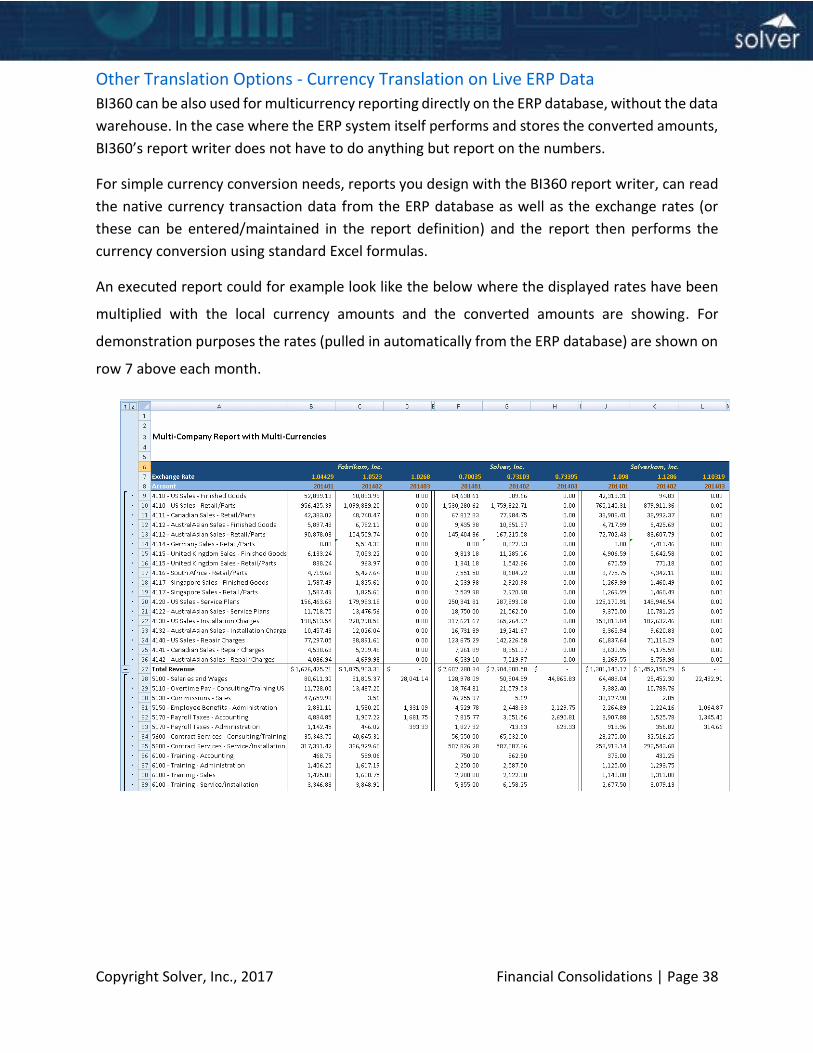
In the following example, a hypothetical organization requires two types of recurring
adjustments each period to restate U.S. GAAP results to IFRS. First, revenue recognition must be
adjusted to reflect the different principles under IFRS. This adjustment will affect a sales revenue
account, with an automated offsetting entry affecting accounts receivable. Second, inventory
must be adjusted to reflect differences between the two standards. This adjustment will affect a
specific inventory account, with the offsetting entry affecting cost of goods sold. Each adjustment
must include a supporting note to explain the reason for the adjustment. Here is an example of
a form which accomplishes these requirements, as it would appear to the user:
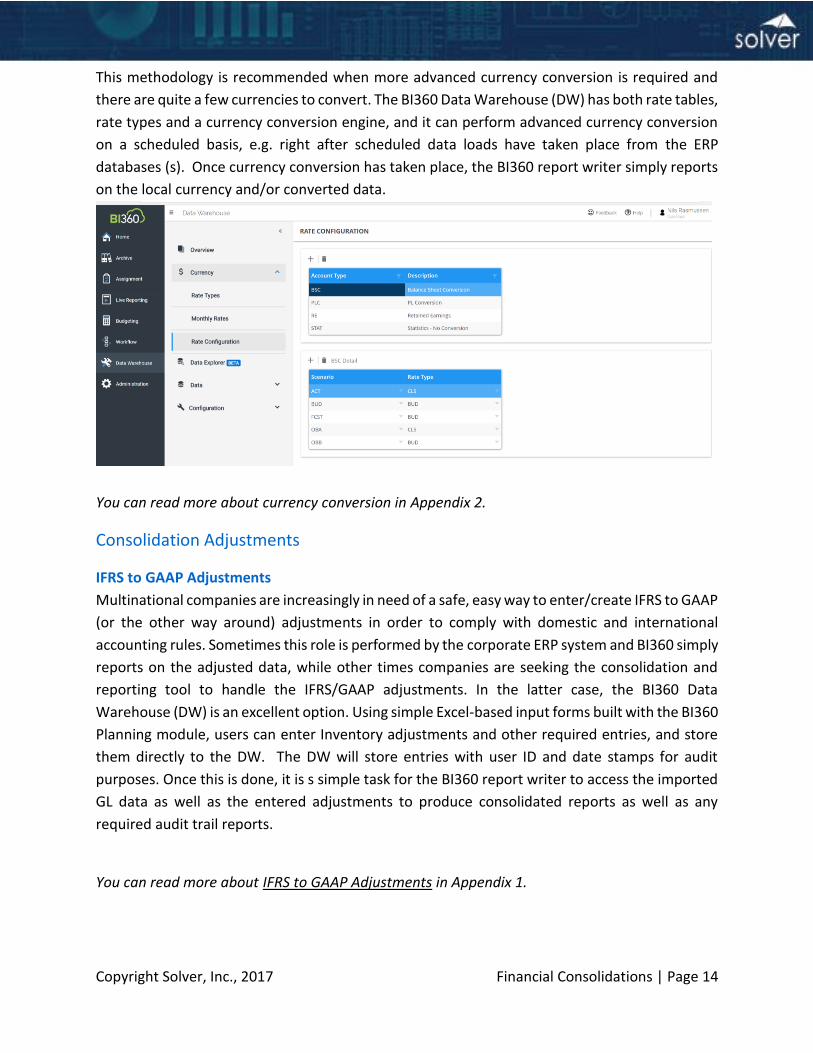
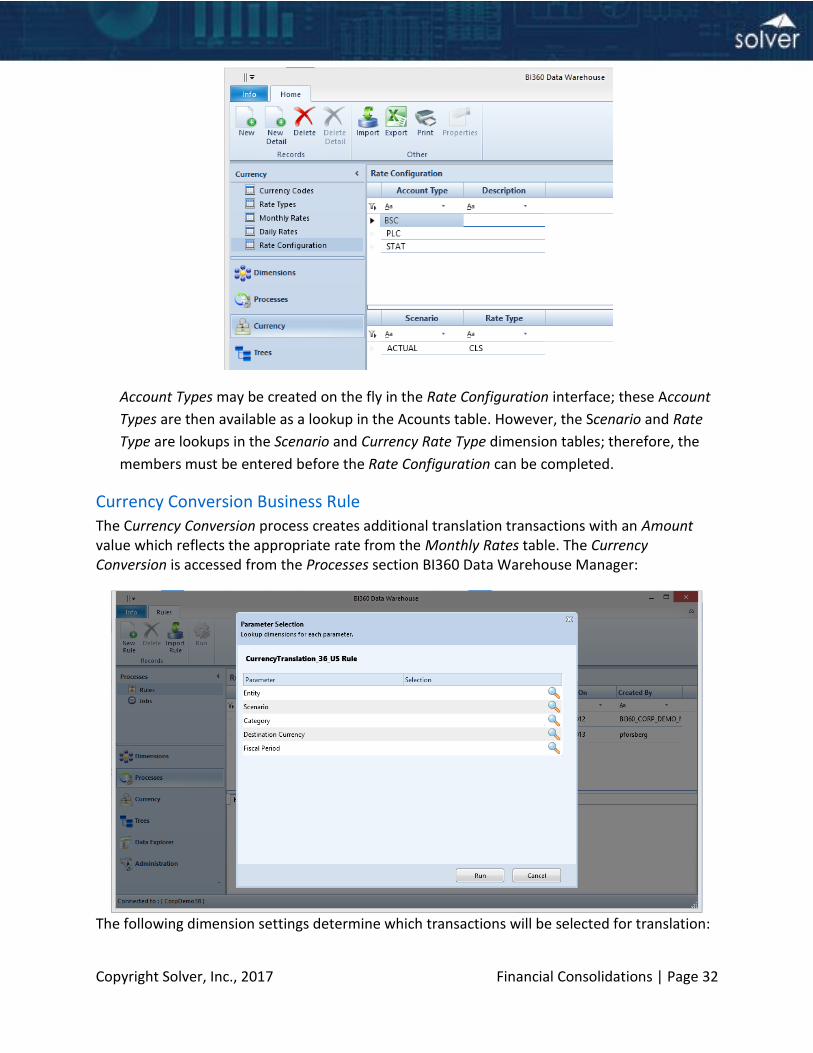
Account Types may be created on the fly in the Rate Configuration interface; these Account
Types are then available as a lookup in the Acounts table. However, the Scenario and Rate
Type are lookups in the Scenario and Currency Rate Type dimension tables; therefore, the
members must be entered before the Rate Configuration can be completed.
Currency Conversion Business Rule
The Currency Conversion process creates additional translation transactions with an Amount value which reflects the appropriate rate from the Monthly Rates table. The Currency Conversion is accessed from the Processes section BI360 Data Warehouse Manager:
The following dimension settings determine which transactions will be selected for translation:
Scenario (also used for the translation transactions).
Entity (also used for the translation transactions).
Period(s) (also used for the translation transactions).
Source Category
The following dimension settings determine two dimensions which are used for the target transactions:
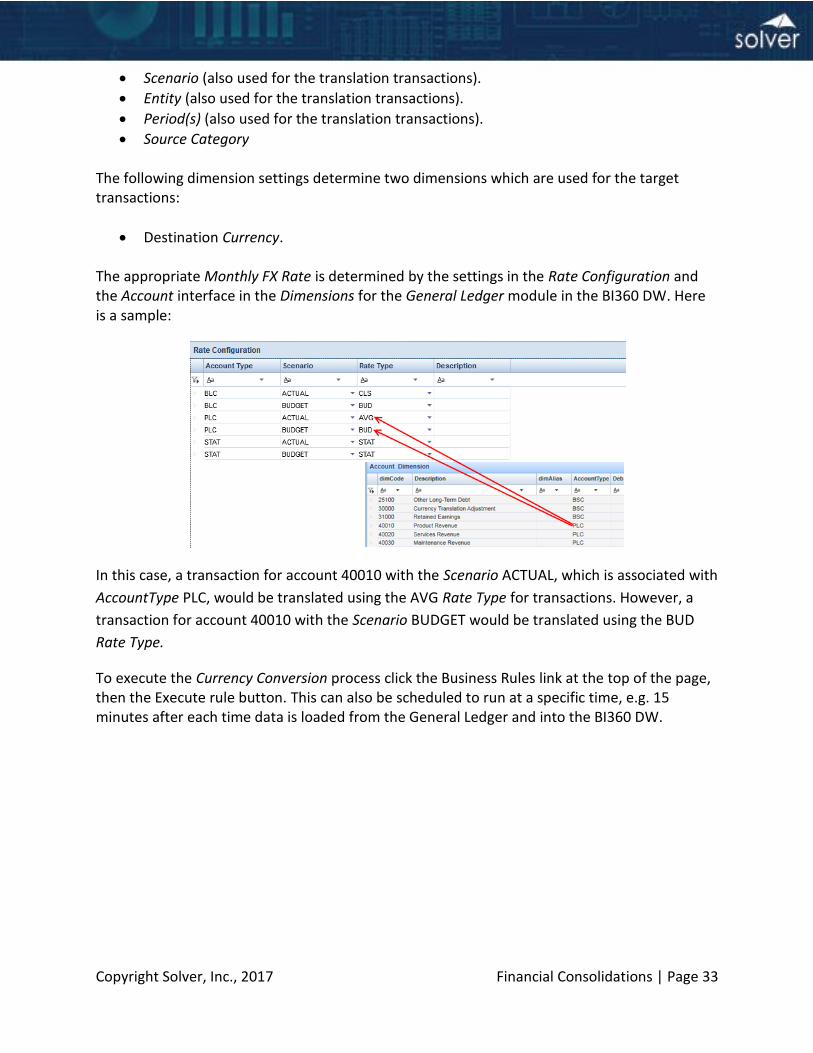
Destination Currency. The appropriate Monthly FX Rate is determined by the settings in the Rate Configuration and the Account interface in the Dimensions for the General Ledger module in the BI360 DW. Here is a sample:
In this case, a transaction for account 40010 with the Scenario ACTUAL, which is associated with
AccountType PLC, would be translated using the AVG Rate Type for transactions. However, a
transaction for account 40010 with the Scenario BUDGET would be translated using the BUD
Rate Type.
To execute the Currency Conversion process click the Business Rules link at the top of the page, then the Execute rule button. This can also be scheduled to run at a specific time, e.g. 15 minutes after each time data is loaded from the General Ledger and into the BI360 DW.
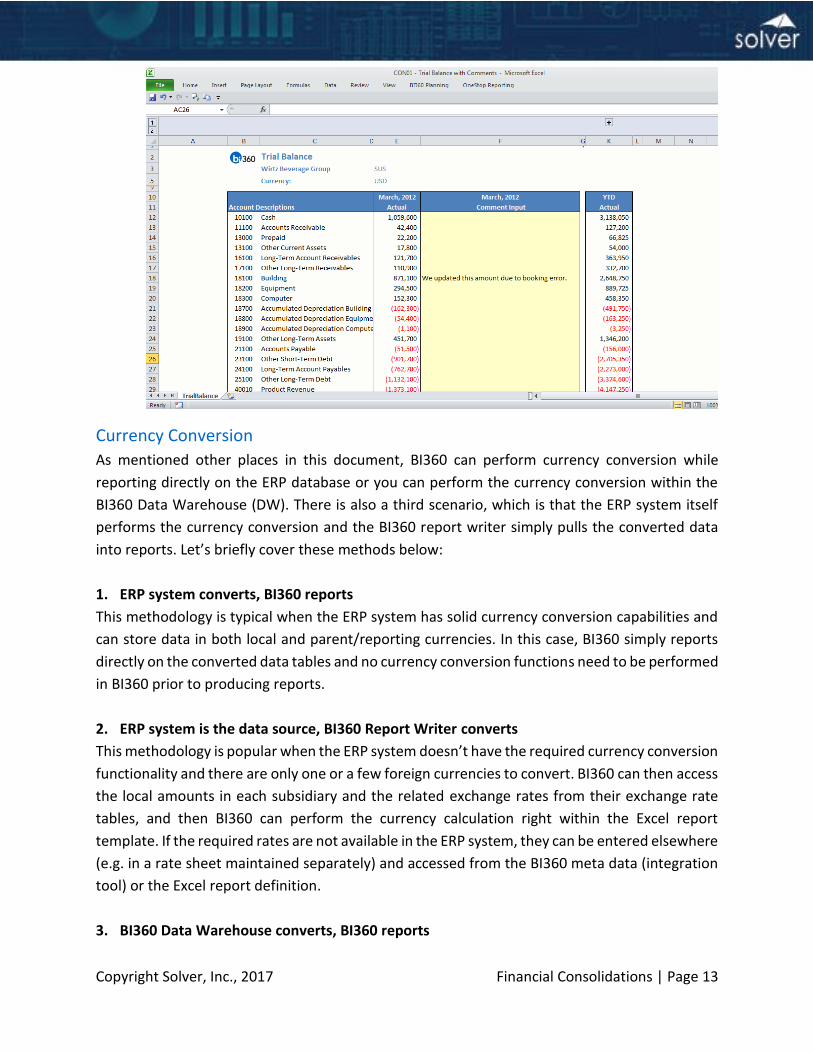
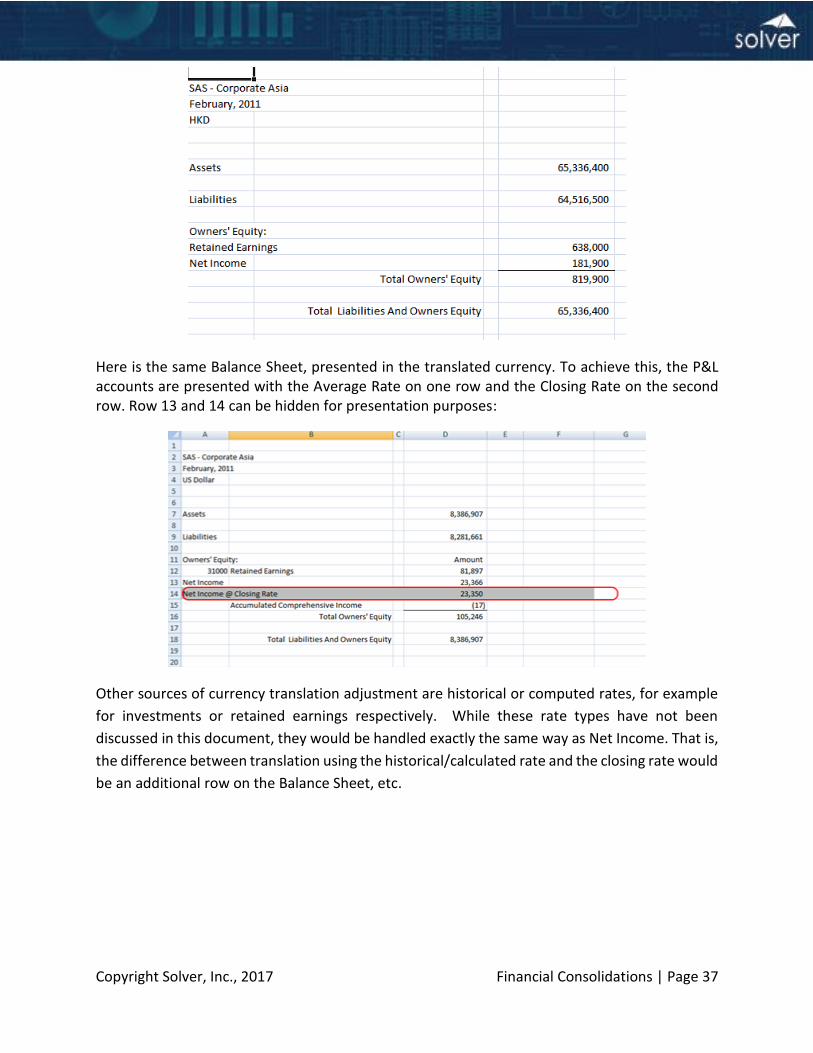
Here is the same Balance Sheet, presented in the translated currency. To achieve this, the P&L accounts are presented with the Average Rate on one row and the Closing Rate on the second row. Row 13 and 14 can be hidden for presentation purposes:
Other sources of currency translation adjustment are historical or computed rates, for example
for investments or retained earnings respectively. While these rate types have not been
discussed in this document, they would be handled exactly the same way as Net Income. That is,
the difference between translation using the historical/calculated rate and the closing rate would
BI360 provides a rigorous platform for the consolidation of financial statement information
originating from one or multiple ERP sources. BI360 relies on a multidimensional database model
to identify all reportable general ledger entries, based on Microsoft SQL Server (“MS SQL”) on-
premise and Microsoft Azure SQL in the cloud. BI360 separates the business logic for
consolidation models from the source data. Complete segregation is maintained between source
data, which cannot be overwritten after import, consolidation entries, and the consolidation
model, thus providing a transparent audit trail from the subsidiary books through final
consolidation. Additional strengths of BI360 include:
User access rights definable with complete granularity, enforced by the SQL Server database engine and the leading Microsoft Active Directory Standard.
Entries are explicitly identifiable by user and date/time.
Model specifications saved in SQL Server database tables as well as the data, promoting data integrity by allowing for a complete, seamless backup/restore regimen using standard technologies.
Explicit currency conversion rules definable by business unit and reporting period.
The advantages of BI360 as a tool for complex financial statement consolidation are especially
evident when compared to manual spreadsheet-based consolidation routines.
MS SQL Server as Database
The foundation of BI360’s capabilities as a tool for flexible and secure consolidations is the
Microsoft SQL Server (MS SQL) database (and Azure SQL in the cloud). MS SQL provides a robust
platform for transaction storage, as well as state-of-the-art security control. (The method by
which BI360 takes advantage of the MS SQL security framework is described further in the Data
Integrity section below.) Both the consolidation logic and data reside in MS SQL, allowing
standard backup and restore procedures to ensure high availability. BI360 stamps all entries into
the MS SQL database with time/date and user identification to further solidify the audit trail. The
date and user that created a transaction as well as date and user that changed a transaction is
tracked on every single transaction record and made available in audit reports.
Consolidation Model Specification in BI360
BI360 uses a multidimensional database model to store reportable transactions, with
transactions typically defined as trial balance level entries. Note: If desirable, journal Entry level
detail can also be loaded into the BI360 database. This technology results in a clear separation of
the individual entities’ data from the business logic required for the consolidation, and from the
resulting consolidated data. Transactions included in the BI360 database as reportable events are
Appendix 4 - Typical Steps in the Setup of a Consolidation Model The purpose of this appendix is to provide Power Users/Administrators with an idea of the major steps in setting up and managing BI360 for consolidations.
Note: This appendix is not meant as a “training manual” for any of the BI360 modules, but rather it is meant to describe specific activities related to Financial Consolidations. Before you begin, please download the BI360 Data Warehouse manual. Please visit support.solverusa.com for user manuals, white papers and training videos for the different BI360 modules.
Key BI360 Modules for Consolidations
For consolidation models, the key BI360 modules are:
1. BI360 Data Warehouse -Interface to manage database, transactions, rates, scripts, etc.
2. BI360 Reporting - For designing and running reports.
3. BI360 Budgeting - For input of data like adjustments, manual eliminations, comments, etc. This module is only needed if your consolidation process requires manual data entry or storing of data calculated in reports, such as allocations.
Getting ready to set up BI360 for Consolidations
Here are some tips for items you want to have ready before you start setting up BI360 as a Financial Consolidation solution:
1. Decide on Your Chart of Accounts:
a. Do you have a single chart of accounts for all companies?
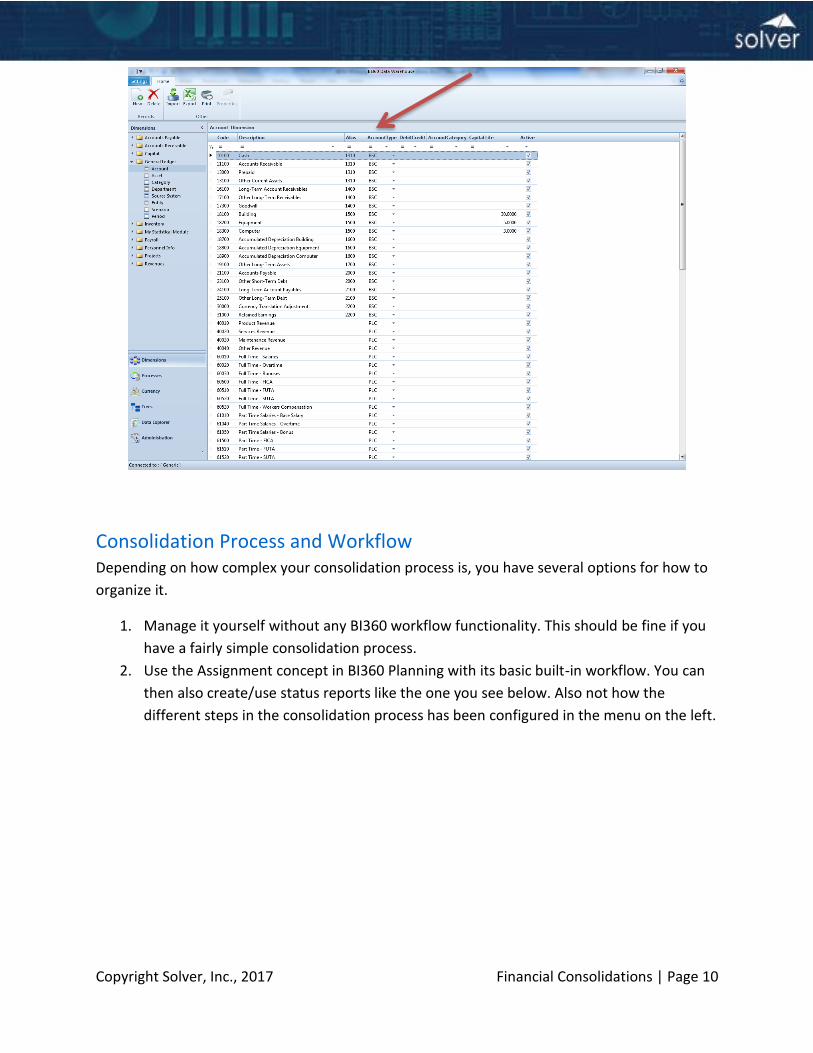
b. Or…do you have different chart of accounts in your subsidiaries and require to map them into a Corporate (or “consolidated”) chart of accounts? If so, then prepare (e.g. in an Excel spreadsheet) the exact mapping of accounts from subsidiaries into Corporate chart of accounts you plan to use in BI360.
2. Review other Dimension Codes:
If you have other dimension codes that you do not consider to be part of your “Chart of Accounts” (such as departments, companies, etc.), will they remain the same in BI360 as in your ERP system or do they need mapping to “Corporate dimensions” used in your consolidation reports? If so, then prepare (e.g. in an Excel spreadsheet) the exact mapping of accounts from subsidiaries into Corporate chart of accounts you plan to use in BI360.
3. Document Your Consolidation Process:
a. Do you have CLEARLY defined consolidation process? If so, have this documented and ready.
b. If not, write it down in detail. If you plan to make changes to this process when you implement BI360, please describe your ideal process and consult with a BI360 expert if this process can be replicated in BI360 or it needs to be changed.
4. Data Integration:
a. Do you know exactly where your General Ledger data is coming from (database server and GL tables within that database) and if this data source(s) is available of direct integration to the BI360 Data Warehouse or it requires a file export/import process?
b. Will you only be bringing Monthly Trial Balances into the BI360 Data Warehouse or also GL Journal Entry level detail transactions?
5. User Security:
a. Make a list of all users that will be logging into BI360
b. For each user, write down what they will have access to. For example:
i. Which companies?
ii. Design reports or just run reports?
iii. Enter data (like manual eliminations)?
iv. Manage BI360 Data Warehouse (trees, exchange rates, elimination processes, etc.)?
6. Preparing for Report Design:
a. Make a list of all the reports required in your consolidation process
b. Group these reports into “must have” and “nice to have” reports
c. Gather examples or screenshots (or mock up in Excel) the desired report layouts
d. For each report layout, specify the business rule (i.e. account ranges or calculation) for each row in the report. Excel is excellent for this, if you already have your desired report layouts mocked up in Excel.
The purpose of the steps above is to make sure that, PRIOR TO THE BI360 IMPLEMENTATION START, you and your finance team have discussed, selected and documented the reports you need for consolidation in BI360, so that when you or your consultants start implementing BI360, you don’t have delays, confusion or re-work due to lack of good instructions/guidelines.
Depending on who is responsible for your BI360 implementation, write up a project plan so all involved personal know what the forthcoming activities are, who are responsible and related deadlines.
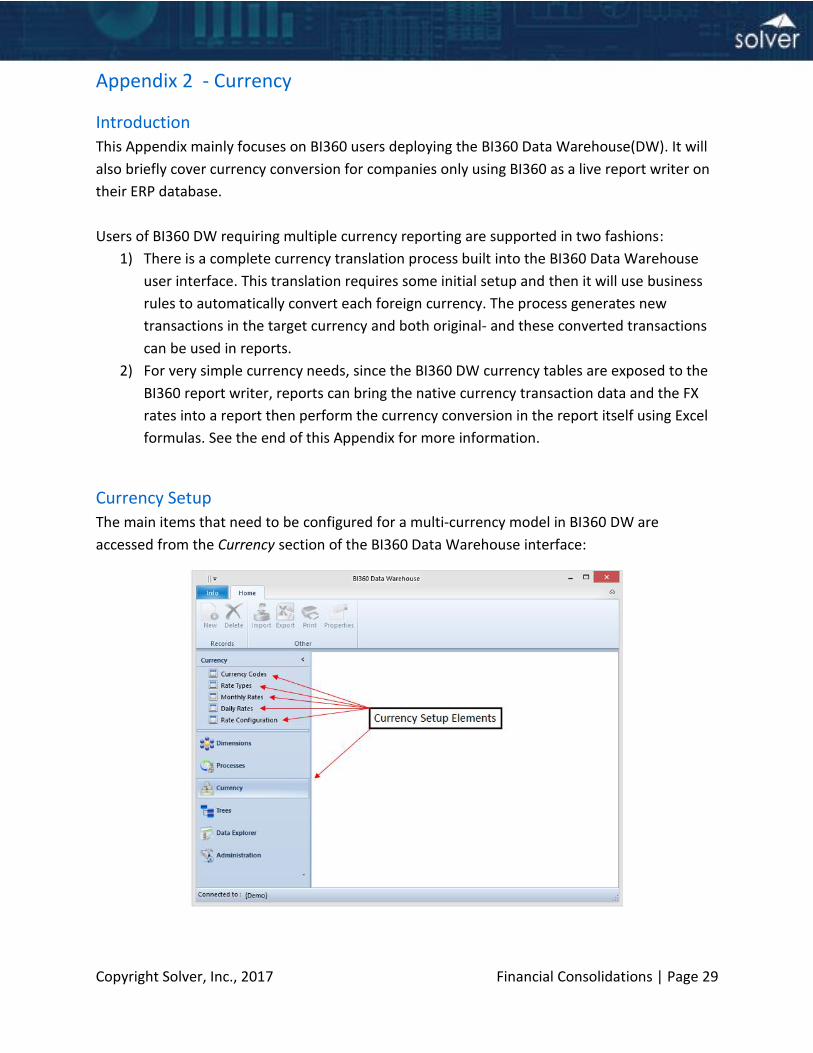
1. Configuring the BI360 Data Warehouse (BI360 DW)
Before you can put any type of data in the BI360 DW, you need to configure the DW. This is a completely non-technical task that you do using the BI360 DW user interface. In short, this is where you decide which DW modules to use (such as the GL module), which fiscal/calendar year concept to use for your consolidation, which dimensions to use in a module (i.e. in the GL module), which rate types (if you will use currency conversion) to use, etc. See the BI360 Data Warehouse user manual for more information.
2. Configuring the Consolidated Chart of Accounts
After BI360 has been installed, a typical first step in the actual implementation is to configure the Chart of Accounts in the BI360 Data Warehouse. There are several methodologies and options when it comes to the chart of accounts that companies use for consolidations (sometimes also referred to as the “Corporate chart of Accounts”):
Single chart of accounts used across all subsidiaries
This is the easiest situation. If all of your subsidiaries use the same chart of accounts, you will likely also want to use this same chart of accounts in the BI360 DW. In this case, you either include the chart of accounts as part of the automated data upload (ETL) to the BI360 DW or you import it from Excel or you enter it directly in the BI360 DW Manager interface. Different chart of accounts used by subsidiaries
If this is your situation, you have several options for how you want to handle this in BI360, all depending on what you think is easiest to manage by your staff:
a. Set up subsidiary to parent chart of accounts mapping inside the ETL tool i. Pros:
All mapping is in a single integration file/process. ii. Cons:
Most ETL tools (including Microsoft SSIS) are relatively technical and if there are new accounts in the subsidiaries that don’t fit any of the mapping rules that was set up in the ETL tool, then you need to have ETL expert update the ETL tool for you before data again can be correctly loaded to the BI360 DW
b. Set up subsidiary to parent chart of accounts mapping in Excel
With this option you set up a simple mapping schema in Excel (i.e. the first Excel column is the parent list of accounts and the next two columns list “From” and “To” accounts from the subsidiary. For example, in the parent column you list account 1010 and in the “From” and “To” columns you list account 00014 and 01150. This means that all accounts from 00014 to account 01150 should be aggregated into account
1010 in the BI360 DW and that will be the lowest level of detail for this item in your consolidated financial reports. The ETL tool (typically Microsoft SSIS) can then point to the Excel mapping file(s) as it loads a subsidiary’s GL data into the BI360 DW and handle the mapping as data is loaded into the BI360 DW.
i. Pros: Very easy for non-technical staff to manage account mapping since it is in
Excel. Also easy to push mapping process out to subsidiaries since they best know their own, local chart of accounts.
You keep the consolidated chart of accounts in the BI360 DW very simple and clean since you only will deal with one, single, chart of accounts in the DW, which also means that reports will be easier to write and faster than if you brought in all kinds of detailed accounts from each subsidiary.
ii. Cons: 1) You need to be aware of- and manage - the Excel files(s) so they are
always in the same location on the server and always updated.
c. Set up subsidiary to parent chart of accounts mapping inside the BI360 DW Manager
This means that you would load the chart of accounts from each of your subsidiaries into the BI360 DW, and manage the mapping inside BI360 using either attributes on the account dimension or Account Trees, where you drag drag and drop each subsidiary account up under each relevant consolidated account. In each case, whether you use account attributes or account trees for your mapping, you will be referring to these when you design BI360 reports. i. Pros:
2) Nice, non-technical interface (account attributes or trees) in the BI360 DW manager where a business user can configure the account mapping.
ii. Cons:
3) If you have a large number of different subsidiary chart of accounts, the account table in the BI360 can become very large (e.g. thousands of accounts) and thus the person responsible for the account mapping has to manage a large number of mappings (attributes or trees) and reports will run somewhat slower than if you had performed the mapping before (see two options for this above) the data is loaded into the BI360 DW.
3. Data Loading and Validation There are generally three types of data that is loaded to the BI360 DW:
I. GL Summary (Trial balances) per department or per Subsidiary – this is obviously required data in order to create financial consolidation reports
II. GL Detail (Journal Entry level GL transactions) – this is optional and typically only done by companies that want drill down in reports to go all the way to journal entries.
b. Exchange rates
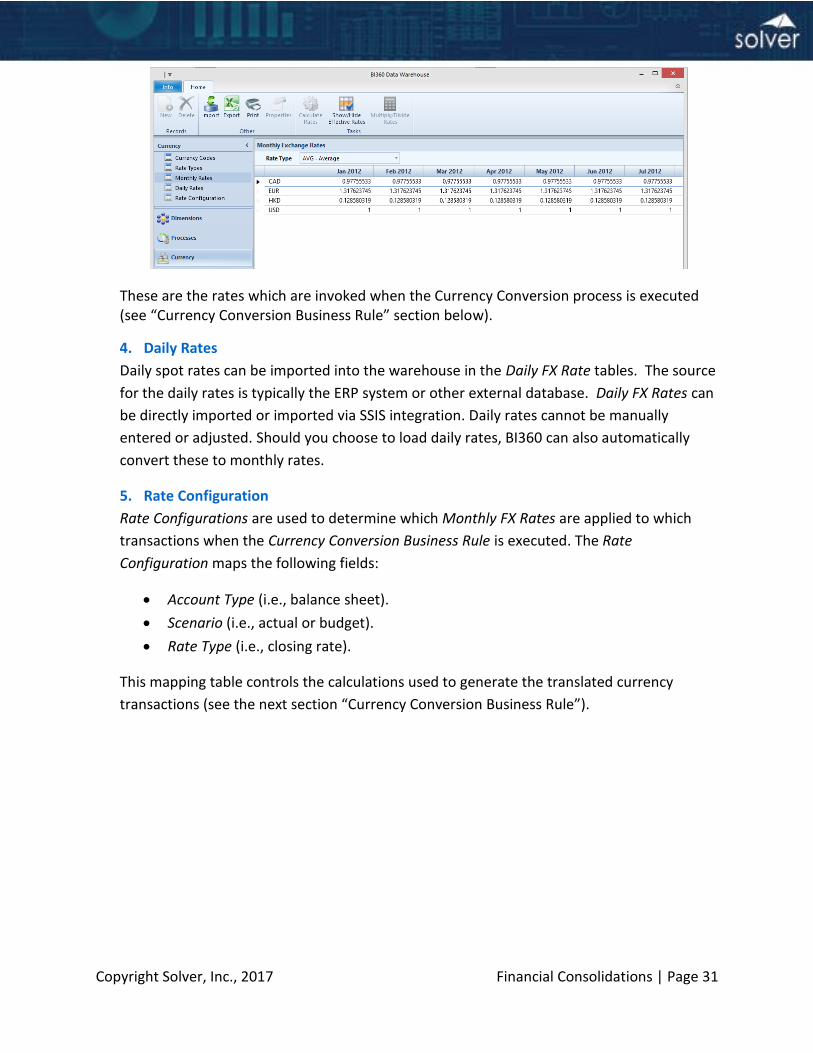
I. Monthly Average Rates
II. Month End rates
You can have as many rate types (Average, Closing, Budget, etc.) as you want in BI360. You can also load/enter monthly rates for the same currency that are different for different companies in that currency. Read the BI360 DW user manual for more information on this.
c. Dimensions
I. Dimension codes and descriptions (such as account codes/descriptions, company codes/descriptions).
II. Trees
i. These are usually not imported as it is usually quick and easy to design the trees inside the BI360 DW.
ii. However, imports from Excel are supported, and may be convenient in some cases. For example, large account trees which roll up multiple local charts of accounts into a single corporate chart of accounts may be easier to maintain in Excel then upload into BI360.
If you are loading rates form your ERP or other system that typically only stores DAILY rates, BI360 can automatically convert DAILY rates to MONTHLY rates and the BI360 DW Currency Module can store both daily and monthly rates. There are three different ways you can populate the BI360 DW with data:
1) Set up automated import using an ETL tool (like Microsoft SSIS, the BI360 ETL tool or the BI360 DW Connector wizards). If you are using SSIS and you need to understand the BI360 DW table schema, there is a BI360 Data Warehouse White Paper available on support.solverusa.com that describes the database structure.
2) Import data from Excel using the Import menus that exist in all the screens in the BI360 DW Manager. This method is sometimes the quickest and easiest, if some of your data only needs to be loaded once or such history from an old ERP system or budgets from a third party budget system that only is updated once per year. Other
reason to use file importing is if you are only creating a test or pilot model in the BI360 DW,
3) Enter data directly in the DW user interface (available for Dimensions, Exchange
Rates and Trees, while Transactions, such as GL data, has to be imported or you need to use the BI360 Budgeting module to set up Excel or Web input forms to enter data there).
4. Set up Account Dimension Attributes and Trees Once your dimension data (see prior paragraph) has been loaded into BI360, decide to use Account attributes or Account Trees (or both) to manage and simplify things like:
a. Mapping of subsidiary to parent accounts (discussed earlier in this document)
b. Grouping of accounts (e.g. grouping all Short Term asset accounts into a group called “Short Term Assets”). This will make reports faster to build, faster to run and require less or no maintenance in a report when you have new accounts in the future.
c. Creating consolidation trees for your companies (these will later be used in your consolidation reports. Entity trees must be configured if you are going to utilize BI360’s automated elimination or minority scripts. This is discussed in greater detail later in this document).
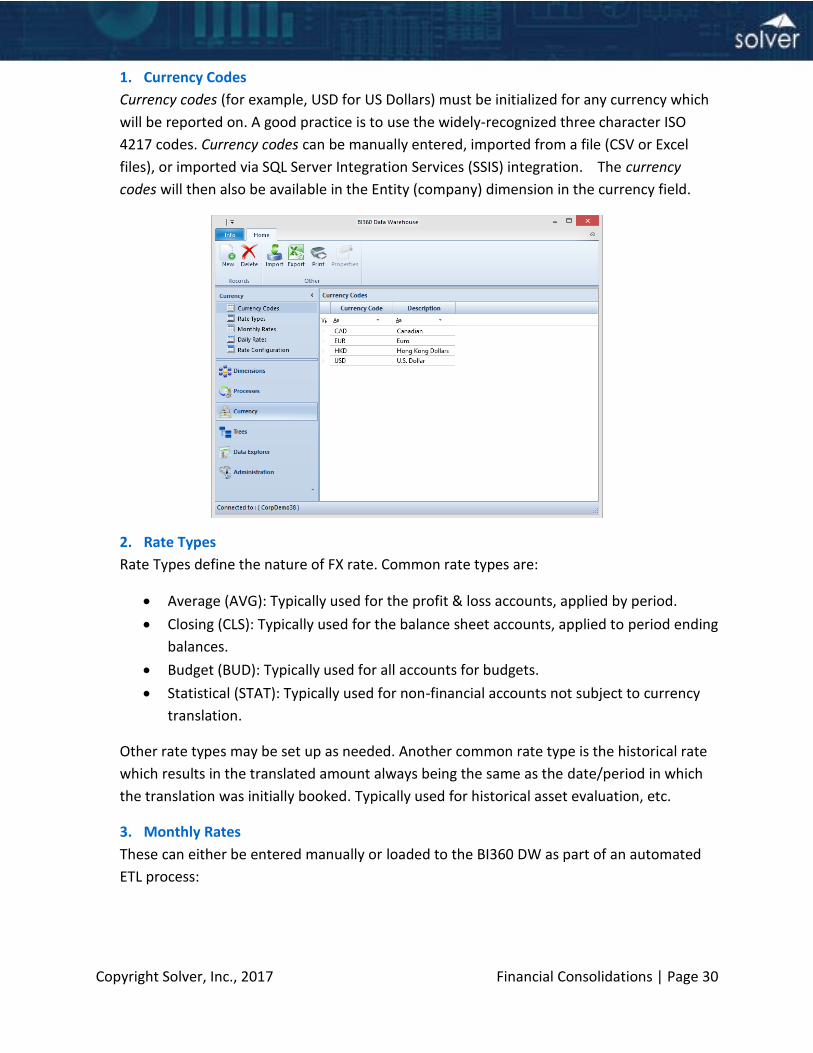
See the BI360 Data Warehouse User Manual for currency setup details and instructions on importing and running Process rules.
5. BI360 Consolidation Rules In BI360, rules are data handling procedures that are run from the Processes section of the Data Warehouse Manager. There are three BI360 consolidation rules: currency conversion, minority interest eliminations and intercompany activity eliminations. Running (or scheduling to run automatically) these rules in the BI360 DW Manager create transactions which can be used to create consolidated financial statements. These transactions are described in the following sections. To guarantee integrity in your BI360 Data Warehouse, the automated BI360 scripts must be executed in the following sequence:
1) Currency conversion. This script will delete any minority interest and intercompany activity transactions as well as any existing currency translation transactions in the selected periods.
2) Minority interest elimination calculation. This script will delete intercompany activity elimination transactions as well as any existing minority interest eliminations in the selected periods.
This script will only delete any existing intercompany activity elimination transactions in the selected periods.
4) Additional information regarding setup of the consolidation rules is contained in Appendix 2: Enabling BI360 Consolidation.
6. Setup Currency Conversion This setup is only required if you need BI360 to perform currency conversion. There are five steps to currency conversion setup:
1) Set up the Rate Types in the Currency section of the BI360 DW user interface.
2) Set up the Account Types and assign them to account codes in the account dimension in the BI360 DW user interface. As many Account Types as required may be created to map to the various types of accounts requiring translation (e.g., income statement accounts, balance sheet accounts, retained earnings accounts, historical rate accounts).
3) Map Rate Types and Scenarios in the Currency section of the BI360 DW user interface.
4) Loading or entering exchange rates (discussed earlier in this document) into the Currency section of the BI360 DW user interface.
5) Import the appropriate currency translation rule(s) into the Processes section of the BI360 Data Warehouse user interface. There are two standard rules available for BI360.
The first supports the general requirements for US GAAP and similar accounting standards. The data for all accounts is loaded with opening balances and periodic activity.
The second supports IFRS requirements. The data for all accounts is loaded with ending balances for the period.
This currency translation rule is available for download at support.solverusa.com at https://support.solverusa.com/index.php?/Knowledgebase/Article/View/489 . Additional information regarding setup of the consolidation rules is contained in “Appendix 2: Configuring BI360 Consolidation.”
See the BI360 Data Warehouse User Manual for currency setup details and instructions on importing Process rules.
This setup is only necessary if there are entities which are less than 100% owned (or controlled) by the parent. There are three steps to prepare for minority interest elimination calculations:
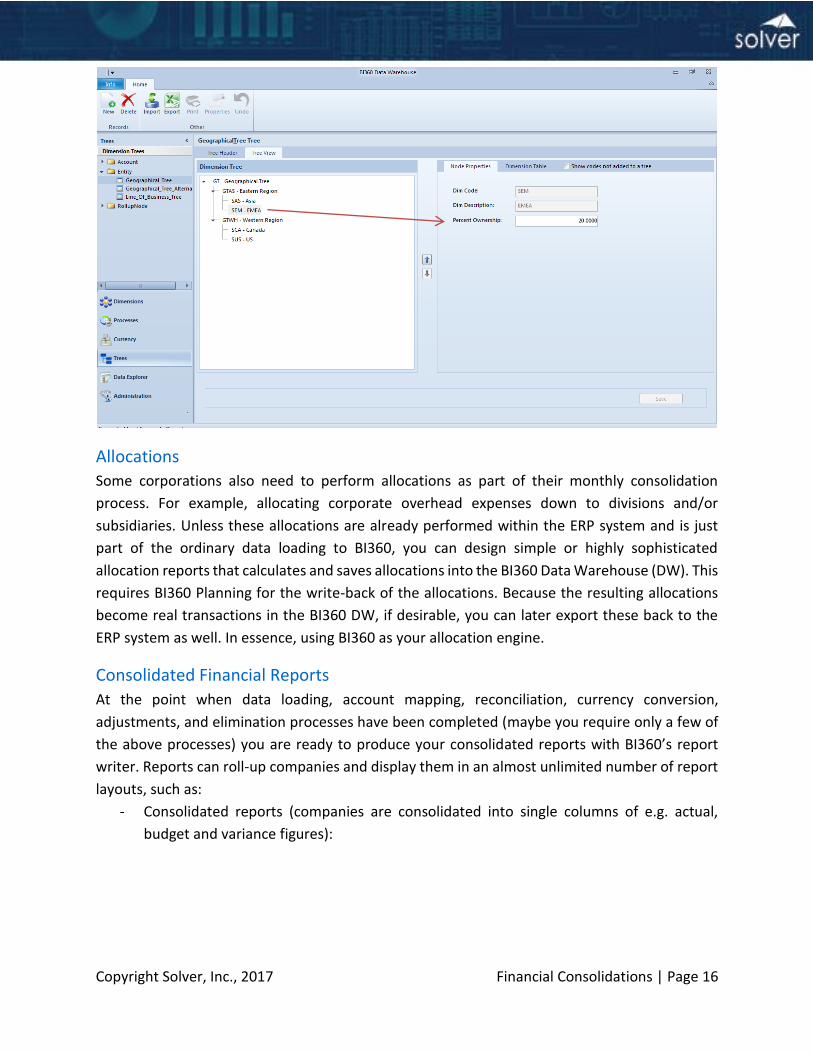
1) Set up an entity tree (or trees) in the Data Warehouse user interface that have nodes
set to less than 100% ownership. Minority interest eliminations are only calculated for transactions with entities represented in entity tree nodes with Percent Ownership set to less than 100%.
2) Enable the Tree and Minority Parent dimensions for the GL Summary module in the Data Warehouse user interface.
3) Import the minority interest elimination rule into the Processes section of the BI360
DW user interface. The rule is available for download at support.solverusa.com at https://support.solverusa.com/index.php?/Knowledgebase/Article/View/489.
Note: See the BI360 Data Warehouse User Manual for tree setup details and instructions on creating trees and importing Process rules. Additional information regarding setup of the consolidation rules is contained in “Appendix 6: Configuring BI360 Consolidation.”
8. Setup Intercompany Activity Elimination This setup is only necessary if there are entities within the organization which conduct business with each other that needs to be eliminated for consolidated reporting. There are four steps to prepare for intercompany activity elimination calculations:
1) Set up an entity tree (or trees) in the Data Warehouse user interface. Intercompany
elimination transactions are only calculated for transactions with both entity and corresponding entity.
2) Enable the Tree and Interco Parent dimensions for the GL Summary module in the Data Warehouse Manager.
3) Create or import transactions with the corresponding entity degenerate dimension populated. Corresponding entity identifies the counterparty entity in the organization for the transaction. For example, say that company A makes a loan to company B, and both company A and company B are subsidiaries in the same organization. Company A would book a loan receivable transaction with corresponding entity = B. Company B would book a loan payable with corresponding entity = A. When possible, the corresponding entity field should be populated when the base transactions are created in the data warehouse. If this is not practical, then a form can be used to populate corresponding entity.
4) Import the intercompany activity elimination rule into the Processes section of the BI360 Data Warehouse Manager. The rule is available for download at support.solverusa.com at https://support.solverusa.com/index.php?/Knowledgebase/Article/View/489.
See the BI360 Data Warehouse User Manual for tree setup details and instructions on creating trees and importing Process rules. Additional information regarding setup of the consolidation rules is contained in “Appendix 2: Configuring BI360 Consolidation.”
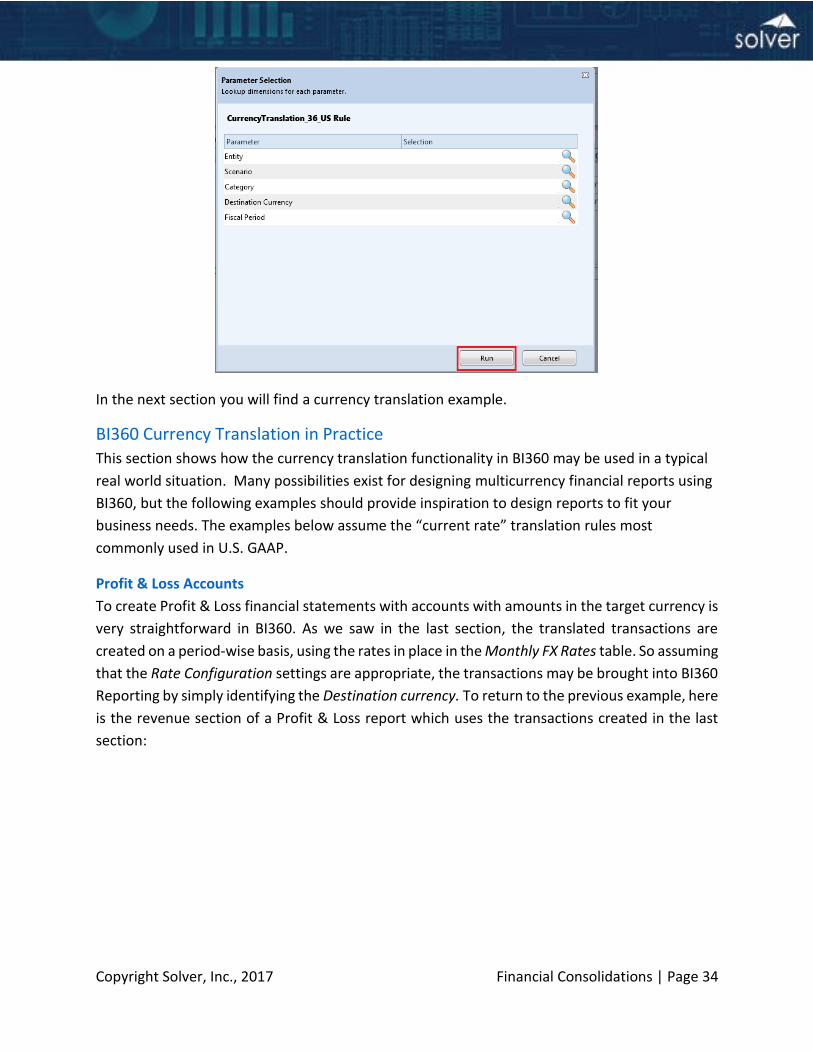
9. Currency Translation Process The consolidation process is initiated by executing the Currency Translation rule in the Processes section of the Data Warehouse user interface. The output of the rule are transactions that reflect the rate types and rates set up in the mapping described above in section 6, “Set up Currency Conversion.” The output is also limited by several parameters:
1) Entities.
2) Scenario.
3) Category.
4) Destination currencies.
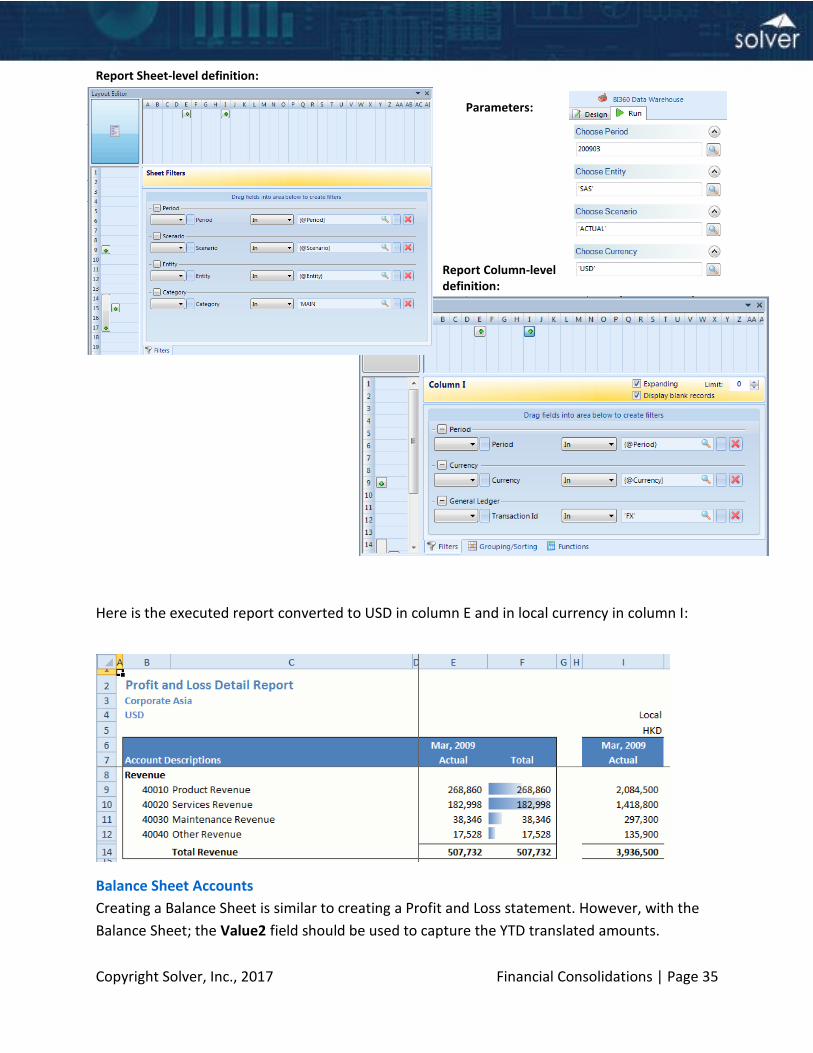
5) Periods. Multicurrency organizations usually create consolidated reports restricted to the translated amounts. There are two primary filters used to limit reports to data generated by the currency rule:
1) Category codes begin with FX (FX is appended to the beginning of the category code of the native currency transaction).
2) The Row Comment attribute is FX (if the transaction currency is different from the native currency) or FC (if the transaction currency is the same as the native currency).
Aside from these filters there are no special requirements to create reports using currency translation transactions. For more information on report syntax please see the BI 360 Report Designer User Guide. Currency translation adjustment:
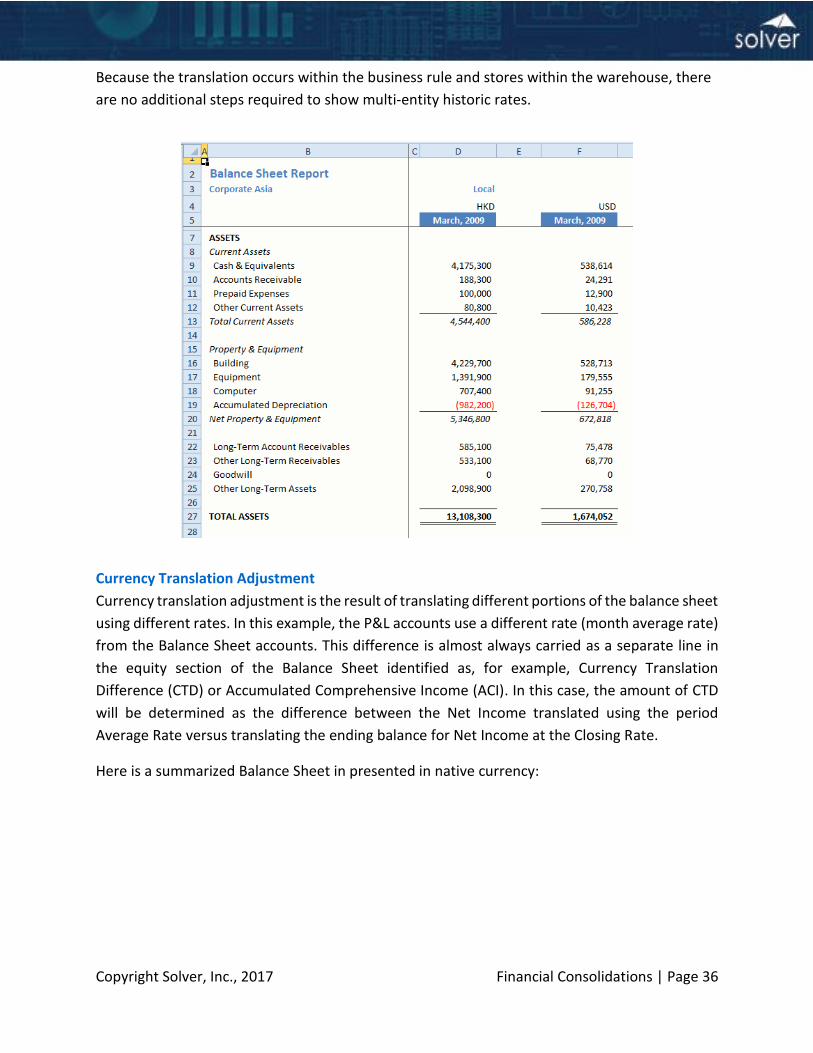
When a balance sheet or other financial statement contains accounts that are translated at various rates a currency translation adjustment amount must be calculated based and presented on the differences. The currency translation rule for US GAAP provides special support for calculating currency translation adjustment. For accounts which are mapped to either the average or closing rate type, all of the year-to-date native currency periodic activity in the Monthly Amount fields is totaled and translated at the closing rate for the report date in the Annual Amount field. These are generally the correct amounts for balance sheet accounts. This amount is stored in the Value2 – YTDTotal – field. Net income (based on the income statement accounts) on the other hand should generally be presented on the balance sheet as the sum of each period separately translated at the
average rate for that period. This is consistent with the presentation in the profit and loss statement. If the Account Types are configured correctly, then these translated amounts are stored in the Value1 – Monthly Amount – fields. Taking the difference between the net income thus calculated vs. the net income from the Annual Amount field for the income statement accounts provides the required amount for currency translation adjustment. If there are other accounts requiring translation (e.g., retained earnings, historical rate accounts translated at specific identification rates) then additional steps need to be taken to calculate the associated currency translation adjustment. These are outlined in a white paper available on the Solver support website.
10. Minority Interest Elimination Process The creation of minority interest elimination transactions is initiated by executing the Minority Elimination rule in the Processes section of the Data Warehouse user interface. The minority interest elimination process is based on the entity tree structures created in the Data Warehouse. If there are no nodes in any entity tree with Percent Ownership set to less than 100% then no minority interest elimination takes place. Minority interest eliminations have exactly the same transaction structure as the original transaction on which they are based EXCEPT that they have two additional dimensions:
1) Tree – Identifies the entity tree which is driving the elimination.
2) Minority Parent – identifies the branch in the tree which is driving the elimination.
Examples of base transactions and the related minority interest eliminations may be seen in Appendix 1 below. Note that there can be many more minority elimination transactions than original transactions since each tree will require a minority elimination transaction at each level where there is minority elimination required.
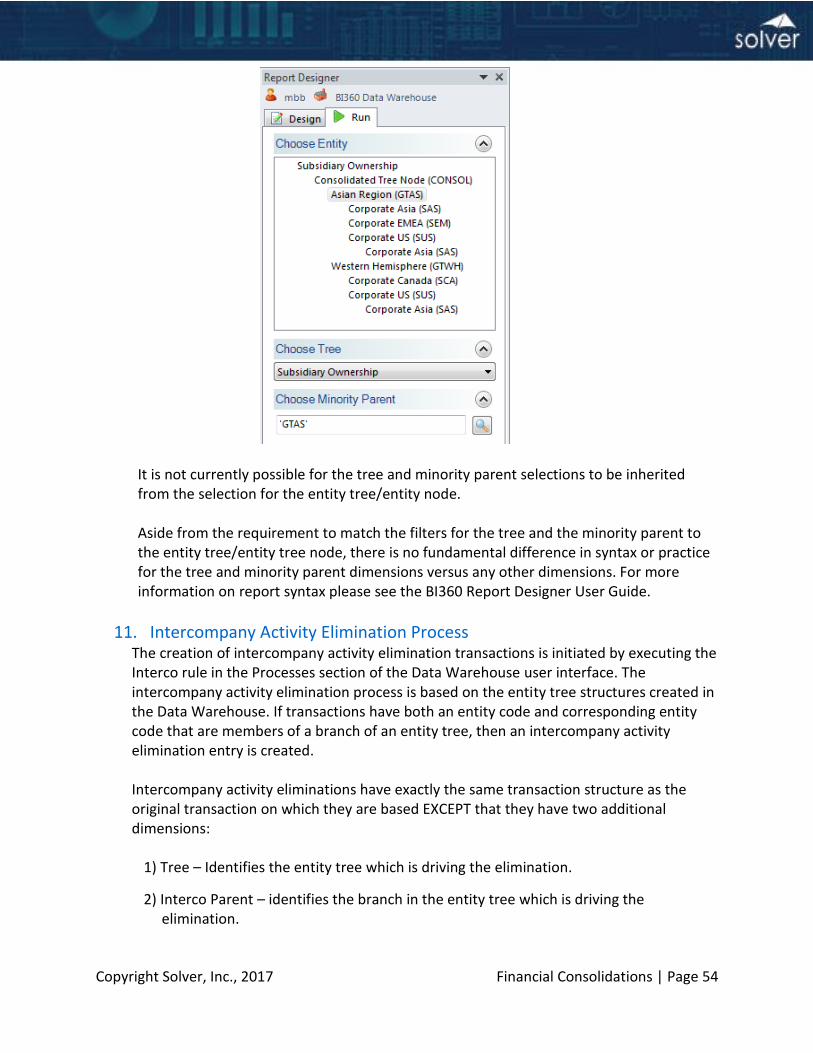
Building consolidated or consolidating reports so that the filters for entity tree and entity tree node are matched to the filters for the tree dimension and minority parent dimension will fetch results which properly match the base transaction(s) and appropriate minority interest elimination transaction(s). If the filter for entity tree and entity tree node is driven from a tree-style parameter then sheet-per-value functionality with proper eliminations is available as well. This is a screenshot of typical parameters with properly matched selections for a consolidated report with minority eliminations:
It is not currently possible for the tree and minority parent selections to be inherited from the selection for the entity tree/entity node. Aside from the requirement to match the filters for the tree and the minority parent to the entity tree/entity tree node, there is no fundamental difference in syntax or practice for the tree and minority parent dimensions versus any other dimensions. For more information on report syntax please see the BI360 Report Designer User Guide.
11. Intercompany Activity Elimination Process The creation of intercompany activity elimination transactions is initiated by executing the Interco rule in the Processes section of the Data Warehouse user interface. The intercompany activity elimination process is based on the entity tree structures created in the Data Warehouse. If transactions have both an entity code and corresponding entity code that are members of a branch of an entity tree, then an intercompany activity elimination entry is created.
Intercompany activity eliminations have exactly the same transaction structure as the original transaction on which they are based EXCEPT that they have two additional dimensions:
1) Tree – Identifies the entity tree which is driving the elimination.
2) Interco Parent – identifies the branch in the entity tree which is driving the elimination.
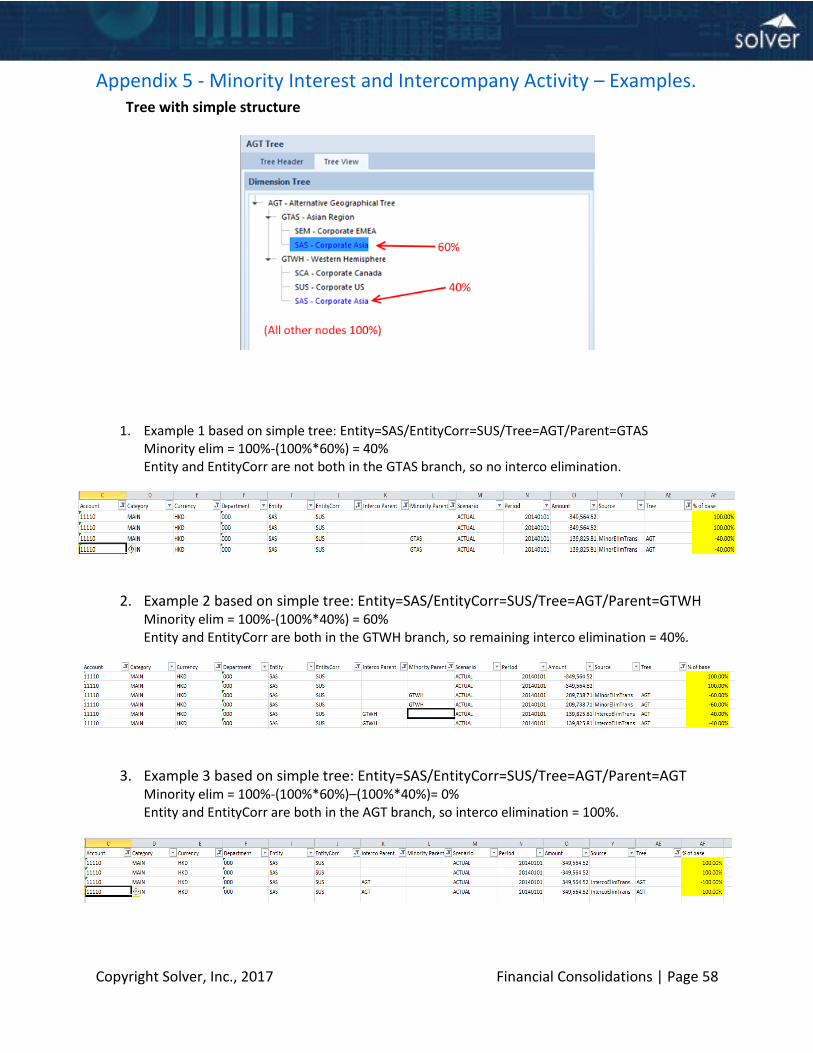
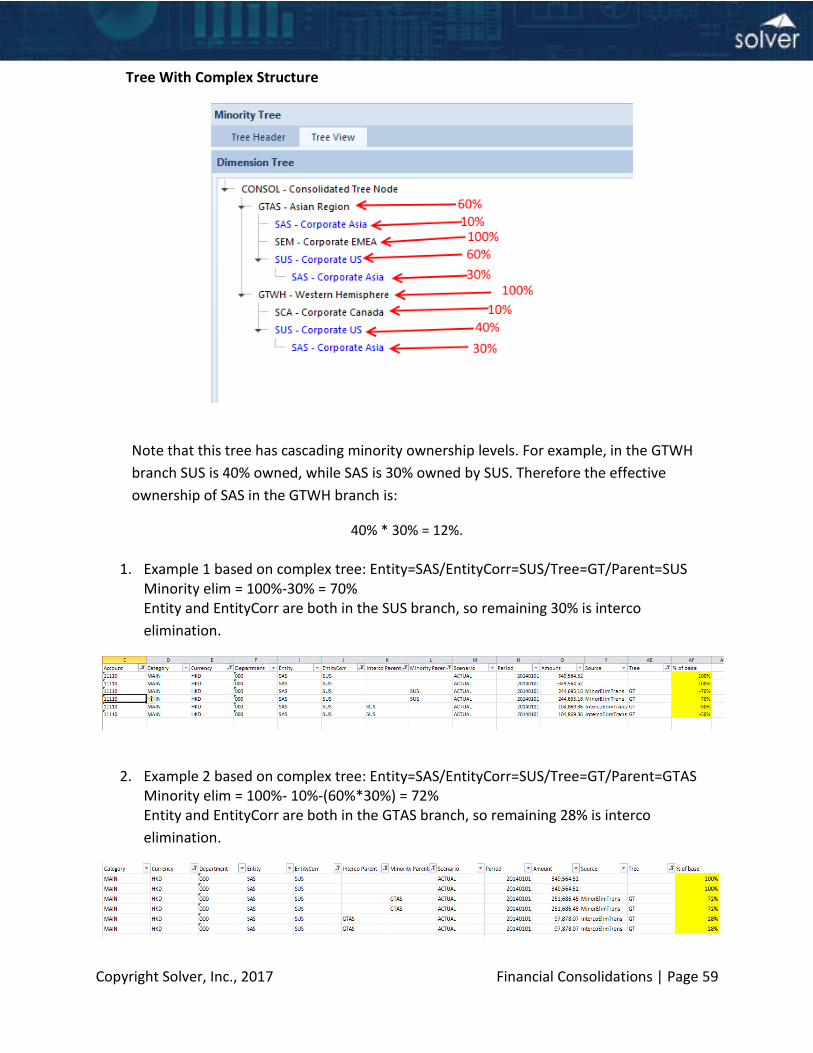
Amounts for intercompany activity eliminations are integrated with any minority interest elimination from the same base transaction for the same tree and the same parent. For example, if there is minority interest elimination required equal to 40% of the base transaction amount, then the intercompany activity elimination would be equal to 60% of the base transaction amount. If there is no associated minority interest elimination, then the intercompany activity elimination is equal to 100% of the amount of the base transaction.
Examples of base transactions and the related minority interest and intercompany activity eliminations may be seen in Appendix 1 below. As with minority interest elimination transactions, there can be many more intercompany activity elimination transactions than original transactions.
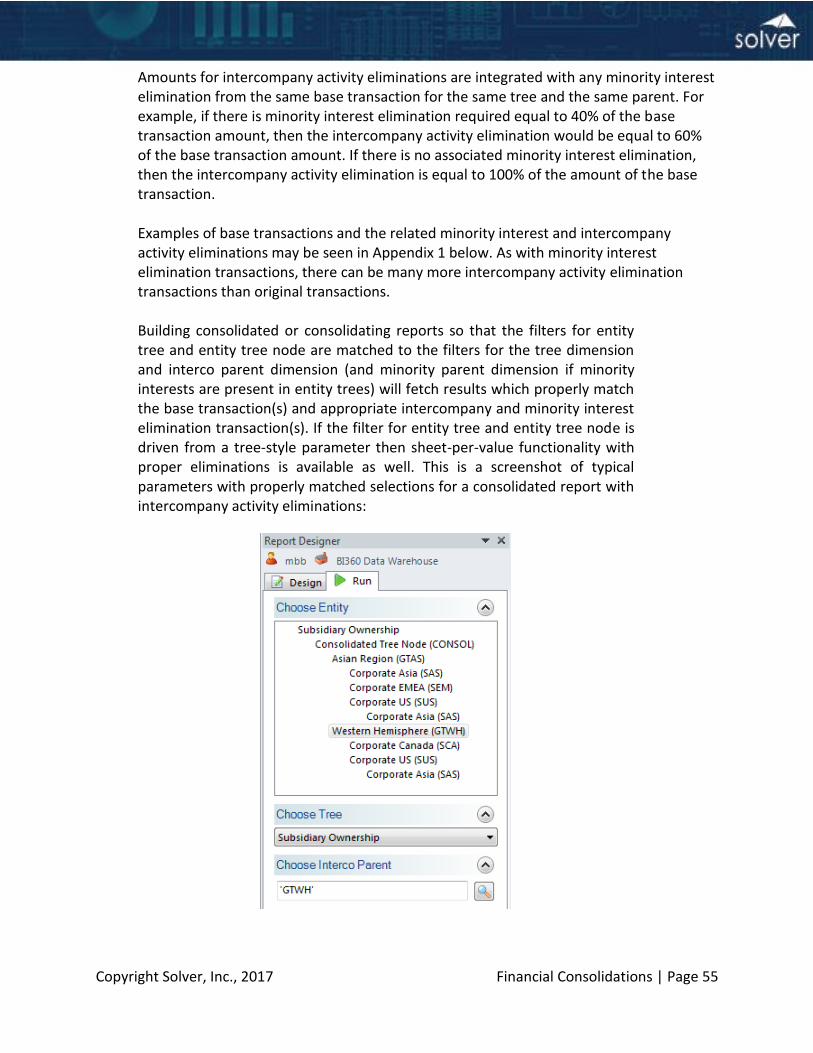
Building consolidated or consolidating reports so that the filters for entity tree and entity tree node are matched to the filters for the tree dimension and interco parent dimension (and minority parent dimension if minority interests are present in entity trees) will fetch results which properly match the base transaction(s) and appropriate intercompany and minority interest elimination transaction(s). If the filter for entity tree and entity tree node is driven from a tree-style parameter then sheet-per-value functionality with proper eliminations is available as well. This is a screenshot of typical parameters with properly matched selections for a consolidated report with intercompany activity eliminations:
It is not currently possible for the tree and interco parent selections to be inherited from the selection for the entity tree/entity node. However, it is possible to have a user’s selection of a Interco Parent be inherited by the Minority Parent parameter (or vice versa); specific instructions for this technique are available here. Aside from the requirement to match the tree/interco parent filters to the entity tree/entity tree node, there is no fundamental difference in syntax or practice for the tree and minority parent dimensions versus any other dimensions. For more information on report syntax please see the BI 360 Report Designer User Guide.
12. Manual Input Forms for Eliminations and Adjustments It may be beneficial to set up data entry forms in BI360 so users can input data such as:
• Assignment of corresponding entity codes.
• Elimination transactions (that for whatever reason would not be automatic eliminations).
• Other consolidation adjustments (i.e. for reclassification of data that came in wrong/incomplete from a subsidiary or currency adjustments).
• IFRS to local GAAP adjustments.
You can use the BI360 Budgeting module to create highly user friendly input forms either for use with the BI360 Excel interface or the BI360 Web Portal.
Such manual entries are typically (you decide when you set up the input form) stored to a separate Category (this is a dimension in the BI360 DW) code(s) so you later can include and exclude your adjustments with your imported GL data and also you can break out the adjustments in separate columns in your consolidation reports.
The BI360 DW has full audit trial (i.e. for Sarbanes Oxley and other audit reasons) that automatically will track who enters and changes the adjustment transactions and at what date and time. It can also include text comments to explain what the adjustments where needed for.
See the BI360 Budgeting User Manual for more information about Form design.
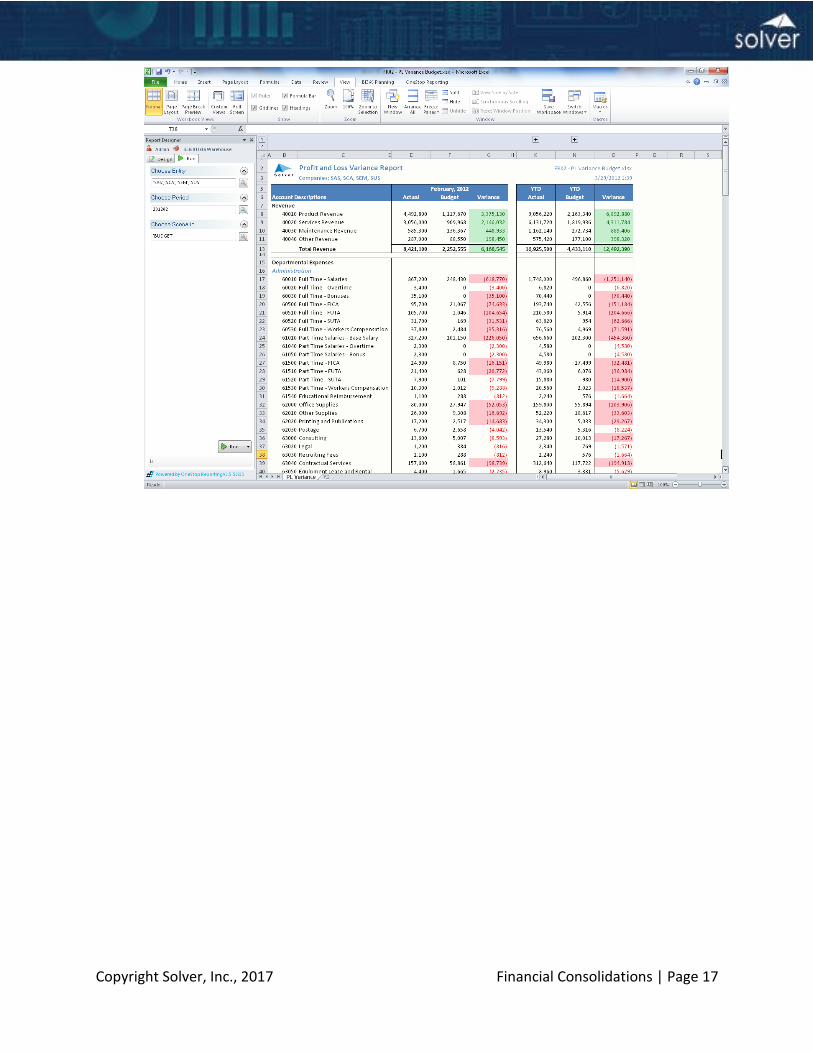
13. Design Reports and Distribution Once the BI360 DW is set up and populated, processes for currency conversion and eliminations have been run, and any manual adjustments have been entered, it is time to design your financial consolidation reports. For most companies, these types of reports will include:
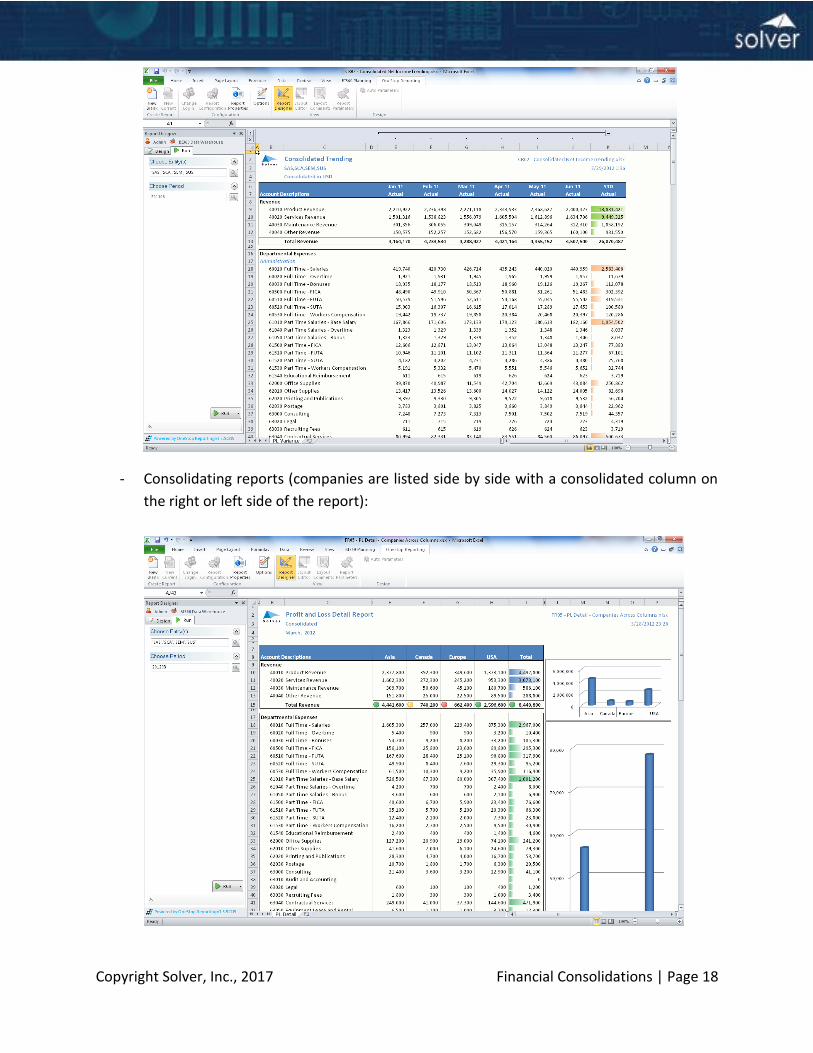
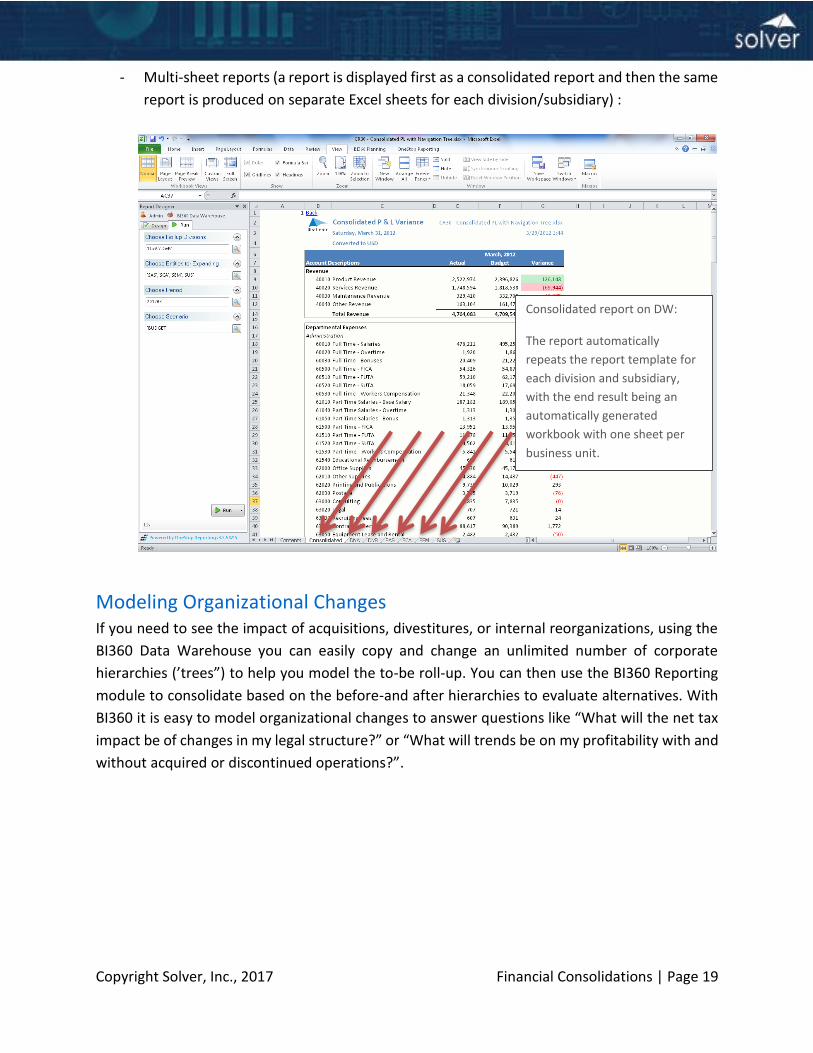
d. Consolidated and Consolidating Cash Flow Many companies desire to automatically compile the same report across sheets in a single Excel workbook, starting with a consolidated version of the report on the first sheet and then replicating the same report format on the next sheets according to a consolidation tree set up in the BI360 DW. This is a powerful feature in the BI360 Report Designer. However, if you have more than 75-100 sheets in the same workbook it will significantly slow down the report execution and it might be better to consider on-demand execution or running the report in separate Excel files per company. Of course, any number of other reports can also be created. In short, you use the BI360 Report Designer to set up the reports you desire. Then you have three ways of running these reports:
a. Run reports with the BI360 Excel add-in.
b. Run reports and distribute (or print) automatically with the BI360 Publisher module.
c. Run reports in the BI360 Web Portal. See the BI360 Report Designer User Manual for more information about Report design.
14. Testing and Validation Once you have completed all the steps above, make sure you set aside time to test both your data and your reports before you go live.
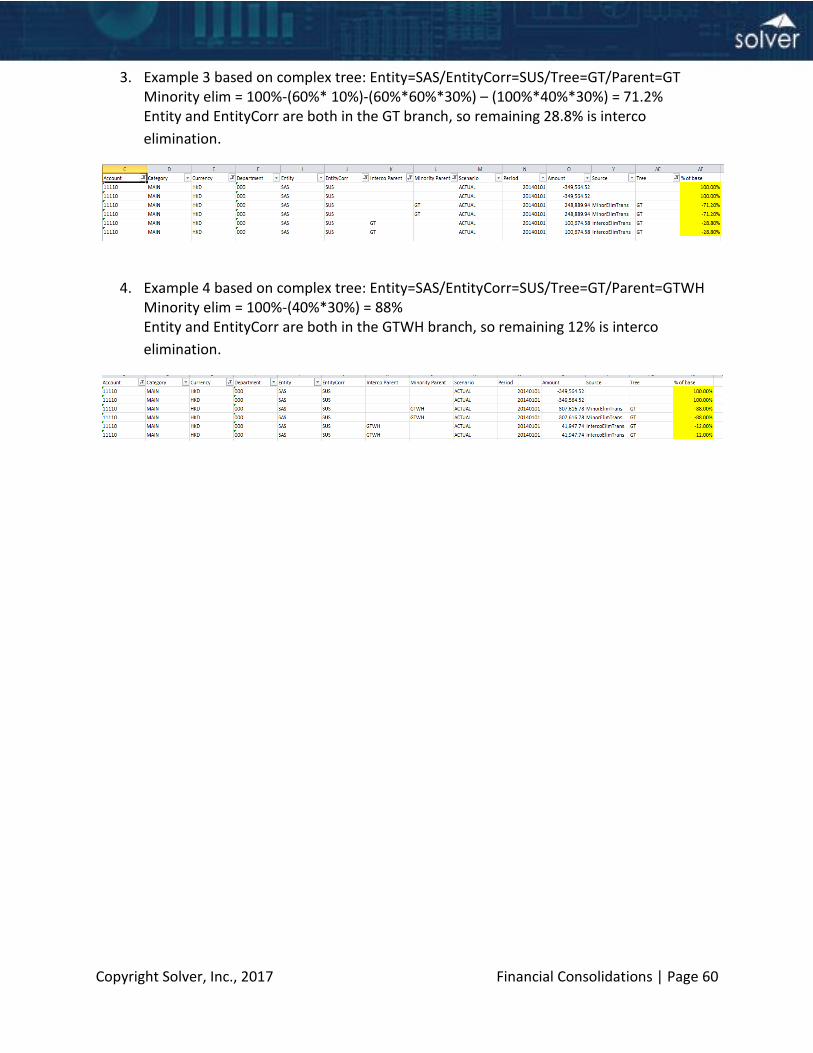
3. Example 3 based on complex tree: Entity=SAS/EntityCorr=SUS/Tree=GT/Parent=GT Minority elim = 100%-(60%* 10%)-(60%*60%*30%) – (100%*40%*30%) = 71.2% Entity and EntityCorr are both in the GT branch, so remaining 28.8% is interco
elimination.
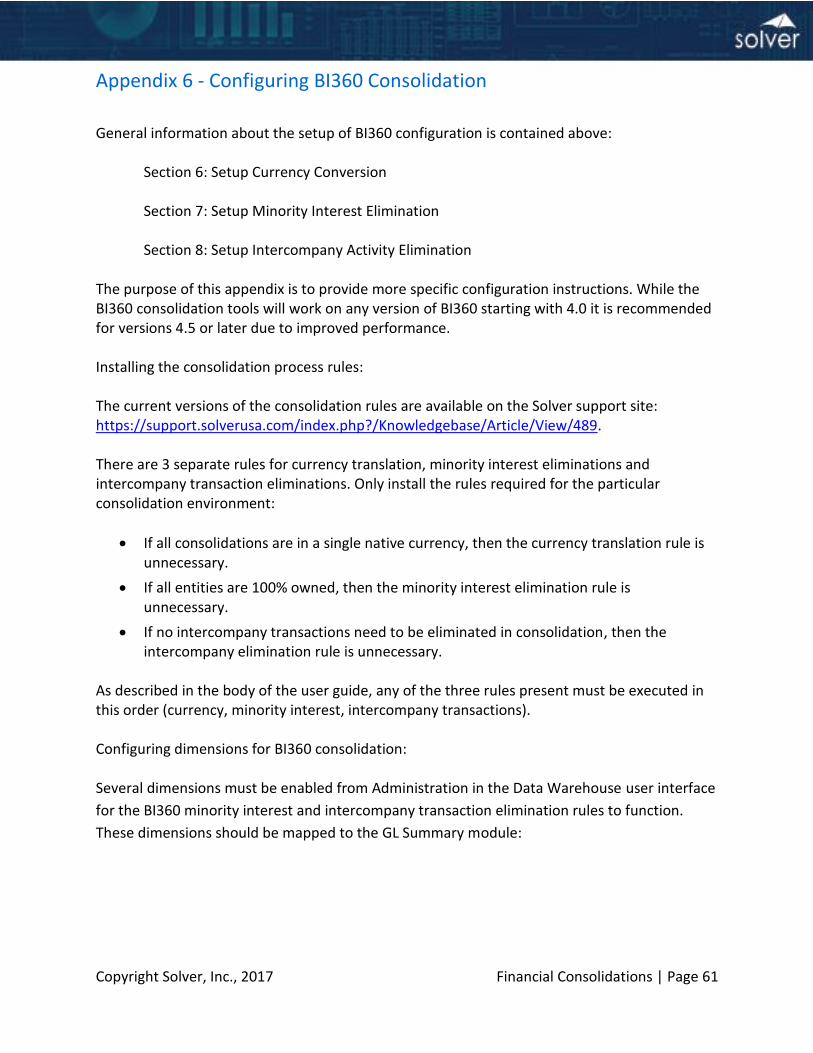
4. Example 4 based on complex tree: Entity=SAS/EntityCorr=SUS/Tree=GT/Parent=GTWH
Minority elim = 100%-(40%*30%) = 88% Entity and EntityCorr are both in the GTWH branch, so remaining 12% is interco
General information about the setup of BI360 configuration is contained above:
Section 6: Setup Currency Conversion
Section 7: Setup Minority Interest Elimination
Section 8: Setup Intercompany Activity Elimination The purpose of this appendix is to provide more specific configuration instructions. While the BI360 consolidation tools will work on any version of BI360 starting with 4.0 it is recommended for versions 4.5 or later due to improved performance. Installing the consolidation process rules: The current versions of the consolidation rules are available on the Solver support site: https://support.solverusa.com/index.php?/Knowledgebase/Article/View/489. There are 3 separate rules for currency translation, minority interest eliminations and intercompany transaction eliminations. Only install the rules required for the particular consolidation environment:
If all consolidations are in a single native currency, then the currency translation rule is unnecessary.
If all entities are 100% owned, then the minority interest elimination rule is unnecessary.
If no intercompany transactions need to be eliminated in consolidation, then the intercompany elimination rule is unnecessary.
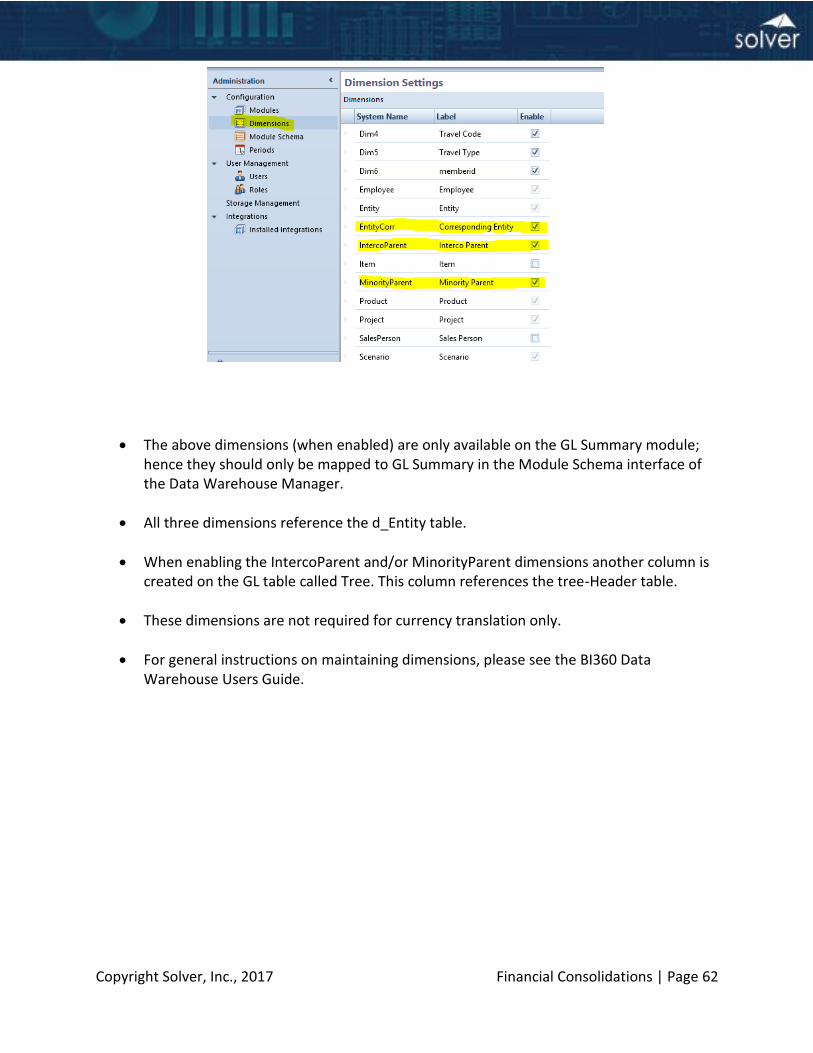
As described in the body of the user guide, any of the three rules present must be executed in this order (currency, minority interest, intercompany transactions). Configuring dimensions for BI360 consolidation: Several dimensions must be enabled from Administration in the Data Warehouse user interface
for the BI360 minority interest and intercompany transaction elimination rules to function.
These dimensions should be mapped to the GL Summary module:
The above dimensions (when enabled) are only available on the GL Summary module; hence they should only be mapped to GL Summary in the Module Schema interface of the Data Warehouse Manager.
All three dimensions reference the d_Entity table.
When enabling the IntercoParent and/or MinorityParent dimensions another column is created on the GL table called Tree. This column references the tree-Header table.
These dimensions are not required for currency translation only.
For general instructions on maintaining dimensions, please see the BI360 Data Warehouse Users Guide.
Appendix 7 - Additional BI360 Information and Resources BI360 Reference Documents: https://www.solverglobal.com/products/documents Any other information you need: Request from [email protected] or your partner BI360 Customer Case Studies: https://www.solverglobal.com/products/customers BI360 customer portal, on-demand videos and webinars:
Examples by industry: https://www.solverglobal.com/products/solutions/
On-demand videos of BI360 o Solver site: https://www.solverglobal.com/products/experience-bi360/
Customer portal gives access to rich and valuable BI360 information including – Solver University, BI360 forum, BI360 Blog, various BI360 whitepapers, training videos, etc. See preview here - https://support.solverusa.com/
Visit our website for a host of information: http://www.solverglobal.com