35
Overview of Solver’s BI360 Suite Reporting - Planning – Dashboards – Collaboration – Data Warehouse A Solver White Paper Jan 2015 solverusa.com Copyright © 2015

Overview of Solver’s BI360 Suite
Reporting - Planning – Dashboards – Collaboration – Data Warehouse
A Solver White Paper
Jan 2015 solverusa.com Copyright © 2015

Copyright Solver, Inc., 2015 Overview of the BI360 Suite| Page 1
Table of Contents Introduction .................................................................................................................................... 3
Architecture Overview ................................................................................................................ 3
BI360 – Reporting Module .............................................................................................................. 4
User Interface Overview ............................................................................................................. 5
Reporting Components ............................................................................................................... 6
Excel Ribbon ............................................................................................................................ 6
Excel Task Pane ........................................................................................................................ 7
Composer for Ad-Hoc Reporting ............................................................................................. 9
Reporting with the BI360 Web Portal and Mobile Apps ....................................................... 10
Practical Usage Examples ...................................................................................................... 11
Typical Implementation Process ............................................................................................... 13
BI360 – Planning Module .............................................................................................................. 14
User Interface Overview ........................................................................................................... 15
Planning Components ............................................................................................................... 15
Data Settings ......................................................................................................................... 15
Interface Settings .................................................................................................................. 16
Data Entry Window ............................................................................................................... 17
Budgeting and Forecasting with the BI360 Web Portal ........................................................ 18
Practical Usage Examples .......................................................................................................... 19
Typical Implementation Process ............................................................................................... 21
BI360 – Dashboard Module .......................................................................................................... 22
User Interface Overview ........................................................................................................... 23
Collaboration Features in the BI360 Web Portal .......................................................................... 24
BI360 – Data Warehouse .............................................................................................................. 26
Data Warehouse Interface (Admin Console) Overview ............................................................ 26
Data Warehouse Manager Components .................................................................................. 26
Modules ................................................................................................................................. 26
Dimensions ............................................................................................................................ 27

Copyright Solver, Inc., 2015 Overview of the BI360 Suite| Page 2
Currency ................................................................................................................................ 28
Data Explorer ......................................................................................................................... 29
Processes ............................................................................................................................... 30
Practical Usage Examples .......................................................................................................... 31
Typical Implementation Process ............................................................................................... 32
Module – Dimension Mapping .................................................................................................. 33
BI360 System Requirements ......................................................................................................... 34

Copyright Solver, Inc., 2015 Overview of the BI360 Suite| Page 3
Introduction BI360 is the first full Business Intelligence (BI) suite powered by Microsoft Excel (Budgeting and
Reporting) and Microsoft SQL Server (Data Warehouse) with a modern Web Portal and mobile
apps. Built for quick, low risk implementations and to be managed by business users, BI360 is
designed to completely satisfy the business performance management needs of departments,
divisions as well as corporate headquarters.
The features that differentiate BI360 the most from other BI applications are:
1. Third generation Excel add-ins for simple or complex reporting and budgeting processes.
2. Pre-Configured and extensible, “smart” data warehouse.
3. Modern web and mobile end-user front-ends for easy access to information and
powerful collaboration.
Architecture Overview
Below you can see a simplified architecture with all the BI360 modules. The Reporting, Planning
and Dashboard modules can both run live on a number of different ERP systems as well as off
the BI360 Data Warehouse.

Copyright Solver, Inc., 2015 Overview of the BI360 Suite| Page 4
Reporting
The innovative and user-friendly BI360 Data Warehouse allows an organization to radically
improve their business intelligence capabilities by consolidating any number of internal or
external data sources into providing a single, central SQL Server data warehouse repository.
BI360 – Reporting Module As a modern, business user friendly reporting tool, BI360 Reporting combines the best of
several worlds:
1. Design reports in Excel, where power users can use their spreadsheet knowledge to
build all the reports the business needs.
2. Run reports in Excel, Web portal or mobile apps.
3. Receive reports by e-mail.
BI360’s Excel-based report writer can connect directly (real-time) to a number of pre-
intregrated ERP or CRM systems, and to the BI360 Data Warehouse. BI360 Reporting can be
used for financial reporting and consolidations as well as any type of operational reporting.
With all, or a majority of their reports built with BI360 Reporting, organizations typically find
that they now get 80% of the analysis and reporting done with 20% of the effort it previously
required. In other words, some of the key reasons for implementing BI360 are:
1. Excel interface that most business users are comfortable with.
2. Anytime, anywhere access to reports through BI360 Web Portal and mobile apps.
3. Collaborative features and alerts (BI360 Web Portal) for vastly improved communication
and performance discussions.
4. Easy to build reports with drag and drop wizards and pre-built formulas.
5. Reporting live on various ERP GL as well as sub-ledger modules, as well as Microsoft
CRM.
6. Reporting on any data source populated into the BI360 Data Warehouse.
7. Single report writer for many purposes.
8. Consolidations across companies (requires BI360 Data Warehouse if multiple different
ERP systems are in use).

Copyright Solver, Inc., 2015 Overview of the BI360 Suite| Page 5
9. Currency conversion (requires BI360 Data Warehouse for advanced currency
conversion).
10. Special needs such as allocations and reconciliations.
11. Eliminate any manual Excel exports/reports as well as proprietary report writers.
12. Ad-hoc reporting (Report Composer module) without the need for formulas, OLAP
cubes, and pivot tables.
As seen in the architecture diagram earlier in this document, BI360 Reporting is one of four
BI360 modules. The other three modules are:
1. BI360 Data Warehouse module (optional).
2. BI360 Planning module (optional).
3. BI360 Dashboard module (optional).
In the architecture diagram you can see how BI360 Reporting interacts with the other BI360
modules. In essence, it serves as a report writer and an ad-hoc query tool both for live reporting
on various ERP systems, as well as for the BI360 Data Warehouse Manager, in which case data
can come from any source system, including cloud-based systems.
Here are some scenarios when BI360 Reporting is used with the BI360 Data Warehouse:
Reporting across multiple source systems (like multiple ERP systems).
Advanced currency conversion, allocations and eliminations.
Performance (want faster reporting without slowing down the source system).
Design of input templates and reports for Budgeting and Forecasting (either for BI360’s
Excel- or web-based Planning modules or for other budget system populating data into
the Data Warehouse).
User Interface Overview
BI360 Reporting is a modern Excel add-in that has been designed with the latest Microsoft
technologies and follows Microsoft best practices for interface design and usability. The
Interface was designed to maintain a similar look and feel to the Microsoft Office products,
including the use of a ribbon and an Outlook-style menu bar as the main navigation
components.
BI360 Reporting also has a back-end tool called the Integration Customization tool used by
power users to extend or customize the meta data that enables the live integrations between
the Excel front-end and the data source (such as the ERP system). The meta data provides BI360
Reporting with major advantages over standard query tools and report writers that connects
Copyright Solver, Inc., 2015 Overview of the BI360 Suite| Page 6
directly to a data source and adds important logic. To begin with, it shields Report Designer
users from any type of SQL queries and it translates often difficult SQL field and table names
into plain English business terms. Maybe even more important, the Integration Customization
(and it’s more powerful counterpart, Meta Data Designer, used by Solver’s integration team)
allows developers and power users to pre-define important logic such as time/period logic,
which then can eliminate the use of technical period formulas when users design reports.
Note: For a number of ERP systems and the BI360 Data Warehouse and certain other systems,
the meta data is already developed and out-of-the box, while for other systems it takes
configuration to be set up. The Meta Data Designer can also be made available to
partners/customers so that they, on their own, can expand the use of BI360 Reporting to also
provide live reporting on other in-house databases.
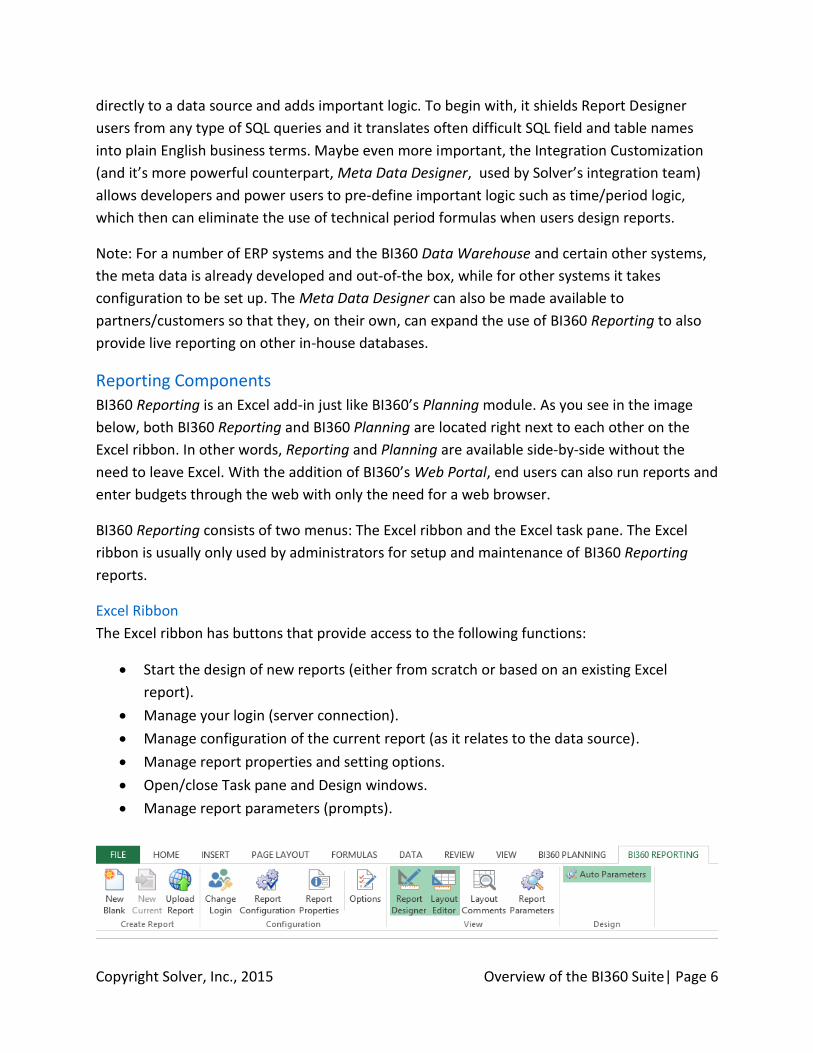
Reporting Components
BI360 Reporting is an Excel add-in just like BI360’s Planning module. As you see in the image
below, both BI360 Reporting and BI360 Planning are located right next to each other on the
Excel ribbon. In other words, Reporting and Planning are available side-by-side without the
need to leave Excel. With the addition of BI360’s Web Portal, end users can also run reports and
enter budgets through the web with only the need for a web browser.
BI360 Reporting consists of two menus: The Excel ribbon and the Excel task pane. The Excel
ribbon is usually only used by administrators for setup and maintenance of BI360 Reporting
reports.
Excel Ribbon
The Excel ribbon has buttons that provide access to the following functions:
Start the design of new reports (either from scratch or based on an existing Excel
report).
Manage your login (server connection).
Manage configuration of the current report (as it relates to the data source).
Manage report properties and setting options.
Open/close Task pane and Design windows.
Manage report parameters (prompts).

Copyright Solver, Inc., 2015 Overview of the BI360 Suite| Page 7
Excel Task Pane
BI360’s Reporting task pane features the popular Microsoft Outlook-style menu bar. It comes in
two main flavors:
1. Report Designer: Gives access to both design and run reports (typically for power users).
2. Report Player: Gives access to run reports (typically for end users).
The Report Designer menu is shown on the left side of the image below and it offers the
following main features:
Access to fields in different modules in the source database (like GL, Sales, Accounts
Payable, etc.).
KPIs (KPIs can be pre-defined and dragged into any report).
Functions (pre-defined period functions such as: Current Month, YTD, Rolling 12 Month
and many more).
Expression Trees (pre-defined trees that can be dragged into any report. E.g. Profit &
Loss account trees).
Report Parameters (access to the parameters that will display for the users as filters
when they run a report).
When designing a report, the user selects the fields, trees, periods, etc. from the Report
Designer menu and drags and drops these items into the appropriate location in the Excel
sheet. Most reports can be designed without entering a single formula, with the exception of
for example a standard Excel formula that deducts one Excel cell from another to calculate the
variance between a column with actual figures and a column with budget figures.
Copyright Solver, Inc., 2015 Overview of the BI360 Suite| Page 8
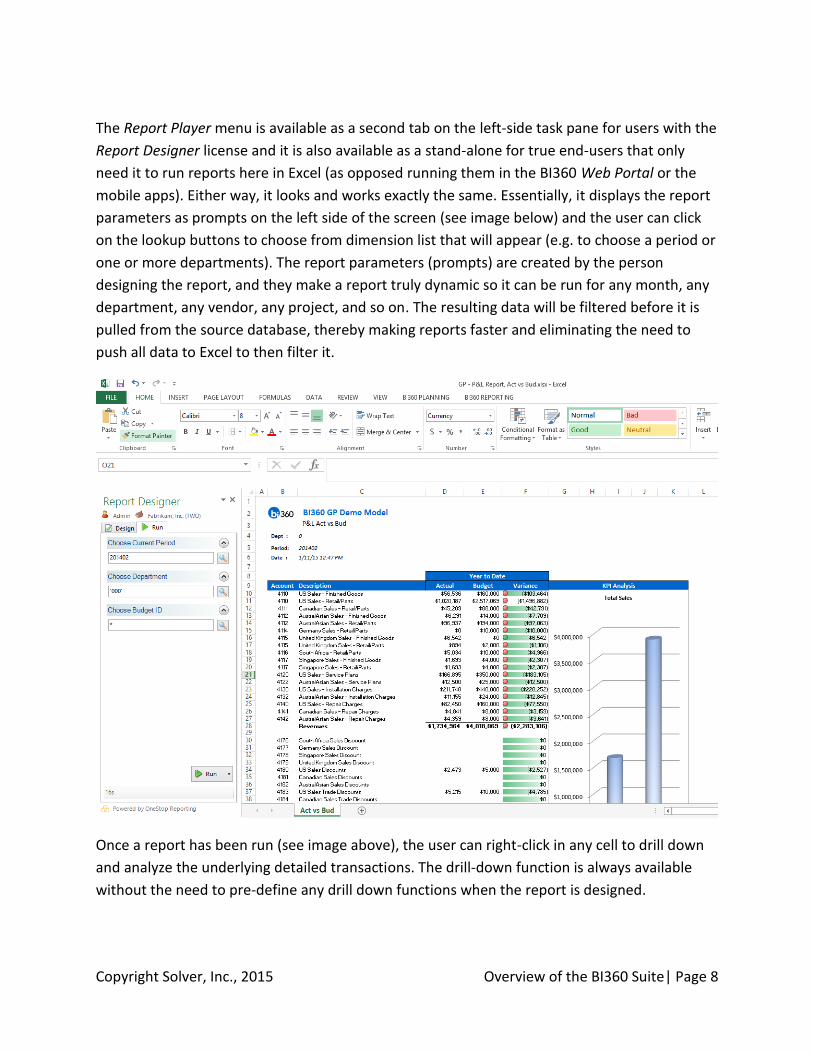
The Report Player menu is available as a second tab on the left-side task pane for users with the
Report Designer license and it is also available as a stand-alone for true end-users that only
need it to run reports here in Excel (as opposed running them in the BI360 Web Portal or the
mobile apps). Either way, it looks and works exactly the same. Essentially, it displays the report
parameters as prompts on the left side of the screen (see image below) and the user can click
on the lookup buttons to choose from dimension list that will appear (e.g. to choose a period or
one or more departments). The report parameters (prompts) are created by the person
designing the report, and they make a report truly dynamic so it can be run for any month, any
department, any vendor, any project, and so on. The resulting data will be filtered before it is
pulled from the source database, thereby making reports faster and eliminating the need to
push all data to Excel to then filter it.
Once a report has been run (see image above), the user can right-click in any cell to drill down
and analyze the underlying detailed transactions. The drill-down function is always available
without the need to pre-define any drill down functions when the report is designed.

Copyright Solver, Inc., 2015 Overview of the BI360 Suite| Page 9
Composer for Ad-Hoc Reporting
BI360 Reporting also offers an optional module called Composer (see image below). The
Composer is designed to solve ad-hoc (on the fly, instant) reporting needs as compared to the
BI360 Reporting Excel add-in which is focused on creating and running professionally formatted
reports. Typical ad-hoc users are accountants or other staff needing to see e.g. how much has
been paid to a certain vendor so far this year, or a sales manager that wants to see what they
have actually invoiced to a customer and if they have been paid yet.
The Composer has a very simple interface that can be learned in less than an hour and where
everything is accomplished with drag and drop from the familiar Outlook-style menu on the
left. This menu is the exact same menu that BI360 Reporting utilizes in Excel (see prior
paragraphs about the Report Designer.
The Composer is also connected to the Report Designer and a query designed in the Composer
can, with a few clicks, be turned into a fully formatted Excel report template in the Report
Designer.

Copyright Solver, Inc., 2015 Overview of the BI360 Suite| Page 10
Reporting with the BI360 Web Portal and Mobile Apps
For most organizations that need a larger number of users to access reports (and dashboards or
budget input), it is beneficial to deploy BI360 Reporting with the BI360 Web Portal. This
provides browser-based access through the internet or your corporate network, with no need
for BI360 software installed on the users’ computers. The BI360 Web Portal also enables you to
download the free BI360 mobile apps, providing yet another easy way for users to run reports.
Copyright Solver, Inc., 2015 Overview of the BI360 Suite| Page 11
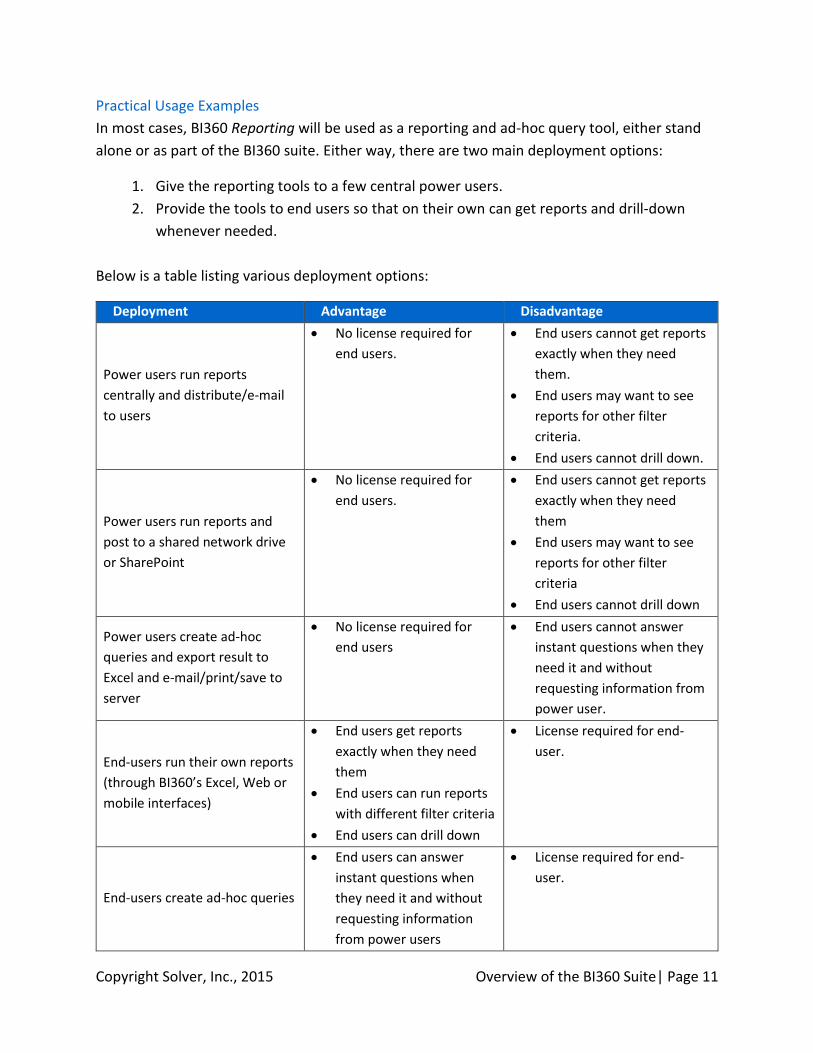
Practical Usage Examples
In most cases, BI360 Reporting will be used as a reporting and ad-hoc query tool, either stand
alone or as part of the BI360 suite. Either way, there are two main deployment options:
1. Give the reporting tools to a few central power users.
2. Provide the tools to end users so that on their own can get reports and drill-down
whenever needed.
Below is a table listing various deployment options:
Deployment Advantage Disadvantage
Power users run reports
centrally and distribute/e-mail
to users
No license required for
end users.
End users cannot get reports
exactly when they need
them.
End users may want to see
reports for other filter
criteria.
End users cannot drill down.
Power users run reports and
post to a shared network drive
or SharePoint
No license required for
end users.
End users cannot get reports
exactly when they need
them
End users may want to see
reports for other filter
criteria
End users cannot drill down
Power users create ad-hoc
queries and export result to
Excel and e-mail/print/save to
server
No license required for
end users
End users cannot answer
instant questions when they
need it and without
requesting information from
power user.
End-users run their own reports
(through BI360’s Excel, Web or
mobile interfaces)
End users get reports
exactly when they need
them
End users can run reports
with different filter criteria
End users can drill down
License required for end-
user.
End-users create ad-hoc queries
End users can answer
instant questions when
they need it and without
requesting information
from power users
License required for end-
user.

Copyright Solver, Inc., 2015 Overview of the BI360 Suite| Page 12
Here are examples of the numerous potential uses of BI360’s Reporting module:
Purpose Usage Examples
Financial reporting Financial statements in various formats, like Profit &
Loss, Balance Sheet and Cash Flow reports.
Operational reporting
Sales reports
Vendor reports
Project reports
HR/Payroll reports
Dashboard reports
Create Excel-based dashboards that combine
metrics/KPIs with charts and indicators (Excel 2007
and later supports traffic lights, arrows, etc.).
If data is coming from multiple sources, deploy
BI360’s Data Warehouse module, import data there
and deploy Dashboard reports on top of the Data
Warehouse.
Scorecard reports
Create Excel-based scorecards with KPIs (Excel 2007
and later supports traffic lights, arrows, etc.).
Management’s scorecard comments can be stored
with BI360’s Planning module.
If data is coming from multiple sources, deploy
BI360’s Data Warehouse, import data there and
deploy dashboard reports on top of the Data
Warehouse.
KPI reports
Create Excel-based reports that generate and display
KPIs. (Excel 2007/2010 supports traffic lights, arrows,
etc.).
Allocation reports
Create Excel-based reports that calculate allocations.
If you want to store the allocations and bring them
back to the ERP system, use BI360’s Planning module.
You can also use BI360 Planning to collect and store
allocation drivers.
Commentary input
Create Excel-based reports (e.g. a P&L) and set up
BI360’s budget module to collect and save text
comments.
Create Excel-based reports to show all comments
made to certain accounts, for certain variances, etc.
Budget template design Create Excel-based input templates for use with
BI360’s Excel or web-based budget modules.
Budget reports Create Excel-based reports to consolidate/view
budget.

Copyright Solver, Inc., 2015 Overview of the BI360 Suite| Page 13
Workflow reports Create Excel-based reports for instant views of all
Approved/Pending/Rejected budgets.
Typical Implementation Process
A typical implementation process of BI360 Reporting could look like this (in this example
assume that BI360 Reporting is being used for typical reporting processes):
1. Train power users.
2. Identify reporting needs.
3. Preparation of the BI360 Data Warehouse Manager – Skip this step if BI360 will only
be used for live reporting on the ERP database.
a. Populate the Data Warehouse Manager with data and dimensions from your
source systems. Examples of dimensions are: Account, Department, Project,
Product, Employee, Asset, etc.
b. Enter any other dimensions or data directly in the Data Warehouse Manager if
they do not already reside in another database from which they can be
imported.
4. Design Excel report templates with BI360 Reporting.
5. Deploy BI360 Web Portal – Skip this step if reports will only be run through the Excel
add-in.
6. Set up security (if different users require different access rights).
7. Train end users (will only take minutes as they just need to learn how to run reports
and drill down).
Copyright Solver, Inc., 2015 Overview of the BI360 Suite| Page 14
BI360 – Planning Module As an Excel- and web-based data entry tool with a powerful companion report writer (BI360
Reporting) and dashboard (BI360 Dashboard), Planning can be used to automate budgeting and
forecasting as well as other business processes that require data entry with storage in a
database. In other words, think of BI360 Planning as an automated way to save any data into a
SQL database. For most people, budgets and forecasts are the first processes that come to
mind, but in reality, most organizations have numerous manual data collection processes that
could be automated with BI360 Planning.
As seen in the architecture diagram earlier in this document, Planning is one of four BI360
modules. The other three modules are:
1. BI360 Data Warehouse – This is where Planning stores all data (with the exception of
ERP systems where BI360 provides live write-back)
2. BI360 Reporting module – Required.
a. Used to design the input templates.
b. Used as a report writer to report on all the data that Planning stores to the
Data Warehouse or ERP database.
c. Used as a regular report writer.
3. BI360 Dashboard module – Optional, this provides a professional dashboard interface
for interactive, graphical analysis and drill-down.
In the architecture diagram shown earlier in this document, you see how BI360 Planning
interacts with the other BI360 modules. As you will learn later, administrators first configure
Planning and the Data Warehouse database (not needed if using live write-back from BI360 to
the ERP’s budget tables) for the Excel model where the data entry and write-back will take
place. The input templates are then provided to the end-users either through Excel or the BI360
Web Portal for data entry. After the users have entered and saved their data, managers can
start reporting on the entered data. Finally, if desirable, the data can be transferred from the
Data Warehouse Manager database and back to other source systems such as budget tables in
the ERP database.
Planning

Copyright Solver, Inc., 2015 Overview of the BI360 Suite| Page 15
User Interface Overview
BI360 Planning is a modern Excel and web-based solution. The Excel add-in was designed to
maintain similar look and feel to the Office products, including the use of a ribbon and Outlook-
style menu bar as the main navigation components.
The BI360 Web Portal was designed to provide a modern web interface for budgeting, reporting
and dashboards, and with added workflow, discussion groups, alerts and other important
features that takes the budget process beyond just a data entry concept.
Planning Components
BI360 Planning uses an Excel add-in to design input templates just like BI360 Reporting. As you
see in the image below, both Planning and Reporting are located right next to each other on
the Excel ribbon. In other words, reporting and budgeting are available side-by-side without the
need to leave Excel. Of course, end users may come through the BI360 Web Portal without ever
seeing or using Excel.
BI360 Planning consists of two menus in Excel: the Excel ribbon and the Excel task pane. The
latter is only used by administrators for setup and maintenance of Planning.
Excel Ribbon
View, Check-in & Check-out Assignments.
Save data.
Update model settings from the server (the BI360 Data Warehouse Manager).
Connection information (to the BI360 Data Warehouse Manager database).
Access to administrative functions (task pane).
Direct link to resources (Including BI360 documentation, videos and samples).
Excel Task Pane
The BI360 Planning task pane features the popular Microsoft Outlook-style menu bar. It has
three main menu items:
Data Settings
This is where the administrator performs the initial configuration by providing Planning with
vital information about where data and dimensions are located in the underlying spreadsheet.
Depending on how well organized and structured your Excel model is, BI360 Planning can be

Copyright Solver, Inc., 2015 Overview of the BI360 Suite| Page 16
quickly configured to handle unlimited data input sections in one or multiple worksheets in a
workbook. BI360 Planning can also automatically adapt to spreadsheets that “grow” (e.g. a new
row or column that gets inserted in the Excel model) or “shrink” without the administrator
having to update the settings. If there is a significant structural change to the company’s Excel
model, then the administrator can make the necessary changes to the Planning Data Settings
that the end-users will see next time they open the Excel template (if the same Excel template
is accessed centrally by all users) or if the Excel model has been distributed to end-users, they
simply click the “Update Settings” button on the Planning Excel ribbon and it will retrieve the
latest settings from the BI360 Data Warehouse database. Part of the Data Setting setup is to
choose where in the BI360 Data Warehouse database the data from Excel should be stored
based on the type of data. For example, data (like budgets) related to Accounts is stored to the
Finance (General Ledger) Module, detailed revenue data is stored in the Revenue Module,
detailed employee/position data is stored to the Payroll Module, and so on.
Interface Settings
The Planning Interface Settings (see screenshot below) are directly related to the Planning Data
Settings. While the Data Settings are focused on what sections of Excel should be saved where
in the Data Warehouse and with which dimensions, the Interface Settings are focused on what
you want the end-users to see if they use the Planning data entry screen (shown in the next
paragraph).

Copyright Solver, Inc., 2015 Overview of the BI360 Suite| Page 17
Data Entry Window
The Planning data entry window (see image below) is an optional way of entering data in Excel.
In other words, users can type information directly into Excel, or they can open the BI360
Planning data entry screen and enter it there. When the data has been entered into Excel, it is
automatically saved into the underlying row in Excel and then can be saved to the Data
Warehouse database. The Planning data entry screen is a powerful tool for:
Automatic spreading of numbers across many cells in Excel. Many spreading rules are
available, including rules that can use prior year actuals or seasonal trends as a base.
Input of text comments at the row or line item level.
Input of many rows of line item detail below a single row in Excel (e.g. the user can list
many business trips that automatically will roll up to a single travel expense row in
Excel).
Automatic charting of the current row in Excel and comparison to e.g. another row with
historical data.

Copyright Solver, Inc., 2015 Overview of the BI360 Suite| Page 18
In short, BI360 Planning can store data (numbers and text) from any Excel spreadsheet. The
data is stored to the Data Warehouse database and from there, the stored data can be sent
back to the ERP system, reported on or even processed into OLAP cubes for advanced analysis.
However, for select ERP systems, BI360 Planning can also can write directly back to the budget
tables in the ERP system.
Budgeting and Forecasting with the BI360 Web Portal
For most organizations that needs a larger number of users to enter budgets and forecasts (and
to use reports or dashboards), it is beneficial to deploy BI360 Planning with the BI360 Web
Portal. This provides browser-based data entry through the Internet or your corporate network,
with no need for BI360 software installed on the users’ computers.
Below is a screenshot of a sample budget form in the BI360 Web Portal.

Copyright Solver, Inc., 2015 Overview of the BI360 Suite| Page 19
Practical Usage Examples
In most cases, Planning will be used as a budgeting and forecasting tool. Below is a list of the
most typical variations of budget models that BI360 Planning can handle.
Configuration Examples Typical Distribution
Multiple Excel workbooks
with a single budget sheet
Departmental Profit &
Loss
Departmental Expenses
Input done by central staff
and department heads
through Excel or Web
templates.
Single Excel workbook with
multiple budget sheets with
the same layout
Different departments on
different sheets
Different products on
different sheets
Input done by central staff
Multiple similar Excel
workbooks with multiple
different budget sheets in
each workbook
Workbook with:
o Summary Profit &
Loss or Expense
sheet
o Revenue Detail
o Employee Detail
o Capital Expenses
Input done by central staff
and department heads
through Excel or Web
templates.

Copyright Solver, Inc., 2015 Overview of the BI360 Suite| Page 20
Here are examples of other uses of Planning as a data collection tool.
Configuration and Input Type Usage Examples
Modeling
Create a product or service price model and use BI360
Planning to store each scenario to the BI360 Data
Warehouse and then use BI360 Reporting to output
reports/charts.
Break-back analysis
Use one of Solver’s special break-back templates (or
design your own), to simulate items such as Net Profit
and have BI360 auto-generate the related revenues and
expenses based on for example historical trends.
Allocations
Create the allocations model in Excel (can use the BI360
report module to create automated, parameter-driven
allocation calculations), use BI360 Planning to store the
allocated numbers to the BI360 Data Warehouse. From
there, use the allocations in BI360 reports or transfer
the allocated numbers back to the ERP system.
Electronic data entry of:
Statistics
Key Performance Indicators (KPIs)
Other organizational information
Create input forms for any text or numerical
information and use BI360 Planning to store it to the
BI360 Data Warehouse. From there create reports with
the BI360 Reporting, create Dashboards for analysis, or
transfer the collected data to other systems.
Commentary input for:
Monthly actual/budget variance
reports
Scorecard KPIs
Quarterly/Annual reports
Add comment columns to your BI360 financial
statements or scorecards (generated dynamically with
BI360 Reporting), and use BI360 Planning to save the
text to the BI360 Data Warehouse. Use BI360 Reporting
to create reports that pulls the text comments back up
from the database.

Copyright Solver, Inc., 2015 Overview of the BI360 Suite| Page 21
Typical Implementation Process
A typical implementation process of BI360 Planning would look like this:
1. Train power users.
2. Identify budgeting needs.
3. Preparation of the BI360 Data Warehouse – Skip this step if live ERP budget write-back
is used.
4. Populate the Data Warehouse with historical figures and dimensions from your
General Ledger (and if needed also from systems like Payroll and Fixed Assets).
Examples of dimensions are: Account, Department, Project, Product, Employee, Asset,
etc. – Skip this step if live ERP budget write-back is used.
5. Enter any other dimensions or historical data directly in the Data Warehouse if they
do not already reside in another database from which they can be imported – Skip this
step if live ERP budget write-back is used.
6. Preparation of Excel budget templates.
7. Design your budget templates (or use BI360’s pre-defined templates) with BI360
Reporting. They will now be dynamic and parameter driven based on the dimensions
and data you populated to the Data Warehouse.
8. Planning Setup (as explained earlier in this section) or deployment of the BI360 Web
Portal for web-based input.
9. Train end users.

Copyright Solver, Inc., 2015 Overview of the BI360 Suite| Page 22
BI360 – Dashboard Module The BI360 suite offers its own dashboard module as well. It is completely web-based, both for
dashboard design and for end users.
The main purpose of BI360’s Dashboard module is to support an organization’s performance
management initiatives by offering a relatively low cost and easy to implement, professional
dashboard environment.
Some of the key reasons for implementing BI360’s Dashboard module are:
1. Get managers and users focused on trend analysis and key metrics that drive
organizational performance and processes.
2. Very user-friendly web-based interface that usually only requires minimal or no
training for end-users.
3. Relatively low cost and easy to implement.
4. Business users can quickly learn how to build their own dashboards using the
Dashboard Designer.
As seen in the architecture diagram earlier in this document, the Dashboard module is one of
four BI360 modules. The other three modules are:
1. BI360 Data Warehouse – Optional, this is for support of reporting across multiple ERP
systems, etc.)
2. BI360 Planning module - Optional
3. BI360 Reporting module – Required
In the architecture diagram earlier in this document, you saw how the BI360 Dashboard module
interacts with the other BI360 modules. In essence, it serves as a dashboard on top of the BI360
Data Warehouse and the original data can come from any source system. The BI360
Dashboard also works directly (live) integrated to select, pre-integrated ERP systems.
Dashboard
Copyright Solver, Inc., 2015 Overview of the BI360 Suite| Page 23
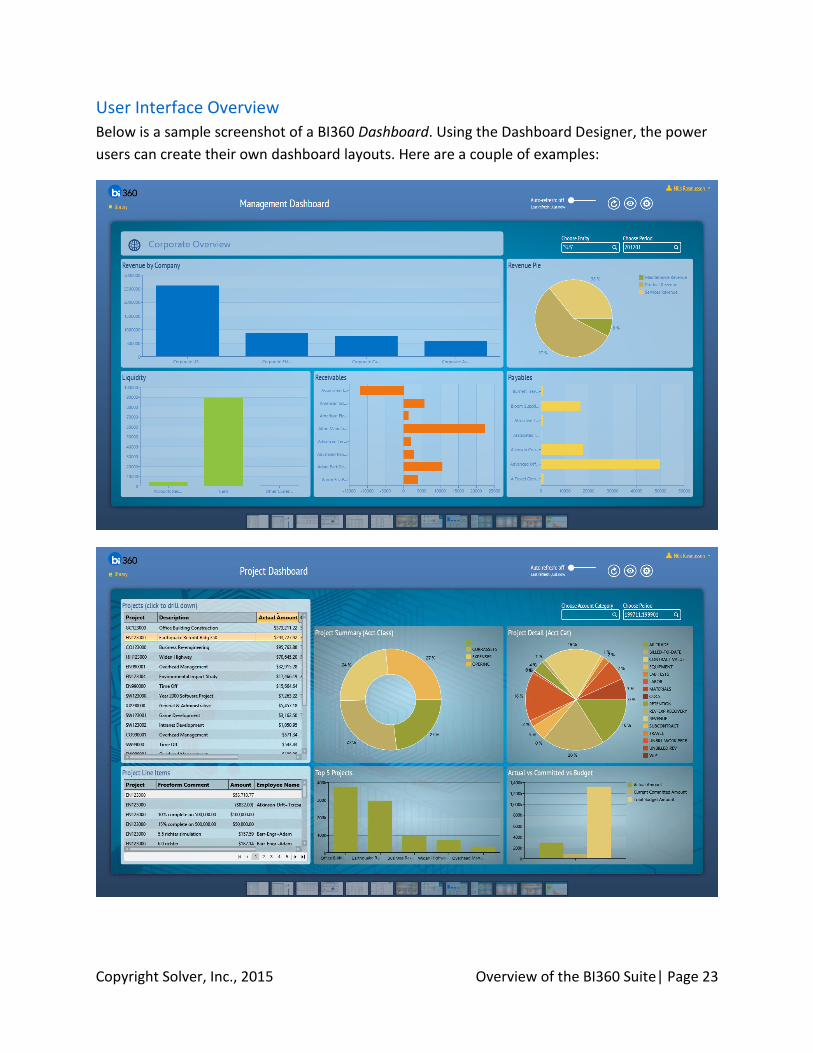
User Interface Overview
Below is a sample screenshot of a BI360 Dashboard. Using the Dashboard Designer, the power
users can create their own dashboard layouts. Here are a couple of examples:

Copyright Solver, Inc., 2015 Overview of the BI360 Suite| Page 24
Collaboration Features in the BI360 Web Portal In early 2015, the BI360 Web Portal was extended with a number of important collaboration
features that can have a big impact on how many companies do strategic planning, distribute
reports, discuss performance, assign tasks, etc. Some of these features are highlighted below.
Real dialogue and insight, right now
Today’s business environment moves faster than ever. BI360 Collaboration opens up the
channels of communication across departments, functions, skill sets, resources—even
devices—to ensure the right information reaches the right people, to make the right decisions.
Team members can engage in open dialogue, resolve issues faster, and drastically improve
productivity in an inclusive, collaborative manner.
Interactive meetings, co-creation sessions, brainstorming without boundaries
With Collaboration, users can discuss ideas or projects, share, annotate, edit and revise
documents, and save them for future use. It is an unprecedented way to analyze and interact
with ERP, CRM, BI and other data sources, to drive process improvement and innovate like
never before.
Robust search functionality
Questions about a report? Budgeting concerns? Need answers from someone in IT?
Collaboration’s simple search functionality helps you find the people and resources you need
right away. No more mass emails. No more waiting hours or even days for people to return
your calls. With Collaboration, you’ll find the answers you need immediately.
BI360 Collaboration features
Report Library: Post reports from BI360 and other report writers into the BI360 Web
Portal for easy access by other users.
Microblogging: Start conversations, update your status, ask questions, post a poll, share
links and files or praise someone
Ideation: Post and vote on ideas within the organization. Great ideas bubble to the top
by user votes. Comment and collaborate on the ideas.
Wikis & Blogs: Create a personal or group blog to post rich content complete with link,
images, videos and more. Wiki’s are perfect for product and other documentation
within the organization.
Project and Task Management: Collaborate on projects with internal and external
users. Manage deliverables, time lines, files and more in one place.
Copyright Solver, Inc., 2015 Overview of the BI360 Suite| Page 25
Private & Public Groups: Create public, private and hidden groups with internal and
external staff.
External Networks: Invite customers, partners and other external resources to group or
project conversations.
Document Management: Create, edit or import documents in the collaboration
application. Share thoughts and ideas around the documents.
In Depth Profile: Create rich profiles to make it easy for people to find experts within the
organization.
Workflows: Fully integrated with BI360 Planning, Workflows are used for BI360 Planning
Approvals, Consolidations as well as other processes within the collaboration suite.
Company Directory: Find and connect with people within the organization. Follow
people, groups and project posts. Find people with similar expertise or interests.
Search: Robust search features to find information that matters.
Business Intelligence: Integrated with the BI360 BI suite. Discuss financials and other
information from the Reporting, Planning and dashboards. Collaborate on data from
other BI solutions as well, such as SQL Reporting Services, FRx, etc.
Gamification: Encourage community involvement by awarding users for posting
information, creating documents and other usage of the system. Users will be awarded
badges and points, which will drive their overall collaboration score.
Mobile: Connect, browse and update your collaboration community using your favorite
mobile device (phone or tablet).

Copyright Solver, Inc., 2015 Overview of the BI360 Suite| Page 26
Data Warehouse
BI360 – Data Warehouse The BI360 Data Warehouse (DW) is BI360’s configurable data warehouse solution. The DW
database is fully integrated with BI360’s Reporting, Planning & Dashboard modules. This
enables immediate access to advanced financial and operational reporting capabilities,
dashboards, as well as fully customizable budgeting, forecasting and data entry features. The
Data Warehouse Manager is delivered with a simple to use desktop interface where
administrators can configure and manage the Data Warehouse without the need for technical
skills.
Data Warehouse Interface (Admin Console) Overview
The Data Warehouse Manager interface has been designed with the latest Microsoft
technologies and it follows Microsoft best practices for interface design and usability. The
interface was designed to maintain a similar look and feel to the Office products, including the
use of a ribbon and Outlook-style menu bar as the main navigation components.
Data Warehouse Manager Components
Modules
The BI360 Data Warehouse database has been pre-designed with seven popular financial
modules as well as fifty generic (user-defined) modules for any data type. However, the design
is not limited to financial data; non-financial data can be handled just as well. Pre-configured
modules include:
General Ledger
Accounts Payable
Accounts Receivable
Capital (Asset Information)
Payroll
Projects
Revenues
In addition, the BI360 Data Warehouse comes the 50 user-defined modules.
To dramatically reduce implementation time, each module contains pre-defined fields specific
to that module/area. The modules can be renamed using the Data Warehouse Manager’s
interface. For each module and without any need for customization, an unlimited number of

Copyright Solver, Inc., 2015 Overview of the BI360 Suite| Page 27
User Defined Fields can be added using the Admin Console to further extend the capacity of the
transaction tables.
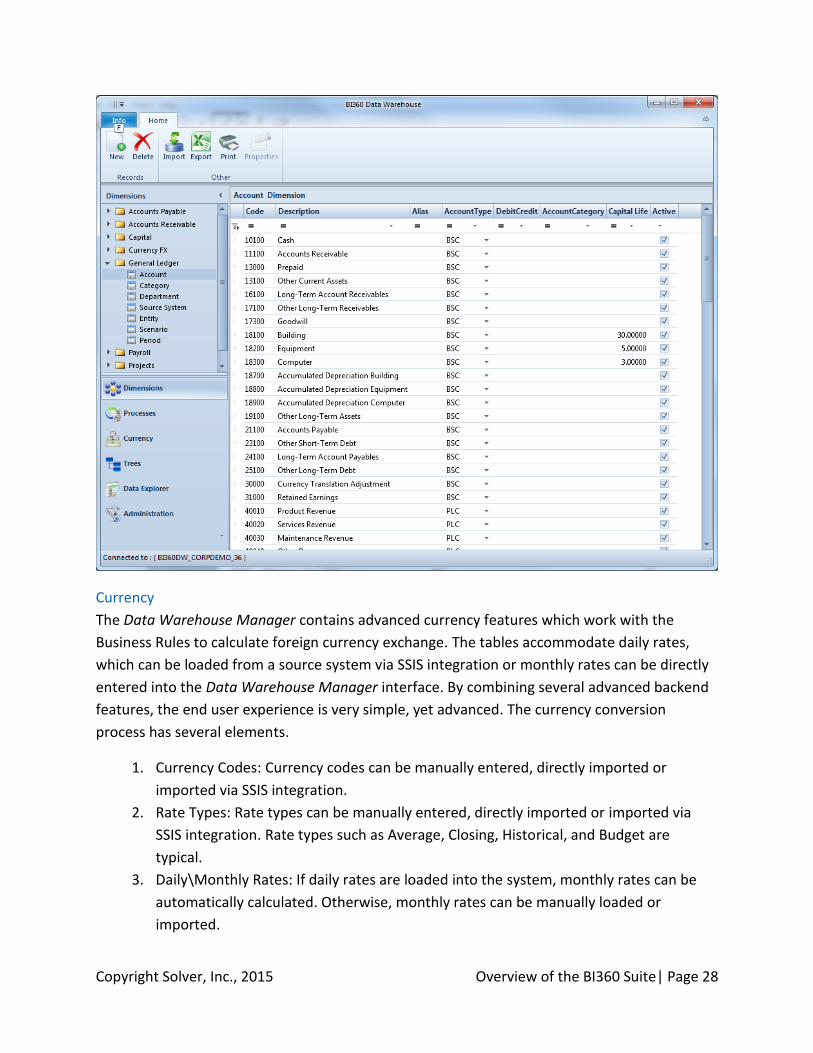
Dimensions
The BI360 Data Warehouse database contains dimensions specific to each module but also
contains user-definable dimensions which can be added and shared across modules. Using the
Data Warehouse Manager interface, the dimensions can easily be mapped to each module and
labeled as needed. Each dimension contains many attributes specific to the dimension. Each of
the user-definable dimensions also contains several User Defined Fields (UDFs) to customize
the dimensions to match a customer’s specific data model. Up to 40 User Defined Fields can be
added to each dimension using the Admin Console.
Dimension Management
Dimensions can be managed within the Data Warehouse Manager interface. There are many
ways to load the dimensions into the Data Warehouse Manager:
1. Direct import via the Data Warehouse Manager Interface import feature from a CSV
file.
2. Automated SQL Server Integration Services (SSIS) integration import.
3. Populate with the use of pre-defined Data Warehouse connectors (for Salesforce,
Acumatica, Netsuite, Intacct, etc.).
4. Manual entry: Manual entry is specifically useful for budgeting and forecasting. Since
Data Warehouse Manager is a warehouse, Accounts and other dimensions that do not
exist in the source system(s) can be created and maintained directly within the Data
Warehouse Manager environment.
Copyright Solver, Inc., 2015 Overview of the BI360 Suite| Page 28
Currency
The Data Warehouse Manager contains advanced currency features which work with the
Business Rules to calculate foreign currency exchange. The tables accommodate daily rates,
which can be loaded from a source system via SSIS integration or monthly rates can be directly
entered into the Data Warehouse Manager interface. By combining several advanced backend
features, the end user experience is very simple, yet advanced. The currency conversion
process has several elements.
1. Currency Codes: Currency codes can be manually entered, directly imported or
imported via SSIS integration.
2. Rate Types: Rate types can be manually entered, directly imported or imported via
SSIS integration. Rate types such as Average, Closing, Historical, and Budget are
typical.
3. Daily\Monthly Rates: If daily rates are loaded into the system, monthly rates can be
automatically calculated. Otherwise, monthly rates can be manually loaded or
imported.

Copyright Solver, Inc., 2015 Overview of the BI360 Suite| Page 29
4. Rate Configuration: The configuration ties together the Account type, such as Balance
Sheet, the Scenario such as Actual and the Rate Type such as Average.
Data Explorer
The Data Explorer is used to filter, group and display data for each Data Warehouse module so
that an administrator, at any time, can see and validate what is stored in the Data Warehouse
without the need to perform SQL queries or running reports. The data can be viewed within the
Data Warehouse Manager interface or exported to Excel.

Copyright Solver, Inc., 2015 Overview of the BI360 Suite| Page 30
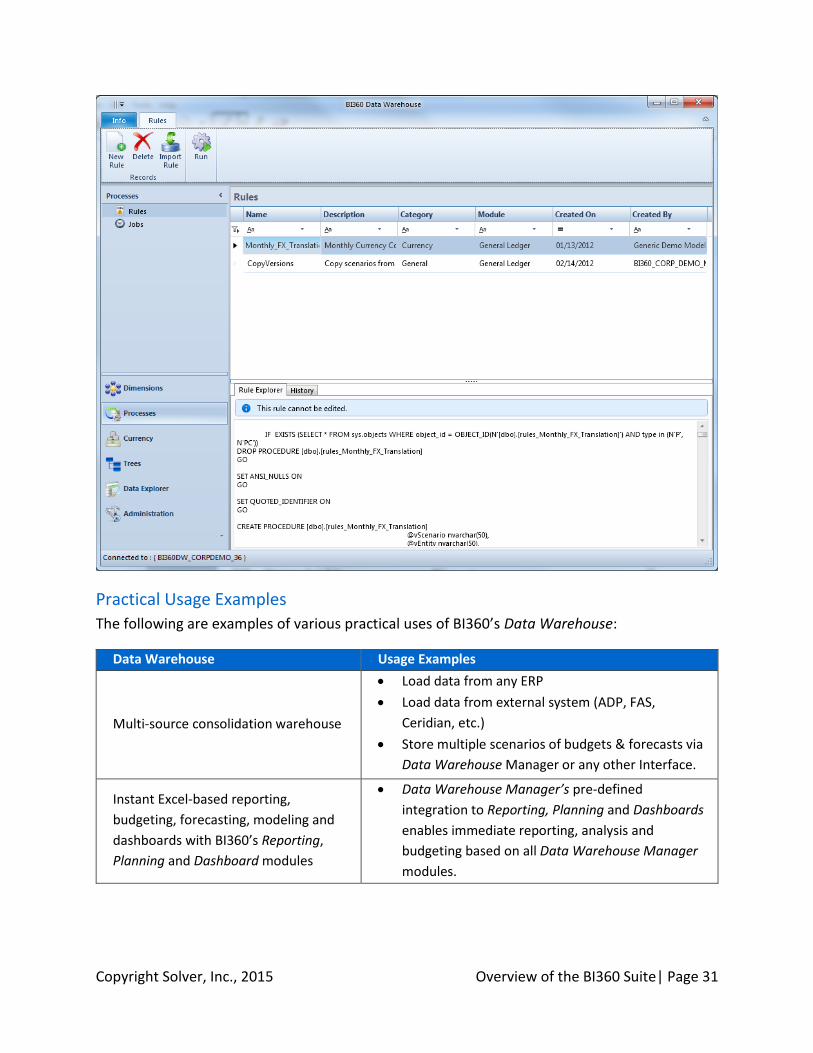
Processes
The Processes are SQL procedure-based rules which enable data transformation and movement
within the Data Warehouse Manager. Because the rules are created as stored procedures
within the Data Warehouse Manager, the rules can be accessed and/or scheduled using
external tools, such as the SQL Server Agent. Rules can be loaded into the warehouse via an
XML file. The XML file contains information about the parameters used to execute the rule as
well as the SQL for the data manipulation.
Practical applications of rules include:
Currency conversion
Data aggregation
Inter-company and minority eliminations
Allocations
Data movement
Other transformations
Copyright Solver, Inc., 2015 Overview of the BI360 Suite| Page 31
Practical Usage Examples
The following are examples of various practical uses of BI360’s Data Warehouse:
Data Warehouse Usage Examples
Multi-source consolidation warehouse
Load data from any ERP
Load data from external system (ADP, FAS,
Ceridian, etc.)
Store multiple scenarios of budgets & forecasts via
Data Warehouse Manager or any other Interface.
Instant Excel-based reporting,
budgeting, forecasting, modeling and
dashboards with BI360’s Reporting,
Planning and Dashboard modules
Data Warehouse Manager’s pre-defined
integration to Reporting, Planning and Dashboards
enables immediate reporting, analysis and
budgeting based on all Data Warehouse Manager
modules.

Copyright Solver, Inc., 2015 Overview of the BI360 Suite| Page 32
Dimension & Data Integration
File Import/Export capabilities for all dimensions
and data modules.
SSIS Import/Export capabilities to and from any
system accessible via SQL Server Integration
Services.
Customize Modules, Dimensions &
attribute names
Labels can be modified to fit with the organizations
requirements and to enhance the BI user
experience.
Exchange Rate Administration
Import Daily spot rates from ERP via SSIS
Automatically calculate monthly Average and
closing rates as well as any other user configured
rates.
Enter monthly rates directly into the database
(when daily rates are not loaded)
Business Rules Engine Complex currency calculations for multi-national
organizations
Data Viewer Filter, view and validate data loaded into each
module.
Typical Implementation Process
A typical implementation process of the Data Warehouse Manager would encompass the
following:
1. Installation of the Data Warehouse Manager pre-configured SQL Server database.
2. Installation of Data Warehouse Manager desktop application on the administrators'
machines.
3. Determine source systems and data to be integrated with each system and map to
Data Warehouse modules and dimensions (see below).
4. Configure Data Warehouse Period table and customize Module names, dimension
names as requisite (or leave default). Note: Custom labels will also be visible in
Reporting, Planning & Dashboard modules.
5. Configure currency (as requisite). Determine if daily rates will be loaded from external
system or monthly Average/Closing, etc. rates will be loaded directly into the currency
table. If it set up as an automated process, then configure the SSIS Integration to
update daily spot rates in the Data Warehouse.
6. Determine import method (automated with SSIS, pre-built connectors or manual
imports):
Copyright Solver, Inc., 2015 Overview of the BI360 Suite| Page 33
a. SSIS: Configure SSIS packages [E.g. to Microsoft Dynamics] to previously
determined module & dimension mappings. Or implement custom data
integration to any data source.
b. Connectors: Run the wizard in the connector to connect to the data source, set
up the dimension mapping and run the data transfer.
c. Import: Manually import dimensions and data
7. Business Rules: If business rules, such as Currency Conversion are to be used, ensure
step #5 is completed. No additional steps required, other than running rule.
8. Document integration decisions.
9. Quick training required (Walk through can be done in 1-2 hours).
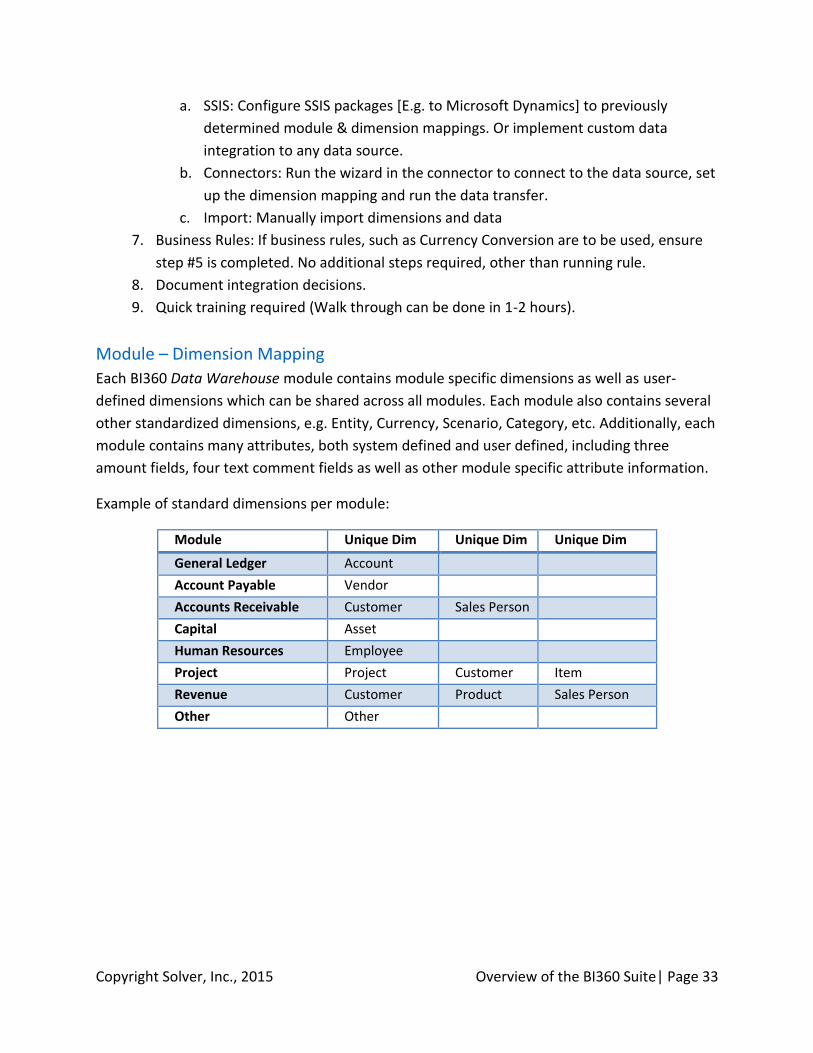
Module – Dimension Mapping
Each BI360 Data Warehouse module contains module specific dimensions as well as user-
defined dimensions which can be shared across all modules. Each module also contains several
other standardized dimensions, e.g. Entity, Currency, Scenario, Category, etc. Additionally, each
module contains many attributes, both system defined and user defined, including three
amount fields, four text comment fields as well as other module specific attribute information.
Example of standard dimensions per module:
Module Unique Dim Unique Dim Unique Dim
General Ledger Account
Account Payable Vendor
Accounts Receivable Customer Sales Person
Capital Asset
Human Resources Employee
Project Project Customer Item
Revenue Customer Product Sales Person
Other Other

Copyright Solver, Inc., 2015 Overview of the BI360 Suite| Page 34
BI360 System Requirements Depending on the components installed, the BI360 Data Warehouse can be implemented on
the same SQL server as the ERP. However, if Data Warehouse reporting is intended to increase
performance and to offload reporting directly from the ERP, it is recommended that a
dedicated SQL server be used.
Performance metrics should be established once a baseline system is configured. There are
many factors that contribute to the performance of the BI360 solution, including number of
concurrent users, number of transactions, size and design of reports and input forms. For more
details, please contact a certified BI360 partner or Solver.
The BI360 Excel add-ins for report and budget forms/design are installed on the users’
computers or a virtual desktop in a hosted environment.
The BI360 Web Portal is installed on a Microsoft IIS box.
Please request ([email protected]) the BI360 Systems Requirements document for detailed
recommendations on hardware and software.


