I 2 MTC 2008 – IEEE International Instrumentation and Measurement Technology Conference Victoria, Vancouver Island, Canada, May 12–15, 2008 Bias Removal in Higher Order Sinusoidal Input Describing Functions P. Nuij, M. Steinbuch, O. Bosgra Department of Mechanical Engineering, Eindhoven University of Technology PO Box 513, 5600 MB Eindhoven, The Netherlands Phone: +31 40 2472839, Email: [email protected]Abstract – In this paper a novel method is presented for the reduction of bias caused by harmonic excitation in the identification of Higher Order Sinusoidal Input Describing Functions (HOSIDF). HOSIDF are a recently introduced generalization of the theory of the describ- ing function. HOSIDF describe the magnitude and phase relations between the individual harmonic components in the output signal of a non-linear system and the sinusoidal excitation signal. In the pre- sented method, the output signal of a non-linear system subjected to harmonic excitation is numerically split up into a fraction caused by the non-linear response due to the fundamental input signal compo- nent and the fraction caused by the quasi-linear response due to the harmonic input signal components. This separation is based on the assumption that the non-linear effects of intermodulation can be ne- glected, compared to the the effects caused by the generation of har- monics and gain compression/expansion. The method is demonstrated with real measurements on a mechanical system with friction. Keywords – Frequency domain analysis, nonlinear systems, harmonic distortion, describing function, system identification. I. INTRODUCTION In the analysis and synthesis of dynamic systems, frequency domain based techniques are well established. These tech- niques are based on the concept of the Frequency Response Function (FRF). A limitation of using FRFs is the imperative assumption of linearity of the system behavior. Due to the in- creasing demands on system performance in for example me- chanical positioning systems, non-linear behavior has to be ad- dressed both in the mechanical and the control design. The frequency domain based techniques for the analysis of non- linear systems mentioned in literature can roughly be classified in three groups: Identification of the linear system In weakly non-linear systems the true linear system can be identified by minimizing the influence of the non-linear dis- tortion using odd multisine excitation signals with minimized crest factor and with an amplitude kept as small as possible [1], [2], [3]. For non-linear systems which can be approximated by Volterra series the Related Linear Dynamic System can be identified using multi-sine based signals [2], [4], [5], [6], [7]. Apart from leakage free measurements, these multi-sine based signals also provide qualitative and quantitative information about the non-linear distortions. Identification of the Generalized Frequency Response Function For the class of causal, stable, time-invariant, non-linear sys- tems with fading memory 1 , the convolution integral descrip- tion of the linear system can be generalized to an infinite series called the Volterra series [9], [10], [11]. The n-dimensional Fourier transform of the n-th order Volterra kernel yields the n-th-order FRF, the Generalized Frequency Response Func- tion (GFRF) [12], [13]. GFRFs can be estimated with non- parametric methods if the system can be described by a low or- der (truncated) Volterra kernel. The high numerical cost how- ever limits these methods to the identification of GFRFs up to a maximum order of three [14], [15]. Parametric identification techniques ease the numerical requirements and allow analyt- ical expressions for GFRFs up to any order [16]. The GFRFs have their limitations: systems with non-fading memory, like non-local memory hysteresis as seen in friction, can not be de- scribed with GFRFs and GFRFs are difficult to interpret due to their multidimensional nature [17], [18]. Describing Functions The Describing Function concept extends the FRF in the way that identification of amplitude dependency becomes possible [19], [20]. Its recently formulated generaliza- tion, the Higher Order Sinusoidal Input Describing Functions (HOSIDF) also describes the generation of harmonics as func- tion of excitation frequency and amplitude [21], [22], [23]. All non-linear systems with a harmonic response to a sinusoidal excitation can be described with HOSIDF. The HOSIDF are easy to interpret but do not describe non-linear phenomena like desensitization and intermodulation [18], [24], [25]. In this pa- per a brief description of the HOSIDF concept is presented. The mathematical framework is presented, the concept of the Virtual Harmonics Expander is introduced, as well as a prac- tical non-parametric measurement method for HOSIDF. This method is based on pure sinusoidal excitation. In practice this condition is impossible to fulfil which results in biased esti- mates for the HOSIDF. A novel numerical compensation al- gorithm is presented, able to significantly reduce this bias in the measured HOSIDF results caused by harmonic excitation. The method is applied to real measurements on a mechanical system with friction. 1 A system has fading memory if two input signals which are close in the recent past, but not necessarily close in the remote past yield present outputs which are close( [8], p.1152)
Transcript
I2MTC 2008 – IEEE International Instrumentation andMeasurement Technology ConferenceVictoria, Vancouver Island, Canada, May 12–15, 2008
Bias Removal in Higher Order Sinusoidal Input Describing Functions
P. Nuij, M. Steinbuch, O. BosgraDepartment of Mechanical Engineering, Eindhoven University of Technology
PO Box 513, 5600 MB Eindhoven, The NetherlandsPhone:+31 40 2472839, Email:[email protected]
Abstract –In this paper a novel method is presented for the reductionof bias caused by harmonic excitation in the identification of HigherOrder Sinusoidal Input Describing Functions (HOSIDF). HOSIDFare a recently introduced generalization of the theory of the describ-ing function. HOSIDF describe the magnitude and phase relationsbetween the individual harmonic components in the output signal ofa non-linear system and the sinusoidal excitation signal. In the pre-sented method, the output signal of a non-linear system subjected toharmonic excitation is numerically split up into a fraction caused bythe non-linear response due to the fundamental input signal compo-nent and the fraction caused by the quasi-linear response due to theharmonic input signal components. This separation is based on theassumption that the non-linear effects of intermodulation can be ne-glected, compared to the the effects caused by the generation of har-monics and gain compression/expansion. The method is demonstratedwith real measurements on a mechanical system with friction.
In the analysis and synthesis of dynamic systems, frequencydomain based techniques are well established. These tech-niques are based on the concept of the Frequency ResponseFunction (FRF). A limitation of using FRFs is the imperativeassumption of linearity of the system behavior. Due to the in-creasing demands on system performance in for example me-chanical positioning systems, non-linear behavior has to be ad-dressed both in the mechanical and the control design. Thefrequency domain based techniques for the analysis of non-linear systems mentioned in literature can roughly be classifiedin three groups:Identification of the linear systemIn weakly non-linear systems the true linear system can beidentified by minimizing the influence of the non-linear dis-tortion using odd multisine excitation signals with minimizedcrest factor and with an amplitude kept as small as possible [1],[2], [3]. For non-linear systems which can be approximatedby Volterra series the Related Linear Dynamic System can beidentified using multi-sine based signals [2], [4], [5], [6], [7].Apart from leakage free measurements, these multi-sine basedsignals also provide qualitative and quantitative informationabout the non-linear distortions.
Identification of the Generalized Frequency Response FunctionFor the class of causal, stable, time-invariant, non-linear sys-tems with fading memory1, the convolution integral descrip-tion of the linear system can be generalized to an infinite seriescalled the Volterra series [9], [10], [11]. Then-dimensionalFourier transform of then-th order Volterra kernel yields then-th-order FRF, the Generalized Frequency Response Func-tion (GFRF) [12], [13]. GFRFs can be estimated with non-parametric methods if the system can be described by a low or-der (truncated) Volterra kernel. The high numerical cost how-ever limits these methods to the identification of GFRFs up toa maximum order of three [14], [15]. Parametric identificationtechniques ease the numerical requirements and allow analyt-ical expressions for GFRFs up to any order [16]. The GFRFshave their limitations: systems with non-fading memory, likenon-local memory hysteresis as seen in friction, can not be de-scribed with GFRFs and GFRFs are difficult to interpret due totheir multidimensional nature [17], [18].Describing FunctionsThe Describing Function concept extends the FRF in theway that identification of amplitude dependency becomespossible [19], [20]. Its recently formulated generaliza-tion, the Higher Order Sinusoidal Input Describing Functions(HOSIDF) also describes the generation of harmonics as func-tion of excitation frequency and amplitude [21], [22], [23]. Allnon-linear systems with a harmonic response to a sinusoidalexcitation can be described with HOSIDF. The HOSIDF areeasy to interpret but do not describe non-linear phenomena likedesensitization and intermodulation [18], [24], [25]. In this pa-per a brief description of the HOSIDF concept is presented.The mathematical framework is presented, the concept of theVirtual Harmonics Expander is introduced, as well as a prac-tical non-parametric measurement method for HOSIDF. Thismethod is based on pure sinusoidal excitation. In practice thiscondition is impossible to fulfil which results in biased esti-mates for the HOSIDF. A novel numerical compensation al-gorithm is presented, able to significantly reduce this biasinthe measured HOSIDF results caused by harmonic excitation.The method is applied to real measurements on a mechanicalsystem with friction.
1 A system has fading memory if two input signals which are close in therecent past, but not necessarily close in the remote past yield present outputswhich are close( [8], p.1152)
)cos(ˆ jw +ta
Non-linear
system
)cos(ˆ)( jw += tatu )),ˆ()(cos(),ˆ()(0
å¥
=
++=n
nn atnaAty wjjww
)cos(ˆ jw +ta
a ),ˆ(0 waA
å
å
¥
=
¥
=
+
=++
0
0
)sin(),ˆ()cos(),ˆ(
)),ˆ()(cos(),ˆ(
n
nn
n
nn
tnabtnaa
atnaA
wwww
wjjww
)),ˆ()(cos(),ˆ( wjjww atnaA nn ++
Σ
))(cos(ˆ jw +tna
Virtual
Harmonics
Expander.
.
.
H0(â,ω)
H1(â,ω)
Hn(â,ω)
Fig. 1. Higher Order Sinusoidal Input Describing Functionsrepresentation.
FFTFFT
kp w
akp, bkp
kp
kp
outk
kkpkp
a
b
aAba
-=
=+
)tan(
),ˆ(22
j
w
p w
ap, bp
p
p
pp
a
b
aba
-=
=+
)
ˆ22
tan(j
Virtual
harmonics
expander
Hn(â,ù)
H0(â,ù)
Ó
Hk(â,ù)
·
·
·
·
· )),ˆ()(cos(),ˆ(
)(
0
å¥
=
++
=
n
nn atnaA
ty
wjjww
)cos(ˆ
)(
jw +
=
ta
tu
)cos(),ˆ(
)),ˆ()(cos(),ˆ(
koutk
kk
tkaA
atkaA
jww
wjjww
+
=++
)cos(ˆ
))(cos(ˆ)(
ink
k
tka
tkatu
jw
jw
+
=+=
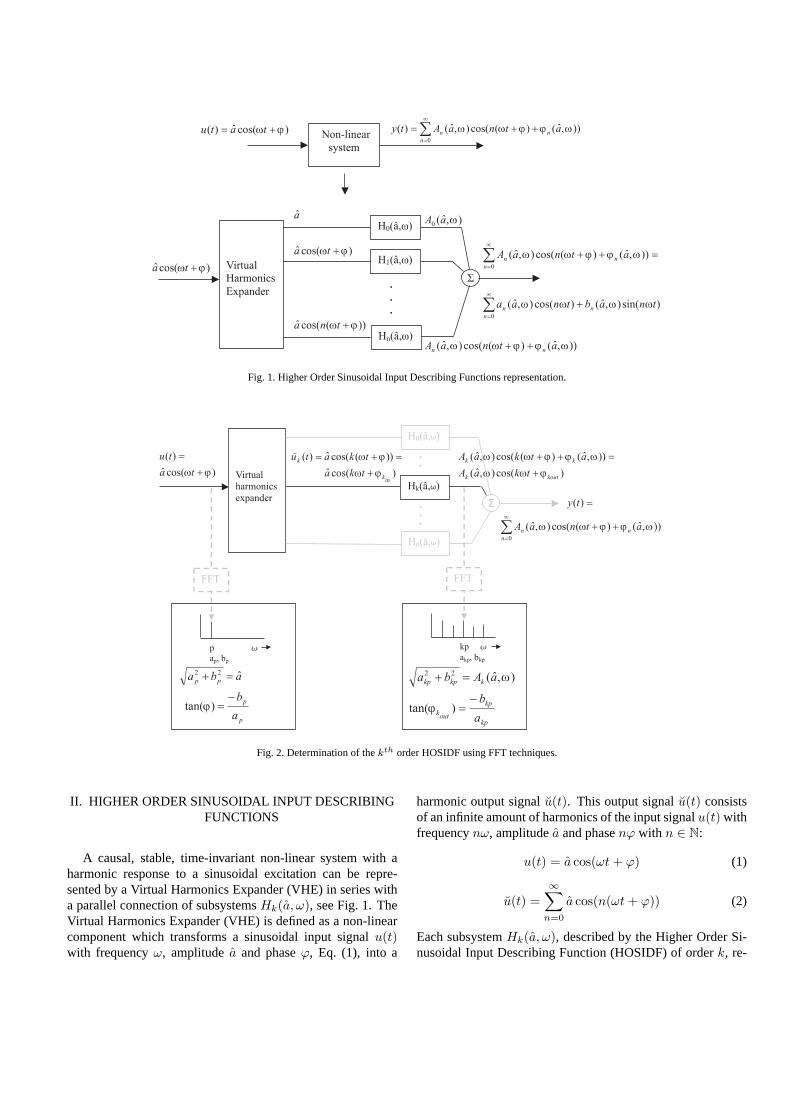
Fig. 2. Determination of thekth order HOSIDF using FFT techniques.
II. HIGHER ORDER SINUSOIDAL INPUT DESCRIBINGFUNCTIONS
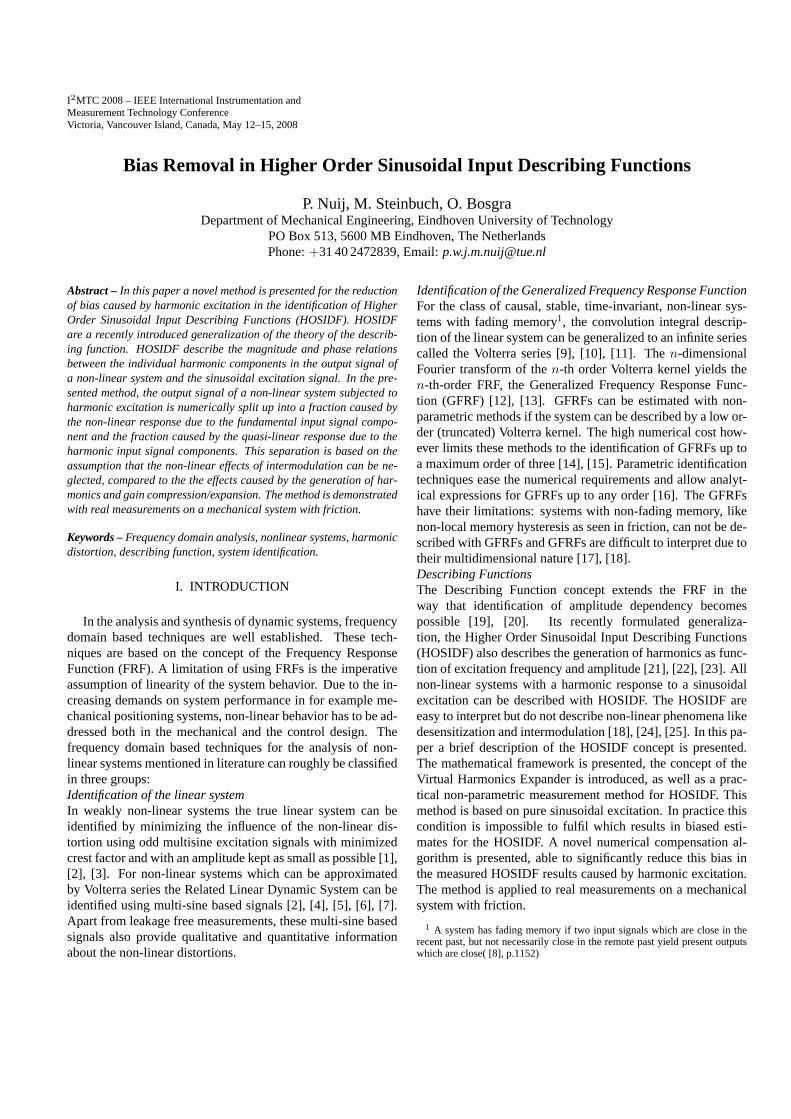
A causal, stable, time-invariant non-linear system with aharmonic response to a sinusoidal excitation can be repre-sented by a Virtual Harmonics Expander (VHE) in series witha parallel connection of subsystemsHk(a, ω), see Fig. 1. TheVirtual Harmonics Expander (VHE) is defined as a non-linearcomponent which transforms a sinusoidal input signalu(t)with frequencyω, amplitudea and phaseϕ, Eq. (1), into a
harmonic output signalu(t). This output signalu(t) consistsof an infinite amount of harmonics of the input signalu(t) withfrequencynω, amplitudea and phasenϕ with n ∈ N:
u(t) = a cos(ωt + ϕ) (1)
u(t) =∞∑
n=0
a cos(n(ωt + ϕ)) (2)
Each subsystemHk(a, ω), described by the Higher Order Si-nusoidal Input Describing Function (HOSIDF) of orderk, re-
lates thekth harmonic component of the non-linear system out-puty(t) to the corresponding harmonic componentuk(t) of theVirtual Harmonics Expander. The HOSIDF can be interpretedas a descriptor of the individual harmonic distortion compo-nents in the output of a time invariant non-linear system with aharmonic response as function of the amplitude and frequencyof the driving sinusoid. In steady state the HOSIDF are calcu-lated from the corresponding Fourier coefficients:
Hk(a, ω) =Ak(a, ω)ej(k(ωt+ϕ)+ϕk(a,ω))
aejk(ωt+ϕ)
=Ak(a, ω)ej(ϕk(a,ω))
a
=1
a(bk(a, ω) + jak(a, ω)) (3)
III. NON-PARAMETRIC IDENTIFICATION OF HOSIDF
Fig. 2 shows the calculation of thekth order HOSIDF. Boththe input signalu(t) and output signaly(t) are Fourier trans-formed. The frequency spacing is∆f = 1/Tb with Tb thelength of the data block.Tb is chosen a multiplep times theperiodT = 2π/ω of the excitation signal. The power of theexcitation signal is concentrated in frequency-linep, the powerof the response signal is fully concentrated in the frequencylinesn.p with n ∈ N so leakage is absent.
From Fig. 2 can be seen that:
tan(ϕ) =−bp
ap
(4)
tan(ϕkout) =
−bkp
akp
(5)
The phase angletan(ϕkout) is the sum of the phase of thekth
component of the Virtual Harmonics Expander and the systemphaseϕp(a, ω):
ϕkout= ϕkin
+ ϕk(a, ω) = kϕ + ϕk(a, ω) (6)
Since the phaseϕ of the excitation signalu(t) can be deter-mined, the phaseϕk(a, ω) of the HOSIDF can be calculatedfrom Eq. (4)..(6). The magnitude of thekth order HOSIDFcan be calculated as:
|Hk(a, ω)| =
√
a2kp + b2
kp√
a2p + b2
p
(7)
From Eq. (4)..(7) can be concluded that the HOSIDF can beidentified without knowledge of the output signalu(t) of theVirtual Harmonics Generator.
IV. REDUCTION OF BIAS IN HOSIDFMEASUREMENTS DUE TO HARMONIC
EXCITATION
As a result of the implemented amplitude-time relation ofthe excitation signal, hardware restriction on the signal sourceand the loading of the excitor due to the non-linear impedanceof the load, harmonics of the excitation sinusoid will be presentat the input of the system under test. This conflicts with the si-nusoidal excitation condition defined in Eq. (1). This harmonicinput signalu(t) causes several non-linear phenomena in theoutput signaly(t) like:
Gain compression/expansion.The input amplitude depen-dent relation between an input frequency componentω0
and the output signal at frequencyω0. This mechanism iscompletely described by the first order SIDF.
Generation of harmonics.The generation of harmonics asfunction of frequency and input amplitude which is de-scribed by the higher order SIDF.
Desensitization.Desensitization describes the influence aninput frequency componentω1 has on a not harmonicallyrelated output component with frequencyω2.
Intermodulation.As the result of intermodulation, two in-put frequency components of for example5ω0 and3ω0
will cause an output frequency component2ω0.Neglecting the non-linear effects of desensitization and inter-modulation, a numerical compensation of the presence of har-monics at the input for the system under test is possible. Sup-pose the input signalu(t) can be decomposed into its harmoniccomponentsU(ω) =
∑
∞
n=0 Un with n ∈ N. Likewise the out-puty(t) of the system can be expressed asY (ω) =
∑
∞
n=0 Yn.Let us consider the signal equations relating the excitation sig-nal componentsU1 andUn to the first harmonic componentY1
and thenth harmonic componentYn of Y (ω) (Fig. 3).
Σ
Hn1
H11 Σ
H1n
U1
Un
Yn
Y=Y1+YnY1
Fig. 3. Bias in the estimate of thenth order SIDF due to harmonic
components in the excitation signal.
Under these conditions the output componentYn only con-sists of the responses toU1 andUn:
Y1 = U1 · H11 (8)
Yn = U1 · H1n + Un · Hn1 (9)
with H11 the approximated first order SIDF atω relatingU1
and Y1. Hn1 represents the relation between thenth order
harmonicUn in the excitation signal and its contribution tothe total content ofYn. Hn1 can be estimated by evaluatingthe approximated first order SIDFH11 at the frequenciesnω.With the assumption of negligible intermodulation,H11 andthusHn1 can be identified without bias.H1n is thenth orderSIDF and models the contribution of the first harmonicU1 inthe excitation signal to the output signalYn. This term mod-els the generation of thenth harmonic as function of the firstharmonic. Without taking the contribution of the harmonic ex-citation componentUn into account the estimate forH1n willbe:
H1n =Yn
U1(10)
A better estimate can be made by incorporating the contribu-tion of Un:
H1n =Yn
U1−
Un
U1Hn1 (11)
V. EXAMPLE
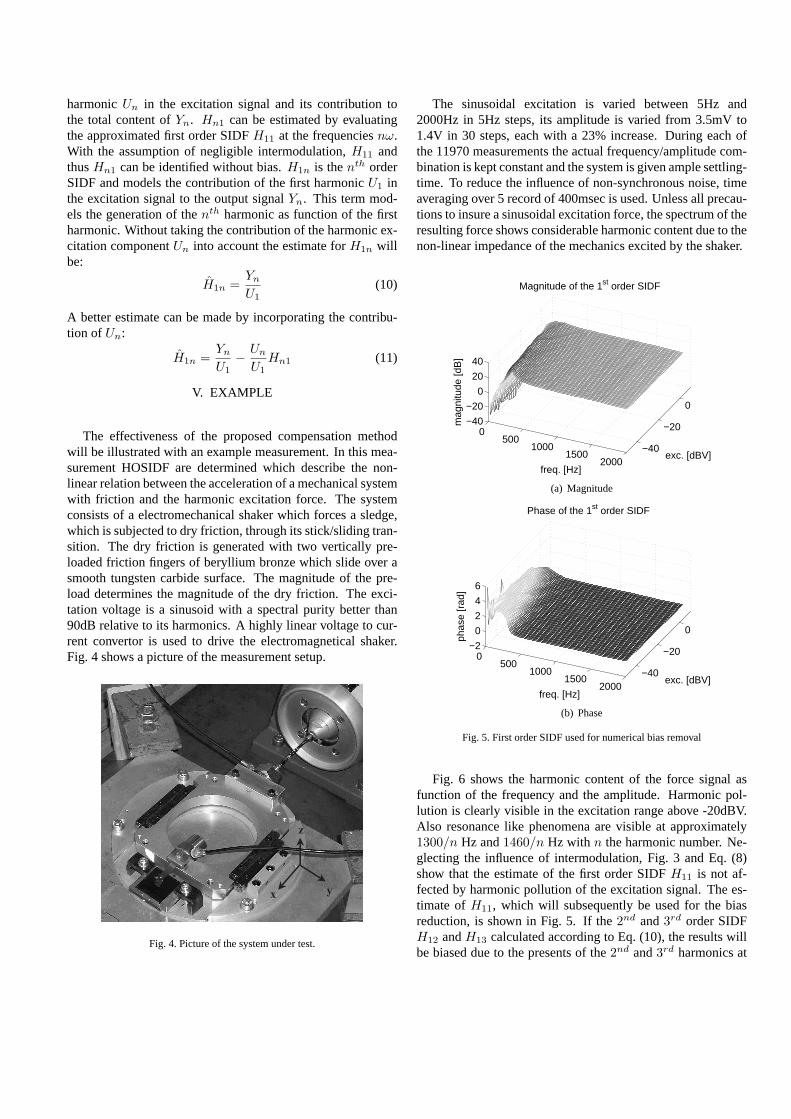
The effectiveness of the proposed compensation methodwill be illustrated with an example measurement. In this mea-surement HOSIDF are determined which describe the non-linear relation between the acceleration of a mechanical systemwith friction and the harmonic excitation force. The systemconsists of a electromechanical shaker which forces a sledge,which is subjected to dry friction, through its stick/sliding tran-sition. The dry friction is generated with two vertically pre-loaded friction fingers of beryllium bronze which slide overasmooth tungsten carbide surface. The magnitude of the pre-load determines the magnitude of the dry friction. The exci-tation voltage is a sinusoid with a spectral purity better than90dB relative to its harmonics. A highly linear voltage to cur-rent convertor is used to drive the electromagnetical shaker.Fig. 4 shows a picture of the measurement setup.
x y
z
Fig. 4. Picture of the system under test.
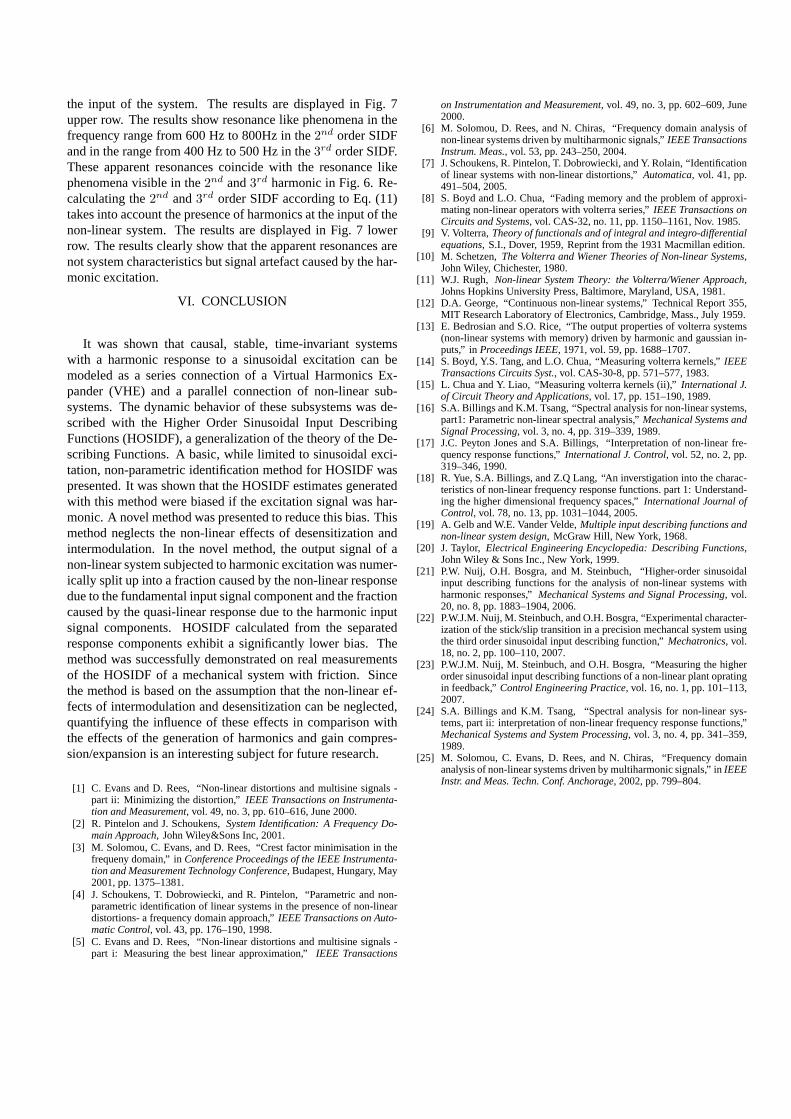
The sinusoidal excitation is varied between 5Hz and2000Hz in 5Hz steps, its amplitude is varied from 3.5mV to1.4V in 30 steps, each with a 23% increase. During each ofthe 11970 measurements the actual frequency/amplitude com-bination is kept constant and the system is given ample settling-time. To reduce the influence of non-synchronous noise, timeaveraging over 5 record of 400msec is used. Unless all precau-tions to insure a sinusoidal excitation force, the spectrumof theresulting force shows considerable harmonic content due tothenon-linear impedance of the mechanics excited by the shaker.
0500
10001500
2000−40
−20
0
−40
−20
0
20
40
exc. [dBV]
Magnitude of the 1st order SIDF
freq. [Hz]m
agni
tude
[dB
]
(a) Magnitude
0500
10001500
2000−40
−20
0
−2
0
2
4
6
exc. [dBV]
Phase of the 1st order SIDF
freq. [Hz]
phas
e [r
ad]
(b) Phase
Fig. 5. First order SIDF used for numerical bias removal
Fig. 6 shows the harmonic content of the force signal asfunction of the frequency and the amplitude. Harmonic pol-lution is clearly visible in the excitation range above -20dBV.Also resonance like phenomena are visible at approximately1300/n Hz and1460/n Hz with n the harmonic number. Ne-glecting the influence of intermodulation, Fig. 3 and Eq. (8)show that the estimate of the first order SIDFH11 is not af-fected by harmonic pollution of the excitation signal. The es-timate ofH11, which will subsequently be used for the biasreduction, is shown in Fig. 5. If the2nd and3rd order SIDFH12 andH13 calculated according to Eq. (10), the results willbe biased due to the presents of the2nd and3rd harmonics at
the input of the system. The results are displayed in Fig. 7upper row. The results show resonance like phenomena in thefrequency range from 600 Hz to 800Hz in the2nd order SIDFand in the range from 400 Hz to 500 Hz in the3rd order SIDF.These apparent resonances coincide with the resonance likephenomena visible in the2nd and3rd harmonic in Fig. 6. Re-calculating the2nd and3rd order SIDF according to Eq. (11)takes into account the presence of harmonics at the input of thenon-linear system. The results are displayed in Fig. 7 lowerrow. The results clearly show that the apparent resonances arenot system characteristics but signal artefact caused by the har-monic excitation.
VI. CONCLUSION
It was shown that causal, stable, time-invariant systemswith a harmonic response to a sinusoidal excitation can bemodeled as a series connection of a Virtual Harmonics Ex-pander (VHE) and a parallel connection of non-linear sub-systems. The dynamic behavior of these subsystems was de-scribed with the Higher Order Sinusoidal Input DescribingFunctions (HOSIDF), a generalization of the theory of the De-scribing Functions. A basic, while limited to sinusoidal exci-tation, non-parametric identification method for HOSIDF waspresented. It was shown that the HOSIDF estimates generatedwith this method were biased if the excitation signal was har-monic. A novel method was presented to reduce this bias. Thismethod neglects the non-linear effects of desensitizationandintermodulation. In the novel method, the output signal of anon-linear system subjected to harmonic excitation was numer-ically split up into a fraction caused by the non-linear responsedue to the fundamental input signal component and the fractioncaused by the quasi-linear response due to the harmonic inputsignal components. HOSIDF calculated from the separatedresponse components exhibit a significantly lower bias. Themethod was successfully demonstrated on real measurementsof the HOSIDF of a mechanical system with friction. Sincethe method is based on the assumption that the non-linear ef-fects of intermodulation and desensitization can be neglected,quantifying the influence of these effects in comparison withthe effects of the generation of harmonics and gain compres-sion/expansion is an interesting subject for future research.
[1] C. Evans and D. Rees, “Non-linear distortions and multisine signals -part ii: Minimizing the distortion,” IEEE Transactions on Instrumenta-tion and Measurement, vol. 49, no. 3, pp. 610–616, June 2000.
[2] R. Pintelon and J. Schoukens,System Identification: A Frequency Do-main Approach, John Wiley&Sons Inc, 2001.
[3] M. Solomou, C. Evans, and D. Rees, “Crest factor minimisation in thefrequeny domain,” inConference Proceedings of the IEEE Instrumenta-tion and Measurement Technology Conference, Budapest, Hungary, May2001, pp. 1375–1381.
[4] J. Schoukens, T. Dobrowiecki, and R. Pintelon, “Parametric and non-parametric identification of linear systems in the presence ofnon-lineardistortions- a frequency domain approach,”IEEE Transactions on Auto-matic Control, vol. 43, pp. 176–190, 1998.
[5] C. Evans and D. Rees, “Non-linear distortions and multisine signals -part i: Measuring the best linear approximation,”IEEE Transactions
on Instrumentation and Measurement, vol. 49, no. 3, pp. 602–609, June2000.
[6] M. Solomou, D. Rees, and N. Chiras, “Frequency domain analysis ofnon-linear systems driven by multiharmonic signals,”IEEE TransactionsInstrum. Meas., vol. 53, pp. 243–250, 2004.
[7] J. Schoukens, R. Pintelon, T. Dobrowiecki, and Y. Rolain, “Identificationof linear systems with non-linear distortions,”Automatica, vol. 41, pp.491–504, 2005.
[8] S. Boyd and L.O. Chua, “Fading memory and the problem of approxi-mating non-linear operators with volterra series,”IEEE Transactions onCircuits and Systems, vol. CAS-32, no. 11, pp. 1150–1161, Nov. 1985.
[9] V. Volterra, Theory of functionals and of integral and integro-differentialequations, S.I., Dover, 1959, Reprint from the 1931 Macmillan edition.
[10] M. Schetzen,The Volterra and Wiener Theories of Non-linear Systems,John Wiley, Chichester, 1980.
[11] W.J. Rugh, Non-linear System Theory: the Volterra/Wiener Approach,Johns Hopkins University Press, Baltimore, Maryland, USA, 1981.
[12] D.A. George, “Continuous non-linear systems,” Technical Report 355,MIT Research Laboratory of Electronics, Cambridge, Mass., July 1959.
[13] E. Bedrosian and S.O. Rice, “The output properties of volterra systems(non-linear systems with memory) driven by harmonic and gaussian in-puts,” inProceedings IEEE, 1971, vol. 59, pp. 1688–1707.
[14] S. Boyd, Y.S. Tang, and L.O. Chua, “Measuring volterra kernels,” IEEETransactions Circuits Syst., vol. CAS-30-8, pp. 571–577, 1983.
[15] L. Chua and Y. Liao, “Measuring volterra kernels (ii),”International J.of Circuit Theory and Applications, vol. 17, pp. 151–190, 1989.
[16] S.A. Billings and K.M. Tsang, “Spectral analysis for non-linear systems,part1: Parametric non-linear spectral analysis,”Mechanical Systems andSignal Processing, vol. 3, no. 4, pp. 319–339, 1989.
[17] J.C. Peyton Jones and S.A. Billings, “Interpretation of non-linear fre-quency response functions,”International J. Control, vol. 52, no. 2, pp.319–346, 1990.
[18] R. Yue, S.A. Billings, and Z.Q Lang, “An inverstigationinto the charac-teristics of non-linear frequency response functions. part 1: Understand-ing the higher dimensional frequency spaces,”International Journal ofControl, vol. 78, no. 13, pp. 1031–1044, 2005.
[19] A. Gelb and W.E. Vander Velde,Multiple input describing functions andnon-linear system design, McGraw Hill, New York, 1968.
[20] J. Taylor, Electrical Engineering Encyclopedia: Describing Functions,John Wiley & Sons Inc., New York, 1999.
[21] P.W. Nuij, O.H. Bosgra, and M. Steinbuch, “Higher-order sinusoidalinput describing functions for the analysis of non-linear systems withharmonic responses,”Mechanical Systems and Signal Processing, vol.20, no. 8, pp. 1883–1904, 2006.
[22] P.W.J.M. Nuij, M. Steinbuch, and O.H. Bosgra, “Experimental character-ization of the stick/slip transition in a precision mechancal system usingthe third order sinusoidal input describing function,”Mechatronics, vol.18, no. 2, pp. 100–110, 2007.
[23] P.W.J.M. Nuij, M. Steinbuch, and O.H. Bosgra, “Measuring the higherorder sinusoidal input describing functions of a non-linear plant opratingin feedback,”Control Engineering Practice, vol. 16, no. 1, pp. 101–113,2007.
[24] S.A. Billings and K.M. Tsang, “Spectral analysis for non-linear sys-tems, part ii: interpretation of non-linear frequency response functions,”Mechanical Systems and System Processing, vol. 3, no. 4, pp. 341–359,1989.
[25] M. Solomou, C. Evans, D. Rees, and N. Chiras, “Frequency domainanalysis of non-linear systems driven by multiharmonic signals,” in IEEEInstr. and Meas. Techn. Conf. Anchorage, 2002, pp. 799–804.
0 500 1000 1500 2000
−40
−20
0
−80−60−40−20
0
exc. [dBV]
freq. [Hz]
harm. 1
mag
nitu
de [d
B]
0500
1000
−40
−20
0
−100
−50
exc. [dBV]
freq. [Hz]
harm. 2
mag
nitu
de [d
B]
0 200 400 600−40
−20
0
−100
−50
exc. [dBV]
freq. [Hz]
harm. 3
mag
nitu
de [d
B]
0 100 200 300 400 500
−40
−20
0
−100
−50
exc. [dBV]
freq. [Hz]
harm. 4
mag
nitu
de [d
B]
Fig. 6. Harmonic content of the excitation signal as functionof frequency and excitation magnitude.
0500
1000
−40
−20
0
−80−60−40−20
020
exc. [dBV]
freq. [Hz]
2nd order biased
mag
nitu
de [d
B]
0500
1000
−40
−20
0
−80−60−40−20
020
exc. [dBV]
freq. [Hz]
2nd order compensated
mag
nitu
de [d
B]
0 200 400 600−40
−20
0
−80−60−40−20
020
exc. [dBV]
freq. [Hz]
3rd order biased
mag
nitu
de [d
B]
0 200 400 600−40
−20
0
−80−60−40−20
020
exc. [dBV]
freq. [Hz]
3rd order compensated
mag
nitu
de [d
B]
Fig. 7. Biased and compensated HOSIDF as function of frequency and excitation magnitude.