28
| Date post: | 21-Dec-2015 |
| Category: |
Documents |
| View: | 214 times |
| Download: | 0 times |


Bio-Doug McCutcheon• NZ for 3 years
– Won the Computerworld Best Project Implementation 2005
• Europe and USA for 5 years, SAP Project Manager, in manufacturing, retail,energy and telecommunications
• Project managed the rollout of Microsoft client/server to Shell UK, 2 years.
• Banking industry, HSBC, 5 years• I.T. Hardware/Software vendors 3 years
Prime/Wang

Organisational Objective
To generate sustainable growth in shareholder value through
successful business change .

Business Challenges Faced by the Organization
ChangingMarkets
Technical Advances
Economic/Regulatory Pressures
Increasing Competition
Current Value of Organisation
Future Value of Organisation
Stra
teg
y
B
usin
ess
FinanceFinance
CustomersCustomers
ProcessesProcesses
People & ToolsPeople & Tools

Strategic Strategic ManagementManagement
Optimise investment decisions based on objectives against and capability and maturity
ProgramProgramManagementManagement
PortfolioPortfolioManagementManagement
Manage project inter-dependencies & resources
ProjectProjectManagementManagement
Manage time, resource & scope
ProgramProgramManagementManagement
Setting of Strategic Goals
Define objectives from strategic goals
Priortising delivery of Objectives
Integrated Delivery
Enterprise Project ManagementFramework for Meeting Challenges

Project Work“Welcome to the new economy where most of the world’s work will be done in semi- permanent networks of small project oriented teams.”
- Tom Peters - Tom Peters
Liberation ManagementLiberation Management

New Product DevelopmentThe best, the rest…
BEST REST
Profits from new products
49.1 % 21.2%
Ideas per one success
4 9.2
First-to-Market Strategy
1995 – 2004
44% - 49.5%
1995 – 2004
30% - 25.3%
Source: PDMA Foundation Comparative Performance Assessment Study, 2004
“the right focus on management of the product development process combined with the best technology and tools to support that will enable more new product introductions, higher profits and a better “hit” rate”

The pain, without an approach
• STRATEGY. – .. a strategy that can not be implemented is of little use — many times the link
between investments in programmes and projects and the direction of strategy is often weak or invisible.
– 89% of companies are flying blind, with virtually no metrics in place except for finance
• PORTFOLIO. – 84% of companies are unable to adjust and align their budgets with business needs
more than once or twice a year
• PROJECTS. – Over 50% of organisations, in recent surveys, have experienced project failures in
the last 12 months….. the average cost of a project failure is $US10M– 84% of companies either do not do business cases for any of their IT projects or do
them only on select/key projects
Metagroup/Deloitte Ltd

STRATGEY : Sometimes strategic direction is lost

FINANCEFINANCE
CUSTOMERSCUSTOMERS
PROCESSES (INTERNAL)PROCESSES (INTERNAL)
PEOPLE AND TOOLSPEOPLE AND TOOLS
Strategy Map – Balanced Scorecard
Human CapitalSkillsTrainingKnowledge
Information CapitalSystemsDatabasesNetworks
Organization CapitalCultureLeadershipAlignmentTeamwork
Improve coststructure
Increase assetutilization
EnhanceCustomer value
Expand revenueopportunities
Price Quality Availability Selection Functionality Service Partnership Brand
OperationsManagement
CustomerManagement
InnovationRegulatoryand Social
Kaplan, R., Norton, D. (February, 2004)Measuring the strategic readiness of Kaplan, R., Norton, D. (February, 2004)Measuring the strategic readiness of intangible assets. intangible assets. Harvard Business Review, 52 - 63Harvard Business Review, 52 - 63

Financial Perspective
Customer Perspective
OperationalPerspective
Employees &Technology Perspective
Theme: Smart, Profitable Expansion
Increase Sales efficiency
Revenue per FTE
50% Revenue from New Storesby Year 3
% revenue from storesopened in last 3 years
Revenue from newstores
Avg. # days to breakeven
Great New Locations
Avg daily customersat new stores in first
6 months# repeat customers
Avg purchase amount
Fact-based site selectionLag between market
selection and siteacquisition
Development Project Management
Project duration: siteacquisition to opening
day
% of stores openedon schedule
Corporate Digital NervousSystemBusiness Intelligence Use
# Eligible EmployeesTrained

Strategic Theme: Smart, Profitable Expansion
Objective Measure Target Initiative % Revenue from stores opened in last 3 years
> 30% year 1 > 50% year 3
Marketing to new target markets Increase % of revenue
from new stores Avg. # of days to breakeven
< 180 days year 1 < 130 days year 3
Operations review Site selection
Fin
an
cia
l
Increase sales efficiency
Revenue per FTE
> $ X year 1 > $ Y year 3
Self-service checkout pilot
Avg. # daily customers > X in first 6 mos., > Y in first year, > Z by year 3
Local marketing/PR campaigns
# of repeat customers
> X in first 6 mos., > Y in first year, > Z by year 3
Customer loyalty program
Cu
sto
me
r
Acquire new locations
Avg. $ customer purchase
> $ X year 1 > $ Y year 3
Coupon program In-store promotions & classes
Fact-based site selection
Days lag between market selection and site acquisition
< 90 days year 1 < 70 days year 3
GIS mapping National brokerage contract
Project duration, site acquisition to opening
< 365 days year 1 < 300 days year 3
Standardize design/build processes
Pro
cess
Streamline development process % stores open on
schedule > 93% year 1 > 95% year 2
Web-based project management
Use business intelligence systems
% eligible employees trained
>90% year 1 >99% year 2
In-house system training
Le
arn
ing
&
Gro
wth
Integrated knowledge management
# paper forms used < 200 year 1 < 100 year 2 < 5 year 3
Corporate digital nervous system

STRATEGY MAP TRANSPARENCY

PORTFOLIO Sometimes
portfolio management and strategic direction are not aligned and carried out by the
wrong person
You tell him we want our
resource back
PM

PORTFOLIO ARTICULATION
PROPOSED BUDGET
$
FY0x

# PortfolioStrategic
ValueTotal EBIT
Original Selection 51% $389 M
Optimal Selection 82% $564 M
Final Selection (includes mandated projects)
75% $526 M
2
3
1
Strategic Value Gain = 24%
EBIT Increase = $137 MM
3
1
2
Gaining Control: Portfolio Optimization Led to Gains of $137mm EBIT, 24% Strategic Value for Same Budget

PROGRAM ARTICULATION
Integration Management
Scope Management
Time Management
Cost Management
Risk ManagementProcurement Management
Quality Management H R Management
Communications Management
Nine Knowledge areas PMI
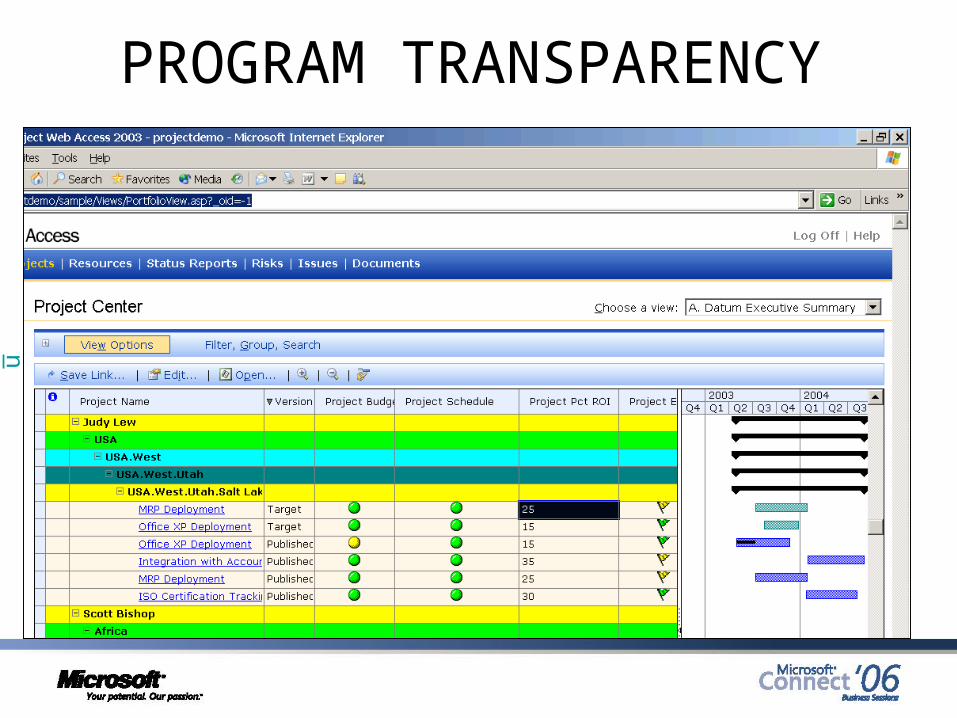
PROGRAM TRANSPARENCY

PROJECTS: Are your Projects Behind Schedule?
PROJECTS: Are your Projects Behind Schedule?
Dilbert: Scott AdamsDilbert: Scott Adams

PROJECT ARTICULATION
QUALITY
RE
SO
UR
CE
TIME

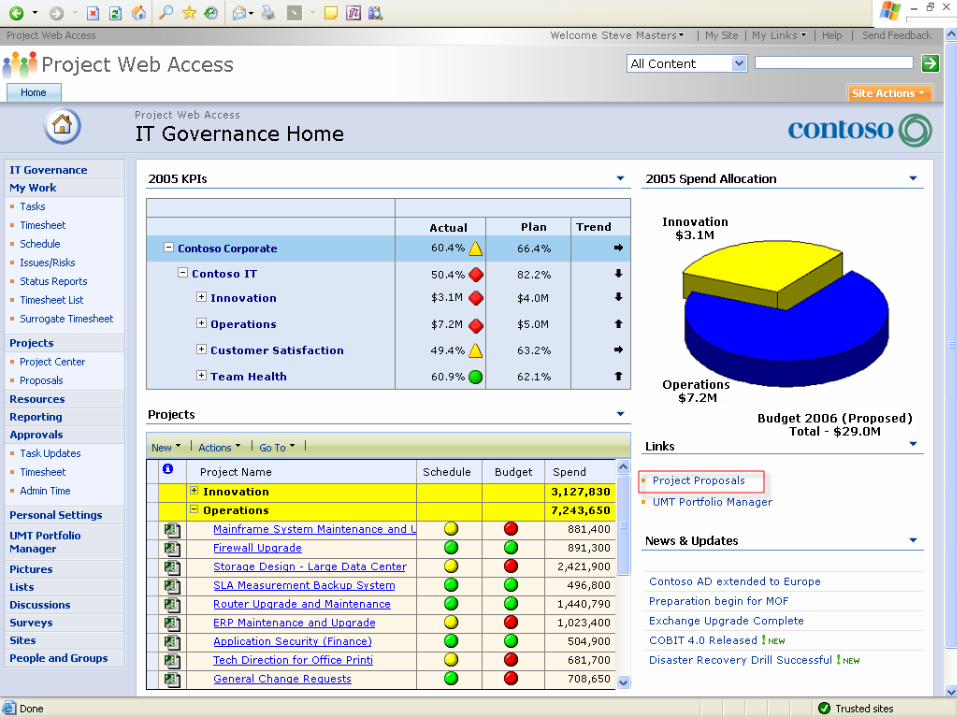
PROJECT TRANSPARENCY

PROJECT TRANSPARENCY

Why Microsoft for Enterprise Project Management?
• Microsoft has never had stronger proposition in the area of Enterprise Project Management processes as it does now.
• The products be aligned EPM areas as a stand alone or in an integrated stack.
• The products are scalable and can be grown both technically and from a user capability point of view.
• The products competitively priced

Strategic Strategic ManagementManagement
ProgramProgramManagementManagement
PortfolioPortfolioManagementManagement
ProjectProjectManagementManagement
ProgramProgramManagementManagement
Setting of Strategic Goals
Priortising delivery of Objectives
Integrated Delivery
The ProductsFramework for Meeting Challenges
PROFIT
COST
Office Project Portfolio Manager


The pleasure: Business Strategy + Enterprise Project Management = Sustainable Shareholder Growth
“Organisations with enterprise PM standards will experience half the project cost overuns, delays and cancellations of those that don’t” –
Gartner Group
“In large “projectised” organisations, the lead time to market has been reduced by as much as 60%, development costs have declined, and
forecasting accuracy has increased” – PMI “Best Practises” Benchmarking Report
“Existing project costs can be reduced 10 – 30% by eliminating redundancies, conflicting initiatives, and projects not paying dividends” -
PMI “Best Practises” Benchmarking Report
A minimum 2% (often 2-5%) improvement in the total annual costs of project-related resources. - Aberdeen Group

Thank You – there will be a lunch time session that demonstrates aspects of the EPM solution, please attend it will be the
best session
Doug [email protected]
021-749-151
References:Web Sites
Balanced Score Carding, http://www.microsoft.com/office/previous/xp/business/intelligence/scorecard.asp
Portfolio Management. http:// www.pmi.org, http:// www.microsoft.com/epm, http://www.mpug.org/
Program management http:// www.pmi.org, http:// www.microsoft.com/epm, http://www.mpug.org/
Project Management http:// www.pmi.org, http:// www.microsoft.com/epm, http://www.mpug.org/
Books
Strategy Maps Robert S. Kaplan, David P. NortonEnterprise Programme Management – Delivering Value, Tim Parr, David Williams


