Page 1
Bioconcentration, elimination and
effects of fire foam-related poly-
and perfluoroalkyl substances in
brown trout (Salmo trutta)
Silje Modahl Johanson
MASTER THESIS IN TOXICOLOGY
Department of Biosciences
Faculty of Mathematics and Natural Sciences
UNIVERSITY OF OSLO
June 2015
Page 3
III
© Silje Modahl Johanson
2015
Bioconcentration, elimination and effects of fire foam-related poly- and perfluoroalkyl
substances in brown trout (Salmo trutta)
Silje Modahl Johanson
Supervisors: Prof. Ketil Hylland, Ph.D Tor Fredrik Holth, Ph.D Gro Dehli Villanger
http://www.duo.uio.no/
Print: Reprosentralen, University of Oslo
Page 5
V
Acknowledgements
The work presented in this master thesis was accomplished at the Department of Biosciences,
Faculty of Mathematics and Natural Sciences, at the University of Oslo in cooperation with
another master student, Stine Hellstad. My supervisors have been Prof. Ketil Hylland, Ph.D
Tor Fredrik Holth and Ph.D Gro Dehli Villanger.
I would like to thank Ketil for all the guidance and advice you have given me throughout this
thesis, and for pushing me onwards when I needed it. A special thank you to my co-
supervisor, Tor Fredrik, for all the help you have given me during the laboratory work. You
have always had an open door and a quick reply, and thank you for teaching me the necessary
steps and procedures in the laboratory. I would also like to thank Per-Johan Færøvig for
lending me a helping hand during laboratory work.
Thank you Gro, Beate Løland, Gijs Breedveld and Cato Andre Eriksen for a nice time during
field work and for letting me and Stine use the results from the chemical analysis of
groundwater and water from Lavangsvatnet near Harstad/Narvik Airport Evenes.
This project was partly founded by Avinor AS, and I thank Jarl Øvstedal, Bente Wejden and
Trine Reistad for the interest they have shown. I wold also like to thank Hanne-Monica
Reinback and Sylvi Skau at Eurofins for their help and responsibilities in conducting the
chemical analyses of trout and water in this study.
A big thank you, Stine, for been my friend and colleague during this project. Thank you for
always being available for a talk or discussion and for keeping up with me when times were
stressful and difficult. I could not have done this without you. Thank you, dad (Lennart
Johanson) and Randi Grønnestad for proof-reading this thesis. I thank you Morten for being
so patient, loving and supportive, and for always encouraging me to do my best. I would also
like to thank my fellow students, especially Randi, Ragna Byrkjeland, Catharina Broch, Line
Merete Karlsøen and Karl Johan Ullavik Bakken for all the support, help and love you have
given me.
Silje Modahl Johanson. Oslo, May 2015
Page 7
VII
Abstract
Poly- and perfluoroalkyl substances (PFASs) are anthropogenic and persistent chemicals used
as surfactants in many applications, including aqueous film-forming foams (AFFFs, fire
foams). Regular training exercises utilising AFFFs have led to the direct releases of PFASs
into the environment and subsequently a global distribution of the compounds. PFAS
contamination of soil and water has been reported around multiple Norwegian airports such as
in the lake Lavangsvatnet near Harstad/Narvik Airport Evenes. This study aimed to quantify
the bioconcentration, elimination and effects of selected fire foam-related PFASs on
biomarkers for the induction of metabolic enzymes (ethoxyresorufin O-deethylase), oxidative
damage (lipid peroxidation and peroxisomal acyl-CoA oxidase) and liver damage (alanine
aminotransferase). Juvenile brown trout (Salmo trutta) were exposed through water to two
levels of a PFAS mixture (PFOS, PFHxS, 6:2 FTS, PFPeA, PFHxA and PFOA) for three
weeks. The “low” PFAS concentrations (10 µg/L total PFASs) were made to resemble the
levels of contamination detected in Lavangsvatnet. The exposure period was followed by a
depuration period of ten weeks. Only PFOS and PFHxS were detected in a large proportion of
the trout sampled during exposure and depuration. Both the compounds bioconcentrated
significantly in trout exposed to the “high” concentration (785 µg/L total PFASs); however,
only PFHxS were significantly increasing during the exposure period in fish from the “low”
treatment. Bioconcentration factors were calculated to be 244 and 185 L/kg for PFOS, and
6.34 and 11.2 L/kg for PFHxS in trout from the “high” and “low” treatments, respectively.
PFOS did not appear to be eliminated following the ten weeks of depuration. The
concentrations of PFHxS decreased significantly during the depuration period in trout from
the “high” treatment, and the half-life of this compound was estimated to 2.3 weeks. Activity
of the CYP1A enzyme (by the analysis of ethoxyresorufin O-deethylase activity) in gills was
increased in trout exposed to the “low” concentration of PFASs ten weeks after terminated
exposure. Neither biomarkers for oxidative damage nor liver damage were significantly
affected in the trout. Differences in the sensitivity to PFOS and PFHxS have previously been
documented between various species. Based on the results presented in this study, the PFAS
contamination in Lavangsvatnet would not be expected to cause oxidative damage or liver
damage in the population of trout inhabiting this lake. PFOS would, however, be expected to
reside in the trout and induce the activity of CYP1A in gills a while after terminated exposure.
Page 9
IX
Abbreviations
6:2 FTS – 6:2 Fluorotelomer sulfonate
AFFF – Aqueous film-forming foam
ALAT – Alanine aminotransferase
ANOVA – Analysis of variance
AOX – Acyl-CoA oxidase
BCF – Bioconcentration factor
CI – Confidence interval
CYP1A – Cytochrome P450, family 1, subfamily A
DDT – p,p’-Dichlorodiphenyltrichloroethane
DL – Detection limit
DMSO – Dimethyl sulfoxide
EROD – Ethoxyresorufin O-deethylase
H2O2 – Hydrogen peroxide
HC – Hepes Cortland
HCB – Hexachlorobenzene
MDA – Malondialdehyde
OD – Optical density
PAH – Polycyclic aromatic hydrocarbon
PBDE – Polybrominated diphenyl ether
PC – Principal component
PCA – Principal component analysis
PCB – Polychlorinated biphenyl
PFBA – Perfluorobutanoic acid
PFBS – Perfluorobutane sulfonate
PFDA – Perfluorodecanoic acid
PFHpA – Perfluoroheptanoic acid
PFHxA – Perfluorohexanoic acid
PFHxS – Perfluorohexane sulfonate
PFNA – Perfluorononanoic acid
PFOA – Perfluorooctanoic acid
PFOS – Perfluorooctane sulfonate
Page 10
X
PFPeA – Perfluoropentanoic acid
POP – Persistent organic pollutant
SD – Standard deviation
TBA – Thiobarbituric acid
TBARS – Thiobarbituric acid reactive substances
TCA – Trichloroacetic acid
TCDD – 2,3,7,8-Tetrachlorodibenzo-p-dioxin
β-NADH – β-nicotinamide adenine dinucleotide
Page 11
XI
Table of contents
Acknowledgements ................................................................................................................... V
Abstract ................................................................................................................................... VII
Abbreviations ........................................................................................................................... IX
1. Introduction ............................................................................................................................ 1
1.1 Poly- and perfluoroalkyl substances ................................................................................ 1
1.2 Effects of PFASs .............................................................................................................. 4
1.2.1 Induction of metabolic enzymes ............................................................................... 4
1.2.2 Oxidative damage responses ..................................................................................... 5
1.2.3 Liver damage ............................................................................................................. 6
1.3 Brown trout as a model organism in aquatic toxicology .................................................. 7
1.4 Objectives ......................................................................................................................... 7
2. Materials and methods ........................................................................................................... 9
2.1 Chemicals ......................................................................................................................... 9
2.2 Experimental design ......................................................................................................... 9
2.2.1 Brown trout ............................................................................................................... 9
2.2.2 Experimental setup .................................................................................................... 9
2.2.3 PFAS exposure ........................................................................................................ 11
2.2.4 Sampling and storage .............................................................................................. 12
2.3 Validation of experimental setup and exposure ............................................................. 13
2.3.1 Temperature, oxygen and nitrite ............................................................................. 13
2.3.2 PFASs in water ........................................................................................................ 14
2.4 Chemical analysis of PFASs .......................................................................................... 15
2.5 Ethoxyresorufin O-deethylase activity in gills ............................................................... 16
2.6 Thiobarbituric acid reactive substances in gills and liver .............................................. 17
2.7 Peroxisomal acyl-CoA oxidase activity in liver ............................................................. 18
2.8 Protein analysis .............................................................................................................. 19
2.9 Alanine aminotransferase activity in plasma ................................................................. 20
2.10 Statistical analysis ........................................................................................................ 22
2.10.1 Estimation of half-life ........................................................................................... 23
2.10.2 Estimation of bioconcentration factors ................................................................. 24
Page 12
XII
2.10.3 Multivariate data analysis ...................................................................................... 24
3. Results .................................................................................................................................. 25
3.1 Bioconcentration and elimination of PFASs in trout ..................................................... 25
3.1.1 Exposure conditions and detection of PFASs ......................................................... 25
3.1.2 Bioconcentration ..................................................................................................... 26
3.1.3 Bioconcentration factors of PFOS and PFHxS ....................................................... 28
3.1.4 Elimination and half-life of PFOS and PFHxS ....................................................... 28
3.2 Effects of PFASs ............................................................................................................ 31
3.2.1 Ethoxyresorufin O-deethylase activity in gills ........................................................ 31
3.2.2 Thiobarbituric acid reactive substances in gills ...................................................... 32
3.2.3 Thiobarbituric acid reactive substances in liver ...................................................... 33
3.2.4 Peroxisomal acyl-CoA oxidase activity in liver ...................................................... 34
3.2.5 Alanine aminotransferase activity in plasma .......................................................... 35
3.2.6 Combined analysis of biomarker responses ............................................................ 37
4. Discussion ............................................................................................................................ 40
4.1 Bioconcentration and elimination of PFASs in trout ..................................................... 40
4.1.1 Exposure conditions and detection of PFASs ......................................................... 40
4.1.2 Bioconcentration ..................................................................................................... 41
4.1.3 Bioconcentration factors of PFOS and PFHxS ....................................................... 43
4.1.4 Elimination and half-life of PFOS and PFHxS ....................................................... 44
4.2 Effects of PFASs ............................................................................................................ 46
4.2.1 Ethoxyresorufin O-deethylase activity in gills ........................................................ 46
4.2.2 Thiobarbituric acid reactive substances in gills ...................................................... 48
4.2.3 Thiobarbituric acid reactive substances in liver ...................................................... 49
4.2.4 Peroxisomal acyl-CoA oxidase activity in liver ...................................................... 50
4.2.5 Alanine aminotransferase activity in plasma .......................................................... 52
4.2.6 Combined analysis of biomarker responses ............................................................ 54
4.3 Relationship of biomarker responses to gene expression ............................................... 55
5. Conclusions .......................................................................................................................... 58
6. Future recommendations ...................................................................................................... 59
7. References ............................................................................................................................ 60
8. Appendix .............................................................................................................................. 74
Page 13
1
1. Introduction
Originally, the definition of persistent organic pollutants (POPs) was limited to persistent and
lipophilic compounds (Jones and de Voogt 1999). Some of the newer POPs are, however, less
lipophilic and included in the POP-definition due to their global distribution, high resistance
against degradation and their potential to cause deleterious effects in humans, animals and the
environment. In recent years, the attention has gradually shifted from the originally defined
POP chemicals (e.g. PCBs, DDTs, HCBs, PBDEs, etc.) to the fluorinated organic compounds
(Muir and de Wit 2010, Ding and Peijnenburg 2013). In 2009 the Stockholm Convention on
Persistent Organic Pollutants was expanded to include newer POPs such as perfluorooctane
sulfonate, a well-known and widely used poly- and perfluoroalkyl substance (UNEP 2009,
Muir and de Wit 2010).
Once introduced in the environment, the distribution and fate of a compound is determined by
its physiochemical properties, which also affects the bioavailability of the compound to biota
(Ding and Peijnenburg 2013). The aquatic environment is known to be a reservoir for most
POPs (including poly- and perfluoroalkyl substances) (Paul et al. 2009), and gill-breathing
organisms are at risk of being highly exposed to chemicals present in the water. Direct uptake
and accumulation of chemicals from water is known as bioconcentration (Barron 1990, Arnot
and Gobas 2006). This may yield pronounced toxicological effects in the organism or its
offspring; however, bioconcentration without effects should still be regarded as a hazard in
the risk assessment process (van der Oost et al. 2003). In order to assess the risk factors
related to the use of legacy and newly included persistent chemicals, it is important to assess
toxicant effects and apply environmentally relevant model organisms, compounds and
concentrations. To the author’s knowledge, this is the first study to conduct a controlled
laboratory experiment assessing the bioconcentration and effects in brown trout (Salmo trutta)
utilising an environmentally relevant mixture of PFASs.
1.1 Poly- and perfluoroalkyl substances
The family of poly- and perfluoroalkyl substances (PFASs) comprises a large number of
anthropogenic POPs (Giesy and Kannan 2002). PFASs have been produced since the 50’s,
and have at least one (polyfluoroalkyl) or all (perfluoroalkyl) carbon-fluorine (C-F) bonds in
Page 14
2
the alkyl chain (Buck et al. 2011). Despite their long time of usage, they were not recognized
as global environmental pollutants until their presence was reported in wildlife (Giesy and
Kannan 2001) and humans (Kannan et al. 2004) early in the 21st century.
PFASs are amphipathic, and the strong C-F bonds result in a uniquely high chemical and
thermal stability (Kissa 2001, Buck et al. 2012). The production of PFASs is either conducted
by electrochemical fluorination or telomerisation yielding both linear and branched
fluorocarbon arrangements (De Silva et al. 2009, Buck et al. 2011, Buck et al. 2012). PFASs
are utilised in fire-fighting foams, water-, soil- and stain-resistant coatings, electronics, floor
polishers, photographic films, ski waxes and as insecticides (Renner 2001, Lau et al. 2004,
Buck et al. 2012), and they enter the environment through direct emission (the usage of
products containing PFASs) or indirectly by degradation from other compounds (Prevedouros
et al. 2006, Buck et al. 2011). The unique persistence has resulted in that PFASs have become
global environmental problems (Kissa 2001, Ding and Peijnenburg 2013).
Unlike the lipophilic POPs, PFASs predominantly bind to proteins (Han et al. 2003, Jones et
al. 2003, Qin et al. 2010) and consequently accumulate in blood and blood-rich tissues such
as the liver and kidneys (Martin et al. 2003a, Martin et al. 2003b, Goeritz et al. 2013, Falk et
al. 2015). This binding can possibly interfere with the affinity of endogenous ligands to
proteins (Luebker et al. 2002) or induce changes in the protein structure (Qin et al. 2010).
Sulfonated PFASs have been shown to be more rapidly taken up and more slowly eliminated
than PFASs with carboxylate functional groups of the same C-F chain length (Martin et al.
2003a, Conder et al. 2008, Inoue et al. 2012, Falk et al. 2015). Furthermore, the uptake of
carboxylated PFASs have been shown to be positively correlated with the fluoroalkyl chain
length until 13 or more fluorinated carbons (Martin et al. 2003a, Labadie and Chevreuil
2011).
Perfluorooctane sulfonate (PFOS) is one of the most commonly studied PFASs. It has a
global distribution (Giesy and Kannan 2001), does not decompose or become biodegraded by
microorganisms (Remde and Debus 1996, Key et al. 1998) and has the ability to up-
concentrate in organisms (Conder et al. 2008). Before restrictions were implemented, PFOS
was the main fluorochemical surfactant in aqueous film-forming foam (AFFF) formulations
(Hagenaars et al. 2011, Buck et al. 2012). High performance surfactants in AFFFs are
mixtures of fluorochemical and hydrocarbon surfactants dissolved in water, and the
surfactants containing fluorine are key compounds providing the low surface tension of the
Page 15
3
foams (Pabon and Corpart 2002, Buck et al. 2011, Buck et al. 2012). AFFFs are applied on
industrial and petroleum fires (Prevedouros et al. 2006, Kishi and Arai 2008), and regular
training exercises have led to direct releases of the AFFFs to soil and water and a
subsequently widespread environmental input of PFASs (Moody and Field 2000, Moody et
al. 2002, Moody et al. 2003, Hagenaars et al. 2011).
The use of AFFF containing PFASs was terminated in 2012 at the majority of Norwegian
airports, but high concentrations are still found at, and around, training platforms for fire-
fighting (Sweco 2012, Norconsult and Sweco 2015). At Harstad/Narvik Airport Evenes in
northern Norway, leachate from a fire-training platform has led to the accumulation of PFASs
in a nearby swamp area draining into a lake, Lavangsvatnet (Cowi and Sweco 2012,
Norconsult and Sweco 2015). Substances used in this study (Figure 1) were chosen to
resemble PFASs detected in water from this lake (sampled at the outlet of a small stream
draining the swamp area).
Figure 1. Selected poly- and perfluoroalkyl substances.
Perfluorooctane sulfonate (PFOS) Perfluorohexane sulfonate (PFHxS)
Perfluorohaxanoic acid (PFHxA)
Perfluoropentanoic acid (PFPeA) 6:2 Fluorotelomer sulfonate (6:2 FTS)
Perfluorootanoic acid (PFOA)
Page 16
4
1.2 Effects of PFASs
Several laboratory tests have linked PFASs to changes and toxic effects in the liver (Hoff et
al. 2003a, Du et al. 2009, Fair et al. 2013), oxidative damage (Berthiaume and Wallace 2002,
Arukwe and Mortensen 2011, Liu et al. 2014a) and induction of various metabolic enzymes
(Liu et al. 2007, Han et al. 2012, Liu et al. 2014b). In addition, some PFASs are thought to be
tumour promoters (Benninghoff et al. 2012, Klaunig et al. 2012) and exhibit developmental
(Lau et al. 2004, Shi et al. 2008), immunotoxic (DeWitt et al. 2012, Han et al. 2012, Fair et
al. 2013) and endocrine disrupting responses (Jensen and Leffers 2008, Benninghoff et al.
2011, Han et al. 2011).
The effects chosen to be investigated in this study (the induction of metabolic enzymes,
oxidative damage responses and liver damage) are briefly described below. A biomarker is
defined as an alteration in a biological process (from molecular to behavioural) indicating a
deviation from the normal status (van der Oost et al. 2003). It gives a measurement of
exposure and possible toxic effects, rather than mere quantification of the pollutant level, and
is important in environmental assessment (Peakall and Walker 1994). In the newly released
Madrid Statement on poly- and perfluoroalkyl substances scientists are urged to continue
monitoring and investigating PFAS in the environment through the use of biomarkers and
analytical methods (Blum et al. 2015). The biomarkers used in this study were selected to
investigate the effects of a PFAS mixture simulating the level of contamination in
Lavangsvatnet from the use of AFFFs at Harstad/Narvik Airport Evenes.
1.2.1 Induction of metabolic enzymes
The analysis of CYP1A enzyme activity, i.e. the activity of ethoxyresorufin O-deethylase
(EROD), is a well-known indicator for the presence of aryl hydrocarbon receptor agonists
(e.g. TCDD, PCBs and PAHs) in fish (Goksøyr and Förlin 1992, Jönsson et al. 2003).
Although these agonists not necessarily are directly toxic they may be biotransformed to more
toxic metabolites in the organism (Whyte et al. 2000). In addition, activation of the aryl
hydrocarbon receptor may cause oxidative stress (see section 1.2.2) or create reactive oxygen
species in the exposed cells (Dalton et al. 2002). EROD activity describes the rate of
deethylation of 7-ethoxyresorufin, which is mediated by the CYP1A enzyme in the
cytochrome P450 monooxygenase enzyme family. This results in the product resorufin, and
Page 17
5
the activity of EROD is consequently an indicator for the relative amount of CYP1A in a
sample (Whyte et al. 2000, van der Oost et al. 2003).
EROD activity is commonly measured in the liver, because of its high metabolic capacity and
function (Whyte et al. 2000); however, measurements of EROD in gills have been shown to
be a sensitive biomarker of exposure to waterborne CYP1A inducers (Abrahamson 2007).
PFASs are not known as aryl hydrocarbon receptor agonists, but it has been shown that the
combined exposure of cells to PFOS and 2,3,7,8-tetrachlorodibenzo-p-dioxin (TCDD)
increases the EROD activity by up to 40% compared to when the cells were only exposed to
TCDD (Hu et al. 2003). Knowledge on the effect of PFASs on EROD activity in gills is
limited. It is, thus, of interest to investigate the changes in EROD after exposure to
environmentally relevant mixtures and concentrations of PFASs.
1.2.2 Oxidative damage responses
Oxidative stress occur when there is an overproduction and imbalance between pro-oxidants
(e.g. reactive oxygen species) and antioxidant defence systems. This can have diverse
deleterious effects in a cell such as membrane damage and enzyme dysfunction (Newman and
Clements 2008 p. 31). Thiobarbituric acid reactive substances (TBARS), including lipid
peroxides and aldehydes (e.g. malondialdehyde (MDA)), increase in concentration due to
oxidative stress to unsaturated fatty acids (lipids) (Botsoglou et al. 1994). The measurement
of MDA through the TBARS method is a common technique for detecting oxidative damage
in tissues and biological systems (Valenzuela 1991, Halliwell and Chirico 1993, Dawn-
Linsley et al. 2005).
PFOS has been shown to cause oxidative stress in fish; however, the amount of lipid
peroxidation (TBARS) seems to differ between various species (Oakes et al. 2005, Shi and
Zhou 2010, Arukwe and Mortensen 2011, Feng et al. 2015). As with EROD activity, TBARS
is usually measured in the liver, and to the author’s knowledge only one previous study has
investigated the effect of PFASs on lipid peroxidation in the gills of fish (Munyemera 2014).
Thus, it is of interest to assess how TBARS in gills are affected when exposed to PFASs. In
addition, it is of importance to investigate the possible lipid peroxidation of hepatic tissues
and subsequently elevated TBARS levels after exposure to a mixture of PFASs simulating
contamination from the use of AFFFs.
Page 18
6
Another oxidative damage response is the proliferation of peroxisomes in cells. This implies
an increase in volume and number of peroxisomes (single membrane-bound organelles in
cells), and is usually followed by an induction of various enzymes such as peroxisomal acyl-
CoA oxidase (AOX) (Cajaraville et al. 2003). AOX is the first rate-limiting enzyme in the β-
oxidation pathway and oxidizes fatty acids accompanied by the release of H2O2 (a reactive
oxygen species) (Lock et al. 1989, Cancio and Cajaraville 2000). The induction of AOX is
used as an indicator for the exposure to peroxisome proliferators (Cajaraville et al. 2003), and
is conducted by detecting the H2O2-dependent oxidation of leuco-dichlorofluorescein (in this
study: 2’7’-dichlorofluorescein) by exogenous peroxidases in a sample (Small et al. 1985).
It has been shown that PFASs act as peroxisome proliferators and to increase the activity of
hepatic AOX in rats (Berthiaume and Wallace 2002, Elcombe et al. 2012), but with lower
levels of exposure the induction have been shown to be small or non-significant (Seacat et al.
2003, Elcombe et al. 2012). Notable species differences have been reported in the hepatic
AOX activity of fish after exposure to PFASs (Hoff et al. 2003b, Oakes et al. 2005, Bilbao et
al. 2010, Oakes et al. 2010). Thus, it is of interest to investigate how AOX activity in brown
trout is affected when exposed to environmentally relevant concentrations of PFAS.
1.2.3 Liver damage
Increased enzyme activities (e.g. of aminotransferases) in plasma are commonly used as
biomarkers for tissue damage (van der Oost et al. 2003), and frequently applied as a
diagnostic tool in human medicine (Reichling and Kaplan 1988, Kim et al. 2008). The
enzyme alanine aminotransferase (ALAT) is considered to be specific for detecting damage
and diseases in the liver (van der Oost et al. 2003). However, the use of ALAT as an indicator
of liver toxicity can be problematic due to the potential inhibition of enzyme synthesis or
activity, or failure to detect hepatic damage when the majority of the cells have undergone
necrosis (Reichling and Kaplan 1988, Bucher and Hofer 1990).
ALAT (and the cofactor pyridoxal-5’-phosphate) catalyses the transfer of an amino group
from the amino acid alanine to α-ketoglutaric acid resulting in the production of pyruvate and
L-glutamate (Reichling and Kaplan 1988). Results from field studies have shown that PFOS
correlate significantly with the ALAT activity in plasma of fish and dolphins (Hoff et al.
2003b, Hoff et al. 2005, Fair et al. 2013). The effects of PFOS on ALAT have also been
Page 19
7
shown in laboratory studies (Seacat et al. 2003, Hoff et al. 2003a); however an increased
activity of ALAT does not occur in experiments conducted on monkeys or in some studies
using rats (Seacat et al. 2002, Elcombe et al. 2012). To the author’s knowledge, no detailed
method for measuring ALAT in small volumes of plasma has been published. In this study, a
modification of the method described by Bergmeyer et al. (1986) is described and applied to
plasma of brown trout exposed to a mixture of PFASs.
1.3 Brown trout as a model organism in aquatic toxicology
Brown trout (Salmo trutta) is a highly relevant study organism due to its wide geographical
distribution and it being indigenous to freshwater lakes all over Europe, including Norway
(Frost and Brown 1967 p. 55, Kottelat and Freyhof 2007 p. 409, Filipe et al. 2013) . Trout has
been targeted in sport fishing from as early as the mid-1400, and rearing of trout in captivity
before their release into the wild is used for its recreational value (Frost and Brown 1967 p.
15).
Leaching of PFASs from contaminated fire-training areas have been shown to occur in
Lavangsvatnet close to Harstad/Narvik Airport Evenes (Sweco 2012), which has a natural
population of brown trout. The PFASs can bioconcentrate in these trout (as well as in
additional fish populations in Lavangsvatnet or in other PFAS polluted lakes) and possibly
lead to effects even after the input and exposure to PFASs have been terminated. Such effects
are usually more pronounced in the sensitive life-stages of organisms (e.g. the juvenile stage).
The brown trout in Lavangsvatnet are also a source of food for locals indicating a possible
route of human exposure to PFASs.
1.4 Objectives
The aim of this study was to quantify the bioconcentration, elimination and effects of a
mixture of fire foam-related PFASs in juvenile brown trout (Salmo trutta). Effects were
assessed by investigating the induction of metabolic enzymes, oxidative damage responses
and liver damage.
Five null-hypotheses (H0) were formulated within two objectives:
Page 20
8
Objective one: quantify the bioconcentration and elimination of PFASs in fish.
1. There was no significant bioconcentration of the selected PFASs in trout.
2. There was no significant elimination of the selected PFASs from trout.
Objective two: quantify the effects of two PFAS concentrations on selected biomarkers during
and after ended exposure.
3. There was no significant response in the induction of metabolic enzymes in gills.
4. There was no significant effect on oxidative damage responses in gills and liver.
5. There was no significant liver damage.
The objectives were addressed using experimental exposure to a mixture of PFOS,
perfluorohexane sulfonate (PFHxS), 6:2 fluorotelomer sulfonate (6:2 FTS),
perfluoropentanoic acid (PFPeA), perfluorohexanoic acid (PFHxA) and PFOA chosen to
resemble the PFAS contamination in Lavangsvatnet near Harstad/Narvik Airport Evenes. A
parallel study by Stine Hellstad (Hellstad 2015) investigated the effects on gene expression in
gills and liver from the same trout exposed to the fire foam-related PFAS mixture. Those
results can be compared with the responses in biomarkers reported here and are discussed
below.
Page 21
9
2. Materials and methods
2.1 Chemicals
Perfluorooctane sulfonate (PFOS), perfluorohexane sulfonate (PFHxS), 6:2 fluorotelomer
sulfonate (6:2 FTS), perfluoropentanoic acid (PFPeA), perfluorohexanoic acid (PFHxA) and
perfluorooctanoic acid (PFOA) were purchased from Chiron. All other chemicals were
purchased from Sigma-Aldrich if not otherwise stated. Eppendorf tubes (1.5 and 0.5 mL),
cryo-tubes (2 mL) and 96-well microtitre blank, sterile plates (NunclonTM
) were purchased
from VWR. A Synergy MX (BioTek) multi-well plate reader with Gen5 software was used
for all measurements of absorbance and fluorescence.
2.2 Experimental design
2.2.1 Brown trout
Juvenile brown trout (Salmo trutta) of the same age and weighing 7-15 grams were purchased
from Bjørkelangen Settefiskanlegg (Aurskog, Norway) mid-November 2013. The fish were
maintained in flow-through freshwater tanks (water temperature 8.8°C ± 0.8°C (SD)) at the
University of Oslo (UiO), Kristine Bonnevies hus, Blindern until mid-January 2014. All fish
were placed in aquaria for acclimatization on the same day, 11 and 12 days prior to week zero
sampling (reference), and 18 and 19 days prior of PFAS exposure initiation. The photoperiod
was set to 12:12 hours light:dark. Fish were fed daily with pellets (Tetrapond Pond Sticks)
before acclimatization and twice a week with boiled shrimp (0.6 mg/kg/fish, purchased frozen
at REMA 1000 Oslo) during the acclimatization and the experimental period.
2.2.2 Experimental setup
The experiment was conducted in Kristine Bonnevies hus, UiO. Three main header tanks
received filtered tap water delivered from Oset water treatment facility (water from
Maridalsvannet). Water was distributed randomly by gravity from the header tanks through
individual tubes (18x22 mm PVC, VWR) and to the 15-L all-glass aquaria (flow 53 ± 5.9
mL/min (SD)). Excess water was drained through a cut-out at the top of each aquarium
Page 22
10
(keeping a constant water level), and collected in two water baths surrounding the aquaria.
Subsequently, the collected water was filtrated through an activated carbon filter (VWR) to
remove the remaining PFASs before discharge. Transparent hard plastic plates were placed on
top of the aquaria, and the cut-out was covered by plastic netting to prevent fish from
escaping. Each aquarium was isolated with black hard plastic plates, and equipped with
individual air bubbling systems (Schego airpump prima). A total of 150 brown trout were
randomly distributed among the 15 aquaria, each receiving ten fish.
The exposure setup is illustrated in Figure 2.
Figure 2. Experimental setup of the aquatic exposure to poly- and perfluoroalkyl substances (PFASs).
Treatments and filtered water from the header tanks were randomly distributed between 15 aquaria.
After drainage from the aquaria, water was led through an activated carbon filter before being
discharged. Concentrations of total PFASs were 0, 10 and 785 µg/L in the “control”, “low” and “high”
treatments, respectively. All treatment solutions contained 7% acetone (solvent).
Aquaria
Filter
Control
Low
High
Header tanks (H2O)
Treatments
(PFAS)
Page 23
11
2.2.3 PFAS exposure
Treatment solutions of the PFASs exposures and “control” treatment were prepared firstly in a
10-L hard plastic container and thereafter in a 20-L container deemed sufficient for the
remainder of the exposure period. “Low” and “high” treatments contained a mixture of PFOS,
PFHxS, 6:2 FTS, PFPeA, PFHxA and PFOA at the concentrations shown in Table 1. Seven
percent acetone (VWR, 0.03% in each aquarium) were used to ensure complete dissolution of
the chemicals in distilled H2O, and the control treatment solution only consisted of H2O and
acetone.
Polyethylene tubes (0.5x1 mm, VWR) and two Watson-Marlow 500 series process pumps
were used to transfer the appropriate amount of treatment solution to the aquaria. Five aquaria
were randomly chosen for each of the exposure regimes, and the concentrations were
maintained in each aquarium for 20 days (note: fish were sampled at day 21 and denoted as
week three of exposure). After termination of the exposure, the remaining fish were kept in
filtered tap water in the same aquaria for ten more weeks (depuration).
Table 1. Nominal concentrations of PFASs in the “low” and “high” treatments.
Poly- and perfluoroalkyl substance (PFAS) Low (µg/L) High (µg/L)
Perfluorooctane sulfonate (PFOS) 5.80 455
Perfluorohexane sulfonate (PFHxS) 1.60 125
6:2 Fluorotelomer sulfonate (6:2 FTS) 1.30 102
Perfluoropentanoic acid (PFPeA) 0.60 47.0
Perfluorohexanoic acid (PFHxA) 0.40 31.3
Perfluorooctanoic acid (PFOA) 0.30 23.5
Total nominal concentration 10.0 785
The selected PFASs in the “high” and “low” treatments were derived from chemical analyses
of water collected from the lake Lavangsvatnet (by the outlet of a small stream draining water
from the swamp area) close to Harstad/Narvik Airport Evenes in October 2013. The
collection was performed in collaboration with Stine Hellstad (Department of Biosciences,
UiO), Gro Dehli Villanger (Norwegian Institute of Public Health), Beate Løland (Department
of Geology, UiO) and Gijs Breedveld (Norwegian Geotechnical Institute). Water analyses
were performed by Beate Løland and Gijs Breedveld (Løland 2014, Norconsult and Sweco
2015). The “low” PFAS concentrations (Table 1) were made to resemble the concentrations
found in Lavangsvatnet at the time of measurement. The concentrations of PFASs in the
Page 24
12
“high” treatment were approximately 80-fold higher than the levels in the “low” treatment,
and chosen on a basis for comparison with previous studies.
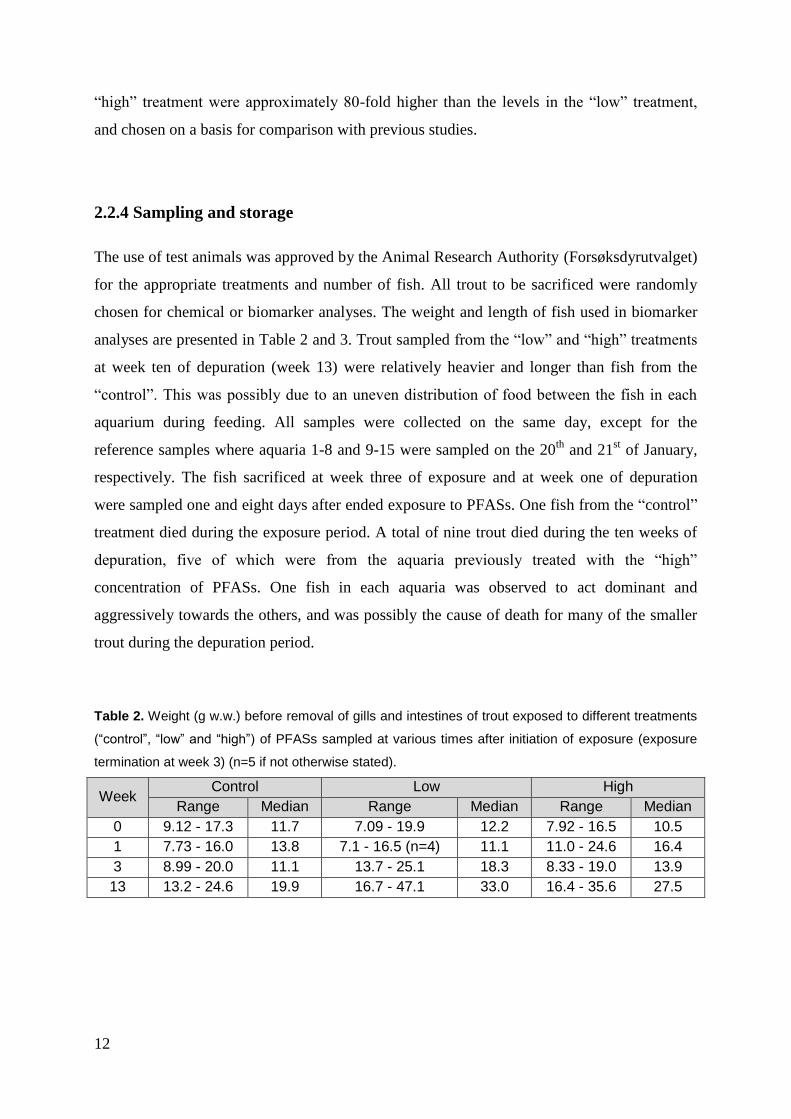
2.2.4 Sampling and storage
The use of test animals was approved by the Animal Research Authority (Forsøksdyrutvalget)
for the appropriate treatments and number of fish. All trout to be sacrificed were randomly
chosen for chemical or biomarker analyses. The weight and length of fish used in biomarker
analyses are presented in Table 2 and 3. Trout sampled from the “low” and “high” treatments
at week ten of depuration (week 13) were relatively heavier and longer than fish from the
“control”. This was possibly due to an uneven distribution of food between the fish in each
aquarium during feeding. All samples were collected on the same day, except for the
reference samples where aquaria 1-8 and 9-15 were sampled on the 20th
and 21st of January,
respectively. The fish sacrificed at week three of exposure and at week one of depuration
were sampled one and eight days after ended exposure to PFASs. One fish from the “control”
treatment died during the exposure period. A total of nine trout died during the ten weeks of
depuration, five of which were from the aquaria previously treated with the “high”
concentration of PFASs. One fish in each aquaria was observed to act dominant and
aggressively towards the others, and was possibly the cause of death for many of the smaller
trout during the depuration period.
Table 2. Weight (g w.w.) before removal of gills and intestines of trout exposed to different treatments
(“control”, “low” and “high”) of PFASs sampled at various times after initiation of exposure (exposure
termination at week 3) (n=5 if not otherwise stated).
Week Control Low High
Range Median Range Median Range Median
0 9.12 - 17.3 11.7 7.09 - 19.9 12.2 7.92 - 16.5 10.5
1 7.73 - 16.0 13.8 7.1 - 16.5 (n=4) 11.1 11.0 - 24.6 16.4
3 8.99 - 20.0 11.1 13.7 - 25.1 18.3 8.33 - 19.0 13.9
13 13.2 - 24.6 19.9 16.7 - 47.1 33.0 16.4 - 35.6 27.5
Page 25
13
Table 3. Length (cm) of trout exposed to different treatments (“control”, “low” and “high”) of PFASs
sampled at various times after initiation of exposure (exposure termination at week 3) (n=5).
Week Control Low High
Range Median Range Median Range Median
0 10.0 - 11.8 11.0 9.4 - 12.5 11.1 9.4 - 12.0 10.6
1 9.5 - 11.9 11.5 9.6 - 11.9 11.1 11.0 - 13.0 11.6
3 10.4 - 12.6 10.6 11.0 - 13.4 12.5 9.90 - 12.7 11.3
13 11.3 - 14.0 12.8 12.2 - 16.7 14.9 12.1 - 16.2 14.1
Fish were sacrificed by a blow to the head before blood was retrieved from the caudal vein
using a syringe (1-mL insulin syringe, 12 mm, VWR) rinsed in heparin (10 000 Units/mL) to
prevent the blood from clotting. The blood was centrifuged at 2000 g (SpectrafugeTM
Mini
Laboratory Centrifuge, Labnet International) for approximately five minutes, and plasma was
distributed in cryo-tubes for analysis of liver damage (alanine aminotransferase activity). Gills
and liver were rapidly collected while the fish was kept on a cooled metal plate covered in
aluminium foil to prevent degradation of molecules in the tissues. All samples were cleared of
excess blood and blood clots in Hepes-Cortland (HC) buffer (see section 2.5) before being
snap-frozen by liquid nitrogen and stored at -80°C in cryo-tubes.
The first pharyngeal arch from the left side of trout was stored in ice-cold HC buffer before
analysis of the metabolic enzyme ethoxyresorufin O-deethylase. Severed gill filaments from
the second, third, and fourth pharyngeal arches were transferred to cryo-tubes containing 200
µL 0.1 M K-PO4 buffer (pH 7.4) with 0.1% Triton X-100 and 18.2 nM butylated
hydroxytoluene in methanol (see section 2.6) for analysis of lipid peroxides (thiobarbituric
acid reactive substances). The liver was excised and divided into three approximately equal
pieces with a T-shaped cut. The anterior part was stored in a cryo-tube for analysis of
peroxisome proliferation (peroxisomal acyl-CoA oxidase activity). The upper section was
transferred to another cryo-tube containing 200 µL 0.1 M K-PO4 buffer (pH 7.4) with 0.1%
Triton and 18.2 nM butylated hydroxytoluene in methanol for analysis of lipid peroxides.
2.3 Validation of experimental setup and exposure
2.3.1 Temperature, oxygen and nitrite
Water temperature and oxygen levels were measured twice a week during and after ended
exposure in all aquaria (mean values of 8.8°C ± 0.8°C (SD) and 96% ± 2.1% (SD),
Page 26
14
respectively). Nitrite levels were measured at four different times during the experiment (one
time before, two times during, and one time after ended exposure). All aquaria had levels
below 0.3 mg/L except in three aquaria from the “control”, one aquaria from the “low” and
two aquaria from the “high” treatments measured 91 days after initiation of the exposure
(nitrite=0.3 mg/L) (see Appendix 3).
2.3.2 PFASs in water
Approximately 100 mL water was collected at three, six, ten, 15 and 20 days during exposure,
and seven days post exposure. Samples were taken from one randomly chosen aquarium of all
treatments (“control”, “low” and “high”) at each time, and stored at -20°C before transport to
Eurofins Environment Testing Norway AS for chemical analysis by LC/MS-MS (see section
2.4). The three aquaria sampled post exposure were the only aquaria sampled twice.
All added PFASs (PFOS, PFHxS, 6:2 FTS, PFPeA, PFHxA and PFOA) were detected in
water samples from the “high” and “low” treatments during the exposure period (Table 4).
Perfluorobutane sulfonate (PFBS, DL 0.02 µg/L and 0.8 µg/L) was detected in water from
one “high” treatment aquaria at 15 days of exposure (0.9 µg/L), and one “low” treatment
aquaria at 20 days of exposure (0.02 µg/L). Perfluoroheptanoic acid (PFHpA, DL 0.0100
µg/L and 0.500 µg/L) was detected in all “high” and “low” treatments during exposure with
median concentrations of 1.6 µg/L (0.9-2.0 µg/L) and 0.01 µg/L (0.01-0.03 µg/L) for the
“high” and “low” treatments, respectively. No PFASs were detected in water from the
“control” treatment aquaria, as well as in samples collected six days post exposure (Appendix
2).
Table 4. Range and median PFAS concentrations (µg/L) in water from the “low” and “high” treatments
during the three weeks of exposure (n=5).
Poly- and perfluoroalkyl substance (PFAS) Low High
Range Median Range Median
Perfluorooctane sulfonate (PFOS) 0.500 - 14.8 3.30 38.1 - 413 284
Perfluorohexane sulfonate (PFHxS) 0.500 - 2.10 1.30 54.2 - 126 122
6:2 Fluortelomere sulfonate (6:2 FTS) 0.400 - 2.00 1.40 30.4 - 121 108
n-Perfluoropentanoic acid (PFPeA) 0.500 - 1.20 0.700 36.4 - 107 57.2
Perfluorohexanoic acid (PFHxA) 0.300 - 0.700 0.400 23.1 - 67.4 37.8
Perfluorooctanoic acid (PFOA) 0.0900 - 0.500 0.300 8.4 - 28.8 27.5
Page 27
15
2.4 Chemical analysis of PFASs
One trout from each aquarium was sacrificed for analysis of PFAS concentrations in whole
fish homogenate. Fish were rinsed in filtered tap water, packed in aluminium foil, and stored
at -20°C before transport on dry ice to Eurofins Environment Testing Norway AS (analysis
was conducted by Eurofins GfA Lab Service Gmbh in Hamburg). Determination of
compound concentrations were conducted by solid phase extraction, and analysed by means
of liquid chromatography coupled with mass spectrometry (LC/MS-MS). The addition of
radioactive internal standard substances (13
C4-PFBA, 13
C2-PFHxA, 13
C8-PFOA, 13
C5-PFNA,
13C2-PFDA,
13C2-PFUnA,
13C2-DoA,
18O2-PFHxS and
13C4-PFOS) was conducted prior to the
analysis, followed by extraction by methanol or acetonitrile for water and fish samples,
respectively. A recovery standard (13
C4-PFOA) was used to quantify the accuracy of the
method. The limit of detection resulted from the background noise of the analysis and was
preferred to be 1.0 µg/kg (w.w.). Higher limits were, however, reported for samples of smaller
size or lower quality.
The measured concentrations and detection limits of PFOS, PFHxS, PFHxA, PFPeA, 6:2
FTS, and PFOA in fish can be found in Appendix 1. Table 5 show PFASs detected in the
reference samples (denoted as week zero). Perfluorobutanoic acid (PFBA) was not included in
the selected PFAS mixture (Table 1) but was detected in seven trout from the reference group.
Samples with non-detected concentrations were set to half the detection limit when
investigating the accumulation and elimination of PFOS and PFHxS in trout.
Page 28
16
Table 5. PFASs detected in trout from the reference group (week zero, ng/kg w.w.). Samples marked
with < are not detected. Concentrations after < are detection limits (varying with sample volume and
sensitivity of analysis).
Sample Perfluorobutanoic acid (PFBA) Perfluorooctane sulfonate (PFOS)
1 150 350
2 < 58.2 204
3 74.2 185
4 102 226
5 87.0 671
6 115 138
7 < 50.7 149
8 < 62.6 169
9 < 64.3 < 64.3
10 < 54.5 143
11 81.8 70.2
12 < 62.7 120
13 < 66.1 272
14 < 70.2 104
15 134 92.5
2.5 Ethoxyresorufin O-deethylase activity in gills
Measurements of the ethoxyresorufin O-deethylase (EROD) activity were performed to
investigate whether PFASs affected the induction of this metabolic enzyme and possibly
changed the biotransformation capacity in gills of trout during the exposure and depuration
periods. The method was conducted according to the procedure described by Jönsson et al.
(2002).
The gills were excised and stored in ice-cold HC buffer, pH 7.7 (0.38 g/L KCl Merck, 7.74
g/L NaCl VWR, 0.23 g/L MgSO4*7H2O Merck, 0.17 g/L CaCl2, 0.33 g/L NaH2PO4*H2O,
1.43 g/L Hepes Applichem, and 1.0 g/L Glucose) for a maximum of eight hours before
analysis. Reaction buffer was made by mixing 35.0 mL HC buffer, 35.0 µL dicumarol (10
mM) and 13.7 µL 7-ethoxyresorufin (2.6 mM) dissolved in dimethyl sulfoxide (DMSO). The
resorufin standard (6.75-200 nM) was prepared from a stock solution (10 mM) by dilution,
initially in DMSO and thereafter in reaction buffer. Because both ethoxyresorufin and
resorufin are degraded when exposed to light, all work was performed without direct light
exposure.
Page 29
17
The filaments were cut directly above the septum using a scalpel and tweezers resulting in
approximately 2 mm long filament pieces (minimum 20 filaments per fish and replicate), and
put in a 24-well tissue culture plate (Falcon, VWR). Pre-incubation of the filaments (2-10
minutes) was conducted by adding 0.50 mL room-tempered reaction buffer to each well. To
start the assay the buffer was replaced by 0.70 mL fresh room-tempered reaction buffer and
start time was noted. After 45 minutes (60 minutes for control and reference samples), 0.20
mL aliquots were transferred to a 96-well tissue culture plate (Falcon, VWR) in triplicates.
For the resorufin standard solutions, duplicate 0.20 mL aliquots (reaction buffer for blanks)
were added to the 96-well plate. Fluorescence was determined at 530 nm (excitation) and 590
nm (emission) (slit opening at 17 nm and reader sensitivity set to auto). A linear curve from
the standard dilution was constructed and applied to calculate the EROD activity in each
sample. The activity was expressed as picomoles produced resorufin per filament and minute.
2.6 Thiobarbituric acid reactive substances in gills and liver
The determination of thiobarbituric acid reactive substances (TBARS) was conducted to
analyse for oxidative damage to unsaturated fatty acids (lipid peroxidation) in gills and liver
caused by the exposure to PFASs. The method was carried out according to Ohkawa et al.
(1979).
Liver tissue and gill filaments (cut directly above the septum as described in section 2.5) were
added to 200 µL 0.1 M K-PO4 homogenization buffer, pH 7.4 (2.59 g/L KH2PO4 and 18.5 g/L
K2HPO4) with 0.1% Triton X-100 and 18.2 nM butylated hydroxytoluene (dissolved in
methanol) to avoid further oxidation of lipids. The samples were immediately frozen by liquid
nitrogen and stored at -80°C until analysis.
Malondialdehyde (MDA) tetrabutylammonium salt was diluted in distilled H2O creating a 2x
standard dilution series (0.40-25.6 µM). Samples were thawed on ice (kept on ice during
analysis) and homogenized using Precellys ®24 (Bertin technologies, 1x10 seconds at 6000
rpm) with four homogenization beads in each tube. The homogenate was centrifuged at 9391
g for one minute (Eppendorf Centrifuge 5425), and 100 µL of the supernatant was added to an
eppendorf tube (1.5 mL). The standard dilutions (distilled H2O for blanks) were added to
individual eppendorf tubes. All containers received 0.40 mL 60 mM Tris buffer (7.93 g/L
Trizma HCl and 1.16 g/L Trizma Base, pH 7.4 at 25°C) containing 0.10 mM
Page 30
18
diethylenetriaminepentaacetic acid, 0.50 mL 0.051 M thiobarbituric acid (TBA), and 0.50 mL
0.73 M trichloroacetic acid (TCA, Merck). A small hole was made on the top of the tubes to
prevent spilling of the samples during incubation. Samples, standards and blanks were
incubated for 60 minutes at 95°C in a Termaks T1056 UV incubator, and cooled to room
temperature on ice followed by centrifugation at 12 000 g for five minutes (Eppendorf
Centrifuge 5424). The supernatants were diluted 2x with distilled H2O and 250 µL of this
solution was added to a 96-well microtitre plate in duplicates. Absorbance was determined at
532 nm, and a linear curve from the standard dilution was constructed and applied to calculate
MDA concentrations in each sample.
A reference sample was included in all 96-well plates, enabling the validation of plates in
terms of human and instrumental inaccuracy. Total protein concentration of samples were
determined using the method developed by Lowry et al. (1951) described in section 2.8.
TBARS were expressed as nmol MDA/mg protein.
2.7 Peroxisomal acyl-CoA oxidase activity in liver
The measurement of peroxisomal acyl-CoA oxidase (AOX) activity was performed to
investigate if PFASs cause peroxisome proliferation and possible oxidative damage in liver
tissues, consequently affecting the activity of this enzyme. The method was conducted
according to the procedure described by Small et al. (1985).
Samples were thawed on ice and added to eppendorf tubes (1.5 mL) with 200 µL chilled
TVBE homogenization buffer pH 7.6 (84 mg/L NaHCO3 Biochrom AG, 10 mL/L Na-EDTA,
1.0 mL/L ethanol, and 1.0 mL/L 10% Triton X-100). Homogenization was conducted (for
1x15 seconds at 6000 rpm) using Precellys ®24 with cryolys (Bertin technologies) cooling
system and four homogenization beads in each tube. The homogenates were centrifuged at
500 g and 4.0°C for 15 minutes using an Eppendorf Centrifuge 5702R. Aliquots (50 µL) were
diluted 20x in distilled H2O.
Reaction medium (2.0 mL K-PO4 buffer 0.50 M pH 7.4, 2.0 mL 2’7’-dichlorofluorescein
diacetate 2.6 mM, 1.0 mL horseradish peroxidase 1200 units/mL, 1.0 mL sodium azide 4.0 M,
200 µL 10 % Triton X-100, and 93.8 mL distilled H2O) was frozen at -20°C in 1.5 mL
eppendorf tubes and later thawed in a water bath at 25°C before analysis. Diluted aliquots (50
Page 31
19
µL) were added to 0.95 mL reaction medium and incubated in a water bath for five minutes at
25°C. The total solution was divided between four wells in a 96-well microtitre plate (240 µL
in each well). Palmitoyl-CoA 3.0 mM solution (5.0 µL) was added to the wells chosen for the
positive controls (two wells of each sample) using a multi canal pipette. Absorbance (502 nm)
was determined after approximately 30 seconds incubation in room temperature, and new
measurements were taken every 45 seconds for ten minutes. 2’7’-dichlorofluorescein
diacetate, reaction medium, and 96-well plate containing solution were protected from light
using aluminium foil.
Total protein concentration in the samples were determined using the method described by
Lowry et al. (1951) (see section 2.8). The AOX activity were calculated using equations 2.7i
and 2.7ii, where ΔOD/Δt was obtained from the absorbance measurements. The activity was
expressed as mUnits/mg protein (1 unit = 1 µmol/minute).
2.7𝑖) 𝑚𝑈𝑛𝑖𝑡𝑠
𝑚𝐿 =
∆𝑂𝐷
∆𝑡 × 𝑅𝑒𝑎𝑐𝑡𝑖𝑜𝑛 𝑣𝑜𝑙𝑢𝑚𝑒
𝑆𝑎𝑚𝑝𝑙𝑒 𝑣𝑜𝑙𝑢𝑚𝑒 × 𝐷𝑖𝑙𝑢𝑡𝑖𝑜𝑛 𝑓𝑎𝑐𝑡𝑜𝑟
0.091
2.7𝑖𝑖) 𝑚𝑈𝑛𝑖𝑡𝑠
𝑚𝑔 𝑝𝑟𝑜𝑡𝑒𝑖𝑛 =
𝑚𝑈𝑛𝑖𝑡𝑠
𝑚𝐿 ÷ 𝑚𝑔 𝑝𝑟𝑜𝑡𝑒𝑖𝑛
𝑚𝐿
2.8 Protein analysis
The results of the TBARS and AOX analyses were protein normalised. Protein concentrations
were measured using a modification of the method described by Lowry et al. (1951). This
assay enables the detection of proteins using absorbance measurements of the blue colour
developed from the reaction between an alkaline copper tartrate solution and a Folin reagent
reacting with proteins in the sample.
The chosen dilution factors where 50x and 20x for liver and gill homogenates, respectively.
Samples (stored in 0.5-mL eppendorf tubes) were thawed on ice by the addition of distilled
H2O which resulted in the desired dilutions. A bovine serum albumin protein standard was
diluted in ice-cold 0.10 M Tris buffer (1.94 g/L Trizma base and 13.2 g/L Trizma HCl, pH 8.0
at 4.0°C) creating a 2x dilution series (10.4-82.2 mM), and kept on ice during analysis. The
diluted samples, standard concentrations, blanks (Tris buffer or H2O) and reference samples
were plated out in triplicates (10 µL in each well) on the bottom of a 96-well microtitre plate.
Page 32
20
25 µL of the alkaline copper tartrate solution (Reagent A, Bio-Rad) was added to all wells,
followed by 200 µL dilute Folin reagent (Reagent B, Bio-Rad) and careful mixing.
Absorbance was read (750 nm) after 15 minutes incubation at room temperature (protected
from light by aluminium foil). Samples giving absorbance readings higher or close to the
highest value of the standard concentrations were diluted 2x more and measured again. The
linear curve from the standard dilution was constructed and applied to calculate the protein
concentration in each sample.
As described by Lowry et al. (1951) samples should be diluted in 0.10 M Tris buffer. Tests
showed, however, that a standard curve diluted in H2O was approximately equal to a curve
diluted in Tris buffer (variation 1.1-11%). The absorbance readings of the samples were
corrected for ambient noise with blank H2O values.
2.9 Alanine aminotransferase activity in plasma
Determination of the alanine aminotransferase (ALAT) activity in plasma was conducted to
analyse for possible damage to liver tissues of trout during and after ended exposure to
PFASs. The method was conducted according to the procedure described by Bergmeyer et al.
(1986) modified for the use of 96-well microtitre plates (small sample volumes) and plasma
from brown trout. This analysis is based on the reaction catalysed by ALAT (2.9i) and the
indicator reaction catalysed by lactate dehydrogenase (2.9ii). The equilibrium of reaction 2.9ii
is shifted far to the right causing the equilibrium of the reaction 2.9i to become irrelevant
because pyruvate is continuously depleted in reaction 2.9ii. ALAT activity is determined by
measuring the colorimetric product (NAD+), which is proportional to the amount of pyruvate
generated by ALAT and thereby also the rate of NADH oxidation in reaction 2.9ii.
2.9𝑖) 𝐿-𝐴𝑙𝑎𝑛𝑖𝑛𝑒 + α-Ketoglutaric acid
𝐴𝑙𝑎𝑛𝑖𝑛𝑒 𝑎𝑚𝑖𝑛𝑜𝑡𝑟𝑎𝑛𝑠𝑓𝑒𝑟𝑎𝑠𝑒↔ 𝑃𝑦𝑟𝑢𝑣𝑎𝑡𝑒 + 𝐿-𝐺𝑙𝑢𝑡𝑎𝑚𝑎𝑡𝑒
2.9𝑖𝑖) 𝑃𝑦𝑟𝑢𝑣𝑎𝑡𝑒 + 𝑁𝐴𝐷𝐻 +𝐻+
𝐿𝑎𝑐𝑡𝑖𝑐𝑑𝑒ℎ𝑦𝑑𝑟𝑜𝑔𝑒𝑛𝑎𝑠𝑒↔ 𝐿-𝐿𝑎𝑐𝑡𝑎𝑡𝑒 + 𝑁𝐴𝐷+
Two 96-well plates were run to test the modified solutions and different volumes of plasma
(5.0, 10, 20, 30 and 40 µL). Time of final measurements at room temperature was evaluated
to verify that a constant change in absorbance per change in time (ΔOD/Δt) was obtained.
Time of pre-incubation was also evaluated to confirm the complete saturation of alanine
Page 33
21
aminotransferase with pyridoxal phosphate and to allow reactions between NADH and
endogenous substances in serum to be fulfilled.
Plasma samples were thawed on ice and centrifuged for one minute at 241 g (Eppendorf
Centrifuge 5810R). Plasma was transferred to a 96-well microtitre plate, 15 µL in one well for
overall ALAT reaction and 15 µL in a second well for individual sample blank. Each well
was brought to a final volume of 20 µL by the addition of 5.0 µL 0.15 M NaCl. For blanks, 20
µL NaCl (0.15 M) was added to eight wells for overall reaction and eight wells for sample
blank.
The reaction mixture for overall reaction consisted of 16.4 mL 0.11 M Tris buffer (4.33 g/L
Trizma base and 11.7 g/L Trizma HCl, pH 7.8 at 25°C), 19.7 mL Tris/L-alanine solution
(0.11 M Trizma base and 0.63 M L-alanine, adjusted to pH 7.8 with 1.0 M HCl), 7.93 mL
pyridoxal 5’-phosphate solution (0.63 mM pyridoxal phosphate hydrate in 0.11 M Tris
buffer), 5.68 mL β-NADH solution (6.12 mM β-NADH in 0.11 M Tris buffer), and 267 µL
lactic dehydrogenase solution (225 Units/L containing 10% glycerol and 90% Tris buffer). In
the reaction mixture for individual sample blank, Tris/D-alanine (0.11 M Trizma base and
0.63 M L-alanine, adjusted to pH 7.8 with 1.0 M HCl) was added instead of the Tris/L-alanine
solution, which inhibits the reaction by alanine aminotransferase to form pyruvate and L-
glutamate.
After addition of plasma and blank samples to the 96-well plates, reagent mixtures for overall
reaction (220 µL) and individual sample blank (220 µL) were added to their respective wells.
The reagents were mixed by shaking in the plate reader for five seconds at medium intensity.
Absorbance (339 nm) was measured every 45 seconds for 15 minutes to ensure that a constant
change in absorbance per change in time (ΔOD/Δt) was achieved during the pre-incubation
period
20 µL Tris/α-ketoglutaric acid (0.11 M Trizma base and 0.18 M α-ketoglutaric acid disodium
salt dihydrate, adjusted to pH 7.8 at 25°C with 12 M and 5.0 M HCl) were added to all wells,
and the solutions were mixed for 15 seconds at medium level in the plate reader. The change
in absorbance ΔOD (339 nm) was measured every 45 seconds for 30 minutes, and the
calculated slope values were individually evaluated and corrected when a lag phase occurred
at the start of the measurement. All solutions containing pyridoxal 5’-phosphate and β-NADH
were protected from light using aluminium foil.
Page 34
22
The following equation was used to determine ALAT activity in plasma samples.
𝐶𝑎𝑡𝑎𝑙𝑦𝑡𝑖𝑐 𝑐𝑜𝑛𝑐𝑒𝑛𝑡𝑟𝑎𝑡𝑖𝑜𝑛 (𝑈𝑛𝑖𝑡𝑠 𝐿⁄ ) = 𝑅𝑒𝑎𝑐𝑡𝑖𝑜𝑛 𝑣𝑜𝑙𝑢𝑚𝑒 (𝐿)
𝜀 × 𝑙 × 𝑆𝑎𝑚𝑝𝑙𝑒 𝑣𝑜𝑙𝑢𝑚𝑒 (𝐿) × ∆𝑂𝐷
∆𝑡 × 60 × 106
Where l is the path length of light through the solution in the well (mm), ε is the molar
absorbance (m2/mol) of NADH under the defined conditions of the experiment, and ΔOD/Δt
is obtained from the absorbance measurements. The molar absorbance of NADH has been
measured to 630 m2/mol at 340 nm, 25°C and pH 7.8 (McComb et al. 1976, Ziegenhorn et al.
1976). The path-length when the light passes through a volume of 260 µL in one well
(NunclonΔ, cat.no 167008) is 7.41 mm. ALAT activities were expressed in Units/L.
2.10 Statistical analysis
Univariate statistical analyses were performed using R version 3.1.2 (The R foundation for
statistical analysis, 2014). The additional packages “lawstat” and “ggplot2” were used to
perform Levene’s test for homogeneity of variance and to graphically display the results from
the chemical and biomarker analyses.
When testing for significance using parametric tests such as analysis of variance (ANOVA), it
is assumed that the data are randomly drawn from a population with a normal distribution,
and that the variance between groups is uniform. If there is a limited amount of observations
within each group (<10), the dataset often does not yield enough power to reject the null
hypothesis that the observations are not normally distributed (e.g. using the Shapiro-Wilk test)
(Whitlock and Schluter 2009 p. 324). Based on this information, a normal distribution of the
data was assumed. Levene’s test was used to test the homogeneity of variances between
groups (Levene 1960), and data was log-transformed if the groups were found to have
heterogeneous variance. If the transformation resulted in homogeneity of variance, data were
analysed using one-way ANOVA followed by Tukey’s post hoc multiple comparison test
(Tukey’s HSD) (Tukey 1949). Alternatively, if homogenous variance was not achieved,
significance was calculated using the unequal variance Welch test (Welch 1938) followed by
Games-Howell post hoc test on non-transformed data. A Dunnett’s post hoc test was not used
because this test does not analyse for differences between non-control treatments. Student’s
two-sample t-test was used when comparing two groups with homogenous variance, and
Welch two sample t-test was used when the variance was heterogeneous.
Page 35
23
When developing the method for ALAT activity in plasma, estimated slope values from the
linear regression of the 17 samples added Tris/L-alanine solution were compared with the 17
samples added Tris/D-alanine solution. These data groups deviated from normality (Shapiro-
Wilk test), and Levene’s test showed significant differences in variation between the groups.
A log-transformation of the data was not possible due to both negative and positive values.
Thus, a non-parametric Kruskal-Wallis ANOVA (Kruskal and Wallis 1952) was conducted
on untransformed data to investigate the difference in slope values between the two groups.
The level of significance to reject H0 was set to 0.05.
2.10.1 Estimation of half-life
In ecotoxicology, the most commonly used model for uptake and elimination of a compound
in an organism is the one-compartment model. Here, the toxicant is assumed to be distributed
evenly throughout that one compartment (e.g. whole body). The first order elimination from
this compartment is represented by the equation below, where Ci is the concentration of the
compound in the compartment and ke is the first order rate constant (Newman and Clements
2008 p. 119).
∆𝐶i∆𝑡= −𝑘e𝐶i
The ke can be estimated by fitting a linear model (regression) to log(Ci) over time (t). The
intercept value of the model is equivalent to the initial concentration in the compartment (C0).
The slope value measures how much log(Ci) changes per unit change in time (Whitlock and
Schluter 2009 p. 467), which further can be used as the rate constant (ke) when calculating the
time it takes for the compartment to eliminate 50% of the compound (biological half-life).
The equation for half-life (t1/2) can be written as below (Newman and Clements 2008 p. 119):
t1/2 = log 2
𝑘e
Page 36
24
2.10.2 Estimation of bioconcentration factors
A bioconcentration factor (BCF) can be calculated by dividing the chemical concentration in
the organism by the corresponding concentration in water, given that a steady state has been
reached (Arnot and Gobas 2006, Newman and Clements 2008 p. 121, 737). The BCFs of
PFOS and PFHxS were calculated using concentrations measured in fish from the low and
high treatments at three weeks, and concentrations in water from the respective aquaria
sampled between day three and 20 during exposure to PFASs.
2.10.3 Multivariate data analysis
The multivariate statistical analysis were performed using R version 3.1.2 (The R foundation
for statistical analysis, 2014), with the additional package “vegan”. A principal component
analysis (PCA) was used to explore the variation and relationship between observed responses
and biomarker variables. The PCA aims to reduce the dimensions of a dataset such that the
principal component axes (PCs) explains the highest possible amount of the variation. PC1 (x
axis) account for the largest variation in the dataset, and the subsequent PC2 (y axis) explains
the second largest variation. In addition, PC2 is perpendicular and uncorrelated with the first
PC (Sparks et al. 1999, Bro and Smilde 2014).
The information in a PCA can be presented as a biplot. This type of plot consist of the score
plot, which displays how the observations (as points) are arranged in respect to each other,
and the loading plot showing how the variables (as arrows) relate to each other. The angles
between the arrows indicate possible correlation between the variables, where an angle of 90
degrees represents no correlation (Sparks et al. 1999).
The dataset of biomarker responses were standardized (mean subtracted from the observation
and divide by SD) and centred (shifting the scale so that the mean equals zero) before
analysis. PCA was performed separately on results from each sampling week (week zero, one,
three and 13), and over time for the different treatments (low and high). Observations were
plotted as points and biomarker variables were presented as arrows. If a variable contained
NA-values the whole row was deleted during the PCA, and the observation was not visible in
the biplot.
Page 37
25
3. Results
The selected PFASs, yielding the results below, were chosen to simulate contamination in
Lavangsvatnet originating from the use of fire foams (AFFFs) at Harstad/Narvik Airport
Evenes. Results denoted as three weeks of exposure and as one week of depuration to PFASs
were sampled one and eight days after termination of the exposure.
3.1 Bioconcentration and elimination of PFASs in trout
3.1.1 Exposure conditions and detection of PFASs
Perfluorooctane sulfonate (PFOS) was detected in all but one trout from the reference group
(DL=0.064 µg/kg). Perfluorohexane sulfonate (PFHxS) was detected in 46% of the reference
and treatment samples (detected in 59% of trout when not including reference samples, DL
from 0.067 µg/kg to 90.1 µg/kg), with the majority of non-detected concentrations originating
from the reference group (week zero), control samples, and the samples collected ten weeks
after ended exposure. Perfluorohexanoic acid (PFHxA), n-perfluoropentanoic acid (PFPeA)
and 6:2 fluorotelomer sulfonate (6:2 FTS) were not detected in any samples during exposure
or depuration (DL 0.045 µg/kg to 118 µg/kg for PFHxA and PFPeA, and DL 0.067 µg/kg to
177 µg/kg for 6:2 FTS). Perfluorooctanoic acid (PFOA) was only detected in two samples
from the “high” treatment after one week of exposure (13.0 µg/kg and 10.8 µg/kg, DL 0.045
µg/kg to 118 µg/kg). Three PFASs were detected, which were not in the nominal mixture of
compounds. Perfluorobutanoic acid (PFBA) was detected in a total of 16 fish sampled before,
during and after exposure with a maximum concentration of 1.10 µg/kg (DL 0.050 µg/kg to
118 µg/kg). Perfluorononanoic acid (PFNA) was detected in two samples from ten weeks
after ended exposure (0.104 µg/kg and 0.084 µg/kg, DL 0.050 µg/kg to 118 µg/kg).
Perfluorodecanoic acid (PFDA) was detected in a total of four samples, one sample from
week one of exposure (0.057 µg/kg), and three trout collected ten weeks after ended exposure
(0.055 µg/kg, 0.131 µg/kg and 0.120 µg/kg, DL 0.050 µg/kg to 118 µg/kg).
Page 38
26
3.1.2 Bioconcentration
There were significant increases in PFOS concentrations in trout exposed to the “high” PFASs
concentration from week zero to week three, and from week one to week three of exposure
(Tukey’s HSD, CI 3.46*104 to 9.32*10
4, p<0.001, and CI 1.48*10
4 to 7.34*10
4, p=0.004,
respectively), but there was no significant difference when comparing week zero to week one
(Tukey’s HSD, CI -9.53*103
to 4.91*104, p=0.2) (Figure 3). No significant differences were
detected over time in trout from the “low” treatment (one-way ANOVA, Fdf 2,12=3.25,
p=0.07). There was a significantly higher concentration in fish from the “high” treatment
compared to the “control” at week one of exposure (Tukey’s HSD on log-transformed values,
CI 1.30 to 12.6, p=0.02), but no differences between the other treatments were detected
(Tukey’s HSD on log-transformed values, CI -2.56 to 8.74, p=0.3 between the “control” and
“low” treatments, and CI -9.51 to 1.79, p=0.2 between the “low” and “high” treatments).
After three weeks of exposure there were significant increases in the PFOS concentrations
from the “control” to the “high” treatment, and from the “low” to the “high” treatment
(Tukey’s HSD, CI 3.74*104 to 9.01*10
4, and CI -8.78*10
4 to -3.81*10
4, p<0.001), while no
difference was detected between trout from the “control” and “low” treatments (Tukey’s
HSD, CI -2.55*104 to 2.71*10
4, p=1).
Figure 3. Log-transformed concentrations of perfluorooctane sulfonate (PFOS) in trout from “control”
(blue), “low” (green), and “high” (red) treatments at zero (reference), one and three weeks of exposure
to PFASs. Median and quartiles are presented (n=5, except “control” at three weeks where n=4).
Letters shown in identical colours originate from the same significance test. Unequal letters indicate
significant difference (p<0.05). The only non-detected sample (week zero, “low” treatment) was set to
half DL (DL=0.064 µg/kg).
A
AB BB
AB A
A
A
0 1 3
Page 39
27
There was a significant accumulation of PFHxS in trout exposed to the “high” concentration
of PFASs from week zero to week one and week three of exposure with p=0.001 and <0.001,
respectively (Tukey’s HSD on log-transformed values, CI 3.37 to 11.4, and CI 5.61 to 13.7)
(Figure 4). The difference was not significant in fish collected at week one compared to week
three (Tukey’s HSD on log-transformed values, CI -1.78 to 6.26, p=0.3). In the “low”
treatment, there was a significant difference in PFHxS concentration over time from week
zero to week three of exposure (Tukey’s HSD, CI 0.108 to 25.5, p=0.05); however, there were
no differences between samples collected at week zero and week one, and week one and week
three (CI -6.15 to 19.2, and CI -6.44 to 19.0, p-values=0.4). A significant increase in
concentration between trout from the “control” and “high” treatments was present after one
week of exposure (Tukey’s HSD on log-transformed values, CI 1.10 to 11.2, p=0.02), while
there were no differences between the “control” and “low” treatments, and the “low” and
“high” treatments (CI -2.26 to 7.89, p=0.3, and CI -8.43 to 1.72, p=0.2). In fish sampled at
week three of exposure, there was a significantly higher concentration in the “high” treatment
compared to the “control” and “low” treatments (Tukey’s HSD, CI 644 to 767, and CI -754 to
-638, p-values<0.001), but there was no difference between the “control” and “low”
treatments (CI -52.6 to 71.2, p=0.9).
Figure 4. Log-transformed concentrations of perfluorohexane sulfonate (PFHxS) in trout from “control”
(blue), “low” (green), and “high” (red) treatments at zero (reference), one and three weeks during
exposure to PFASs. Median and quartiles are presented (n=5, except “control” at three weeks where
n=4). Letters shown in identical colours originate from the same significance test. Unequal letters
indicate significant differences (p<0.05). Concentrations under DL (from 0.065 µg/kg to 90.1 µg/kg)
were set to half the DL for the given sample.
A
BB BB
A
ABAB BA
A A
0 1 3
Page 40
28
Samples from the “control” treatment showed no significant differences during the exposure
period, both for PFOS (one-way ANOVA, Fdf 4,18=0.92, p=0.5) and PFHxS (one-way
ANOVA, Fdf 4,18=0.98, p=0.4). Nor were there any differences between the reference samples
collected from the aquaria set to receive the “control”, “low” and “high” treatments (one-way
ANOVA, Fdf 2,12=2.80, p=0.1 for PFOS, and Fdf 2,12=0.45, p=0.7 for PFHxS).
3.1.3 Bioconcentration factors of PFOS and PFHxS
The concentrations of PFOS and PFHxS in trout from the “high” and “low” treatments were
divided by their respective water concentrations when estimating the bioconcentration factors
(BCFs) (Table 6). The median BCFs in the “high” treatment were 244 L/kg (175-632 L/kg,
n=5) and 6.34 L/kg (5.49-12.0 L/kg, n=5) of PFOS and PFHxS, respectively. For trout from
the “low” treatment, PFOS had a BCF of 185 L/kg (0.303-846 L/kg, n=5) and PFHxS had a
BCF of 11.2 L/kg (0.025-19.8 L/kg, n=5).
Table 6. Measured concentrations in water and calculated bioconcentration factors (BCFs) of
perfluorooctane sulfonate (PFOS) and perfluorohexane sulfonate (PFHxS) in the “high” and “low”
treatments.
Concentration in water (µg/L) BCF (L/kg)
PFOS PFHxS PFOS PFHxS
High Low High Low High Low High Low
38.1 3.30 54.2 1.80 632 184 6.47 15.2
284 14.8 125 2.10 614 352 12.0 11.2
362 0.500 126 0.500 244 846 5.49 19.8
133 2.90 109 1.00 175 124 6.34 8.62
413 4.80 122 1.30 192 0.303 5.78 0.025
3.1.4 Elimination and half-life of PFOS and PFHxS
There were no significant decreases in PFOS concentrations over time after ended exposure in
trout from the “high” (one-way ANOVA, Fdf 2,10=3.13, p=0.09) or “low” treatments (one-way
ANOVA, Fdf 2,12=2.77, p=0.1) (Figure 5). There were, however, significant differences in
concentrations between fish from the “control”, “low” and “high” treatments after one week
of depuration (Tukey’s HSD on log-transformed values) where both the “low” and “high”
treatments showed higher concentrations than the “control” (CI 5.53 to 9.05, and CI 8.60 to
Page 41
29
12.1, p-values<0.001). Furthermore, the PFOS levels in trout from the “high” treatment was
significantly higher than the concentrations in fish from the “low” treatment (CI -4.82 to -
1.30, p=0.002). The same differences were shown in trout sampled at week ten of depuration
(Tukey’s HSD on log-transformed values, CI (“control” and “high”) 4.53 to 5.18, CI
(“control” and “low”) 2.11 to 2.68, CI (“low” and “high”) -2.77 to -2.15, p-values<0.001).
There were significant decreases in PFHxS concentrations over time in trout exposed to the
“high” concentration of PFASs from week zero and week one to week ten after termination of
the exposure (Tukey’s HSD, CI -1.12*103 to -0.224*10
3, p=0.005, and CI -1.02*10
3 to -
0.122*103, p=0.01, respectively) (Figure 6). No decrease was detected from week zero to
week one (CI -491 to 286, p=0.8). Trout from the “low” treatment did not show any
significant differences in concentrations over time during the depuration period (one-way
ANOVA, Fdf 2,12=1.88, p=0.2). In fish collected one week after ended exposure, there were
significantly higher concentrations of PFHxS in trout from the “high” treatment compared to
the “control” (Tukey’s HSD, CI 259 to 954, p=0.001) and “low” treatments (CI -906 to 212,
p=0.003), but there were no differences between the “low” and “control” treatments (CI -300
to 394, p=0.9). The same results were shown after ten weeks of depuration, with p-values
<0.001 between the “high” and “control”, and “high” and “low” treatments (Tukey’s HSD, CI
34.5 to 37.6, and CI -37.1 to -34.1), and a non-significant p=0.7 when comparing the “low”
and “control” treatments (CI -0.960 to 1.82).
The one-way ANOVA did not show any significant differences over time for the
concentrations of PFOS or PFHxS in trout from the “control” treatment (F-valuesdf 2,10=1.18,
p-values=0.3).
Figure 5 and 6 show the linear regressions using log-transformed concentrations of
perfluorooctane sulfonate (PFOS) and perfluorohexane sulfonate (PFHxS) in trout exposed to
the different concentrations of PFASs from where the half-life (t1/2) can be estimated. For
PFOS, the linear regression using data from fish exposed to the “high” treatment (Figure 5A)
had a positive slope resulting in an increasing (∞) half-life estimate (CI 56.5 to ∞ weeks),
while estimation using the “low” treatment (Figure 5B) showed t1/2=13 weeks (CI 2.13 to ∞
weeks). The linear regression in Figure 6A resulted in t1/2=2.3 weeks (CI 2.03 to 2.70 weeks)
for PFHxS in trout from the “high” treatment, and the same half-life estimate in fish exposed
to the “low” treatment (t1/2=2.3 weeks, CI 1.29 to 8.63 weeks, Figure 6B).
Page 42
30
Figure 5. Log-transformed concentrations of perfluorooctane sulfonate (PFOS) in trout from A) “high”
(red) and B) “low” (green) treatments at zero through ten weeks after ended exposure to PFASs. Blue
boxplots are concentrations in the “control” treatment. Lines represent half-life of PFOS (on log-scale).
Median and quartiles are presented (n=5, except ten weeks “control” and “high” where n=4 and n=3,
respectively). The asterisk indicate significant difference from control (p<0.01).
Figure 6. Log-transformed concentrations of perfluorohexane sulfonate (PFHxS) in trout from A) “high”
(red) and B) “low” (green) treatments at zero through ten weeks after ended exposure to PFASs. Blue
boxplots are concentrations in the “control” treatment. Lines represent half-life of PFHxS (on log-
scale). Median and quartiles are presented (n=5, except in ten weeks “control” and “high” where n=4
and n=3, respectively). Unequal letters indicate significant differences (p<0.05). The asterisks indicate
significant difference from control (p<0.01).
A B
A A
B
A B
* * *
*
*
*
*
Page 43
31
3.2 Effects of PFASs
3.2.1 Ethoxyresorufin O-deethylase activity in gills
The analysis of ethoxyresorufin O-deethylase (EROD) activity was performed to investigate
the effect of PFASs exposure on the activity of this metabolic enzyme in the gills of brown
trout. Significantly increased EROD activity were found in fish from the “high” treatment
after three weeks of exposure (compared to samples from week zero and week one) (Tukey’s
HSD, CI 0.129 to 0.770, p=0.007, and CI 0.141 to 0.783, p=0.006) (Figure 7). The same
observation was made in trout from the “control” treatment (Tukey’s HSD, CI 0.067 to 0.535,
p=0.01, and CI 0.028 to 0.496, p=0.03 when comparing week three with week zero and week
one, respectively). There was no significant difference in the EROD activity of trout from the
“low” treatment during exposure (one-way ANOVA, Fdf 2,12=0.522, p=0.6). There was,
however, an increased activity in fish collected at ten weeks of depuration (week 13),
compared to the third week of exposure in trout exposed to the “low” concentration of PFASs
(two sample t-test, tdf 8=-2.62, p=0.03). No differences were detected in fish from the
“control” and “high” treatments between week three of exposure and week ten after ended
exposure, p=0.7 and p=0.2, respectively (two sample t-test, tdf 8=-0.436 and tdf 8=-1.37).
Within sampling weeks, there were no differences between trout from various treatments at
week one (one-way ANOVA, Fdf 2,12= 2.05, p=0.2) and week ten after terminated exposure
(one-way ANOVA, Fdf 2,12=2.30, p=0.2). For samples collected at week three of exposure,
there was a significant increase in EROD activity in the gills of fish from the “high” treatment
compared to the “low” treatment (Tukey’s HSD, CI -0.748 to -0.073, p=0.02), but trout from
neither “high” nor “low” treatments were found to be significantly different from the
“control” (Tukey’s HSD, CI -0.156 to 0.520, p= 0.4, and CI -0.566 to 0.109, p=0.2). No
differences in the activity of EROD were detected between treatments in trout from the
reference group (week zero, one-way ANOVA, Fdf 2,12=1.30, p=0.3).
Page 44
32
Figure 7. The activity of ethoxyresorufin O-deethylase (EROD) in gills of trout from “control” (blue),
“low” (green), and “high” (red) treatments at zero, one and three weeks during exposure to PFASs,
and at ten weeks after ended exposure (week 13, ended exposure is denoted by the black arrow).
Median and quartiles are presented (n=5). Negative EROD values were set to zero (two samples from
week zero, and one sample from week one “high” treatment). Letters shown in identical colours
originate from the same significance test. Unequal letters indicate significant difference (p<0.05).
3.2.2 Thiobarbituric acid reactive substances in gills
The determination of lipid peroxides through the thiobarbituric acid reactive substances
(TBARS) method was conducted to evaluate possible oxidative damage to unsaturated fatty
acids in gills of trout by the exposure to PFASs. No significant differences were detected in
the levels of TBARS in fish sampled from the “low” and “high” treatments during exposure,
with p=0.7 and p=0.1, respectively (one-way ANOVA, Fdf 2,12=0.446 and Fdf 2,12=2.57)
(Figure 8). There were no differences between samples from week three of exposure and
week ten of depuration (week 13) for the “low” and “high” treatments (two sample t-test, tdf
8=1.94, p=0.09, and tdf 8=0.811, p=0.4, respectively). The one-way ANOVA analysis between
treatments did not yield any significant differences when investigating trout collected at each
time of sampling (week one, Fdf 2,12=0.145, p=0.9; week three, Fdf 2,12=1.23, p=0.3; week 13,
Fdf 2,12=0.163, p=0.9). No differences were detected between treatments in trout from the
reference group (week zero, one-way ANOVA, Fdf 2,12=0.446, p=0.7), nor over time in fish
exposed to the “control” treatment (one-way ANOVA, Fdf 3,16=1.77, p=0.2).
A A A A
BAB
BB
AA
B
0 1 3 13
Page 45
33
Figure 8. Thiobarbituric acid reactive substances (TBARS) in gills of trout from “control” (blue), “low”
(green), and “high” (red) treatments at zero, one and three weeks of exposure to PFASs, and at ten
weeks after ended exposure (week 13, ended exposure is denoted by the black arrow). Median and
quartiles are presented (n=5).
3.2.3 Thiobarbituric acid reactive substances in liver
Measurement of the hepatic TBARS levels was conducted to investigate if exposure to PFASs
possibly causes lipid peroxidation in the liver tissue. There were no significant differences in
the hepatic TBARS levels in the trout from the “low” and “high” treatments during exposure
to PFASs (one-way ANOVA, Fdf 2,12=0.540, p=0.6, and Fdf 2,12=1.67, p=0.2), nor were there
any significant differences in the “low” or “high” treatments when comparing week three of
exposure and week ten of depuration (week 13, two sample t-test, tdf 8=2.18, p=0.06, and tdf
8=-0.569, p=0.6) (Figure 9). The trout from all treatments collected at week one, week three
and week 13 showed no significant differences in TBARS (one-way ANOVA, Fdf 2,12=1.17,
p=0.3, Fdf 2,12=2.19, p=0.2, and Fdf 2,12=2.93, p=0.09, respectively). There were no differences
between samples from the “control”, “low” and “high” treatments collected at week zero of
exposure (one-way ANOVA, Fdf 2,12=0.101, p=0.9), nor over time in trout exposed to the
“control” treatment (one-way ANOVA, Fdf 3,16=1.76, p=0.2).
0 1 3 13
Page 46
34
Figure 9. Thiobarbituric acid reactive substances (TBARS) in liver of trout from “control” (blue), “low”
(green), and “high” (red) treatments at zero, one and three weeks of exposure to PFASs, and at ten
weeks after ended exposure (week 13, ended exposure is denoted by the black arrow). Median and
quartiles are presented (n=5).
3.2.4 Peroxisomal acyl-CoA oxidase activity in liver
Analysis of the peroxisomal acyl-CoA oxidase (AOX) activity was performed to investigate if
PFASs act as peroxisome proliferators and possibly cause oxidative damage to the liver
tissue. No significant differences were found in the hepatic AOX activity in trout from the
“low” and “high” treatments during exposure (one-way ANOVA, Fdf 2,12=1.65, p=0.2, and
Welch U test, Fdf 2.0,6.7=1.16, p=0.4, respectively) (Figure 10). There was no difference when
comparing samples collected at week three of exposure with week ten of depuration (week
13) in fish from the “low” treatment (two sample t-test, tdf 8=-0.0779, p=0.9), nor in trout
exposed to the “high” treatment (two sample t-test, tdf 8=2.17, p=0.06). No differences in the
activity of AOX were detected between samples from the “control”, “low” and “high”
treatments at week one (one-way ANOVA, Fdf 2,12=0.534, p=0.6) and week three of exposure
(one-way ANOVA, Fdf 2,12=0.615, p=0.6), or at ten weeks after terminated exposure (week 13,
one-way ANOVA, Fdf 2,12=1.52, p=0.3). There were no differences between all treatments in
samples collected from the reference group (week zero), nor any changes over time occurring
in trout exposed to the “control” treatment (one-way ANOVA, Fdf 2,12=0.404, p=0.7, and Fdf
3,16=0.148, p=0.9, respectively).
0 1 3 13
Page 47
35
Figure 10. The activity of peroxisomal acyl-CoA oxidase (AOX) in liver of trout from “control” (blue),
“low” (green), and “high” (red) treatments at zero, one and three weeks during exposure to PFASs,
and at ten weeks after ended exposure (week 13, ended exposure is denoted by the black arrow).
Median and quartiles are presented (n=5).
3.2.5 Alanine aminotransferase activity in plasma
The analysis described by Bergmeyer et al. (1986) was modified for the detection of alanine
aminotransferase (ALAT) activity in smaller volumes of plasma, and further applied to
estimate the damage to liver cells of trout after exposure to the PFASs mixtures. Tests during
the method modification showed that the pre-incubation period should last for approximately
15 minutes to ensure complete saturation of the alanine aminotransferase and completion of
the reactions between NADH and endogenous substances in plasma. During this period, all
slopes were slightly decreasing with levels ranging from -3.07*10-5
to -1.12*10-5
and from
-2.82*10-5
to 3.04*10-6
for Tris/L-alanine (overall reaction) and Tris/D-alanine (individual
sample blank), respectively.
Almost all test samples showed a lag phase of approximately 300 seconds after the addition of
Tris/α-ketoglutaric acid. However, continuous measurements after this period resulted in a
monotonously decreasing ΔOD/Δt in samples for the overall reaction. This decrease was
significantly higher than in the samples for individual sample blanks (Kruskal-Wallis, χ2df 1=
21.5, p<0.001).
0 1 3 13
Page 48
36
Volumes of 5.0, 10 and 20 µL, and 20, 30 and 40 µL from the same plasma sample were
tested using two different 96-well plates. The calculated enzyme activities of the first plate
(5.0, 10 and 20 µL sample volumes) were slightly lower than the activities of the second plate
(20, 30 and 40 µL), with median values of 47.0 Units/L (34.9 to 62.3 Units/L) and 53.5
Units/L (53.1 to 63.0 Units/L), respectively. The ALAT activity calculated using the samples
with 5.0 µL plasma had the highest variability (34.9 Units/L to 62.3 Units/L) and was
evaluated to not give sufficiently accurate estimates of the enzymatic activity. All other
sample volumes yielded relatively identical activity estimates, and a volume of 15 µL for each
well in the 96-well plate was chosen to be used in the analysis of ALAT activity in plasma of
brown trout exposed to PFASs.
There were no significant differences in the activity of ALAT in plasma during exposure to
PFASs in trout from the “low” (one-way ANOVA, Fdf 2,11=0.217, p=0.8) or “high” treatments
(one-way ANOVA, Fdf 2,12=1.57, p=0.2) (Figure 11). Furthermore, there was no significant
difference when comparing samples collected at week three of exposure and week ten of
depuration (week 13, two sample t-test, tdf 8=1.27, p=0.2, and tdf 8=-1.30, p=0.2 for the “low”
and “high” treatments, respectively). The one-way ANOVA did not show any significant
changes in the ALAT activities between trout exposed to the “control”, “low” and “high”
treatments at week one (one-way ANOVA, Fdf 2,10=0.232, p=0.8) and week three of exposure
(one-way ANOVA, Fdf 2,12=1.01, p=0.4), nor at week ten after termination of the exposure
(week 13, one-way ANOVA, Fdf 2,12=1.45, p=0.3). No differences were found between the
treatments in the reference group (week zero, one-way ANOVA on log-transformed data, Fdf
2,11=0.829, p=0.5), nor over time in trout exposed to the “control” treatment (one-way
ANOVA, Fdf 3,14=0.114, p=1).
Page 49
37
Figure 11. Alanine aminotransferase (ALAT) activity in plasma of trout from “control” (blue), “low”
(green), and “high” (red) treatments at zero, one and three weeks during exposure to PFASs, and at
ten weeks after ended exposure (week 13, ended exposure is denoted by the black arrow). Median
and quartiles are presented (n=5, except “control” at time zero and one where n=4).
3.2.6 Combined analysis of biomarker responses
The biplots from the principal component analyses (PCA) using standardized and centred
biomarker responses in brown trout after zero, one, and three weeks of exposure, and ten
weeks of depuration to PFASs are shown in Figure 12. Among the reference samples (week
zero, Figure 12A), the variation in the responses can be 33% and 28% explained by the first
and second principal components (PCs), respectively. The highest proportions of the variance
explained by the PCs (75% in total) are in samples from week one of exposure (Figure 12B),
where PC1 is 54% and PC2 is (21%). After three weeks of exposure (Figure 12C), PC1 and
PC2 explain 40% and 22% of the total variation, respectively. For the last sampling week, at
ten weeks of depuration (Figure 12D), PC1 and PC2 explain 39% and 26%, respectively.
0 1 3 13
Page 50
38
Figure 12. Biplots of standardized and centred biomarker responses in trout from different treatments
on their principal components extracted from principal component analyses (PCA) at A) week zero
(reference), B) week one, and C) week three of exposure to PFASs, and D) ten weeks after ended
exposure. Biomarkers are ethoxyresorufin O-deethylase (EROD) activity in gills, thiobarbituric acid
reactive substances (TBARS) in gills and liver, peroxisomal acyl-CoA oxidase (AOX) activity in liver,
and the activity of alanine aminotransferase (ALAT) in plasma. Arrows represent the loadings of
different biomarkers. Percentages of the total variation explained by the PC’s are in brackets. (n=5,
except A “control” where n=4, and B “control” and “low” where n=4).
A B
C D
Page 51
39
The PCA biplots in Figure 13 shows the distributions of the standardized and centred
biomarker responses in brown trout exposed to the “high” and “low” concentrations of PFASs
sampled at week zero (reference), week one and week three during exposure, and ten weeks
after ended exposure (week 13). The PC axes in the biplot of responses in trout exposed to the
“high” concentration (Figure 13A) explain 41 and 22% of the total variation, while the biplot
for fish from the “low” treatment (Figure 13B) shows a PC1 explaining 43% and a PC2
explaining 21% of the variation.
Figure 13. Biplots of the standardized and centred biomarker responses in trout from week zero
(reference), one, and three weeks of exposure, and ten weeks after ended exposure to PFASs (week
13) on their principal components extracted from principal component analyses (PCA) in A) “high” and
B) “low” treatments. Biomarkers are ethoxyresorufin O-deethylase (EROD) activity in gills,
thiobarbituric acid reactive substances (TBARS) in gills and liver, peroxisomal acyl-CoA oxidase
(AOX) activity in liver, and the activity of alanine aminotransferase (ALAT) in plasma. Arrows represent
the loadings of different biomarkers. Percentages of the total variation explained by the PC’s are in
brackets. (n=5, except B week one where n=4).
A B
Page 52
40
4. Discussion
Harstad/Narvik Airport Evenes is arguably one of the most PFAS-polluted airports in Norway
(Sweco 2012). This study exposed juvenile brown trout to a mixture of fire foam-related
PFASs chosen to resemble the contamination in Lavangsvatnet close to Evenes Airport. The
aim was to investigate the bioconcentration, elimination and effects on biomarkers of
oxidative stress (lipid peroxidation levels and acyl-CoA oxidase activity), induction of
metabolic enzymes (ethoxyresorufin O-deethylase activity) and liver damage (alanine
aminotransferase activity). In addition, the biomarker results have been briefly discussed in
relation to the results from a parallel study investigating the effects on gene expression of
selected genes in the same trout exposed to PFASs (Hellstad 2015).
4.1 Bioconcentration and elimination of PFASs in trout
4.1.1 Exposure conditions and detection of PFASs
PFASs were present above the analytical detection limit in fish from both the “high” and
“low” treatments. As expected, PFOS had the highest concentrations in trout during the
exposure and depuration periods. PFHxS had the second highest concentration and was
detected in 59% of the samples taken during and after terminated exposure (not including
reference samples). This is in accordance with the PFASs found in fish collected from
Lavangsvatnet, where PFOS had the highest concentration followed by PFHxS (Norconsult
and Sweco 2015). 6:2 FTS, PFPeA and PFHxA were below the limit of detection in all trout
samples, i.e. there were no detectable bioconcentration of these PFASs following three weeks
exposure of fish to concentrations at 108, 57.2 and 37.8 µg/L (median levels from the “high”
treatment) in water, respectively. Although PFOA had the lowest nominal concentration (in
water) of the selected PFASs, this compound was detected in two of the five trout collected
from the “high” treatment following one week of exposure. The analyses had relatively low
sensitivity and subsequently high limits of detection (maximum DL=177 µg/kg) for the barely
and undetected PFASs compared to the preferred DL of 1 µg/kg. Less background noise in
the analyses would possibly have resulted in the detection of more PFASs present in the
nominal mixture in trout. On the other hand, a higher level of analytical uncertainty follows
concentrations close to the detection limits. Due to the low or non-detected concentrations of
Page 53
41
6:2 FTS, PFPeA, PFHxA and PFOA, the bioconcentration factors and half-lives could not be
calculated for these compounds.
PFOS, PFBA, PFNA and PFDA were detected in trout sampled before initiation of the
exposure (reference samples) and in the fish not exposed to PFASs (“control” treatment). This
indicates contamination, possibly by food (pellets) given before acclimatization or by cross-
contamination from the “high” and “low” treatment aquaria. PFBS and PFHpA were detected
in water from the “high” and “low” treatments during exposure indicating that the selected
compounds were not of preferred purity and thereby causing the detection of other than
nominal PFASs in water. These compounds (PFBS and PFHpA) did, however, not seem to
bioconcentrate in trout at the observed concentrations in this study.
The water concentrations (median) of PFOS reached 62% and 57% of the nominal
concentration during the three weeks of exposure in trout from the “low” and “high”
treatments, respectively. For PFHxS, the concentrations (median) reached 98% and 81% of
the nominal concentration. Martin et al. (2003a) observed that the concentration of PFOS
detected in water were lower than nominal (and of the other PFAS concentrations with fewer
C-F bonds) particularly early in their experiment and despite the constant flow-through
conditions. This was explained by a higher biomass in the aquaria close to initiation and due
to the more lipophilic properties of PFOS, compared to other PFASs with shorter fluoroalkyl
chains, which resulted in higher uptake rates and consequently less dissolved compound in the
water. In the present study, the other PFASs in the mixture were present at concentrations
equal to or slightly higher than nominal concentrations during the exposure period. A
different study described a relatively low water solubility for PFOS (910 mg/L), suggesting a
greater surface activity for this compound compared to PFOA (3300 mg/L) (Inoue et al.
2012), which also supports the results presented here and by Martin and co-authors (2003a).
4.1.2 Bioconcentration
The concentrations of PFOS increased significantly in trout exposed to the “high”
concentration from the reference group (week zero) to the samples collected three weeks after
initiation of the exposure. The levels were, however, not significantly different after only one
week of exposure. In fish exposed to the “low” concentration, PFOS did not increase
significantly during the exposure period and individual variations were observed. The PFHxS
Page 54
42
concentrations in fish were significantly higher in both treatments after three weeks of
exposure, as well as significantly increased after only one week in trout exposed to the “high”
concentration. Between the various treatments sampled at week one and week three of the
exposure period, only the “high” treatment showed significantly higher concentrations (of
both PFOS and PFHxS) compared to trout from both the “low” and “control” treatments.
In accordance with the results from the study presented here, Martin et al. (2003a) showed
that PFOS and PFHxS bioconcentrated significantly in juvenile rainbow trout (Oncorhynchus
mykiss) during 12 days of waterborne exposure. The same compounds were also found to
accumulate in juvenile and adult rainbow trout after dietary exposure (Martin et al. 2003b,
Goeritz et al. 2013, Falk et al. 2015). In the current study, PFASs with a sulfonate group
reached higher concentrations in brown trout than the carboxylated compounds. This is
consistent with existing knowledge (Martin et al. 2003a, Labadie and Chevreuil 2011, Inoue
et al. 2012, Goeritz et al. 2013, Falk et al. 2015). The observation is, however, partly biased
as the sulfonated PFASs (PFOS and PFHxS) had the highest nominal concentrations in the
PFAS mixture. 6:2 FTS was also expected to be detected in the exposed fish because of its
third highest concentration and sulfonate functional group. This compound and its alcohol
precursor (6:2 FTOH) have, however, previously been found to biodegrade in experiments
with bacteria and aerobic soil (Key et al. 1998, Liu et al. 2010). Short carboxylated
perfluoroalkyl substances (seven or less fluorinated carbons) have not been considered to
accumulate in organisms (Conder et al. 2008), which could explain why PFPeA, PFHxA and
PFOA (with the exception of two samples from the “high” treatment) were not detected in
trout exposed in this experiment. A higher than preferred detection limit (118 µg/kg compared
to 1 µg/kg) made it, however, impossible to detect a low bioconcentration of these compounds
had it been present.
Tissues of trout were not analysed separately in this study. Other studies have shown that the
rate of uptake, bioconcentration and measured concentrations of PFASs vary with tissues
analysed and are generally higher in organs rich in blood (e.g. liver and kidneys) compared to
lipid and muscle tissues (Martin et al. 2003a, Labadie and Chevreuil 2011, Falk et al. 2015).
In this study, differences in temperature during the experimental periods were minimal (8.8°C
± 0.8°C); however, higher metabolic rates (and consequently increased bioconcentration of
toxicants through active transport or increased ventilation rates) have been reported in fish
with increasing temperature (Cairns et al. 1975). In the study presented here, both PFOS and
Page 55
43
PFHxS bioconcentrated significantly in trout during the three weeks of exposure to the
selected PFASs, and thus disproved the first null hypothesis (1.) for these two compounds.
4.1.3 Bioconcentration factors of PFOS and PFHxS
The bioconcentration factors (BCFs) were calculated for two sulfonated PFASs. The BCF of
PFOS (244 and 185 L/kg) was 38 and 17 times higher than the BCF of PFHxS (6.34 and 11.2
L/kg) in the “high” and “low” treatments, respectively. This is in accordance with previous
knowledge where the BCFs of PFASs have been reported to be positively correlated with the
carbon chain length, until a point where it is limited by the compound’s molecular size
(Conder et al. 2008). In addition, BCFs have been shown to be higher for compounds with
sulfonate functional groups compared to carboxylated PFASs of the same chain length
(Martin et al. 2003a), which can be explained by their stronger binding affinities to proteins
(Ng and Hungerbühler 2013).
Martin et al. (2003a) calculated that PFOS had the highest BCFs (1100 L/kg in carcass) after
12 days of exposure in a flow-through system with juvenile rainbow trout and a mixture of
PFASs. A different study exposed juvenile common carp (Cyprinus carpio) to PFASs in
individual flow-through tanks for 58 days and calculated the BCF of PFOS (whole fish)
ranging between 720 and 1300 L/kg (Inoue et al. 2012). In adult marbled flounder
(Pseudopleuronectes yokohamae), the BCF of PFOS was calculated to 920 L/kg after 28 days
of exposure (Sakurai et al. 2013). These estimates are all in the same range and three to
seven-folds higher than the BCF of PFOS shown in this present study. On the other hand, the
BCF of PFOS have been calculated to 95 L/kg in northern leopard frog (Rana pipiens)
(Ankley et al. 2004), which is the only estimate of bioconcentration that is lower than those
found in the present study. Bioconcentration factors of PFHxS are mostly absent from
literature. However, Martin et al. (2003a) estimated a considerably lower BCF of PFHxS (9.6
L/kg in carcass) than of PFOS, and this value is in the same range as the BCF of PFHxS
estimated in this study.
The lipophilic and hydrophilic properties are usually taken into consideration when
calculating the BCF of a compound (Barron 1990). However, PFASs do not partition evenly
in lipid or water. Consequently, prudence should be exercised when estimating the BCFs as
the current methods may not adequately characterize the bioconcentration of these compounds
Page 56
44
(Arnot and Gobas 2006). A steady-state between the uptake and the elimination is assumed
when estimating the BCFs (Barron 1990). This was not the case for PFHxS and PFOS in
market-size rainbow trout after 28 days dietary exposure to PFASs (Goeritz et al. 2013), or
after 12 days of waterborne exposure in juvenile rainbow trout (Martin et al. 2003a). The time
to reach steady state have been predicted to approximately 43 and 30 days for PFOS and
PFHxS, respectively (Martin et al. 2003a, Martin et al. 2003b). In this present study, it cannot
be proven that a steady-state was attained, which might have been the cause for the relatively
low BCF of PFOS compared to other studies. However, the concentrations of especially
PFHxS, but also of PFOS, in water seemed to be stabilizing towards the end of the 20 days of
exposure.
4.1.4 Elimination and half-life of PFOS and PFHxS
The concentrations of PFOS in trout from the “high” and “low” treatments did not decrease
during the ten weeks of depuration. A significant elimination would, however, likely have
occurred with a longer time of sampling after terminated exposure. Two previous studies have
estimated the half-life of PFOS in juvenile rainbow trout (Martin et al. 2003a) and in juvenile
common carp (Inoue et al. 2012) after waterborne exposure to be 15 days (carcass) and 45 to
52 days (whole fish). After dietary exposure, the half-life has been calculated to 11, 13 and 16
days in carcass (Martin et al. 2003b, Falk et al. 2015) and whole body (Goeritz et al. 2013) of
juvenile and adult rainbow trout. Despite the differences between these estimates, they are all
lower than the non-measurable whole body half-life of PFOS in brown trout presented here.
Furthermore, the half-life of PFOS in this study was more consistent with the half-lives
calculated in chickens (125 and 231 days), monkeys (approximately four months), and
humans (4.8 years) as these estimates are longer than previously reported in fish (Olsen et al.
2007, Yeung et al. 2009, Chang et al. 2012, Tarazona et al. 2015).
The PFHxS concentrations were found to be significantly reduced in trout from the “high”
treatment collected ten weeks after ended exposure. No significant decrease could be detected
in fish exposed to the “low” concentration due to individual variation. The half-life of PFHxS
in trout (whole body) was estimated to 2.3 weeks (16.1 days) for both the “high” and “low”
concentrations. This is approximately five days longer than previously reported for carcass of
juvenile rainbow trout after waterborne exposure (Martin et al. 2003a), and seven to nine days
longer than from carcass and whole body of rainbow trout after exposure through food
Page 57
45
(Martin et al. 2003b, Goeritz et al. 2013, Falk et al. 2015). Still, the half-life presented in this
study is shorter than the estimates reported in rodents (one month), monkeys (four months)
and humans (7.8 years) (Olsen et al. 2007, Sundström et al. 2012).
Of the PFHxS concentrations measured at week one and week ten of depuration, trout
exposed to the “high” concentration showed significantly higher levels of PFHxS compared to
the “low” and “control” treatments, but the “low” treatment fish did not differ from the
“control”. This was, however, not the case for PFOS where the concentrations were
significantly different in trout from all treatments sampled at week one and week ten after
termination of the exposure, and this corresponds to what was expected from the exposure
regime.
A positive relationship between the chain length and the estimated half-life has previously
been shown for carboxylated PFASs, but not for sulfonated PFASs (Martin et al. 2003a,
Martin et al. 2003b, Lau et al. 2007). In the study presented here, PFHxS was eliminated
faster than PFOS, suggesting a possible positive correlation between the fluorinated chain
length and the estimated half-life of sulfonated PFASs, as shown for the PFASs with
carboxylate functional groups. Several studies have also shown that the sulfonated PFASs
(e.g. PFOS and PFHxS) have longer half-lives than the carboxylated PFASs of the same
carbon chain length (Martin et al. 2003a, Martin et al. 2003b, Falk et al. 2015). This could,
however, not be determined in the present study because only a few of the trout had detectable
concentrations of one of the carboxylated PFASs (PFOA) in the nominal mixture.
Estimation of the half-life was assumed to fit a one-compartment model and first-order
exponential decay. These assumptions could, however, not be confirmed due to the limited
number of sampling weeks after the exposure had been terminated. A longer depuration
period and more frequent sampling could have produced different half-life estimates,
especially for PFOS. For both PFOS and PFHxS in fish from the “low” treatment, the fact that
no decreases in concentrations were detected in trout collected one week after terminated
exposure was probably caused by individual and analytical variations. This lag in elimination
could, however, also indicate that the half-life estimation of PFASs fit a two or multi-
compartment model instead of a one-compartment model (Newman and Clements 2008 p.
119, Timbrell 2009 p. 64). The simple one-compartment model has also been questioned
when estimating the pharmacokinetics for PFOS (Tarazona et al. 2015), and the half-lives of
PFOS and PFHxS have been shown to vary with tissues analysed (Martin et al. 2003a, Martin
Page 58
46
et al. 2003b, Falk et al. 2015). In the present study, PFOS was not eliminated from trout
during the depuration period (ten weeks), which supports the second null hypothesis (2.) for
this compound. On the other hand, the concentration of PFHxS decreased significantly in
trout after terminated exposure, which resulted in a half-life estimate of 2.3 weeks, and
disproved the second null hypothesis for this compound.
4.2 Effects of PFASs
4.2.1 Ethoxyresorufin O-deethylase activity in gills
No significant increase in the activity of EROD in gills was detected in trout exposed to the
“low” PFAS concentration during the three weeks of exposure. Fish from both the “control”
and “high” treatments showed significant increases in the EROD activity from week zero to
week one and week three of exposure to PFASs. As the same pattern of significance was
found in fish from the “control” treatment the elevated activity detected in the “high”
treatment probably originated from stress and unknown influences. Handling stress during
laboratory experiments did, however, not significantly affect the EROD activity of Arctic
charr (Salvelinus alpinus) (Jørgensen et al. 2001).
In the “low” treatment, EROD activity was elevated in trout collected at ten weeks of
depuration, which indicates an induction of the CYP1A enzymes by the selected PFASs. No
significant changes were, however, detected in trout exposed to the “high” treatment. Less
variation was shown in the activity of EROD between trout from the “control” treatment,
compared to the “low” and “high” treatments, and no significant differences were detected
between week three of exposure and week ten of depuration. At the last day of exposure
(week three), the EROD activity was increased in trout from the “high” treatment and
decreased in the “low” treatment compared to the “control”. Similar results have not been
reported by other studies and this pattern was not detected within any other sampling weeks.
To the author’s knowledge, no studies on the induction of EROD in gills of fish by a mixture
of fire foam-related PFASs have yet been published. PFOS has been shown not to cause a
significant increase in the EROD activity in gills of green mussel (Perna viridis) after a
seven-day exposure period (Liu et al. 2014b). A significant decrease in the activity was,
however, observed in mussel exposed to the highest concentration (1.0 mg/L PFOS). The
authors suggest that the tested PFASs are not biotransformed by the CYP1A enzymes or that
Page 59
47
the EROD enzyme could be inhibited by PFOS. This inhibition has been shown in human
hepatocytes, however the CYP1A enzymes showed less inhibition by PFOS than the other
CYP-enzymes analysed (Narimatsu et al. 2011).
Studies by Kim et al. (2010) and Bilbao et al. (2010) showed no induction of the EROD
enzyme in liver when exposing juvenile common carp and thicklip grey mullet (Chelon
labrosus) to 50 and 2.0 mg/L PFOS through water (four and 16 days of exposure,
respectively). In contrast, the activity of EROD in liver was elevated in freshwater tilapias
(Oreochromis niloticus) after three days of dietary exposure (10, 20 and 30 mg/L PFOS) (Han
et al. 2012). Hu et al. (2003) showed that PFOS alone did not induce CYP1A1 (EROD
activity) in the hepatocytes of desert topminnow (Poeciliopsis lucida) and rat hepatoma cells.
However, the authors reported an increased activity of as much as 40% when exposing cells
to a combination of 2,3,7,8-tetrachlorodibenzo-p-dioxin (TCDD) and PFOS, compared to
when the cells that were only exposed to TCDD. Hu and co-authors (2003) suggested that
PFOS increased the permeability of cells to hydrophobic substances (such as TCDD) by
affecting the cell membrane, rather than having specific effects directly on the CYP1A
enzymes. It is, however, difficult to extrapolate the results from in vitro on to in vivo
experiments and effects. Hu et al. (2003) also investigated whether PFHxS had an effect on
the activity of EROD in fish hepatocytes; however, no changes were detected within the range
of the tested concentrations. Watanabe et al. (2009) found that an exposure to PFOS alone did
not change the EROD activity in chicken embryo hepatocytes (0.1, 1.0 and 10 µM exposure
after 24 hours incubation). The authors suggested that PFOS is such a weak EROD inducer
that if a more prominent inducer was present (e.g. TCDD), PFOS would have no effect on the
already induced EROD activity.
From the studies described above it can be concluded that PFOS and PFHxS do not induce
EROD activity when administered separately. In this study, the significant induction of this
metabolic enzyme detected in gills of trout exposed to the “low” concentration of fire foam-
related PFASs (collected at ten weeks of depuration) disproved the third null hypothesis (3.),
and the result should be further investigated.
Page 60
48
4.2.2 Thiobarbituric acid reactive substances in gills
The levels of lipid peroxides (TBARS) in gills did not change over time in trout from the
“control”, “low” or “high” treatments during exposure to PFASs, nor were there any
differences after ten weeks of depuration. No differences were detected in TBARS when
comparing the treatments collected at each sampling week. However, the results during
exposure, depuration and between treatments might have been statistically significant if less
individual variation had been present.
Not many studies have analysed the levels of lipid peroxidation in gills after exposure to
PFASs, and to date there are no published articles on changes in the levels of TBARS in gills
of fish caused by the exposure to PFHxS. Munyemera (2014) exposed juvenile Atlantic cod
(Gadus morhua) to 100 and 200 µg/L PFOS. None of the results were significantly different
from the control, but the lipid peroxidation in the gills of cod did slightly increase after three
and nine days of exposure to the “low” concentration. After nine days of exposure in cod from
the “high” treatment, TBARS were stated as lower compared to the “control” and “low”
treatments (Munyemera 2014). In comparison, the study presented here had concentration of
PFOS in water (from the “high” treatment) that was 1.4 times higher than the highest
concentration yielding no significant changes in the study by Munyemera (2014); in addition
to a two-fold longer time of exposure.
Another study detected significant increases in the levels of TBARS in green mussel when
exposed to 1.0 and 10 mg/L of PFOS for seven days (Liu et al. 2014a). The authors concluded
that the induction of TBARS was a result of the ROS production exceeding the antioxidant
capacity leading to oxidative damage to lipids. However, caution should be taken when
comparing results on toxicity between vertebrates and invertebrates. Consequently, from an
increased level of TBARS in the green mussel (after exposure to PFOS) it cannot be
concluded that the same result would occur in fish.
The TBARS test should be used with prudence (when body fluids and tissue extracts are
analysed) due to the detection of other aldehydes in addition to MDA or that the peroxide
decomposition produces radicals that amplifies the responses given by the analysis (Halliwell
and Chirico 1993). In the present study, the exposure to PFASs did not cause lipid
peroxidation in the gills of trout and the fourth null hypothesis (4.) was supported. More
studies should, however, be conducted to examine possible changes in the TBARS levels in
gills after exposure to single substances and mixtures of PFASs.
Page 61
49
4.2.3 Thiobarbituric acid reactive substances in liver
The levels of lipid peroxidation (TBARS) in the liver of trout did not change during the
exposure period in the “low” and “high” PFASs treatments. Although not statistically
significant, there were decreases in the hepatic TBARS levels ten weeks after ended exposure
in trout exposed to the “low” concentration when compared to the levels detected at week
three of exposure. This decrease was, however, also present in the control treatment and was
possibly caused by individual variation. No differences were detected in the levels of hepatic
lipid peroxidation when comparing trout from the “control”, “low” and “high” treatments
collected at each time of sampling.
Oakes et al. (2005) investigated the effects of PFOS on different species and life-stages of
fish. Male fathead minnow (Pimephales promelas), juvenile rainbow trout, adult creek chub
(Semotilus atromaculatus) (both genders) and female spottail shiner (Notropis hudsonius)
showed elevated levels of hepatic lipid peroxidation after exposure to 3.0 mg/L PFOS for 12,
14 or 28 days. Female rainbow trout also showed elevated TBARS in the liver after 14 days
with 1.0 mg/L exposure, and female fathead minnow had significantly more lipid
peroxidation after exposure to the “low” treatment (0.3 mg/L PFOS) for 28 days. Adult white
sucker (Catostomus commersoni) of both genders was the only species that did not show
changed TBARS levels in the liver after exposure to PFOS for 14 and 21 days (3.0 mg/L)
(Oakes et al. 2005).
Juvenile goldfish (Carassius auratus) showed increased lipid peroxidation levels in the liver
after exposure to 0.5 mg/L PFOS for four days (Feng et al. 2015). TBARS was also
significantly elevated compared to the control in combined exposures with PFOS and copper
(0.5 mg/L PFOS + 50 µg/L Cu and 5.0 mg/L PFOS + 200 µg/L Cu) (Feng et al. 2015).
Juvenile Atlantic salmon (Salmo salar) exposed to a diet containing PFOS (0.2 mg/kg)
showed significantly elevated hepatic levels of lipid peroxidation after two days and
significantly reduced levels after eight days of exposure. An increase was again detected
seven days after ended exposure (Arukwe and Mortensen 2011).
PFOS have also been shown to increase the TBARS levels in zebrafish (Danio rerio) embryos
after 92 hours exposure to 1.0 mg/L PFOS (from four to 96 hpf) (Shi and Zhou 2010), and in
in vitro studies with human neurotypic cell lines and exposure to 5.0, 12.5 and 25 mg/L PFOS
(Slotkin et al. 2008, Chen et al. 2014). Another study exposed primary cultured hepatocytes
of freshwater tilapia to PFOS (0, 1.0, 5.0, 15 and 30 mg/L) for 24 hours (Liu et al. 2007), and
Page 62
50
found that levels of TBARS were unchanged for all concentrations. This was an unexpected
result due to the notable increase of ROS observed in the cells after exposure to 15 mg/L.
The effects on hepatic TBARS have been investigated after an airplane fire and the following
application of approximately 48000L aqueous film-forming foam (AFFF) in Toronto, Canada
in 2005 (Oakes et al. 2010). After the spill, PFOS and 6:2 FTS was two of the detected
PFASs in liver of blacknose dace (Rhinichthys atratulus) nine days after the AFFF
application. Hepatic TBARS of dace were significantly lowered downstream of the
application site, while an increase was observed in creek chub. 120 days after the application,
only creek chub sampled around the application site had elevated TBARS levels possibly
reflecting their diet. The authors concluded that the accidental application of AFFF did not
have a significant impact on the fish community. A different field study on wood mice
(Apodemus sylvaticus), sampled in close approximation to a fluorochemical plant in Antwerp,
Belgium in 2002, showed a significant relationship between the hepatic TBARS and the
PFOS liver concentrations (0.47 mg/kg to 179 mg/kg) (Hoff et al. 2004). This indicated
oxidative damage to the hepatic tissues in this heavily polluted population of wood mice.
In comparison with the levels of hepatic TBARS presented here, there is no clear indication
that the concentrations of PFASs used in this study should cause significant lipid peroxidation
in the exposed trout. Only female fathead minnow (and possibly also juvenile goldfish)
showed increased lipid peroxidation at relevant PFOS concentrations, and species and gender
differences in the sensitivity of TBARS are evident. Oakes et al. (2010) found effects on
TBARS when only 219 to 350 µg/kg PFOS was detected in fish liver from field. These
concentrations are much lower than PFOS detected in the whole body of trout in this study,
but the effects on TBARS found by Oakes and co-authors (2010) were probably influenced by
environmental factors and other xenobiotics causing lipid peroxidation. In the study presented
here, a mixture of the selected PFASs did not cause lipid peroxidation in the liver of trout and
hence supported the fourth null hypothesis (4.).
4.2.4 Peroxisomal acyl-CoA oxidase activity in liver
No significant differences were detected in the activity of hepatic AOX in trout from all the
treatments during and after ended exposure to PFASs. There was, however, a slight decrease
in the activity from week three of exposure to ten weeks of depuration in fish exposed to the
Page 63
51
“high” concentration. No differences were detected in the AOX activity between trout
exposed to the “control”, “low” and “high” treatments within each time of sampling.
Oakes et al. (2005) (in addition to investigating the effect of PFOS on hepatic TBARS)
analysed for changes in the AOX activity in liver of different fish species. Juvenile rainbow
trout, female rainbow trout, adult creek chub and female spottail shiner showed elevated AOX
levels after exposure to 1.0 and 3.0 mg/L PFOS for 12, 14 or 21 days. Adult fathead minnow
and adult white sucker (both genders) did, however, not show significant changes in the
activities after exposure to 3.0 mg/L PFOS. The authors concluded that PFOS is a peroxisome
proliferator in a number of fish species, although species differences are notable. Another
study on thicklip grey mullet showed induced AOX activity after two days of exposure to
only the “high” concentration of PFOS (2.0 mg/L) (Bilbao et al. 2010), and it was concluded
that PFOS does not seem to act as a typical peroxisome proliferator in this species of fish.
After the application of AFFF during an airplane fire in Toronto, Canada, the AOX activity in
liver of blacknose dace was significantly reduced directly downstream of the application site
at day nine, but significantly increased 120 days after application (Oakes et al. 2010). A
different species of fish (creek chub) showed decreased activity immediately below the
application site only at day 120. The effect of PFOS on the hepatic AOX in juvenile common
carp after a single intraperitoneal injection was investigated by Hoff et al. (2003a). No
significant changes were detected for the measured concentrations of 16, 270 and 864 ng/g
PFOS in liver five days after injection, but the authors speculated that PFOS could be a weak
peroxisome proliferator in carp.
Studies on the activity of AOX in liver of male rats have shown significant increases after
single intraperitoneal injections or seven days of dietary exposure to 100 mg/kg PFOS
(Berthiaume and Wallace 2002, Elcombe et al. 2012). The AOX activity was also increased in
male rats after four weeks of exposure to 20 mg/kg PFOS, but this increase was not persistent
in samples taken ten weeks later (Seacat et al. 2003). The authors concluded that PFOS did
not cause peroxisome proliferation in rats at the tested concentrations (20 mg/kg as the
highest treatment concentration), which was also supported by a different study using rats
showing similar results in the hepatic AOX activity after seven days of dietary exposure to 20
mg/kg PFOS (Elcombe et al. 2012). In cynomolgus monkeys (Macaca fasicularis), a
significant increase in the AOX activity was shown after exposure to 0.75 mg/kg/day of PFOS
(Seacat et al. 2002). However, the increase was not above the criteria for biological
Page 64
52
significance (two-fold higher than the control levels) and the authors concluded that PFOS did
not cause peroxisomal proliferation in monkeys.
Differences in the effect of PFOS on the hepatic AOX activity are evident between various
species in the studies mentioned above, and little information is available for the effect of
PFHxS. In comparison with the study presented here, only higher concentrations have been
shown to cause effects on the hepatic AOX and it can be concluded that no peroxisome
proliferation was expected from the chosen PFAS concentrations in this study. Some studies
have shown that the activities normalized to grams of tissue are more sensitive indicators for
the levels of AOX and oxidative damage (Oakes et al. 2004, Oakes et al. 2005). In the present
study, the AOX activity was, however, only reported as values normalized to protein
concentrations. No significant peroxisome proliferation was detected in the liver of trout
exposed to the mixture of PFASs, and the fourth null hypothesis (4.) was supported. More
studies are needed to evaluate the effects of lower concentrations of PFASs, both after
singular and combined exposure.
4.2.5 Alanine aminotransferase activity in plasma
After adapting the method for measuring ALAT activity in small plasma samples from trout,
the analysis was used to investigate the liver tissue damage during and after terminated
exposure to the mixture of PFASs. No differences in ALAT activity were detected in trout
during the exposure and depuration periods. Neither were there any differences between fish
exposed to the “control”, “low” and “high” treatments within each time of sampling.
A detailed method for detecting the levels of ALAT in smaller volumes of plasma has
previously not been published. The plates run as tests showed a more rapid decrease in
samples added the overall reaction mixture (Tris/L-alanine) than for those added the mixture
for individual sample blank (Tris/D-alanine), and this indicated a functioning analysis for
measuring ALAT. A minimal volume of 10 µL plasma should be used to get a more accurate
estimate of the activity. Only two test-plates were, however, used to evaluate which volumes
yielded sufficient accuracy of the estimated activities. Had more replicates of the smallest
plasma volume (5.0 µL) been tested, the results might have showed that this minimalistic
volume would be enough to acquire precise and detectable activities.
Page 65
53
Hoff et al. (2003a) was the first to report in vivo effects of PFOS on the activity of ALAT in
fish. This study exposed juvenile common carp to PFOS through a single intraperitoneal
injection, and after five days showed that the activity had a clear dose-dependent relationship
with increasing liver concentrations of PFOS (16.0 to 864 µg/kg). The ALAT activities were
significantly elevated in the groups with 561, 670 and 864 µg/kg PFOS in the liver. The
researchers concluded that PFOS had deleterious effects on the membrane integrity (however
not caused by lipid peroxidation) which might have resulted in necrosis of the liver cells.
Other studies have measured the activity of ALAT in field samples, and Hoff et al. (2003b)
found that the PFOS concentrations in liver and the ALAT activities in plasma significantly
correlated in bib (Trisopterus luscus), however not in plaice (Pleuronectes platessa). The
authors speculate that the link between PFOS concentrations and ALAT activities in bib could
have been influenced by environmental factors varying along the Western Scheldt. Possible
species differences was also shown by Hoff et al. (2005) who found that the ALAT activity
was significantly positively correlated with the PFOS concentration in liver of common carp
and eel (Anguilla anguilla), but not in gibel carp (Carassius auratua gibelio) collected in
Flanders, Belgium. Fair et al. (2013) also found a positive correlation between the activity of
ALAT and both PFOS and sum sulfonated PFASs (including PFOS and PFHxS)
concentrations in plasma of a highly exposed population of Atlantic bottlenose dolphins
(Tursiops truncates). The possibility of PFOS to induce hepatic damage in the field is
plausible; however, the relationships observed could have been affected by the exposure to
other xenobiotics (e.g. PAH and BKME have been shown to affect the ALAT activity (van
der Oost et al. 2003)).
In wood mice collected near a fluorochemical plant in Antwerp, Belgium in 2002, the activity
of ALAT showed a negative correlation to the liver PFOS concentration (ranging from 0.47 to
179 µg/g) (Hoff et al. 2004). This contradicts what have been shown in male rats exposed to
20 mg/kg PFOS through the diet for 14 weeks (which increased the ALAT activity) (Seacat et
al. 2003), and in plasma of approximately 47000 adult humans of the C8 Health Project (a
significantly positive relationship between the ALAT activity and the PFOS concentration in
plasma) (Gallo et al. 2012). Cynomolgus monkeys exposed to PFOS (0.03, 0.15, or 0.75
mg/kg/day) for at least 26 weeks did, however, not show any significant increases in the
activity of ALAT (Seacat et al. 2002). Neither did male rats exposed to 20 or 100 mg/kg
PFOS for seven days in a different experiment by Elcombe et al. (2012), and it was suggested
that PFOS did not cause hepatotoxicity in these species.
Page 66
54
Little information on the toxicity of PFHxS has been documented. Butenhoff et al. (2009)
exposed rats to different concentrations of PFHxS (0.3, 1.0, 3.0 and 10 mg/kg) in a study
investigating the reproductive and developmental toxicity of this substance. After 42 days of
exposure, no significant differences were detected in the activity of ALAT.
There are evident species-dependent differences in the sensitivity of ALAT when exposed to
PFASs. In studies detecting correlations between PFOS and ALAT from field samples it is
plausible that these organisms were exposed to additional compounds possibly confounding
the observed relationships. From the results presented in this study, it seemed that PFOS (at
median water concentrations of 284 and 3.30 µg/L) in a mixture with other PFASs did not
cause liver damage in brown trout, and thus supported the fifth null hypothesis (5.). More
research is needed to fully characterize the hepatotoxicity of PFASs in fish (singular or in
combination), especially conducted in controlled laboratory studies with constant exposure
regimes.
4.2.6 Combined analysis of biomarker responses
By conducting a principal component analysis (PCA) it is possible to visualize patterns of
observations and variables in a dataset (Bro and Smilde 2014). When producing biplots of the
samples within each week, and for trout from the “low” and “high” treatments, no obvious
patterns and clustering were observed in the score plots of trout exposed to a mixture of
PFASs. Some samples had relatively high values (possible outliers) even after standardization
and centration. These observations were not removed from the PCA and are presumably not
incorrect, but rather assumed to be extremes due to individual variation (Bro and Smilde
2014).
When investigating the loading plot of the reference samples (week zero), no obvious
correlations between the variables were present. After one week of exposure, the levels of
TBARS in gills and the ALAT activity in plasma seemed to be positively correlated and
largely explained by the first principal component. This pattern was not present after three
weeks of exposure, but again visible in the samples collected after ten weeks of depuration.
To the author’s knowledge, an increased ALAT activity does not have any reasonable
connection to the level of lipid peroxidation in gills. However, the correlation could indicate
that the trout with low TBARS levels in gills also had low ALAT levels in plasma indicating
Page 67
55
low or non-detectable effects of the PFASs. Biomarker variables in the biplots of trout
collected at week three of exposure and week ten of depuration both showed a possible
positive correlation between the TBARS in liver and the EROD activity in gills. These
variables have no likely connections and the correlation was probably due to randomness and
individual variation between the trout exposed to PFASs.
The levels of TBARS in gills and liver of trout seemed to be positively correlated in the biplot
of fish exposed to the “high” concentration of PFASs. This relationship was also visible in the
biplot of trout from the “low” treatment and could be explained by the PFASs causing similar
oxidative damage effect patterns to lipids in the liver (due to the high metabolic activity and
capacity for elimination of this organ) as to lipids in the gills (as the organ of uptake and
possible elimination). In the biplot of biomarker responses in trout from the “high” treatment
of PFASs, the activity of ALAT in plasma seem to be positively correlated with both TBARS
in the liver and in the gills. This relationship was to be expected as an increased concentration
of TBARS indicates higher levels of lipid peroxidation. The cell membranes largely consist of
lipids (Newman and Clements 2008 p. 95) and an increase in the hepatic TBARS could result
in increased damage to membranes and following leakage of ALAT out from the liver cells
and into the extracellular fluid. This relationship between TBARS and ALAT was, however,
not visible in trout exposed to the “low” concentration of PFASs. The hepatic TBARS levels
were also expected to correlate with the AOX activity in the liver, but this was not observed
in any of the biplots.
In conclusion, no obvious patterns were observed in the score plots created by the principal
component analysis. The levels of lipid peroxidation in the gills and the liver showed a
possible positive correlation in the loading plots of trout exposed to the “high” and “low”
PFAS concentrations. None other consistent relationships were observed between the
biomarker responses presented in the biplots.
4.3 Relationship of biomarker responses to gene expression
In a parallel study (in addition to the biomarker analyses presented in this study) liver and
gills of the same brown trout were analysed for the effects on gene expression of selected
genes (Hellstad 2015).
Page 68
56
Expression of the CYP1A gene would be expected to be related to the activity of EROD in a
sample (Abrahamson 2007, Bilbao et al. 2010). The CYP1A expression in gills did not show
any significant differences in trout from the “control”, “low” and “high” treatments during
exposure to PFASs. A non-significant increase in the expression was, however, observed in
trout exposed to the “low” concentration from week three of exposure to week ten of
depuration. This corresponds to the significantly increased EROD activity in trout from the
“low” treatment observed in the present study, and supports the conclusion that the “low”
PFAS concentration induces EROD after ended exposure.
The genes PPARα, PPARγ and AOX are involved in lipid metabolism and peroxisome
proliferation (Corton et al. 2000), and expected to be related to the detection of TBARS and
the activity of AOX. Expression of the PPARα and PPARγ genes were not significantly
changed in gills of trout following exposure or depuration to PFASs, which coincides with the
levels of lipid peroxidation (TBARS) in gills observed in this study (no significant
differences). The PPARα gene in liver had a significantly lower expression when comparing
week three of exposure to week ten of depuration in trout from the “control” treatment. This
trend, however not significant, was also observed in the levels of hepatic TBARS in this study
and could be caused by individual variation. The expression of PPARγ in liver increased
significantly from week zero to week three of exposure in trout from the “low” treatment, but
this was not observed in the measured levels of hepatic TBARS in this study. Gene expression
of the AOX enzyme in liver increased significantly in trout from the “low” treatment when
comparing samples collected at week zero and week one of exposure to PFASs. The same
increase, although not significant, was detected in the hepatic AOX activity presented in this
study. No other significant changes in expression of the AOX gene was observed between the
other sampling weeks.
Hellstad (2015) also investigated the effect on the ABCb1 (P-glycoprotein) gene, which
would be expected to be related to the expression of the ATP-binding cassette transport
proteins (Luckenbach et al. 2014), and the results showed a significantly elevated expression
in the liver of trout exposed to the “high” concentration of PFASs when comparing week
three of exposure and week ten of depuration. The hepatic expression of vitellogenin (the egg
yolk precursor protein normally only present in oviparous female vertebrates (Mommsen and
Walsh 1988)) was significantly increased in fish from the “high” treatment collected at three
weeks of exposure. In addition, trout exposed to the “high” concentration of PFASs had
elevated expression of vitellogenin compared to fish from the “control” treatment sampled at
Page 69
57
week three of exposure and at week ten of depuration. Genes involved in oxidative stress
responses (metallothionein, γ-glutamyl synthetase and thioredoxin) were also investigated in
the liver and gills of the trout and the results showed no significant induction during the
exposure and depuration periods.
Page 70
58
5. Conclusions
The bioconcentration, elimination and effects of a fire foam-related PFAS mixture, simulating
contamination in Lavangsvatnet near Evenes Airport, were investigated in juvenile brown
trout. Of the six PFASs in the nominal exposure, only PFOS and PFHxS were detected in
more than two trout sampled during the three weeks of exposure. These compounds were
shown to bioconcentrate significantly during the exposure period with BCFs of 244 and 185
L/kg, and 6.34 and 11.2 L/kg for PFOS and PFHxS, respectively. Only the concentrations of
PFHxS increased significantly in trout exposed to the “low” levels of PFASs (made to
resemble the concentrations detected in Lavangsvatnet).
PFOS was not significantly eliminated from trout during the ten weeks of depuration. The
concentrations of PFHxS in trout exposed to the “high” treatment were significantly
decreased during the depuration period and the whole body half-life was estimated to 2.3
weeks in both the “high” and “low” treatments. No significant decreases could be detected in
fish exposed to the “low” concentration due to individual variation.
The induction of the metabolic CYP1A enzyme (by analysis of the EROD activity) in gills of
trout was significantly increased during the exposure period in trout exposed to the “control”
and “high” concentrations of PFASs. During depuration, the EROD activity was significantly
induced in trout from the “low” treatment (PFAS concentrations resembling contamination in
Lavangsvatnet) sampled ten weeks after ended exposure. There were no significant effects on
the oxidative damage responses (lipid peroxidation levels and the activity of AOX) or the
liver damage (ALAT activity) in trout exposed to the selected fire foam-related PFASs.
Based on the results of this study, the trout population in Lavangsvatnet would be expected to
bioconcentrate PFOS and PFHxS, but not the other PFASs likely to originate from the
contamination by AFFFs (6:2 FTS, PFPeA, PFHxA and PFOA). In addition, PFOS would be
expected to reside in the trout and induce the activity of CYP1A in gills a while after
terminated exposure. The concentrations of PFASs found in Lavangsvatnet do, however, not
cause oxidative damage or liver damage in the trout when exposed for a period of three
weeks.
Page 71
59
6. Future recommendations
From the results presented in this study it can be concluded that the contamination of aquatic
environments due to the use of AFFFs containing PFASs should be assessed as a hazard in
risk assessment, especially in terms of the possible bioconcentration of PFASs in biota. More
research is needed to better determine the toxicokinetics of PFASs in fish. Although
differences in the sensitivity to PFASs have been documented between various species, little
information is available on the lipid peroxidation and the induction of the CYP1A enzyme in
gills of fish following exposure to PFASs (both singular and in combination). More controlled
laboratory studies are needed to investigate the oxidative damage, induction of metabolic
enzymes and possible liver damage in fish exposed to mixtures of PFASs. Biomarkers of
endocrine, developmental and immunotoxic responses should also be further examined to get
a more holistic understanding of the biological effects in fish from exposure to PFASs.
Page 72
60
7. References
Abrahamson, A. (2007). Gill EROD Activity in Fish. A Biomarker for Waterborne Ah-
Receptor Agonists. Ph.D thesis. Uppsala University.
Ankley, G. T., Kuehl, D. W., Kahl, M. D., Jensen, K. M., Butterworth, B. C. and Nichols, J.
W. (2004). Partial Life-Cycle Toxicity and Bioconcentration Modeling of
Perfluorooctanesulfonate in the Northern Leopard Frog (Rana pipiens). Environmental
Toxicology and Chemistry, 23: 2745-2755.
Arnot, J. A. and Gobas, F. A. (2006). A Review of Bioconcentration Factor (BCF) and
Bioaccumulation Factor (BAF) Assessments for Organic Chemicals in Aquatic Organisms.
Environmental Reviews, 14: 257-297.
Arukwe, A. and Mortensen, A. S. (2011). Lipid Peroxidation and Oxidative Stress Responses
of Salmon Fed a Diet Containing Perfluorooctane Sulfonic- or Perfluorooctane Carboxylic
Acids. Comparative Biochemistry and Physiology Part C: Toxicology & Pharmacology, 154:
288-295.
Barron, M. G. (1990). Bioconcentration. Will water-borne organic chemicals accumulate in
aquatic animals? Environmental Science & Technology, 24: 1612-1618.
Benninghoff, A. D., Bisson, W. H., Koch, D. C., Ehresman, D. J., Kolluri, S. K. and
Williams, D. E. (2011). Estrogen-Like Activity of Perfluoroalkyl Acids In Vivo and
Interaction with Human and Rainbow Trout Estrogen Receptors In Vitro. Toxicological
Sciences, 120: 42-58.
Benninghoff, A. D., Orner, G. A., Buchner, C. H., Hendricks, J. D., Duffy, A. M. and
Williams, D. E. (2012). Promotion of Hepatocarcinogenesis by Perfluoroalkyl Acids in
Rainbow Trout. Toxicological Sciences, 125: 69-78.
Bergmeyer, H. U., Hørder, M. and Rej, R. (1986). IFCC Methods for the Measurement of
Catalytic Concentration of Enzymes. Part 3. IFCC Method for Alanine Aminotransferase.
Clinical Chemistry, 24: 481-495.
Page 73
61
Berthiaume, J. and Wallace, K. B. (2002). Perfluorooctanoate, Perflourooctanesulfonate, and
N-Ethyl Perfluorooctanesulfonamido Ethanol; Peroxisome Proliferation and Mitochondrial
Biogenesis. Toxicology Letters, 129: 23-32.
Bilbao, E., Raingeard, D., de Cerio, O. D., Ortiz-Zarragoitia, M., Ruiz, P., Izagirre, U., Orbea,
A., Marigómez, I., Cajaraville, M. P. and Cancio, I. (2010). Effects of Exposure to Prestige-
Like Heavy Fuel Oil and to Perfluorooctane Sulfonate on Conventional Biomarkers and
Target Gene Transcription in the Thicklip Grey Mullet Chelon labrosus. Aquatic Toxicology,
98: 282-296.
Blum, A., Balan, S. A., Scheringer, M., Trier, X., Goldenman, G., Cousins, I. T., Diamond,
M., Fletcher, T., Higgins, C., Lindeman, A. E., Peaslee, G., de Voogt, P., Wang, Z. and
Weber, R. (2015). The Madrid Statement on Poly- and Perfluoroalkyl Substances (PFASs).
Environmental Health Perspectives, 123: A107-A111.
Botsoglou, N. A., Fletouris, D. J., Papageorgiou, G. E., Vassilopoulos, V. N., Mantis, A. J.
and Trakatellis, A. G. (1994). Rapid, Sensitive, and Specific Thiobarbituric Acid Method for
Measuring Lipid Peroxidation in Animal Tissue, Food, and Feedstuff Samples. Journal of
Agricultural and Food Chemistry, 42: 1931-1937.
Bro, R. and Smilde, A. K. (2014). Principal Component Analysis. Analytical Methods, 6:
2812-2831.
Bucher, F. and Hofer, R. (1990). Effects of Domestic Wastewater on Serum Enzyme
Activities of Brown Trout (Salmo trutta). Comparative Biochemistry and Physiology Part C:
Comparative Pharmacology, 97: 381-385.
Buck, R. C., Franklin, J., Berger, U., Conder, J. M., Cousins, I. T., de Voogt, P., Jensen, A.
A., Kannan, K., Mabury, S. A. and van Leeuwen, S. P. (2011). Perfluoroalkyl and
Polyfluoroalkyl Substances in the Environment: Terminology, Classification, and Origins.
Integrated Environmental Assessment and Management, 7: 513-541.
Buck, R. C., Murphy, P. M. and Padon, M. (2012). Chemistry, Properties, and Uses of
Commercial Fluorinated Surfactants. In: Knepper, T. and Lange, F. Polyfluorinated
chemicals and transformation products. Berlin, Germany: Springer.
Page 74
62
Butenhoff, J. L., Chang, S.-C., Ehresman, D. J. and York, R. G. (2009). Evaluation of
Potential Reproductive and Developmental Toxicity of Potassium Perfluorohexanesulfonate
in Sprague Dawley Rats. Reproductive Toxicology, 27: 331-341.
Cairns, J. J., Heath, A. G. and Parker, B. C. (1975). The Effects of Temperature Upon the
Toxicity of Chemicals to Aquatic Organisms. Hydrobiologia, 47: 135-171.
Cajaraville, M. P., Cancio, I., Ibabe, A. and Orbea, A. (2003). Peroxisome Proliferation as a
Biomarker in Environmental Pollution Assessment. Microscopy Research and Technique, 61:
191-202.
Cancio, I. and Cajaraville, M. P. (2000). Cell Biology of Peroxisomes and Their
Characteristics in Aquatic Organisms. International Review of Cytology, 199: 201-293.
Chang, S.-C., Noker, P. E., Gorman, G. S., Gibson, S. J., Hart, J. A., Ehresman, D. J. and
Butenhoff, J. L. (2012). Comparative Pharmacokinetics of Perfluorooctanesulfonate (PFOS)
in Rats, Mice, and Monkeys. Reproductive Toxicology, 33: 428-440.
Chen, N., Li, J., Li, D., Yang, Y. and He, D. (2014). Chronic Exposure to Perfluorooctane
Sulfonate Induces Behavior Defects and Neurotoxicity through Oxidative Damages, In Vivo
and In Vitro. PLoS ONE, 9: e113453.
Conder, J. M., Hoke, R. A., de Wolf, W., Russell, M. H. and Buck, R. C. (2008). Are PFCAs
Bioaccumulative? A Critical Review and Comparison with Regulatory Criteria and Persistent
Lipophilic Compounds. Environmental Science & Technology, 42: 995-1003.
Corton, J. C., Anderson, S. P. and Stauber, A. (2000). Central Role of Peroxisome
Proliferator–Activated Receptors in the Actions of Peroxisome Proliferators. Annual Review
of Pharmacology and Toxicology, 40: 491-518.
Cowi and Sweco (2012). Miljøprosjektet DP 2, Miljøtekniske Grunnundersøkelser
Harstad/Narvik lufthavn - Evenes. Avinor AS. Report nr: 168180-280-1. [In Norwegian].
Dalton, T. P., Puga, A. and Shertzer, H. G. (2002). Induction of Cellular Oxidative Stress by
Aryl Hydrocarbon Receptor Activation. Chemico-Biological Interactions, 141: 77-95.
Dawn-Linsley, M., Ekinci, F. J., Ortiz, D., Rogers, E. and Shea, T. B. (2005). Monitoring
Thiobarbituric Acid-Reactive Substances (TBARs) as an Assay for Oxidative Damage in
Page 75
63
Neuronal Cultures and Central Nervous System. Journal of Neuroscience Methods, 141: 219-
222.
De Silva, A. O., Tseng, P. J. and Mabury, S. A. (2009). Toxicokinetics of
Perfluorocarboxylate Isomers in Rainbow Trout. Environmental Toxicology and Chemistry,
28: 330-337.
DeWitt, J. C., Peden-Adams, M. M., Keller, J. M. and Germolec, D. R. (2012).
Immunotoxicity of Perfluorinated Compounds: Recent Developments. Toxicologic Pathology,
40: 300-311.
Ding, G. and Peijnenburg, W. J. (2013). Physicochemical Properties and Aquatic Toxicity of
Poly- and Perfluorinated Compounds. Critical Reviews in Environmental Science and
Technology, 43: 598-678.
Du, Y., Shi, X., Liu, C., Yu, K. and Zhou, B. (2009). Chronic Effects of Water-Borne PFOS
Exposure on Growth, Survival and Hepatotoxicity in Zebrafish: A Partial Life-Cycle Test.
Chemosphere, 74: 723-729.
Elcombe, C. R., Elcombe, B. M., Foster, J. R., Chang, S.-C., Ehresman, D. J., Noker, P. E.
and Butenhoff, J. L. (2012). Evaluation of Hepatic and Thyroid Responses in Male Sprague
Dawley Rats for up to Eighty-Four Days Following Seven Days of Dietary Exposure to
Potassium Perfluorooctanesulfonate. Toxicology, 293: 30-40.
Fair, P. A., Romano, T., Schaefer, A. M., Reif, J. S., Bossart, G. D., Houde, M., Muir, D.,
Adams, J., Rice, C., Hulsey, T. C. and Peden-Adams, M. (2013). Associations Between
Perfluoroalkyl Compounds and Immune and Clinical Chemistry Parameters in Highly
Exposed Bottlenose Dolphins (Tursiops truncatus). Environmental Toxicology and
Chemistry, 32: 736-746.
Falk, S., Failing, K., Georgii, S., Brunn, H. and Stahl, T. (2015). Tissue Specific Uptake and
Elimination of Perfluoroalkyl Acids (PFAAs) in Adult Rainbow Trout (Oncorhynchus
mykiss) After Dietary Exposure. Chemosphere, 129: 150-156.
Feng, M., He, Q., Meng, L., Zhang, X., Sun, P. and Wang, Z. (2015). Evaluation of Single
and Joint Toxicity of Perfluorooctane Sulfonate, Perfluorooctanoic Acid, and Copper to
Carassius auratus Using Oxidative Stress Biomarkers. Aquatic Toxicology, 161: 108-116.
Page 76
64
Filipe, A. F., Markovic, D., Pletterbauer, F., Tisseuil, C., De Wever, A., Schmutz, S., Bonada,
N. and Freyhof, J. (2013). Forecasting Fish Distribution Along Stream Networks: Brown
Trout (Salmo trutta) in Europe. Diversity and Distributions, 19: 1059-1071.
Frost, W. E. and Brown, M. E. (1967). The Trout. London, UK: Collins.
Gallo, V., Leonardi, G., Genser, B., Lopez-Espinosa, M.-J., Frisbee, S. J., Karlsson, L.,
Ducatman, A. M. and Fletcher, T. (2012). Serum Perfluorooctanoate (PFOA) and
Perfluorooctane Sulfonate (PFOS) Concentrations and Liver Function Biomarkers in a
Population with Elevated PFOA Exposure. Environmental Health Perspectives, 120: 655-660.
Giesy, J. P. and Kannan, K. (2001). Global Distribution of Perfluorooctane Sulfonate in
Wildlife. Environmental Science & Technology, 35: 1339-1342.
Giesy, J. P. and Kannan, K. (2002). Peer Reviewed: Perfluorochemical Surfactants in the
Environment. Environmental Science & Technology, 36: 146A-152A.
Goeritz, I., Falk, S., Stahl, T., Schäfers, C. and Schlechtriem, C. (2013). Biomagnification and
Tissue Distribution of Perfluoroalkyl Substances (PFASs) in Market-Size Rainbow Trout
(Oncorhynchus mykiss). Environmental Toxicology and Chemistry, 32: 2078-2088.
Goksøyr, A. and Förlin, L. (1992). The Cytochrome P-450 System in Fish, Aquatic
Toxicology and Environmental Monitoring. Aquatic Toxicology, 22: 287-311.
Hagenaars, A., Meyer, I. J., Herzke, D., Pardo, B. G., Martinez, P., Pabon, M., De Coen, W.
and Knapen, D. (2011). The Search for Alternative Aqueous Film Forming Foams (AFFF)
With a Low Environmental Impact: Physiological and Transcriptomic Effects of Two
Forafac® Fluorosurfactants in Turbot. Aquatic Toxicology, 104: 168-176.
Halliwell, B. and Chirico, S. (1993). Lipid Peroxidation: Its Mechanism, Measurement, and
Significance. The American Journal of Clinical Nutrition, 57: 715S-724S.
Han, X., Snow, T. A., Kemper, R. A. and Jepson, G. W. (2003). Binding of Perfluorooctanoic
Acid to Rat and Human Plasma Proteins. Chemical Research in Toxicology, 16: 775-781.
Han, Z.-X., Zhang, M. and Lv, C.-X. (2011). Toxicokinetic Behaviors and Modes of
Perfluorooctane Sulfonate (PFOS) and Perfluorooctane Acid (PFOA) on Tilapia
(Oreochromis niloticus). African Journal of Biotechnology, 10: 12943-12950.
Page 77
65
Han, Z., Liu, Y., Wu, D., Zhu, Z. and Lü, C. (2012). Immunotoxicity and Hepatotoxicity of
PFOS and PFOA in Tilapia (Oreochromis niloticus). Chinese Journal of Geochemistry, 31:
424-430.
Hellstad, S. (2015). Bioconcentration and Transcriptional Effects of Fire Foam-Related PFAS
on Brown Trout (Salmo Trutta). M.Sc thesis. University of Oslo.
Hoff, P. T., Scheirs, J., Van de Vijver, K., Van Dongen, W., Esmans, E. L., Blust, R. and De
Coen, W. (2004). Biochemical Effect Evaluation of Perfluorooctane Sulfonic Acid-
Contaminated Wood Mice (Apodemus sylvaticus). Environmental Health Perspectives, 112:
681-686.
Hoff, P. T., Van Campenhout, K., Van de Vijver, K., Covaci, A., Bervoets, L., Moens, L.,
Huyskens, G., Goemans, G., Belpaire, C., Blust, R. and De Coen, W. (2005). Perfluorooctane
Sulfonic Acid and Organohalogen Pollutants in Liver of Three Freshwater Fish Species in
Flanders (Belgium): Relationships with Biochemical and Organismal Effects. Environmental
Pollution, 137: 324-333.
Hoff, P. T., Van de Vijver, K., Van Dongen, W., Esmans, E. L., Blust, R. and De Coen, W.
M. (2003b). Perfluorooctane Sulfonic Acid in Bib (Trisopterus luscus) and Plaice
(Pleuronectes platessa) From the Western Scheldt and the Belgian North Sea: Distribution
and Biochemical Effects. Environmental Toxicology and Chemistry, 22: 608-614.
Hoff, P. T., Van Dongen, W., Esmans, E. L., Blust, R. and De Coen, W. M. (2003a).
Evaluation of the Toxicological Effects of Perfluorooctane Sulfonic Acid in the Common
Carp (Cyprinus carpio). Aquatic Toxicology, 62: 349-359.
Hu, W. Y., Jones, P. D., De Coen, W., King, L., Fraker, P., Newsted, J. and Giesy, J. P.
(2003). Alterations in Cell Membrane Properties Caused by Perfluorinated Compounds.
Comparative Biochemistry and Physiology Part C: Toxicology & Pharmacology, 135: 77-88.
Inoue, Y., Hashizume, N., Yakata, N., Murakami, H., Suzuki, Y., Kikushima, E. and Otsuka,
M. (2012). Unique Physicochemical Properties of Perfluorinated Compounds and Their
Bioconcentration in Common Carp Cyprinus carpio L. Archives of Environmental
Contamination and Toxicology, 62: 672-680.
Page 78
66
Jensen, A. A. and Leffers, H. (2008). Emerging Endocrine Disrupters: Perfluoroalkylated
Substances. International Journal of Andrology, 31: 161-169.
Jones, K. C. and de Voogt, P. (1999). Persistent Organic Pollutants (POPs): State of the
Science. Environmental Pollution, 100: 209-221.
Jones, P. D., Hu, W., De Coen, W., Newsted, J. L. and Giesy, J. P. (2003). Binding of
Perfluorinated Fatty Acids to Serum Proteins. Environmental Toxicology and Chemistry, 22:
2639-2649.
Jönsson, E. M., Brandt, I. and Brunström, B. (2002). Gill Filament-Based EROD Assay for
Monitoring Waterborne Dioxin-Like Pollutants in Fish. Environmental Science &
Technology, 36: 3340-3344.
Jönsson, M., Abrahamson, A., Brunström, B., Brandt, I., Ingebrigtsen, K. and Jørgensen, E.
H. (2003). EROD Activity in Gill Filaments of Anadromous and Marine Fish as a Biomarker
of Dioxin-Like Pollutants. Comparative Biochemistry and Physiology Part C: Toxicology &
Pharmacology, 136: 235-243.
Jørgensen, E. H., Celander, M., Goksøyr, A. and Iwata, M. (2001). The Effect of Stress on
Toxicant-Dependent Cytochrome P450 Enzyme Responses in the Arctic Charr (Salvelinus
alpinus). Environmental Toxicology and Chemistry, 20: 2523-2529.
Kannan, K., Corsolini, S., Falandysz, J., Fillmann, G., Kumar, K. S., Loganathan, B. G.,
Mohd, M. A., Olivero, J., Wouwe, N. V., Yang, J. H. and Aldous, K. M. (2004).
Perfluorooctanesulfonate and Related Fluorochemicals in Human Blood from Several
Countries. Environmental Science & Technology, 38: 4489-4495.
Key, B. D., Howell, R. D. and Criddle, C. S. (1998). Defluorination of Organofluorine Sulfur
Compounds by Pseudomonas Sp. Strain D2. Environmental Science & Technology, 32: 2283-
2287.
Kim, W.-K., Lee, S.-K. and Jung, J. (2010). Integrated Assessment of Biomarker Responses
in Common Carp (Cyprinus carpio) Exposed to Perfluorinated Organic Compounds. Journal
of Hazardous Materials, 180: 395-400.
Page 79
67
Kim, W. R., Flamm, S. L., Di Bisceglie, A. M. and Bodenheimer, H. C. (2008). Serum
Activity of Alanine Aminotransferase (ALT) as an Indicator of Health and Disease.
Hepatology, 47: 1363-1370.
Kishi, T. and Arai, M. (2008). Study on the Generation of Perfluorooctane Sulfonate from the
Aqueous Film-Forming Foam. Journal of Hazardous Materials, 159: 81-86.
Kissa, E. (2001). Fluorinated Surfactants and Repellents. Second Edition. New York, USA:
Marcel Dekker Inc.
Klaunig, J. E., Hocevar, B. A. and Kamendulis, L. M. (2012). Mode of Action Analysis of
Perfluorooctanoic Acid (PFOA) Tumorigenicity and Human Relevance. Reproductive
Toxicology, 33: 410-418.
Kottelat, M. and Freyhof, J. (2007). Handbook of European Freshwater Fishes. Cornol,
Switzerland: Publications Kottelat.
Kruskal, W. H. and Wallis, W. A. (1952). Use of Ranks in One-Criterion Variance Analysis.
Journal of the American Statistical Association, 47: 583-621.
Labadie, P. and Chevreuil, M. (2011). Partitioning Behaviour of Perfluorinated Alkyl
Contaminants Between Water, Sediment and Fish in the Orge River (Nearby Paris, France).
Environmental Pollution, 159: 391-397.
Lau, C., Anitole, K., Hodes, C., Lai, D., Pfahles-Hutchens, A. and Seed, J. (2007).
Perfluoroalkyl Acids: A Review of Monitoring and Toxicological Findings. Toxicological
Sciences, 99: 366-394.
Lau, C., Butenhoff, J. L. and Rogers, J. M. (2004). The Developmental Toxicity of
Perfluoroalkyl Acids and Their Derivatives. Toxicology and Applied Pharmacology, 198:
231-241.
Levene, H. (1960). A Robust Approximate Confidence Interval for Components of Variance.
Annals of Mathematical Statistics, 31: 534-535.
Liu, C., Chang, V. W. and Gin, K. Y. (2014a). Oxidative Toxicity of Perfluorinated
Chemicals in Green Mussel and Bioaccumulation Factor Dependent Quantitative Structure–
Activity Relationship. Environmental Toxicology and Chemistry, 33: 2323-2332.
Page 80
68
Liu, C., Gin, K. Y. and Chang, V. W. (2014b). Multi-Biomarker Responses in Green Mussels
Exposed to PFCs: Effects at Molecular, Cellular, and Physiological Levels. Environmental
Science and Pollution Research International, 21: 2785-2794.
Liu, C., Yu, K., Shi, X., Wang, J., Lam, P. K., Wu, R. S. and Zhou, B. (2007). Induction of
Oxidative Stress and Apoptosis by PFOS and PFOA in Primary Cultured Hepatocytes of
Freshwater Tilapia (Oreochromis niloticus). Aquatic Toxicology, 82: 135-143.
Liu, J., Wang, N., Szostek, B., Buck, R. C., Panciroli, P. K., Folsom, P. W., Sulecki, L. M.
and Bellin, C. A. (2010). 6-2 Fluorotelomer Alcohol Aerobic Biodegradation in Soil and
Mixed Bacterial Culture. Chemosphere, 78: 437-444.
Lock, E. A., Mitchell, A. M. and Elcombe, C. R. (1989). Biochemical Mechanisms of
Induction of Hepatic Peroxisome Proliferation. Annual Review of Pharmacology and
Toxicology, 29: 145-163.
Lowry, O. H., Rosebrough, N. J., Farr, A. L. and Randall, R. J. (1951). Protein Measurement
With the Folin Phenol Reagent. Journal of Biological Chemistry, 193: 265-275.
Luckenbach, T., Fischer, S. and Sturm, A. (2014). Current Advances on ABC Drug
Transporters in Fish. Comparative Biochemistry and Physiology Part C: Toxicology &
Pharmacology, 165: 28-52.
Luebker, D. J., Hansen, K. J., Bass, N. M., Butenhoff, J. L. and Seacat, A. M. (2002).
Interactions of Flurochemicals with Rat Liver Fatty Acid-Binding Protein. Toxicology, 176:
175-185.
Løland, B. (2014). Fate and Transport of PFCs in a Peat Bog Environment. M.Sc thesis.
University of Oslo.
Martin, J. W., Mabury, S. A., Solomon, K. R. and Muir, D. C. (2003a). Bioconcentration and
Tissue Distribution of Perfluorinated Acids in Rainbow Trout (Oncorhynchus mykiss).
Environmental Toxicology and Chemistry, 22: 196-204.
Martin, J. W., Mabury, S. A., Solomon, K. R. and Muir, D. C. (2003b). Dietary Accumulation
of Perfluorinated Acids in Juvenile Rainbow Trout (Oncorhynchus mykiss). Environmental
Toxicology and Chemistry, 22: 189-195.
Page 81
69
McComb, R. B., Bond, L. W., Burnett, R. W., Keech, R. C. and Bowers, G. N. (1976).
Determination of the Molar Absorptivity of NADH. Clinical Chemistry, 22: 141-150.
Mommsen, T. P. and Walsh, P. J. (1988). Vitellogenesis and Oocyte Assembly. Fish
Physiology, 11A: 347-406.
Moody, C. A. and Field, J. A. (2000). Perfluorinated Surfactants and the Environmental
Implications of Their Use in Fire-Fighting Foams. Environmental Science & Technology, 34:
3864-3870.
Moody, C. A., Hebert, G. N., Strauss, S. H. and Field, J. A. (2003). Occurrence and
Persistence of Perfluorooctanesulfonate and Other Perfluorinated Surfactants in Groundwater
at a Fire-Training Area at Wurtsmith Air Force Base, Mickigan, USA. Journal of
Environmental Monitoring, 5: 341-345.
Moody, C. A., Martin, J. W., Kwan, W. C., Muir, D. C. and Mabury, S. A. (2002).
Monitoring Perfluorinated Surfactants in Biota and Surface Water Samples Following an
Accidental Release of Fire-Fighting Foam into Etobicoke Creek. Environmental Science &
Technology, 36: 545-551.
Muir, D. C. and de Wit, C. A. (2010). Trends of Legacy and New Persistent Organic
Pollutants in the Circumpolar Arctic: Overview, Conclusions, and Recommendations. Science
of The Total Environment, 408: 3044-3051.
Munyemera, I. (2014). Combined Effects of Perfluorooctane Sulfonic Acid (PFOS) and
Carbon Dioxide (CO2) on Oxidative Stress Responses in the Gill of Atlantic Cod (Gadus
morhua). M.Sc thesis. Norwegian University of Science and Technology (NTNU).
Narimatsu, S., Nakanishi, R., Hanioka, N., Saito, K. and Kataoka, H. (2011). Characterization
of Inhibitory Effects of Perfluorooctane Sulfonate on Human Hepatic Cytochrome P450
Isoenzymes: Focusing on CYP2A6. Chemico-Biological Interactions, 194: 120-126.
Newman, M. C. and Clements, W. H. (2008). Ecotoxicology, A Comprehensive Treatment.
California, USA: CRC Press.
Ng, C. A. and Hungerbühler, K. (2013). Bioconcentration of Perfluorinated Alkyl Acids: How
Important Is Specific Binding? Environmental Science & Technology, 47: 7214-7223.
Page 82
70
Norconsult and Sweco (2015). Harstad/Narvik Lufthavn Evenes, Undersøkelser av PFAS i
Jord, Vann og Biota med Risikovurdering. [Online]. Avinor AS. [12.05.2015]. Available
from: https://avinor.no/globalassets/_konsern/miljo-lokal/miljorapporter/pfos-rapport-
harstad-narvik-lufthavn-april-2015.pdf. [In Norwegian].
Oakes, K. D., Benskin, J. P., Martin, J. W., Ings, J. S., Heinrichs, J. Y., Dixon, D. G. and
Servos, M. R. (2010). Biomonitoring of Perfluorochemicals and Toxicity to the Downstream
Fish Community of Etobicoke Creek Following Deployment of Aqueous Film-Forming
Foam. Aquatic Toxicology, 98: 120-129.
Oakes, K. D., Sibley, P. K., Martin, J. W., Maclean, D. D., Solomon, K. R., Mabury, S. A.
and Van Der Kraak, G. J. (2005). Short-Term Exposures of Fish to Perfluorooctane Sulfonate:
Acute Effects on Fatty Acyl-CoA Oxidase Activity, Oxidative Stress, and Circulating Sex
Steroids. Environmental Toxicology and Chemistry, 24: 1172-1181.
Oakes, K. D., Sibley, P. K., Solomon, K. R., Mabury, S. A. and Van Der Kraak, G. J. (2004).
Impact of Perfluorooctanoic Acid on Fathead Minnow (Pimephales promelas) Fatty Acyl-Coa
Oxidase Activity, Circulating Steroids, and Reproduction in Outdoor Microcosms.
Environmental Toxicology and Chemistry, 23: 1912-1919.
Ohkawa, H., Ohishi, N. and Yagi, K. (1979). Assay for Lipid Peroxides in Animal Tissues by
Thiobarbituric Acid Reaction. Analytical Biochemistry, 95: 351-358.
Olsen, G. W., Burris, J. M., Ehresman, D. J., Froehlich, J. W., Seacat, A. M., Butenhoff, J. L.
and Zobel, L. R. (2007). Half-Life of Serum Elimination of Perfluorooctanesulfonate,
Perfluorohexanesulfonate, and Perfluorooctanoate in Retired Fluorochemical Production
Workers. Environmental Health Perspectives, 115: 1298-1305.
Pabon, M. and Corpart, J. M. (2002). Fluorinated Surfactants: Synthesis, Properties, Effluent
Treatment. Journal of Fluorine Chemistry, 114: 149-156.
Paul, A. G., Jones, K. C. and Sweetman, A. J. (2009). A First Global Production, Emission,
and Environmental Inventory for Perfluorooctane Sulfonate. Environmental Science &
Technology, 43: 386-392.
Peakall, D. B. and Walker, C. H. (1994). The Role of Biomarkers in Environmental
Assessment (3), Vertebrates. Ecotoxicology, 3: 173-179.
Page 83
71
Prevedouros, K., Cousins, I. T., Buck, R. C. and Korzeniowski, S. H. (2006). Sources, Fate
and Transport of Perfluorocarboxylates. Environmental Science & Technology, 40: 32-44.
Qin, P., Liu, R., Pan, X., Fang, X. and Mou, Y. (2010). Impact of Carbon Chain Length on
Binding of Perfluoroalkyl Acids to Bovine Serum Albumin Determined by Spectroscopic
Methods. Journal of Agricultural and Food Chemistry, 58: 5561-5567.
Reichling, J. and Kaplan, M. (1988). Clinical Use of Serum Enzymes in Liver Disease.
Digestive Diseases and Sciences, 33: 1601-1614.
Remde, A. and Debus, R. (1996). Biodegradability of Fluorinated Surfactants Under Aerobic
and Anaerobic Conditions. Chemosphere, 32: 1563-1574.
Renner, R. (2001). Growing Concern Over Perfluorinated Chemicals. Environmental Science
& Technology, 35: 154-160.
Sakurai, T., Kobayashi, J., Kinoshita, K., Ito, N., Serizawa, S., Shiraishi, H., Lee, J.-H.,
Horiguchi, T., Maki, H., Mizukawa, K., Imaizumi, Y., Kawai, T. and Suzuki, N. (2013).
Transfer Kinetics of Perfluorooctane Sulfonate from Water and Sediment to a Marine Benthic
Fish, the Marbled Flounder (Pseudopleuronectes yokohamae). Environmental Toxicology and
Chemistry, 32: 2009-2017.
Seacat, A. M., Thomford, P. J., Hansen, K. J., Clemen, L. A., Eldridge, S. R., Elcombe, C. R.
and Butenhoff, J. L. (2003). Sub-Chronic Dietary Toxicity of Potassium
Perfluorooctanesulfonate in Rats. Toxicology, 183: 117-131.
Seacat, A. M., Thomford, P. J., Hansen, K. J., Olsen, G. W., Case, M. T. and Butenhoff, J. L.
(2002). Subchronic Toxicity Studies on Perfluorooctanesulfonate Potassium Salt in
Cynomolgus Monkeys. Toxicological Sciences, 68: 249-264.
Shi, X., Du, Y., Lam, P. K., Wu, R. S. and Zhou, B. (2008). Developmental Toxicity and
Alteration of Gene Expression in Zebrafish Embryos Exposed to PFOS. Toxicology and
Applied Pharmacology, 230: 23-32.
Shi, X. and Zhou, B. (2010). The Role of Nrf2 and MAPK Pathways in PFOS-Induced
Oxidative Stress in Zebrafish Embryos. Toxicological Sciences, 115: 391-400.
Page 84
72
Slotkin, T. A., MacKillop, E. A., Melnick, R. L., Thayer, K. A. and Seidler, F. J. (2008).
Developmental Neurotoxicity of Perfluorinated Chemicals Modeled in Vitro. Environmental
Health Perspectives, 116: 716-722.
Small, G. M., Burdett, K. and Connock, M. J. (1985). A Sensitive Spectrophotometric Assay
for Peroxisomal Acyl-CoA Oxidase. Biochemical Journal, 227: 205-210.
Sparks, T. H., Scott, W. A. and Clarke, R. T. (1999). Traditional Multivariate Techniques:
Potential for Use in Ecotoxicology. Environmental Toxicology and Chemistry, 18: 128-137.
Sundström, M., Chang, S.-C., Noker, P. E., Gorman, G. S., Hart, J. A., Ehresman, D. J.,
Bergman, Å. and Butenhoff, J. L. (2012). Comparative Pharmacokinetics of
Perfluorohexanesulfonate (PFHxS) in Rats, Mice, and Monkeys. Reproductive Toxicology,
33: 441-451.
Sweco (2012). Miljøprosjektet - DP 2, Miljøtekniske Grunnundersøkelser ved Avinors
Lufthavner. Avinor AS. Report nr: 168180-1. [In Norwegian].
Tarazona, J. V., Rodríguez, C., Alonso, E., Sáez, M., González, F., San Andrés, M. D.,
Jiménez, B. and San Andrés, M. I. (2015). Toxicokinetics of Perfluorooctane Sulfonate in
Birds under Environmentally Realistic Exposure Conditions and Development of a Kinetic
Predictive Model. Toxicology Letters, 232: 363-368.
Tukey, J. W. (1949). Comparing Individual Means in the Analysis of Variance. Biometrics, 5:
99-114.
UNEP (2009). Report of the Conference of the Parties of the Stockholm Convention on
Persistent Organic Pollutants on the Work of Its Fourth Meeting. [Online]. United Nations
Environment Programme. Stockholm Convention on Persistent Organic Pollutants.
[16.04.2015]. Available from:
http://www.chem.unep.ch/ddt/documents/SC_COP4_report_full.pdf.
Valenzuela, A. (1991). The Biological Significance of Malondialdehyde Determination in the
Assessment of Tissue Oxidative Stress. Life Sciences, 48: 301-309.
Page 85
73
van der Oost, R., Beyer, J. and Vermeulen, N. P. (2003). Fish Bioaccumulation and
Biomarkers in Environmental Risk Assessment: a Review. Environmental Toxicology and
Pharmacology, 13: 57-149.
Watanabe, M. X., Jones, S. P., Iwata, H., Kim, E.-Y. and Kennedy, S. W. (2009). Effects of
Co-Exposure to 2,3,7,8-Tetrachlorodibenzo-p-Dioxin and Perfluorooctane Sulfonate or
Perfluorooctanoic Acid on Expression of Cytochrome P450 Isoforms in Chicken (Gallus
gallus) Embryo Hepatocyte Cultures. Comparative Biochemistry and Physiology Part C:
Toxicology & Pharmacology, 149: 605-612.
Welch, B. L. (1938). The Significance of the Difference Between Two Means When the
Population Variances are Unequal. Biometrika, 29: 350-362.
Whitlock, M. C. and Schluter, D. (2009). The Analysis of Biological Data. Colorado, USA:
Roberts and Company Publishers.
Whyte, J. J., Jung, R. E., Schmitt, C. J. and Tillitt, D. E. (2000). Ethoxyresorufin-O-
Deethylase (EROD) Activity in Fish as a Biomarker of Chemical Exposure. Critical Reviews
in Toxicology, 30: 347-570.
Yeung, L. Y., Loi, E. H., Wong, V. Y., Guruge, K., Yamanaka, N., Tanimura, N., Hasegawa,
J., Yamashita, N., Miyazaki, S. and Lam, P. S. (2009). Biochemical Responses and
Accumulation Properties of Long-Chain Perfluorinated Compounds (PFOS/PFDA/PFOA) in
Juvenile Chickens (Gallus gallus). Archives of Environmental Contamination and Toxicology,
57: 377-386.
Ziegenhorn, J., Senn, M. and Bücher, T. (1976). Molar Absorptivities of Beta-NADH and
Beta-NADPH. Clinical Chemistry, 22: 151-160.
Page 86
74
8. Appendix
Appendix 1: PFASs in trout
Appendix 2: PFASs in water
Appendix 3: Oxygen, temperature and nitrite
Appendix 4: Biomarker responses
Appendix 5: Buffers and solutions
Appendix 6: Chemicals and lab equipment
Page 87
75
Appendix 1: PFASs in trout
Table A1. Range (min-max) and median concentrations (µg/kg) of perfluorooctane sulfonate (PFOS)
detected in brown trout from different treatments (“control”, “low” and “high”) collected at week zero
(reference), one and three during exposure, and week one (4) and ten (13) after ended exposure to
PFASs. (n=5 if not otherwise stated).
Week Control Low High
Range Median Range Median Range Median
0 0.120 - 0.671 0.350 0.0702 - 0.185 0.156 (n=4*) 0.0925 - 0.226 0.138
1 0.500 - 376 0.700 0.300 - 445 202 2.70 - 43900 21900
3 3.10 - 585 3.95 (n=4) 1.00 - 2730 594 23400 - 84000 69400
4 0.674 - 4.34 2.43 714 - 13700 1000 19800 - 104000 51700
13 1.17 - 2.19 1.455 (n=4) 260 - 588 343 64200 - 168000 123000 (n=3)
*The concentrations of one fish were measured to be below the detection limit (0.0643 µg/kg).
Table A2. Range (min-max) and median detection limits (µg/kg) of Perfluoropentanoic acid (PFPeA),
Perfluorohexanoic acid (PFHxA) and Perfluorooctanoic acid (PFOA) in brown trout from different
treatments (“control”, “low” and “high”) collected at week zero (reference), one and three during
exposure, and week one (4) and ten (13) after ended exposure to PFASs. (n=5 if not otherwise
stated).
Week Control Low High
Range Median Range Median Range Median
0 0.0507 - 0.0661 0.0602 0.0545 - 0.0643 0.0601 0.0582 - 0.0702 0.0626
1 0.050 - 0.600 0.060 0.060 - 6.80 0.60 0.07 - 62.2 11.7
3 0.060 - 0.600 0.060 (n=4) 0.060 - 6.70 5.70 50.5 - 118 105
4 0.0547 - 0.0641 0.0593 0.541 - 61.7 1.14 46.3 - 66.9 63.7
13 0.0449 - 0.0552 0.0489 (n=4) 0.238 - 0.525 0.487 46.8 - 50.5 47.0 (n=3)
Table A3. Range (min-max) and median detection limits (µg/kg) of 6:2 fluorotelomer sulfonate (FTS)
in brown trout from different treatments (“control”, “low” and “high”) collected at week zero (reference),
one and three during exposure, and week one (4) and ten (13) after ended exposure to PFASs. (n=5 if
not otherwise stated).
Week Control Low High
Range Median Range Median Range Median
0 0.0761 - 0.0991 0.094 0.0818 - 0.0965 0.0901 0.0873 - 0.105 0.0918
1 0.08 - 1.0 0.1 0.09 - 10.2 0.9 0.1 - 93.3 17.5
3 0.09 - 0.9 0.09 (n=4) 0.09 - 10.1 8.5 75.7 - 177 157
4 0.082 - 0.0961 0.0889 0.811 - 90.1 1.710 69.4 - 100 95.5
13 0.0674 - 0.0828 0.0734 (n=4) 0.357 - 0.788 0.731 70.2 - 75.8 70.6 (n=3)
Page 88
76
Table A4. Concentration (µg/kg) of Perfluorohexane sulfonate (PFHxS) detected in brown trout from different treatments (“control”, “low” and “high”) collected
at week zero (reference), one and three during exposure, and week one (4) and ten (13) after ended exposure to PFASs. Samples marked with < are not
detected. Concentrations after < are detection limits (varying with sample volume and sensitivity of analysis). (NA = not available).
Week Control Low High
0 <0,090 <0,088 <0,076 <0,094 <0,099 <0,085 <0,094 <0,097 <0,082 <0,090 <0,087 <0,088 <0,094 <0,105 <0,092
1 0,137 <0,080 <0,100 <0,100 7,00 16,2 5,30 5,80 <0,09 5,60 <0,10 187 848 557 549
3 NA 0,10 0,10 <0,090 13,9 31,9 11,2 9,90 11,2 <0,09 705 650 686 799 705
4 <0,089 <0,082 <0,084 <0,095 <0,096 165 6,33 120 <90,1 8,55 408 446 453 1230 496
13 NA <0,078 <0,083 <0,069 <0,067 <0,731 <0,746 0,486 <0,788 0,725 <70,6 <75,8 NA NA <70,2
Page 89
77
Appendix 2: PFASs in water
Table A5. 6:2 fluorotelomer sulfonate (FTS), Perfluoropentanoic acid (PFPeA), Perfluorohexane sulfonate (PFHxS), Perfluorooctane sulfonate (PFOS),
Perfluorohexanoic acid (PFHxA) and Perfluorooctanoic acid (PFOA) in water sampled at different times during and after exposure to PFASs (exposure ended
at day 20). Samples were collected from one randomly chosen aquarium of every treatment at each day. The aquaria sampled denoted day 27 were the only
aquaria sampled twice. Samples marked with < are not detected. Concentrations after < are detection limits (varying with sample volume and sensitivity of
analysis).
Time (Days) Treatment 6:2 FTS (µg/L) PFPeA (µg/L) PFHxS (µg/L) PFOS (µg/L) PFHxA (µg/L) PFOA (µg/L)
3 High 30.4 36.4 54.2 38.1 23.1 8.40
3 Low 1.50 1.20 1.80 3.30 0.70 0.400
3 Control < 0.0200 < 0.0100 < 0.0200 < 0.0100 < 0.0100 < 0.0100
6 High 108 57.2 125 284 37.8 27.5
6 Low 2.00 1.00 2.10 14.8 0.600 0.500
6 Control < 0.0200 < 0.0100 < 0.0200 < 0.0100 < 0.0100 < 0.0100
10 High 114 57.6 126 362 38.7 28.3
10 Low 0.400 0.70 0.500 0.500 0.400 0.0900
10 Control < 0.0200 < 0.0100 < 0.0200 < 0.0100 < 0.0100 < 0.0100
15 High 72.2 107 109 133 67.4 18.5
15 Low 1.00 0.500 1.00 2.90 0.300 0.20
15 Control < 0.0200 < 0.0100 < 0.0200 < 0.0100 < 0.0100 < 0.0100
20 High 121 55.4 122 413 37.0 28.8
20 Low 1.40 0.500 1.30 4.80 0.400 0.300
20 Control < 0.0200 < 0.0100 < 0.0200 < 0.0100 < 0.0100 < 0.0100
27 High < 0.800 < 0.500 < 0.800 < 0.500 < 0.500 < 0.500
27 Low < 0.0200 < 0.0100 < 0.0200 < 0.0100 < 0.0100 < 0.0100
27 Control < 0.0200 < 0.0100 < 0.0200 < 0.0100 < 0.0100 < 0.0100
Page 90
78
Table A6. Perfluorobutane sulfonate (PFBS) and Perfluoroheptanoic acid (PFHpA) in water sampled
at different times during and after exposure to PFASs (exposure ended at day 20). Samples were
collected from one randomly chosen aquarium of every treatment at each day. The aquaria denoted
day 27 were the only aquaria sampled twice. Samples marked with < are not detected. Concentrations
after < are detection limits (varying with sample volume and sensitivity of analysis).
Time (Days) Treatment PFBS (µg/L) PFHpA (µg/L)
3 High < 0.8 0.9
3 Low < 0.02 0.03
3 Control < 0.02 < 0.01
6 High < 0.8 1.6
6 Low < 0.02 0.02
6 Control < 0.02 < 0.01
10 High < 0.8 1.6
10 Low < 0.02 0.01
10 Control < 0.02 < 0.01
15 High 0.9 2.0
15 Low < 0.02 0.01
15 Control < 0.02 < 0.01
20 High < 0.8 1.5
20 Low 0.02 0.01
20 Control < 0.02 < 0.01
27 High < 0.8 < 0.5
27 Low < 0.02 < 0.01
27 Control < 0.02 < 0.01
Page 91
79
Appendix 3: Oxygen, temperature and nitrite
Table A7. Oxygen saturation (%) in water from all experiment aquaria (“control”, “low” and “high”
treatments) measured at different days after started exposure to PFASs. (Exposure ended at day 20).
Day Control exposure Low exposure High exposure
Range Median Range Median Range Median
3 89.4 - 95.1 92.8 91.4 - 96.2 94.1 84.3 - 95.2 93.3
7 90.8 - 97.0 95.1 93.3 - 95.8 95.0 91.2 - 95.2 93.9
10 82.8 - 95.7 90.6 93.4 - 96.1 95.8 89.6 - 97.7 96.4
14 89.9 - 96.0 93.4 95.4 - 97.3 95.8 92.8 - 95.8 95.6
17 93.0 - 96.0 95.0 92.7 - 95.7 94.4 93.0 - 97.1 95.0
21 89.1 - 98.0 95.1 96.6 - 97.4 97.0 93.0 - 97.5 95.5
24 90.9 - 96.7 95.1 93.5 - 96.0 95.8 92.8 - 95.5 94.2
28 93.0 - 99.1 98.0 96.0 - 98.0 97.3 95.5 - 97.8 97.4
31 94.5 - 97.6 96.4 95.9 - 96.6 96.1 95.2 - 97.2 96.4
35 92.6 - 97.6 94.8 94.1 - 96.8 94.6 94.6 - 96.9 96.2
38 93.7 - 96.2 95.9 93.9 - 95.4 95.2 94.2 - 94.7 94.3
42 95.4 - 98.9 97.3 94.8 - 99.1 95.1 95.8 - 98.2 96.9
45 93.2 - 96.6 95.0 95.1 -96.4 95.8 93.9 - 96.2 95.4
49 93.8 - 96.0 95.5 94.8 - 95.9 95.2 94.1 - 95.7 94.9
52 95.5 - 98.3 97.5 96.2 - 98.8 97.2 96.9 - 99.5 97.5
56 95.4 - 98.4 97.4 95.9 - 98.1 97.9 96.7 - 97.6 97.3
59 95.7 - 97.5 97.0 94.8 - 97.8 97.2 96.8 - 97.9 97.2
63 93.7 - 99.3 96.7 96.6 - 98.2 97.3 95.1 - 98.9 98.0
66 93.0 - 98.4 97.4 95.0 - 97.8 97.2 95.8 - 97.9 97.6
70 92.7 - 97.7 95.6 94.3 - 96.7 96.2 94.4 - 97.0 95.9
73 94.4 - 96.6 95.9 94.4 -97.9 96.2 94.4 - 97.1 96.6
77 95.8 - 98.4 96.3 95.9 - 97.9 96.3 96.5 - 97.8 97.1
80 94.9 - 96.9 95.3 95.5 - 97.4 97.1 95.5 - 97.8 96.6
84 94.8 - 100 97.2 97.0 - 98.7 98.3 95.8 - 99.4 98.1
87 88.1 - 97.8 95.3 93.2 - 96.4 95.2 89.3 - 96.8 95.2
Page 92
80
Table A8. Temperature (°C) in water from all experiment aquaria (“control”, “low” and “high”
treatments) measured at different days after started exposure to PFASs. (Exposure ended at day 20).
Day Control exposure Low exposure High exposure
Range Median Range Median Range Median
0 8.1 - 9.7 8.8 7.8 - 9.3 8.1 8.1 - 9.7 8.2
3 8.1 - 9.6 8.7 7.8 - 9.3 8.2 7.8 - 9.5 8.2
7 8.4 - 10 8.9 8.3 - 9.5 8.3 8.2 - 9.9 8.8
10 8.2 - 10 9.1 8.1 - 9.8 8.6 8.1 - 9.9 8.9
14 8.2 - 9.9 8.8 8.1 - 9.3 8.2 8.2 - 9.7 8.6
17 7.8 - 9.6 8.6 7.7 - 9.1 8.0 7.8 - 9.3 8.2
21 7.7 - 9.5 8.7 7.6 - 8.8 8.4 7.6 - 9.3 8.6
24 7.5 - 8.6 8.1 7.4 - 8.2 7.5 7.5 - 8.6 7.8
28 8.6 - 10 8.7 8.4 -9.7 8.7 8.5 - 10 8.7
31 8.1 - 9.5 8.6 8.0 - 9.1 8.1 8.1 - 9.4 8.2
35 8.3 - 9.6 8.9 8.1 - 9.5 8.3 8.2 - 9.7 8.6
38 7.7 - 9.2 8.7 7.6 - 9.1 8.3 7.9 - 9.3 8.5
42 8.0 - 9.1 8.7 7.7 - 8.9 8.1 8.1 - 9.2 8.3
45 7.8 - 9.0 8.6 7.7 - 8.8 8.1 7.8 - 9.0 8.1
49 7.6 - 8.8 8.3 7.5 - 8.7 7.8 7.7 - 9.0 7.9
52 7.8 - 9.2 8.6 7.7 - 8.8 7.9 7.8 - 9.2 8.2
56 7.7 - 9.1 8.5 7.6 - 8.6 8.0 7.8 - 9.1 8.2
59 7.7 - 9.3 8.7 7.8 - 8.8 8.2 8.1 - 9.2 8.3
63 8.1 - 9.7 8.8 8.1 - 9.0 8.3 8.3 - 9.7 8.6
66 8.1 - 9.8 9.0 8.1 - 9.1 8.5 8.2 - 9.7 8.8
70 8.8 - 10 9.6 8.7 - 9.8 9.0 8.9 - 10 9.5
73 9.0 - 11 9.6 8.8 - 9.9 9.2 9.1 - 11 9.5
77 8.9 - 11 9.6 8.6 - 9.2 8.8 9.1 - 10 9.4
80 9.3 - 11 10 9.1 - 10 9.6 9.2 - 11 9.8
84 9.6 - 11 10 9.3 - 10 9.7 9.6 - 11 10
87 9.7 - 12 10 9.4 - 11 9.9 9.7 - 11 10
Table A9. Nitrite levels (mg/L) in water from all experiment aquaria (“control”, “low” and “high”
treatments) measured at different times after started exposure to PFASs. (Exposure ended at day 20).
Day Control exposure Low exposure High exposure
-1 <0.3 <0.3 <0.3 <0.3 <0.3 <0.3 <0.3 <0.3 <0.3 <0.3 <0.3 <0.3 <0.3 <0.3 <0.3
15 <0.3 <0.3 <0.3 <0.3 <0.3 <0.3 <0.3 <0.3 <0.3 <0.3 <0.3 <0.3 <0.3 <0.3 <0.3
27 <0.3 <0.3 <0.3 <0.3 <0.3 <0.3 <0.3 <0.3 <0.3 <0.3 <0.3 <0.3 <0.3 <0.3 <0.3
91 <0.3 0.3 0.3 0.3 <0.3 <0.3 <0.3 0.3 <0.3 <0.3 <0.3 0.3 <0.3 0.3 <0.3
Page 93
81
Appendix 4: Biomarker responses
Table A10. Ethoxyresorufin O-deethylase activity in gills (EROD, fmol resorufin/filament/minute),
thiobarbituric acid reactive substances in gills and liver (TBARS, nmol/mg protein), peroxisomal acyl-
CoA oxidase activity in liver (AOX, mUnits/mg protein) and alanine aminotransferase activity in plasma
(ALAT, Units/L) in trout from the “control”, “low” and “high” treatments measured at week zero
(reference), one and three of exposure, and week ten (marked 13) of depuration to a mixture of
PFASs. EROD activities set to zero were originally -0.01879, -0.01052 and -0.02156, respectively.
(NA: not available).
Time Treatment EROD gills TBARS gills TBARS liver AOX liver ALAT plasma
0 Control 0.00260885 1.13851113 0.20194223 0.03802873 NA
0 Control 0.00000000 0.83060020 0.28602793 0.04577241 52.9600144
0 Control 0.00000000 1.13741842 0.16616235 0.02683826 10.6899937
0 Control 0.31309896 0.91132764 0.17673278 0.05175291 28.3787687
0 Control 0.19805142 1.10976604 0.15312374 0.07358372 6.35961880
0 Low 0.02245230 0.82540592 0.14989764 0.03334642 66.0238481
0 Low 0.19797630 0.74392726 0.19974322 0.04422010 8.14509624
0 Low 0.33532298 1.85689201 0.22397965 0.03334648 21.6796991
0 Low 0.35276633 0.83122466 0.15595951 0.06152993 19.6705661
0 Low 0.24832119 2.21097705 0.19850651 0.02664844 15.1109812
0 High 0.03999504 2.11341962 0.20036263 0.04255040 5.75380565
0 High 0.08688480 1.05332144 0.22415705 0.03983613 14.3004766
0 High 0.05501449 0.94290619 0.15912421 0.04207595 10.1988930
0 High 0.30900628 0.81778287 0.22940776 0.05388709 11.4283701
0 High 0.18996034 1.48314215 0.15631727 0.04501129 20.5794819
1 Control 0.25033283 0.60674981 0.25105204 0.04313131 NA
1 Control 0.16307248 1.29202100 0.23907976 0.04823239 39.3784559
1 Control 0.15813418 0.68812935 0.17759052 0.05087089 12.1593899
1 Control 0.13508466 0.84656337 0.17047954 0.02591106 40.0247882
1 Control 0.00231710 1.04805981 0.21573067 0.05539412 19.8800850
1 Low 0.26987917 2.07510473 0.29728526 0.04307637 140.829061
1 Low 0.32753924 0.89608529 0.15140925 0.05344361 8.97205544
1 Low 0.14017014 0.61912165 0.17773404 0.04708033 10.3845983
1 Low 0.28440598 0.46775390 0.14347594 0.04437794 8.41563313
1 Low 0.14388856 0.75371694 0.21100204 0.10766497 NA
1 High 0.03433559 0.49320847 0.18353679 0.09792152 26.7152124
1 High 0.17720089 0.40479256 0.16343225 0.05347794 10.2933434
1 High 0.00000000 1.36393406 0.15354941 0.02481166 53.2761526
1 High 0.18515225 0.87752062 0.17475211 0.03428549 21.3211798
1 High 0.22182964 0.89138665 0.17770672 0.08024332 16.4422963
3 Control 0.30026344 0.71492428 0.16151516 0.04908315 32.0290060
3 Control 0.23044336 0.72724856 0.19298565 0.03397260 40.1783566
3 Control 0.44574243 0.61988741 0.18297248 0.04352503 16.7328636
3 Control 0.37274497 1.11745257 0.22104684 0.01842558 21.9339167
3 Control 0.66906652 0.54636268 0.25385367 0.08704870 42.1787062
Page 94
82
3 Low 0.10824293 0.58244668 0.17822035 0.07701986 23.1485253
3 Low 0.30144058 1.21292124 0.14962283 0.04411113 16.0036640
3 Low 0.13090254 1.26362948 0.19959934 0.06276030 13.7955581
3 Low 0.20221758 1.46536677 0.15644860 0.05217358 64.3427723
3 Low 0.13314134 0.56361736 0.16007343 0.05607534 22.0321827
3 High 0.41436920 0.89711237 0.20180533 0.04615647 17.4958773
3 High 0.58577610 1.13291162 0.18540479 0.03946956 19.7635796
3 High 1.03159183 0.47716961 0.22290043 0.06363887 8.98843065
3 High 0.25259194 0.68807430 0.21631316 0.05669787 8.69518765
3 High 0.64405197 0.58207753 0.16288410 0.05020222 34.5926289
13 Control 0.53931440 1.04928058 0.16639285 0.04690759 12.0209709
13 Control 0.32825067 0.47452228 0.10174258 0.04097429 50.1893832
13 Control 0.21653895 1.04559859 0.16048578 0.04138652 14.9909608
13 Control 0.47937797 0.51327968 0.16689612 0.04285402 32.7593845
13 Control 0.70067771 0.41835795 0.18967931 0.03156717 33.6573004
13 Low 0.19994901 0.72212924 0.13715339 0.05407215 19.7706449
13 Low 1.17988209 0.58688793 0.14149760 0.03027108 26.4400937
13 Low 0.70343349 0.91626081 0.16499103 0.03793846 11.9875519
13 Low 0.60043631 0.44039053 0.13205152 0.11370235 8.90968574
13 Low 0.40423920 0.39862303 0.15104121 0.06225979 9.49213999
13 High 0.22591420 0.74981780 0.16795854 0.04106019 178.980317
13 High 2.99999789 0.44430519 0.34594636 0.03949995 28.5902206
13 High 1.07755247 0.50530025 0.16387666 0.0453046 23.4935222
13 High 0.89239931 0.48652728 0.15521159 0.04147473 46.9059446
13 High 1.02860044 0.96740499 0.26752743 0.04239122 13.3442976
Page 95
83
Appendix 5: Buffers and solutions
EROD
Hepes-Cortland buffer,
pH 7.7
(adjust pH if necessary).
KCl 0.38 g/L
NaCl 7.74 g/L
MgSO4*7H2O 0.23 g/L
CaCl2 0.17 g/L
NaH2PO4*H2O 0.33 g/L
Hepes 1.43 g/L
Glucose 1.00 g/L
Reaction buffer
Hepes-Cortland buffer 35 mL
Dicumarol (10 mM) 35 µL
7-ethoxyresorufin (2.59 mM)
dissolved in DMSO 13.7 µL
TBARS
K-PO4 buffer (0.1 M), pH 7.4
(adjust pH if necessary).
KH2PO4 2.59 g/L
K2HPO4*3H2O 18.48 g/L
Homogenization buffer,
pH 7.4, in each cryo-tube.
K-PO4 buffer 0.1 M, pH 7.4 200 µL
Triton X-100 0.1%
Butylated hydroxytoluene
dissolved in methanol 18.15 nM
Trichloroacetic acid (0.73 M) Trichloroacetic acid 12 g
Distilled H2O 100 mL
Thiobarbituric acid (0.051 M)
(use ultra-sound, heating and
mixing by magnets to solve).
Thiobarbituric acid 0.73 g
Distilled H2O 100 mL
Tris buffer (60 mM), pH 7.4,
containing 0.1 mM
diethylenetriaminepentaacetic
acid
Trizma HCl 7.932 g/L
Trizma base 1.164 g/L
diethylenetriaminepentaacetic
acid 0.0393 g/L
AOX
TVBE homogenization buffer,
pH 7.6
NaHCO3 84 mg/L
Na-EDTA 10 mL/L
Ethanol 1 mL/L
10% Trition X-100 1 mL/L
2’7’-dichlorofluorescein
diacetate (2.6 mM)
2’7’-dichlorofluorescein diacetate 50 mg
dimetylformamide 3.846 mL
NaOH (0.01 M) 34.62 mL
Reaction medium (for 100 mL)
K-PO4 buffer (0.5 M), pH 7.4 2 mL
2’7’-dichlorofluorescein diacetate
(2.6 mM) 2 mL
Horseradish peroxidase (1200
Units/mL) 1 mL
Sodium azide (4 M) 1 mL
10% Trition X-100 200 µL
Distilled H2O 93.8 mL
Palmitoyl-CoA (3 mM) Palmitoyl-CoA 30.2 mg
Distilled H2O 10 mL
Page 96
84
Protein
Tris buffer (0.1 M), pH 8.0 at 4
°C (adjust pH if necessary).
Trizma HCl 13.22 g/L
Trizma base 1.94 g/L
ALAT
Tris buffer (0.11 M), pH 7.8
(adjust pH if necessary).
Trizma HCl 11.704 g/L
Trizma base 4.334 g/L
Tris/L-alanine (1260 mM), pH
7.8 (adjust pH with 1 M HCl).
Trizma base 1.33 g
L-alanine 11.225 g
Distilled H2O 100 mL
Tris/D-alanine (1260 mM), pH
7.8 (adjust pH with 1 M HCl).
Trizma base 1.33 g
D-alanine 11.225 g
Distilled H2O 100 mL
Pyridoxal 5’-phosphate solution
(0.63 mM)
Pyridoxal 5’-phosphate hydrate 16.7 mg
Tris buffer (0.11 M), pH 7.8 100 mL
β-NADH solution (6.12 mM) β-NADH 108.6 mg
Tris buffer (0.11 M), pH 7.8 25 mL
Lactic dehydrogenase solution
(225 Units/L)
Lactic dehydrogenase in glycerol
(2250 Units/L) 60 µL
Tris buffer (0.11 M), pH 7.8 540 µL
Tris/α-ketoglutaric acid (180
mM), pH 7.8 (adjust pH with 12
M and 5 M HCl).
Trizma base 492 mg
α-ketoglutaric acid disodium salt
dihydrate 1052 mg
Distilled H2O 40 mL
NaCl (154 mM) NaCl 0.9 g
Distilled H2O 100 mL
Reaction mixture (50 mL)
Tris/L-alanine or Tris/D-alanine
solution (1260 mM), pH 7.8 19.71 mL
Pyridoxal 5’-phosphate solution
(0.63 mM) 7.93 mL
β-NADH solution (6.12 mM) 5.675 mL
Lactic dehydrogenase solution
(225 Units/L) 0.267 mL
Tris buffer (0.11 M), pH 7.8 16.42 mL
Page 97
85
Appendix 6: Chemicals and lab equipment
Chemical name CAS number Producer
6:2 Fluorotelomer sulfonate
(6:2FTS) 27619-97-2 Chiron, Trondheim, Norway
Acetone 67-64-1 VWR, Oslo, Norway
Alkaline copper tartrate solution
(Reagent A) 500-0113* Bio-Rad, Oslo, Norway
Bovine serum albumin protein
standard 9048-46-8 Sigma-Aldrich, Oslo, Norway
Butylated hydroxytoluene 128-37-0 Sigma-Aldrich, Oslo, Norway
Calcium chloride (CaCl2) 10043-52-4 Sigma-Aldrich, Oslo, Norway
D-alanine 338-69-2 Sigma-Aldrich, Oslo, Norway
Dicumarol 66-76-2 Sigma-Aldrich, Oslo, Norway
Diethylenetriaminepentaacetic acid
(DTPA) 67-43-6 Sigma-Aldrich, Oslo, Norway
Dimethyl sulfoxide (DMSO) 67-68-5 Sigma-Aldrich, Oslo, Norway
Ethanol 64-17-5 Sigma-Aldrich, Oslo, Norway
Ethoxyresorufin 5725-91-7 Sigma-Aldrich, Oslo, Norway
Ethylenediaminetetraacetic acid
disodium salt dihydrate (Na-EDTA) 6381-92-6 Sigma-Aldrich, Oslo, Norway
Folin reagent (Reagent B) 500-0114* Bio-Rad, Oslo, Norway
Glucose 50-99-7 Sigma-Aldrich, Oslo, Norway
Glycerol 56-81-5 Sigma-Aldrich, Oslo, Norway
Heparin 9041-08-1 Sigma-Aldrich, Oslo, Norway
Hepes 7365-45-9 Applichem, Darmstadt, Germany
Hydrogen chloride (HCl) 7647-01-0 Sigma-Aldrich, Oslo, Norway
Hydrogen peroxide (H2O2) 7722-84-1 Sigma-Aldrich, Oslo, Norway
Lactic dehydrogenase 9001-60-9 Sigma-Aldrich, Oslo, Norway
L-alanine 56-41-7 Sigma-Aldrich, Oslo, Norway
Magnesium sulfate heptahydrate
(MgSO4*7H2O) 10034-99-8 Merck, Drammen, Norway
Malondialdehyde (MDA)
tetrabutylammonium salt 1000683-54-3 Sigma-Aldrich, Oslo, Norway
Methanol 67-56-1 Sigma-Aldrich, Oslo, Norway
n-Perfluoropentanoic acid (PFPeA) 2706-90-3 Chiron, Trondheim, Norway
Palmitoyl-CoA 188174-64-3 Sigma-Aldrich, Oslo, Norway
Perfluorohexane sulfonate (PFHxS) 3871-99-6 Chiron, Trondheim, Norway
Perfluorohexanoic acid (PFHxA) 307-24-4 Chiron, Trondheim, Norway
Perfluorooctane sulfonate (PFOS) 1763-23-1 Chiron, Trondheim, Norway
Perfluorooctanoic acid (PFOA) 335-67-1 Chiron, Trondheim, Norway
Potassium chloride (KCl) 7447-40-7 Merck, Drammen, Norway
Pyridoxal 5’-phosphate hydrate 853645-22-4 Sigma-Aldrich, Oslo, Norway
Resorufin standard 635-78-9 Sigma-Aldrich, Oslo, Norway
Sodium azide (NaH3) 26628-22-8 Sigma-Aldrich, Oslo, Norway
Sodium bicarbonate (NaHCO3) 144-55-8 Biochrom AG
Sodium chloride (NaCl) 7647-14-5 VWR, Oslo, Norway
Sodium phosphate monobasic
monohydrate (NaH2PO4*H2O) 231-449-2 Sigma-Aldrich, Oslo, Norway
Thiobarbituric acid (TBA) 504-17-6 Sigma-Aldrich, Oslo, Norway
Trichloroacetic acid (TCA) 76-03-9 Merck
Page 98
86
Triton X-100 9002-93-1 Sigma-Aldrich, Oslo, Norway
Trizma base 77-86-1 Sigma-Aldrich, Oslo, Norway
Trizma HCl 1185-53-1 Sigma-Aldrich, Oslo, Norway
α-ketoglutaric acid disodium salt
dihydrate 305-72-6 Sigma-Aldrich, Oslo, Norway
β-Nicotinamide adenine
dinucleotide reduced disodium salt
hydrate (β-NADH)
606-68-8 Sigma-Aldrich, Oslo, Norway
*Product number.
Instrument/Software Producer
500 series process pumps Watson Marlow
Centrifuge 5425 Eppendorf
Centrifuge 5702R Eppendorf
Cryolys Bertin Technologies
Gen5 BioTek Instruments
Magnetic mixer CS-C10 VWR
Magnetic mixer VMS-A VWR
PHM 92 LAB pH METER Radiometer Copenhagen
Precellys ®24 Bertin Technologies
Schego airpump prima Webzoo.net
SpectrafugeTM
Mini Laboratory Centrifuge Labnet International
Synergy MX Platereader BioTek Instruments
Termaks T1056 UV Incubator Termaks AS
Water-bath type 1003 GFL
Whirlimixer Vortex mixer Fisons