62
BIOGAS WORKSHOP Presented by Tom Ferencevic Technical Director, Yield Energy Inc.
BIOGAS WORKSHOPPresented by Tom Ferencevic
Technical Director,
Yield Energy Inc.

OBJECTIVE
Provide quality information allowing potential
AD clients to ask the right questions
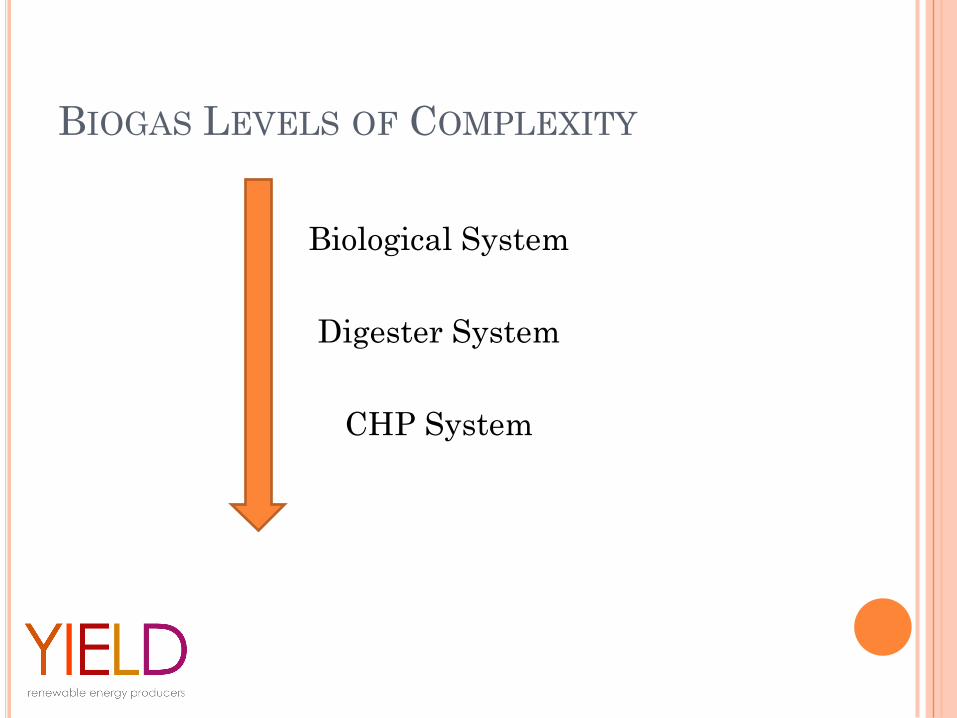
BIOGAS LEVELS OF COMPLEXITY
Biological System
Digester System
CHP System

INTRO TO BIOGAS TECHNOLOGIES
2 Main Types of Digester Systems
WET Fermentation
Completely Mixed
Plug Flow Types
DRY Fermentation
Garage type batch digesters
Plug Flow Types
WWTP types are not dealt with here
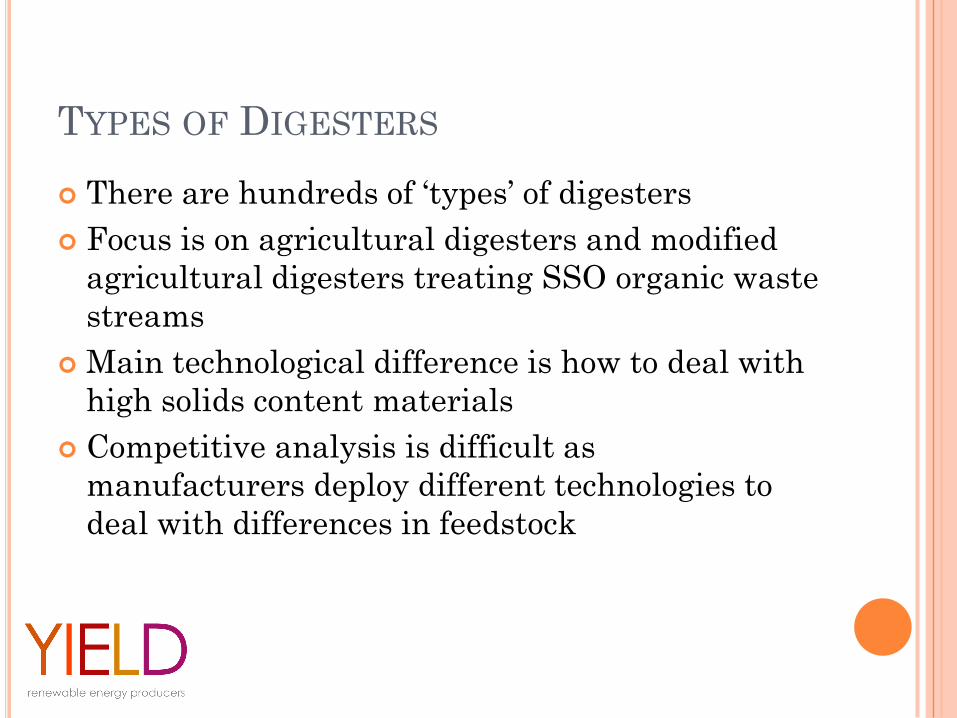
TYPES OF DIGESTERS
There are hundreds of ‘types’ of digesters
Focus is on agricultural digesters and modified
agricultural digesters treating SSO organic waste
streams
Main technological difference is how to deal with
high solids content materials
Competitive analysis is difficult as
manufacturers deploy different technologies to
deal with differences in feedstock
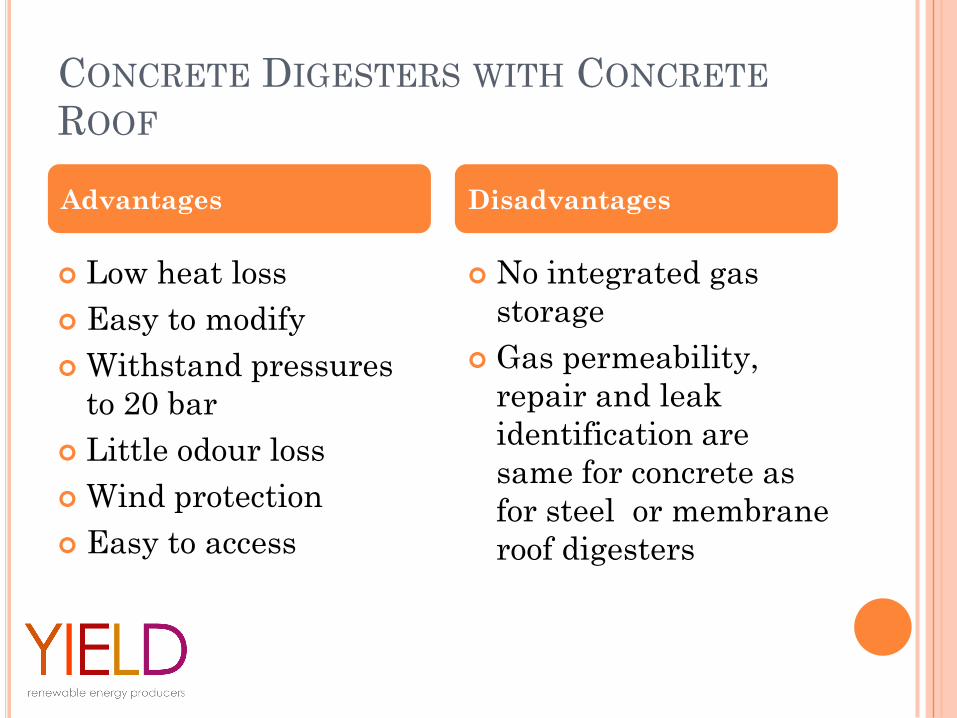
CONCRETE DIGESTERS WITH CONCRETE
ROOF
Low heat loss
Easy to modify
Withstand pressures
to 20 bar
Little odour loss
Wind protection
Easy to access
No integrated gas
storage
Gas permeability,
repair and leak
identification are
same for concrete as
for steel or membrane
roof digesters
Advantages Disadvantages

CONCRETE DIGESTER WITH SINGLE
(EPDM) MEMBRANE COVER
Lower capital cost vs.
concrete or double
membrane roof
Integrated gas storage
Wind and Weather
Sensitive
Not 100% gas tight
Difficult to monitor
gas fill level
Advantages Disadvantages
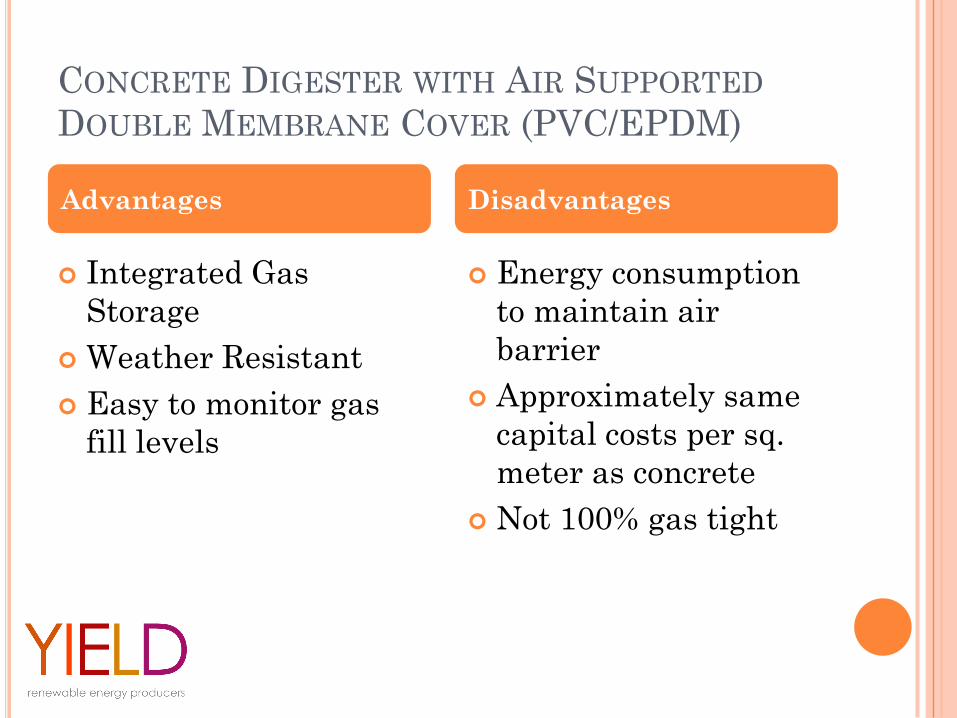
CONCRETE DIGESTER WITH AIR SUPPORTED
DOUBLE MEMBRANE COVER (PVC/EPDM)
Integrated Gas
Storage
Weather Resistant
Easy to monitor gas
fill levels
Energy consumption
to maintain air
barrier
Approximately same
capital costs per sq.
meter as concrete
Not 100% gas tight
Advantages Disadvantages
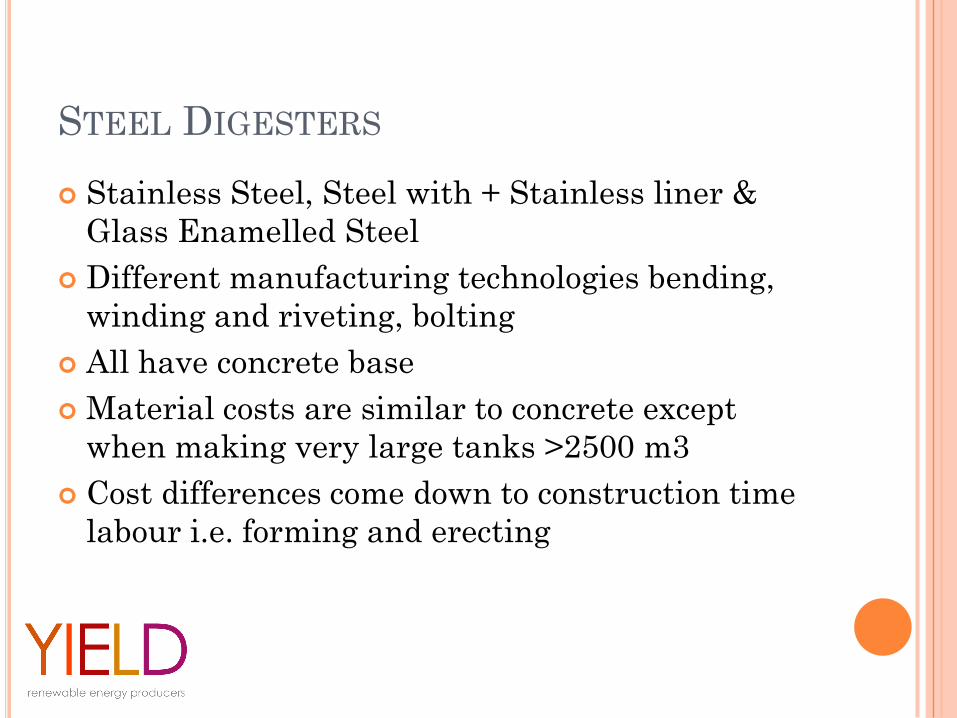
STEEL DIGESTERS
Stainless Steel, Steel with + Stainless liner &
Glass Enamelled Steel
Different manufacturing technologies bending,
winding and riveting, bolting
All have concrete base
Material costs are similar to concrete except
when making very large tanks >2500 m3
Cost differences come down to construction time
labour i.e. forming and erecting

HORIZONTAL DIGESTERS WITH PADDLE MIXERS
(MIX OF CONCRETE & STEEL)
• High loading rates
• Digestion of high
solids content
feedstock
• Complete mixing
• Can be used for dry
digestion
High capital costs
Post digestion is
needed
Size limitations
High parasitic energy
use
If thermophilic
process then higher
system instability
Advantages Disadvantages

GARAGE TYPE DIGESTERS
High solids and
substrate loading rates
Modular with some
redundancy
Simple feeding (using a
loader)
Post Digestion
Composting
Less liquid to deal with
Dry systems need high C:N ratio
feedstock which means they may need
to purchase carbon + $30/tonne
Incomplete digestion process resulting
in post process composting
requirements- this leads to increased
land requirements
Low biological stability
Lower biogas yields and methane
content
If thermophilic process higher
maintenance costs and lower stability
Inconsistent sanitation/pasteurization
More difficult material transport
Emissions management-added costs
Advantages Disadvantages
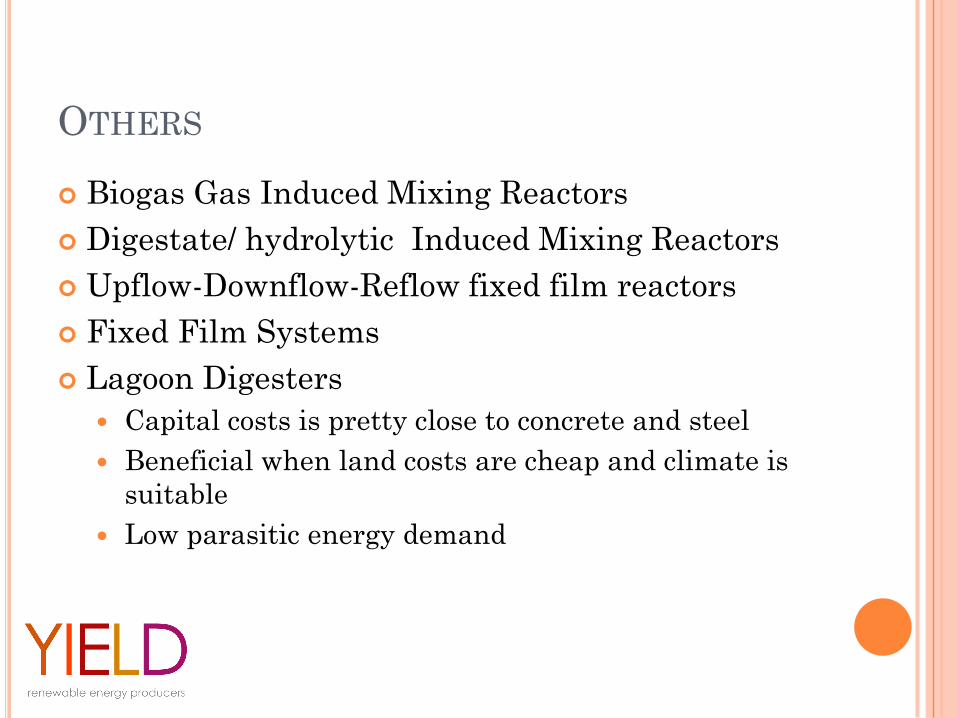
OTHERS
Biogas Gas Induced Mixing Reactors
Digestate/ hydrolytic Induced Mixing Reactors
Upflow-Downflow-Reflow fixed film reactors
Fixed Film Systems
Lagoon Digesters
Capital costs is pretty close to concrete and steel
Beneficial when land costs are cheap and climate is
suitable
Low parasitic energy demand

COMMON CONSIDERATIONS
Every digester needs:
heat exchanger
insulation
mixing technology
feeding system (dry and/or wet)
moisture removal from biogas (active or passive)
monitoring for leakage
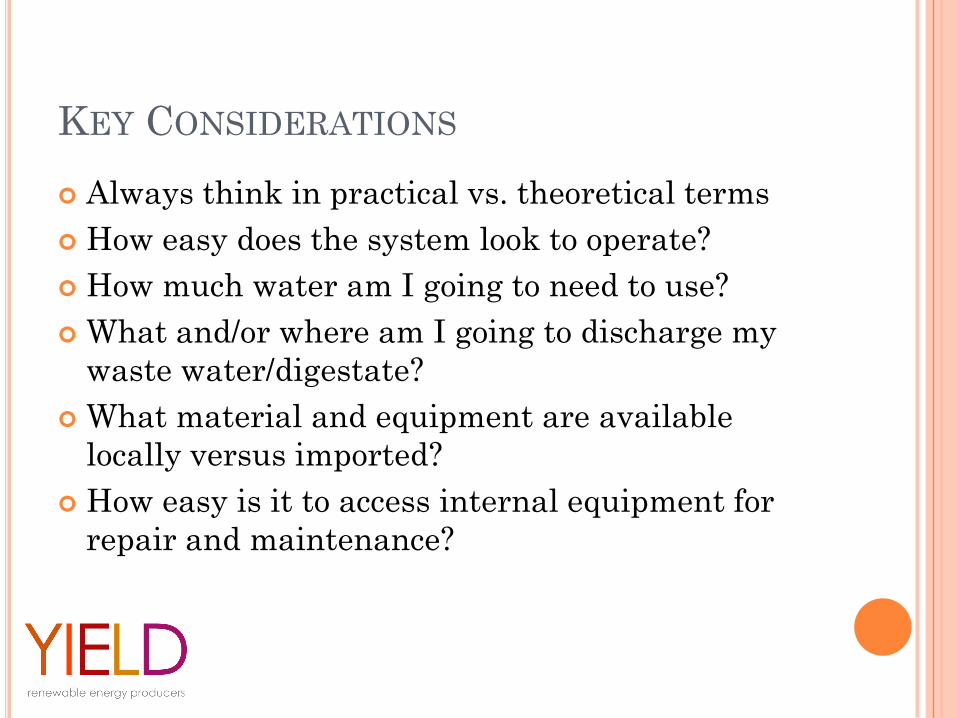
KEY CONSIDERATIONS
Always think in practical vs. theoretical terms
How easy does the system look to operate?
How much water am I going to need to use?
What and/or where am I going to discharge my
waste water/digestate?
What material and equipment are available
locally versus imported?
How easy is it to access internal equipment for
repair and maintenance?
THE BIOCHEMICAL PROCESS
Biogas Workshop

CONVERSION OF ENERGY
Energy Content of the Substrate
Yield= m3 CH4 /tonne of oDM (theoretical)
Energy Delivered by the Digester
Yield= m3 CH4 /(m3 RV d) (theoretical)
Electrical Efficiency of the CHP (%)
Thermal Efficiency of the CHP (%)
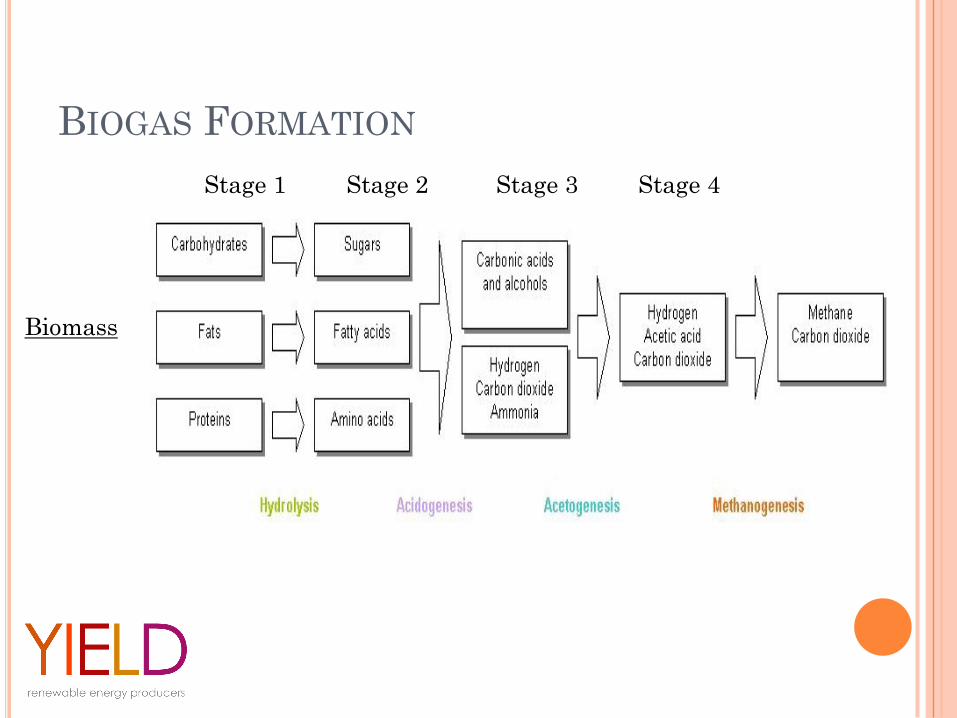
BIOGAS FORMATION
Biomass
Stage 1 Stage 2 Stage 3 Stage 4
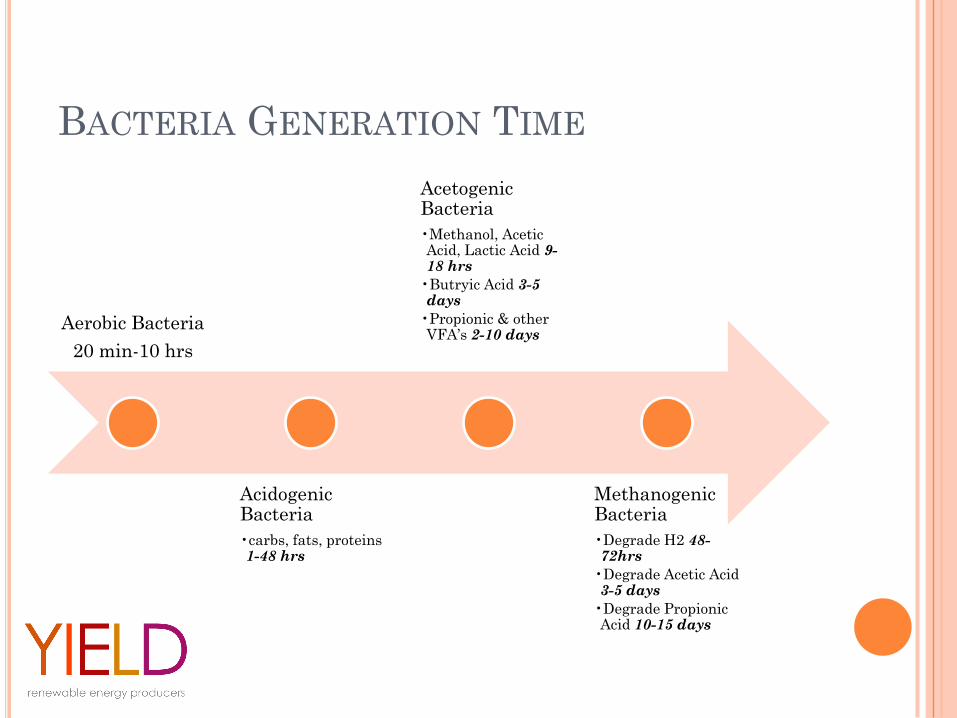
BACTERIA GENERATION TIME
Aerobic Bacteria
20 min-10 hrs
AcidogenicBacteria
•carbs, fats, proteins 1-48 hrs
AcetogenicBacteria
•Methanol, Acetic Acid, Lactic Acid 9-18 hrs
•Butryic Acid 3-5 days
•Propionic & other VFA’s 2-10 days
MethanogenicBacteria
•Degrade H2 48-72hrs
•Degrade Acetic Acid 3-5 days
•Degrade PropionicAcid 10-15 days
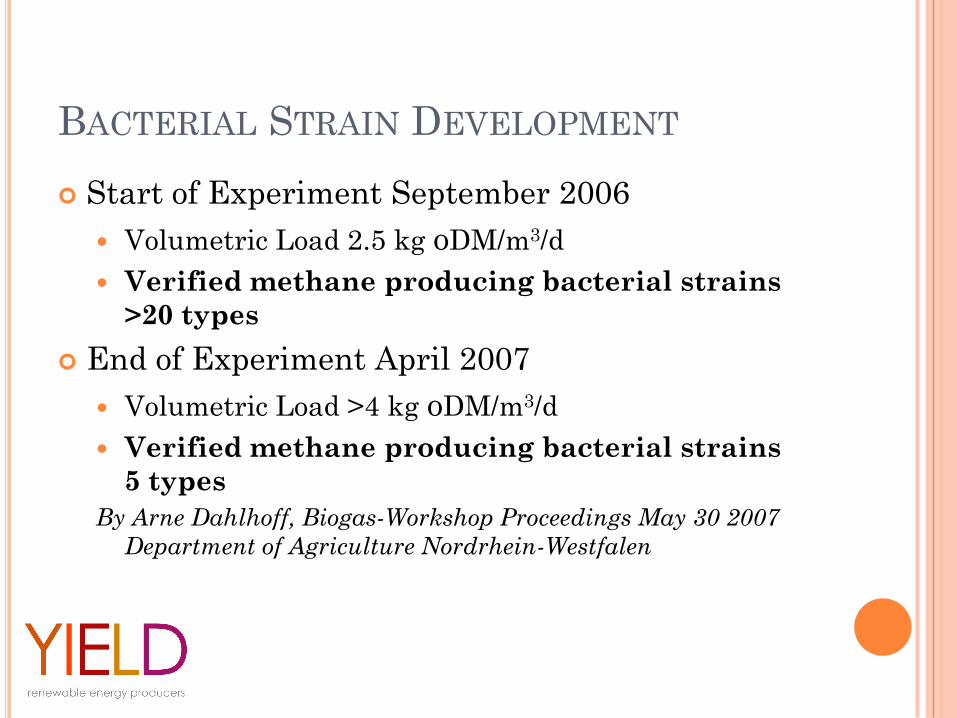
BACTERIAL STRAIN DEVELOPMENT
Start of Experiment September 2006
Volumetric Load 2.5 kg oDM/m3/d
Verified methane producing bacterial strains
>20 types
End of Experiment April 2007
Volumetric Load >4 kg oDM/m3/d
Verified methane producing bacterial strains
5 types
By Arne Dahlhoff, Biogas-Workshop Proceedings May 30 2007
Department of Agriculture Nordrhein-Westfalen
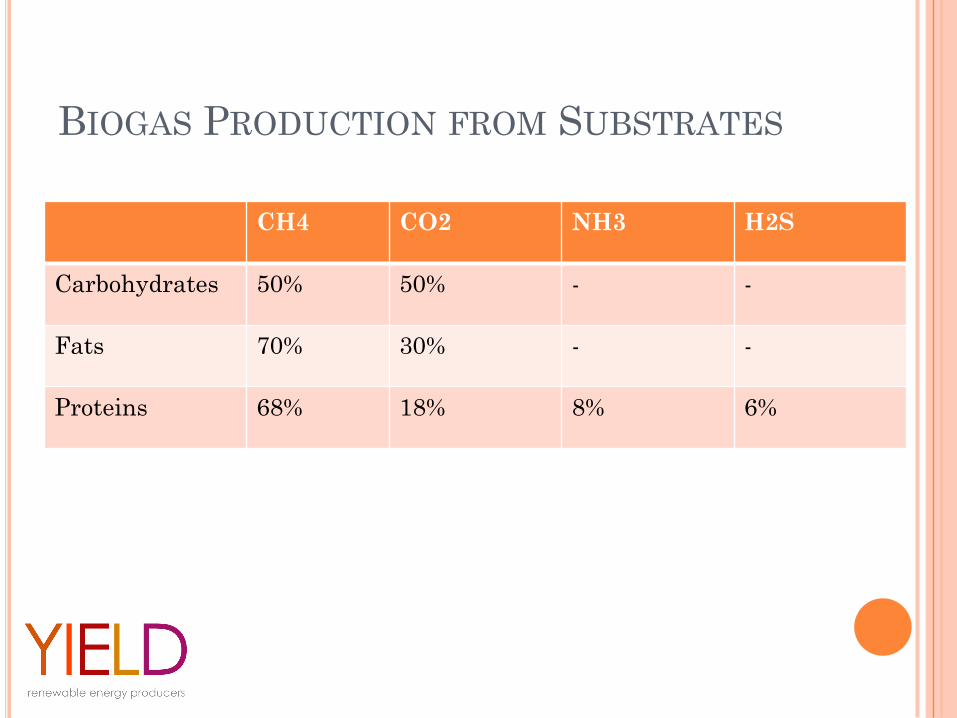
BIOGAS PRODUCTION FROM SUBSTRATES
CH4 CO2 NH3 H2S
Carbohydrates 50% 50% - -
Fats 70% 30% - -
Proteins 68% 18% 8% 6%
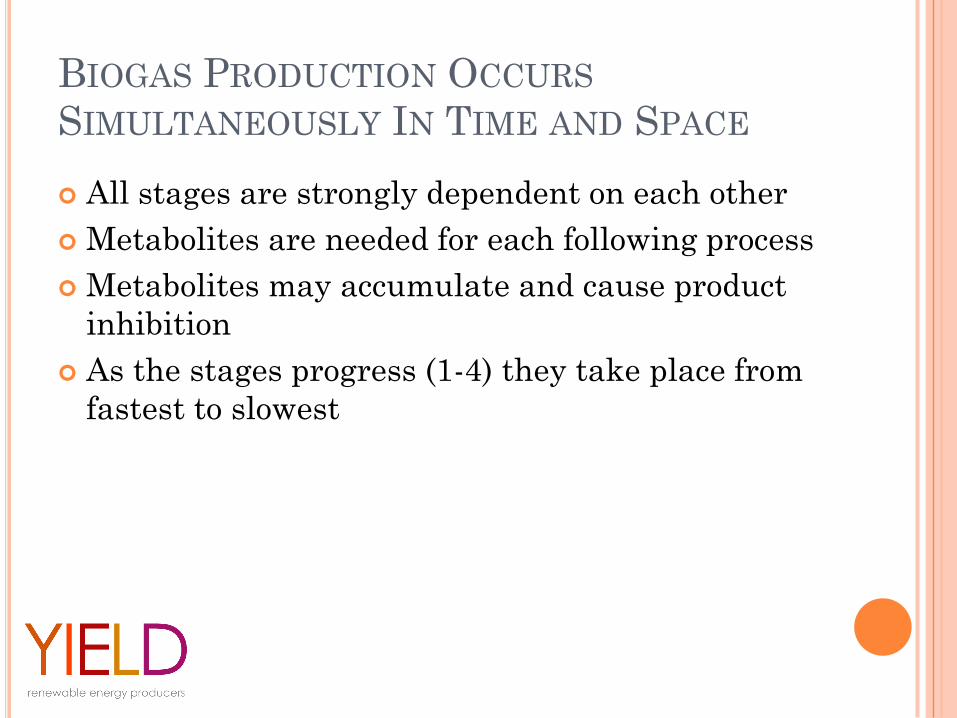
BIOGAS PRODUCTION OCCURS
SIMULTANEOUSLY IN TIME AND SPACE
All stages are strongly dependent on each other
Metabolites are needed for each following process
Metabolites may accumulate and cause product
inhibition
As the stages progress (1-4) they take place from
fastest to slowest
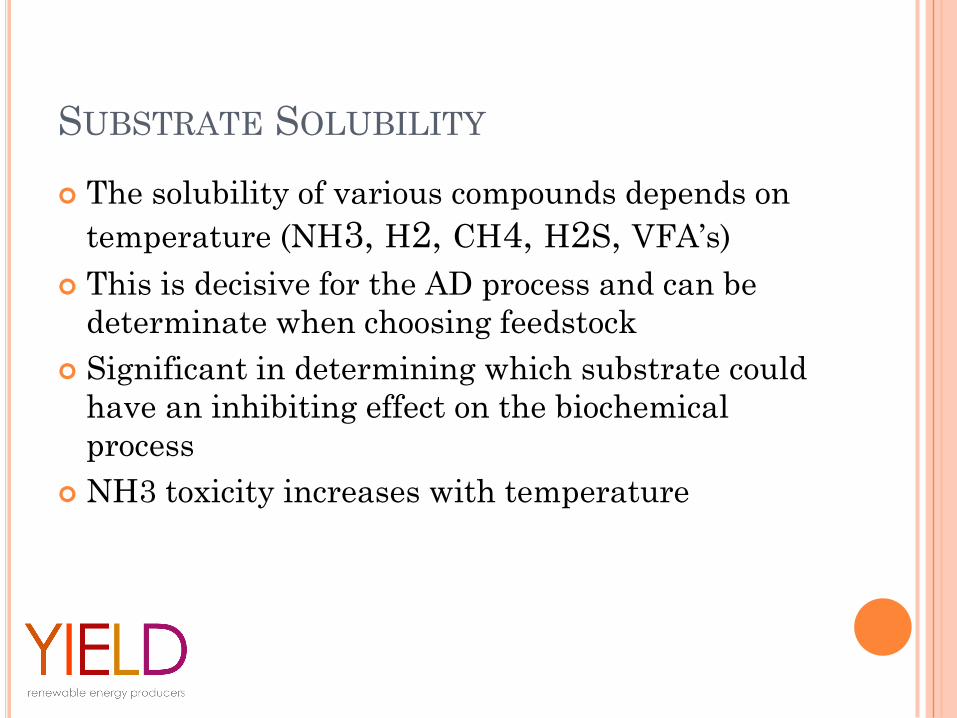
SUBSTRATE SOLUBILITY
The solubility of various compounds depends on
temperature (NH3, H2, CH4, H2S, VFA’s)
This is decisive for the AD process and can be
determinate when choosing feedstock
Significant in determining which substrate could
have an inhibiting effect on the biochemical
process
NH3 toxicity increases with temperature
OPERATIONAL PARAMETERS FOR ANAEROBIC
DIGESTION
Temperature
pH
Micronutrient Feeding
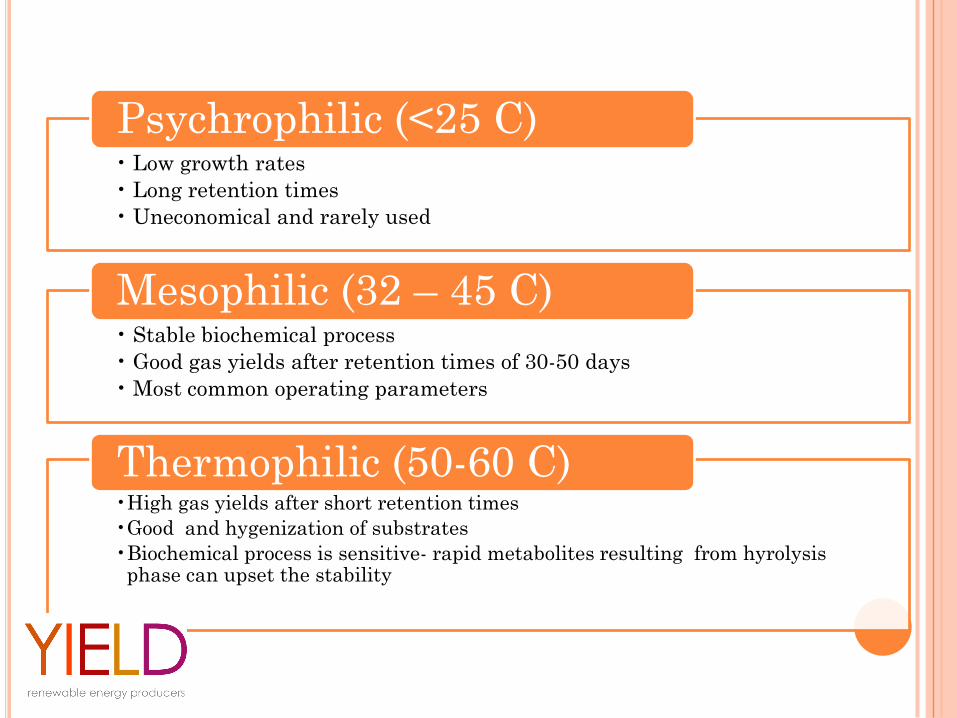
• Low growth rates
• Long retention times
• Uneconomical and rarely used
Psychrophilic (<25 C)
• Stable biochemical process
• Good gas yields after retention times of 30-50 days
• Most common operating parameters
Mesophilic (32 – 45 C)
•High gas yields after short retention times
•Good and hygenization of substrates
•Biochemical process is sensitive- rapid metabolites resulting from hyrolysisphase can upset the stability
Thermophilic (50-60 C)

TEMPERATURE & PH
During the start up phase both pH and
temperature increase relative to each other
A loss of just 1 or 2 degrees can reduce biogas
output by hundreds of m3/day
Metabolites would reduce the pH if not for the
buffer capacity (carbonates & ammonium)
Hydrolysis Methanogenesis
Temperature 25-35 Mesophilic 32-42
pH 5.2-6.3 Thermophilic 50-58
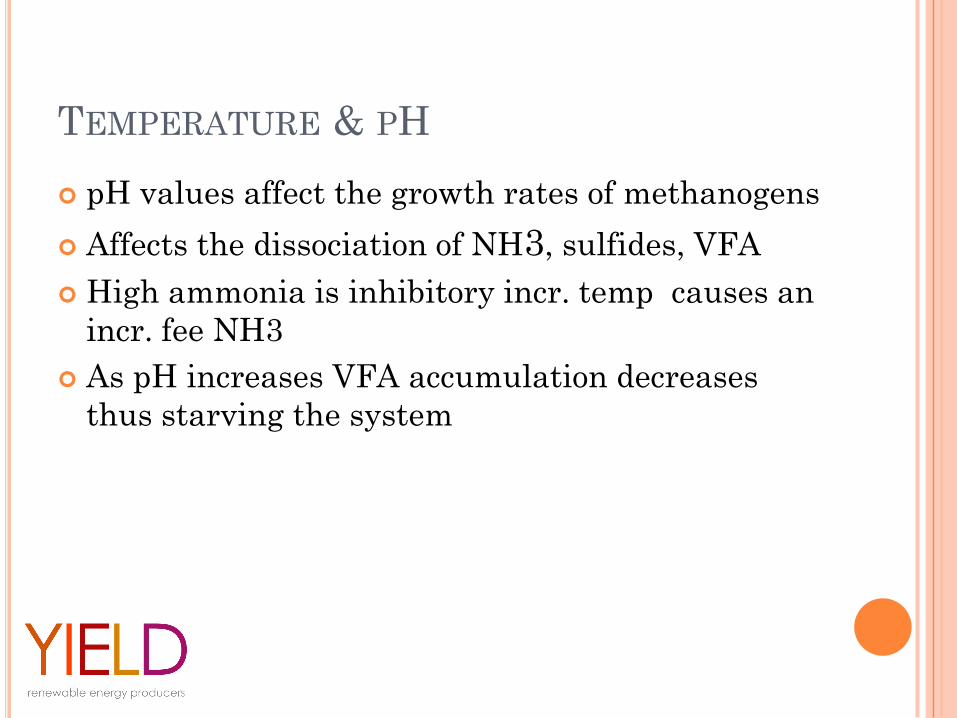
TEMPERATURE & PH
pH values affect the growth rates of methanogens
Affects the dissociation of NH3, sulfides, VFA
High ammonia is inhibitory incr. temp causes an
incr. fee NH3
As pH increases VFA accumulation decreases
thus starving the system

MICRO-NUTRIENTS
A wide range of macro and micro nutrients are
needed to ensure proper growth and reproduction
of your bacterial populations
The amounts needed vary depending on your
feedstock
German biogas plant survey data provided by
Birgit Pfeifer (Novatech) showed that manure
and energy crop based plants benefited from
improved systems stability and biogas production
with the addition of trace elements
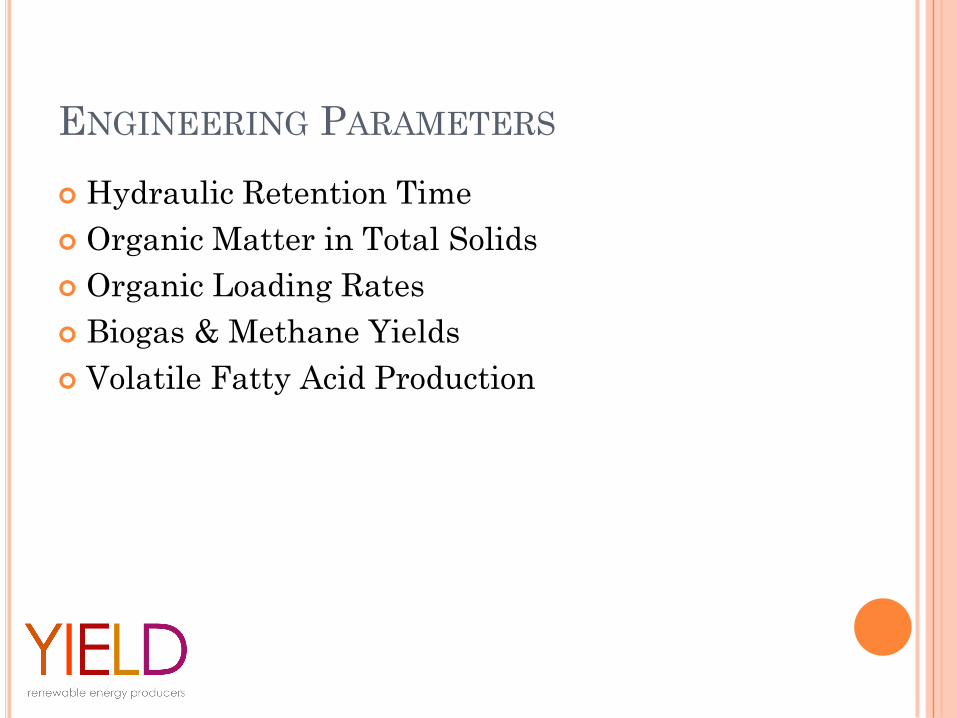
ENGINEERING PARAMETERS
Hydraulic Retention Time
Organic Matter in Total Solids
Organic Loading Rates
Biogas & Methane Yields
Volatile Fatty Acid Production
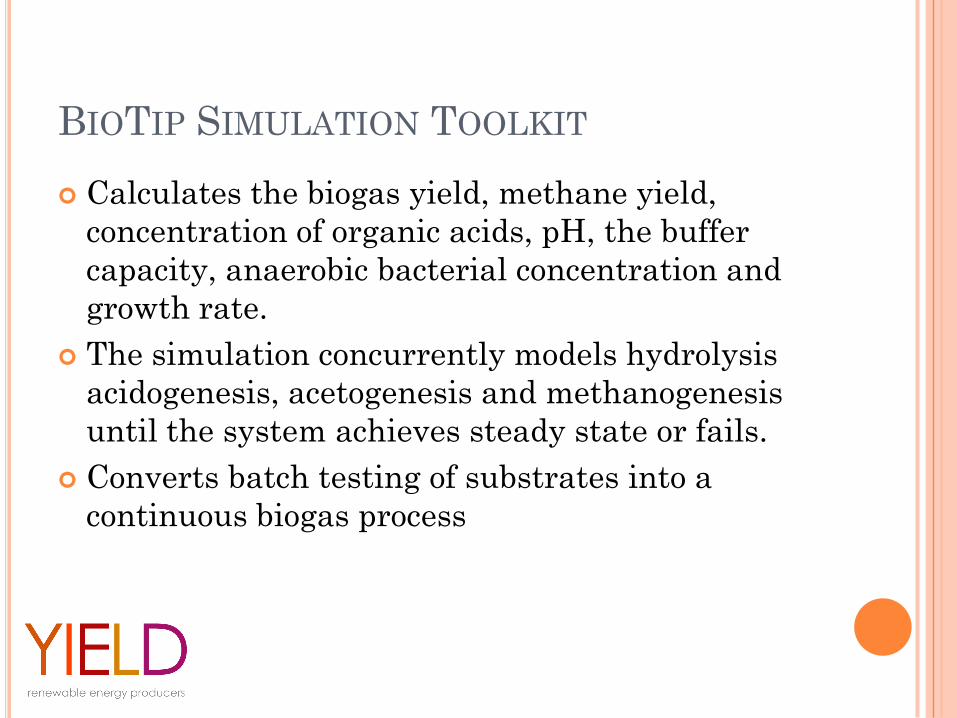
BIOTIP SIMULATION TOOLKIT
Calculates the biogas yield, methane yield,
concentration of organic acids, pH, the buffer
capacity, anaerobic bacterial concentration and
growth rate.
The simulation concurrently models hydrolysis
acidogenesis, acetogenesis and methanogenesis
until the system achieves steady state or fails.
Converts batch testing of substrates into a
continuous biogas process
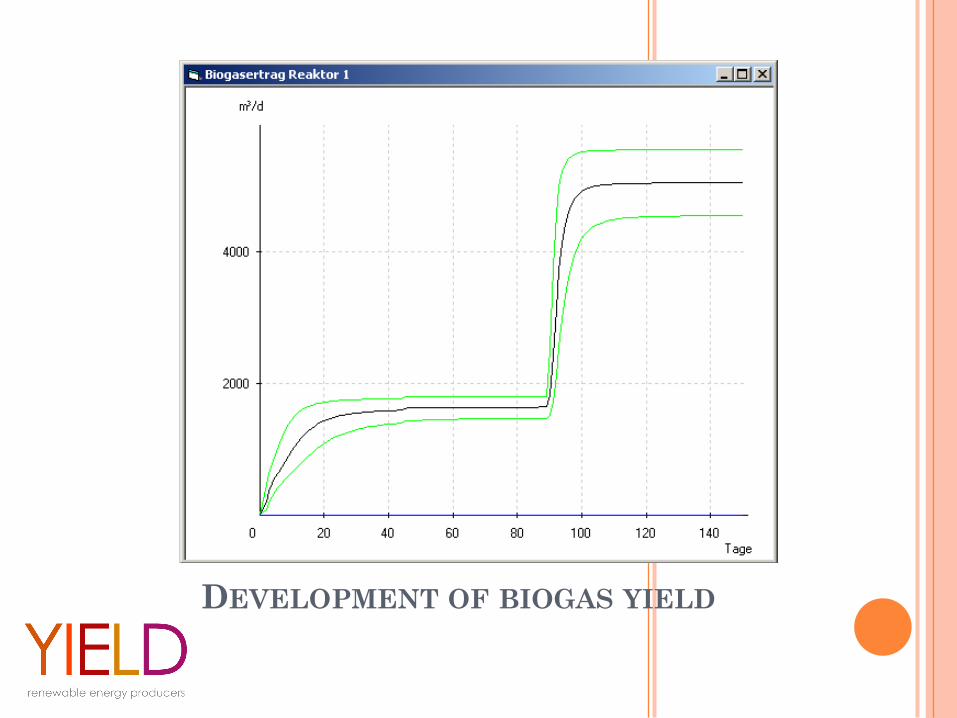
DEVELOPMENT OF BIOGAS YIELD

DEVELOPMENT OF METHANE YIELD
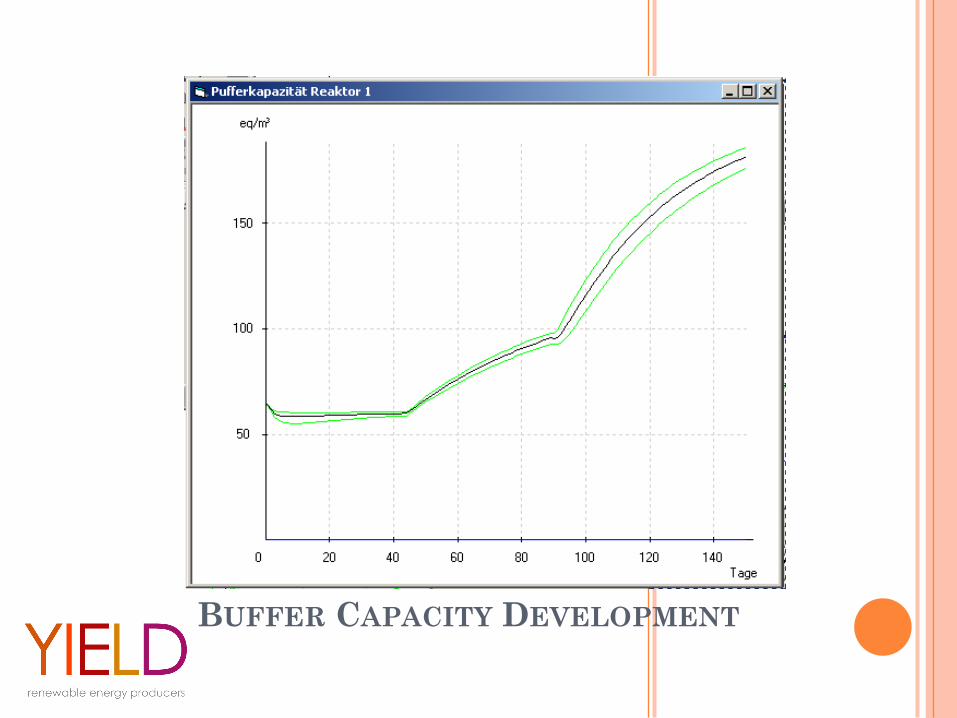
BUFFER CAPACITY DEVELOPMENT
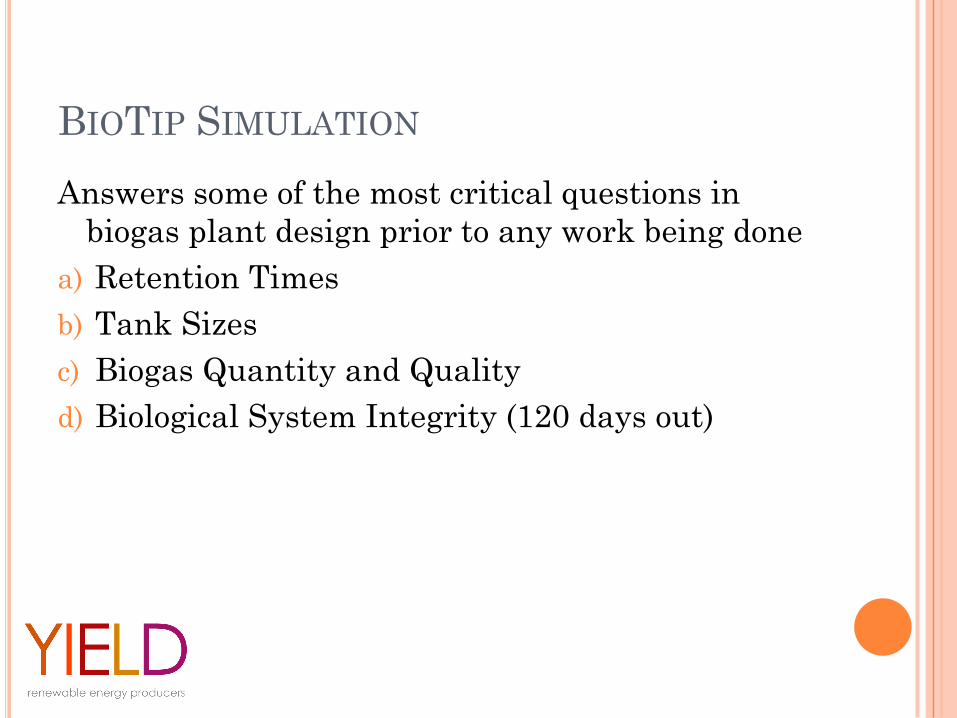
BIOTIP SIMULATION
Answers some of the most critical questions in
biogas plant design prior to any work being done
a) Retention Times
b) Tank Sizes
c) Biogas Quantity and Quality
d) Biological System Integrity (120 days out)

PRE-TREATMENT & PRE-STORAGE
Biogas Workshop
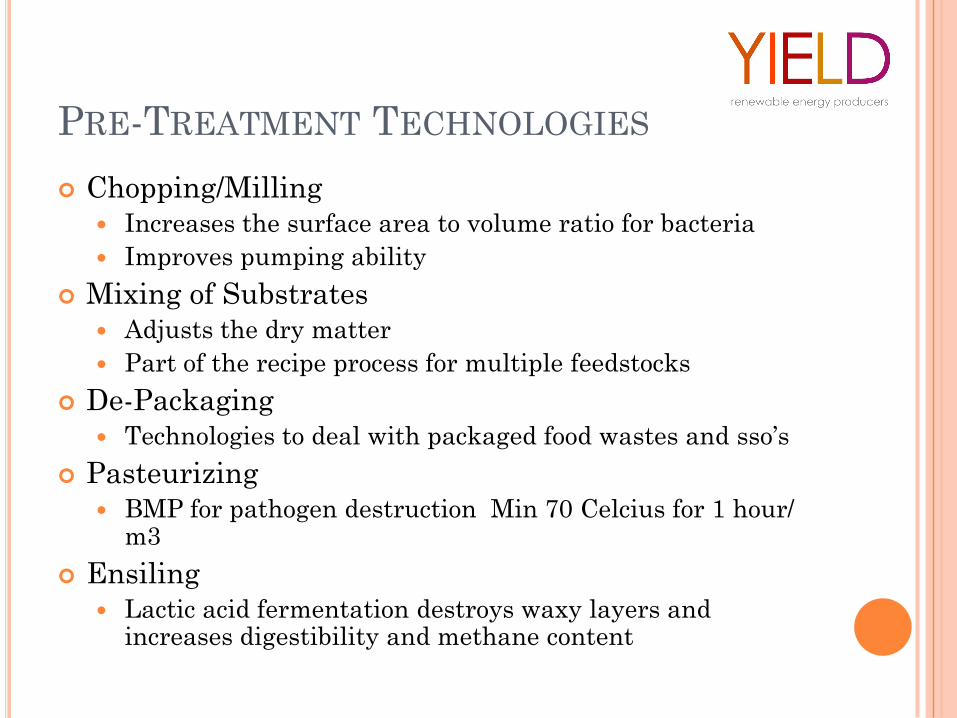
PRE-TREATMENT TECHNOLOGIES
Chopping/Milling
Increases the surface area to volume ratio for bacteria
Improves pumping ability
Mixing of Substrates
Adjusts the dry matter
Part of the recipe process for multiple feedstocks
De-Packaging
Technologies to deal with packaged food wastes and sso’s
Pasteurizing
BMP for pathogen destruction Min 70 Celcius for 1 hour/ m3
Ensiling
Lactic acid fermentation destroys waxy layers and increases digestibility and methane content
FEEDSTOCK SORTING AND SEPARATION
• Depends on feedstock
• Agricultural feedstocks <2% contamination
• Sand and stone can be removed via agitation or
sediment removal
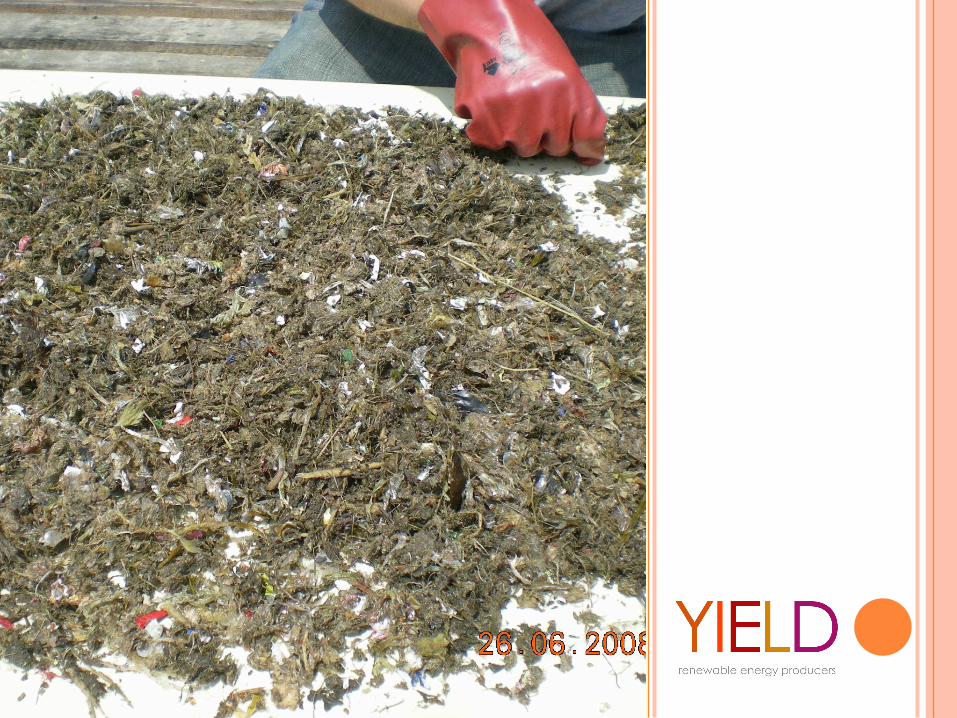
• Household wastes, restaurants and food processing
wastes are full of impurities
• Several technologies to separate non-digestible
matter
Either removal before AD process or during it

MASS BALANCE
Mass Balance - a calculation tool that always
starts with the feedstock
A Mass Balance is key in ultimately determining
a projects potential for success or failure
The Mass Balance is always combined with our
BioTip Simulation

ST
EP
1: F
EE
DS
TO
CK
CH
EM
ICA
LA
UD
IT
Taking
representative
samples and
properly
analyzing your
organic wastes
will give you the
renewable energy
potential of the
fuel source
MASS BALANCE CHEMICAL DATA
1) Carbohydrates, fats, proteins, moisture
2) Total Solids, Total Organic Solids
3) Methane Content (BioTip Calculation &
Reference Data)
4) Biogas Yield (BioTip Calculation & Reference
Data)

ST
EP
2: F
EE
DS
TO
CK
PH
YS
ICA
LA
UD
IT
You must
understand how
much of your
feedstock will
generate you
energy, how
much will cost
you a disposal
fee and how well
your pre-
treatment
technology works
MASS BALANCE-PHYSICAL DATA
The more contaminated and complex the
feedstock the more critical effective pre-
treatment becomes.
1) Contaminants as a % of total solids
2) Total Contaminants (tonnes/yr)
3) Digestible Organics in total solids

PR
E-T
RE
AT
ME
NT
AU
DIT
What goes in
must come
out…all inputs
and outputs
must add up
mathematically.
POST PRE-TREATMENT AUDIT OF
CONTAMINANTS
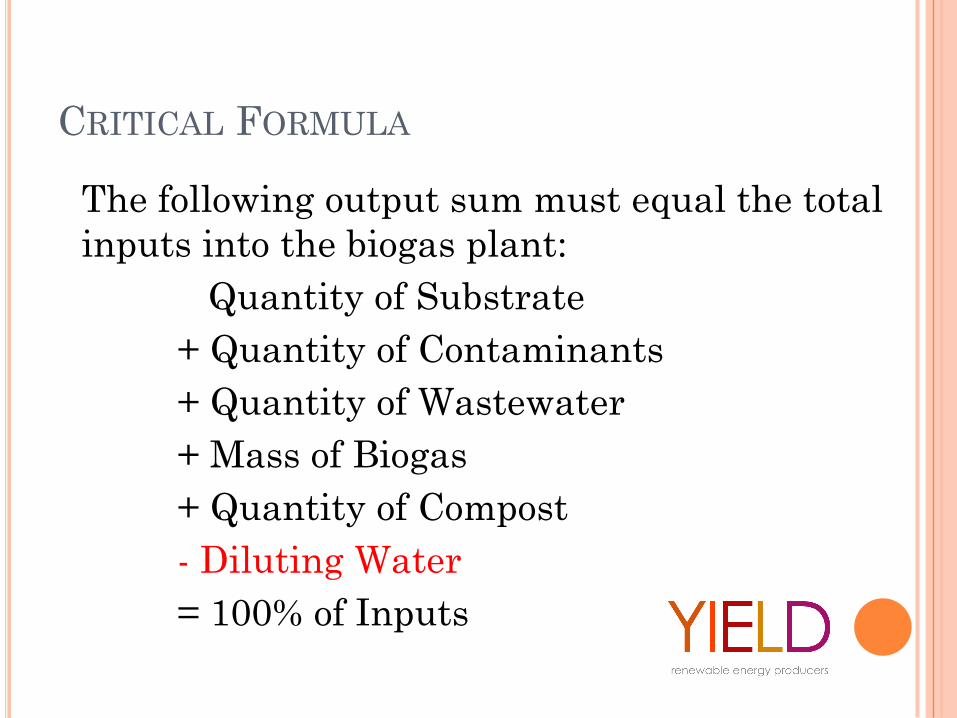
CRITICAL FORMULA
The following output sum must equal the total
inputs into the biogas plant:
Quantity of Substrate
+ Quantity of Contaminants
+ Quantity of Wastewater
+ Mass of Biogas
+ Quantity of Compost
- Diluting Water
= 100% of Inputs

COGENERATION
Biogas Workshop
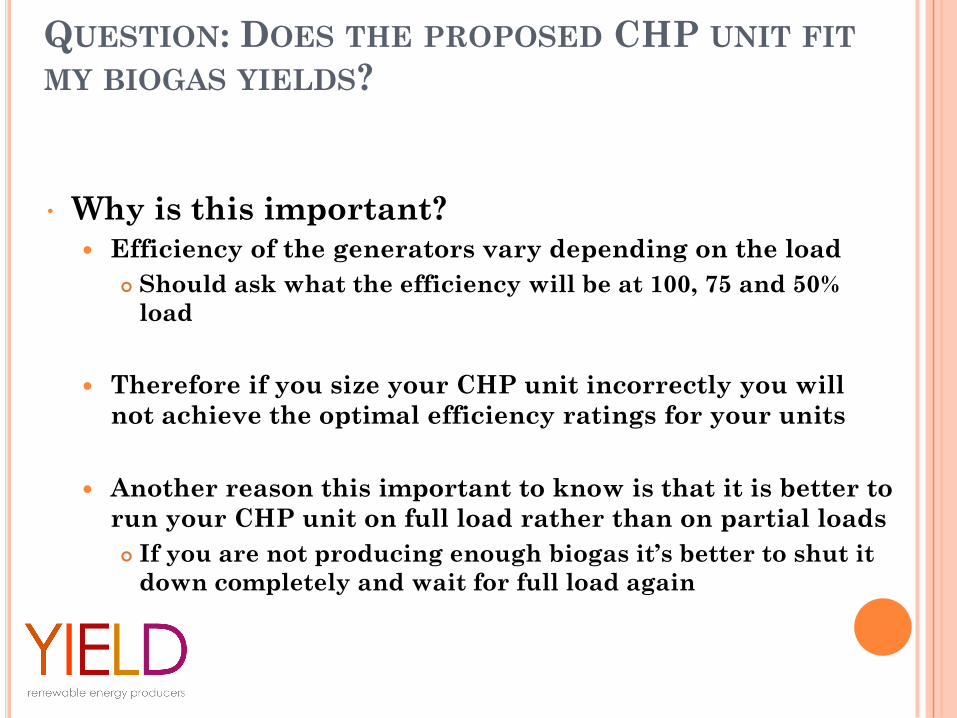
QUESTION: DOES THE PROPOSED CHP UNIT FIT
MY BIOGAS YIELDS?
• Why is this important?
Efficiency of the generators vary depending on the load
Should ask what the efficiency will be at 100, 75 and 50%
load
Therefore if you size your CHP unit incorrectly you will
not achieve the optimal efficiency ratings for your units
Another reason this important to know is that it is better to
run your CHP unit on full load rather than on partial loads
If you are not producing enough biogas it’s better to shut it
down completely and wait for full load again
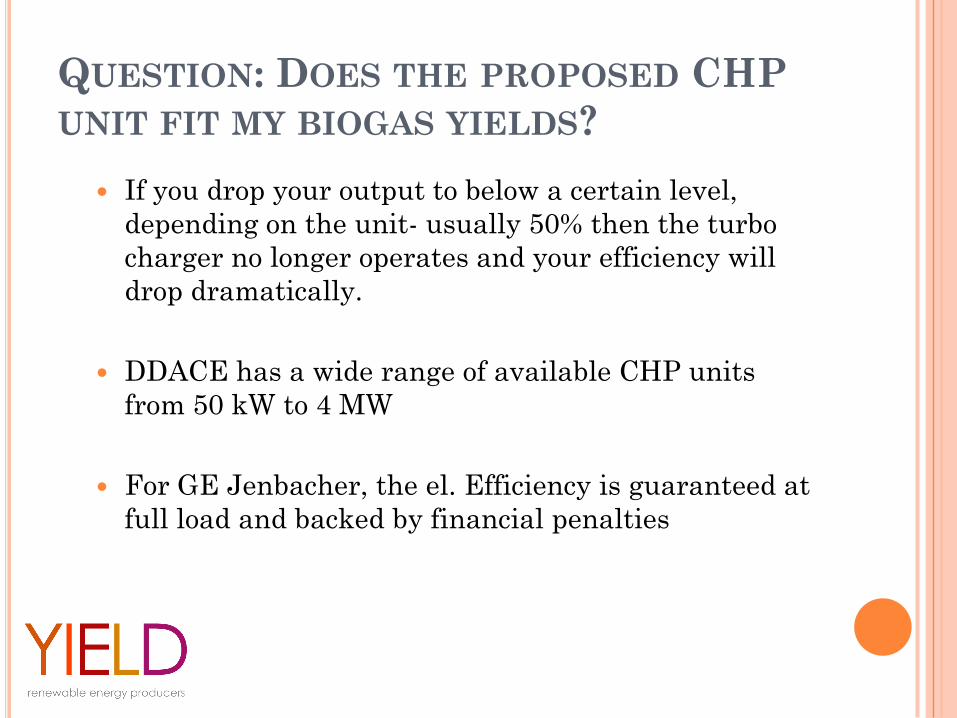
QUESTION: DOES THE PROPOSED CHP
UNIT FIT MY BIOGAS YIELDS?
If you drop your output to below a certain level,
depending on the unit- usually 50% then the turbo
charger no longer operates and your efficiency will
drop dramatically.
DDACE has a wide range of available CHP units
from 50 kW to 4 MW
For GE Jenbacher, the el. Efficiency is guaranteed at
full load and backed by financial penalties
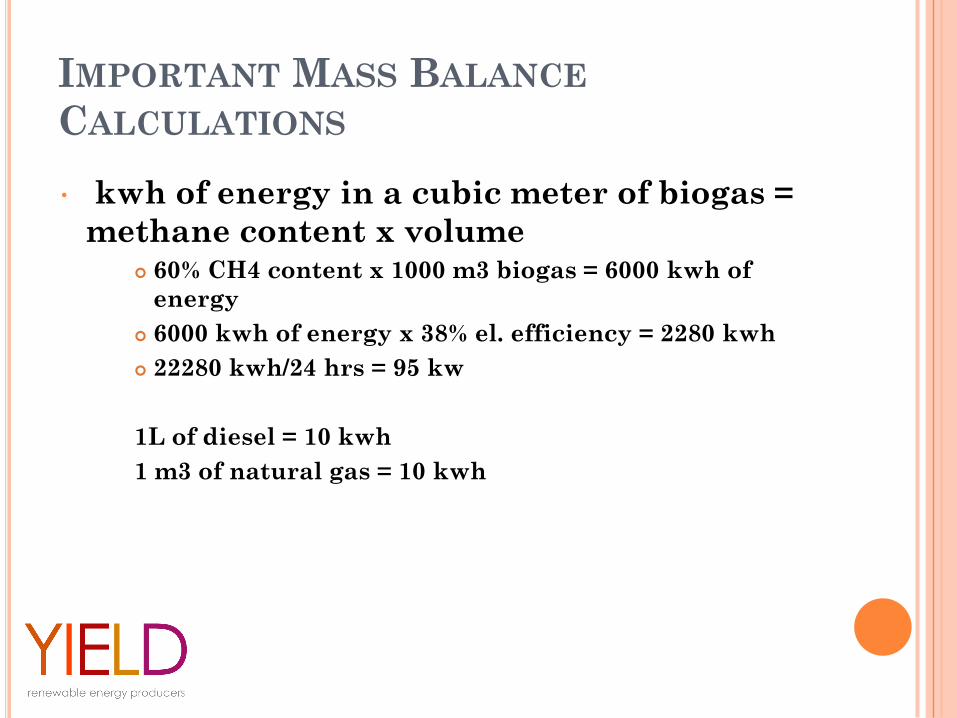
IMPORTANT MASS BALANCE
CALCULATIONS
• kwh of energy in a cubic meter of biogas =
methane content x volume 60% CH4 content x 1000 m3 biogas = 6000 kwh of
energy
6000 kwh of energy x 38% el. efficiency = 2280 kwh
22280 kwh/24 hrs = 95 kw
1L of diesel = 10 kwh
1 m3 of natural gas = 10 kwh

QUESTION: WHAT ARE MY TOLERANCES
TO HYDROGEN SULFIDE?
Why is this important?
Your CHP tolerance to hydrogen sulfide will effect
your maintenance intervals and your costs to clean
up your biogas.
The cleaner the biogas the longer the oil change
intervals will be.
You need to be ready to calculate how much you will
save if you can extend your oil change intervals and
compare that to desulphurization costs
QUESTION: WHAT ARE MY TOLERANCES
TO HYDROGEN SULFIDE?
There are biological desulphurization technologies
available that are very cost competitive to
alternatives on the market.
Note air injection alone will not be enough to bring down
hydrogen sulfide levels to below 200ppm depending on the
feedstock.
Improved engine performance and extended oil change
intervals
QUESTION: DOES ELECTRICAL
EFFICIENCY MATTER?
• Yes and No unless it matches the actual gas
yields from your facility
• What are the actual gas yields achieved?
• Maybe better to have 2 smaller units running at
100 load
• Figure out how long it will take you to get the
extra investment costs back (2-3 years?)
QUESTION: HOW DO THE COSTS AND
AVAILABILITY OF SPARE PARTS COMPARE?
• Can CHP parts can be available in 24 hrs
• is the warehouse managed to stock the most
used and critical wear and tear parts
• Can your supplier have entirely new engine in
place in less than 2 weeks
QUESTION: HOW DOES THE SERVICE
SIDE OF THE COMPANY STACK UP?
• $/kw-hr- must include the cost of ALL inputs
• Maintenance Intervals
• Unscheduled maintenance offerings
• Do they provide Liquidated Damages for
excessive downtime
• Do they offer remote monitoring services
CHP VS. BIOMETHANE
Capital Costs slightly favours biomethane
Need to remember there is still waste gas from this
process and CHP will still be beneficial
Feed In Tariff in Ontario is driving CHP
OPA claims carbon credits
Heat use needs to calculated into ROI
Greenhouse where heat offsets NG use
Vehicle fuel likely provides the best rate of return
Ideal for Municipalities
2 KEY POINTS
In the end your biogas plant design and
engineering parameters are a compromise
between getting the highest possible biogas
yields at a justifiable capital and
operational cost.
Understanding your feedstock goes a long
way to making or breaking a project.
GREEN ENERGY AND
ECONOMY ACT
Biogas Workshop
RENEWABLE ENERGY APPROVALS
Streamlined approvals for renewable energy
Feed-in-tariff system to provide 20 yr fixed price
contracts
Develop a smart grid which is intended to
support new energy supply
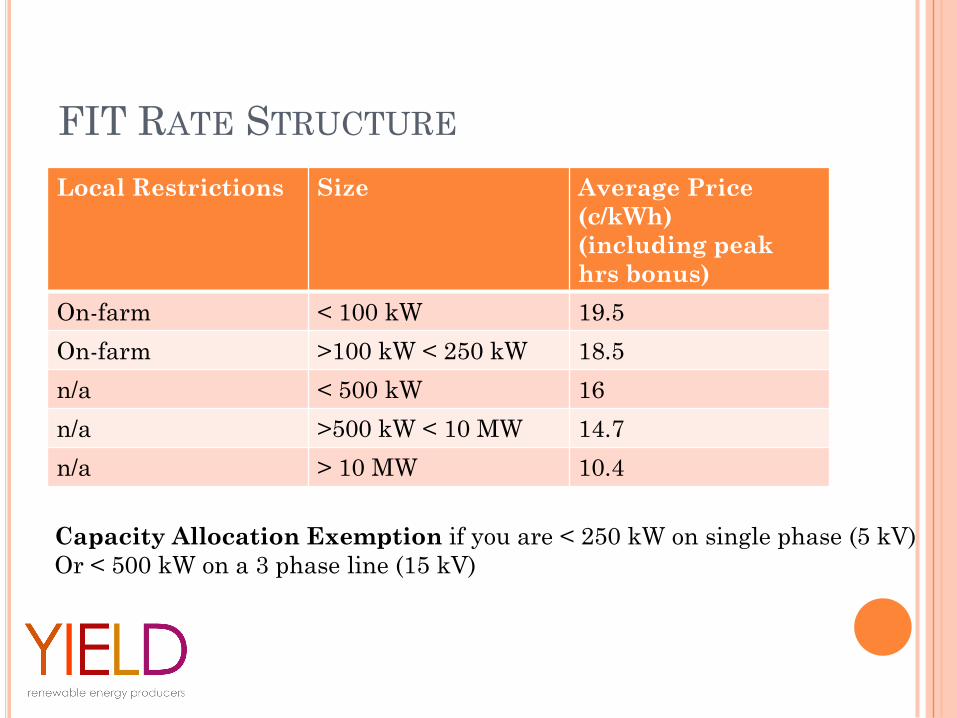
FIT RATE STRUCTURE
Local Restrictions Size Average Price
(c/kWh)
(including peak
hrs bonus)
On-farm < 100 kW 19.5
On-farm >100 kW < 250 kW 18.5
n/a < 500 kW 16
n/a >500 kW < 10 MW 14.7
n/a > 10 MW 10.4
Capacity Allocation Exemption if you are < 250 kW on single phase (5 kV)
Or < 500 kW on a 3 phase line (15 kV)

4 CLASSES OF BIOGAS PLANTS
Regulated Mixed AD Facility (MRDAF)
Exempt from REA, regulated under NMA
Class 1 (on farm)- agricultural waste or energy
crops + series of BMP’s
Class 2 (on farm)- All biomass & pre-consumer
SS0 + series of BMP’s = REA Approval
Class 3 (off farm)- All biomass & SSO’s = REA
Approval

DIGESTATE MANAGEMENT
Related to Class of Biogas Plant
If your AD facility did not receive biosolids or
septage and at least 50% by volume of the
substrate is on-farm then your digestate does not
require a CoA for land application
If you are a Class 3 off-farm you can get a CFIA
Fertilizer Reg for sale and land application of
your digestate
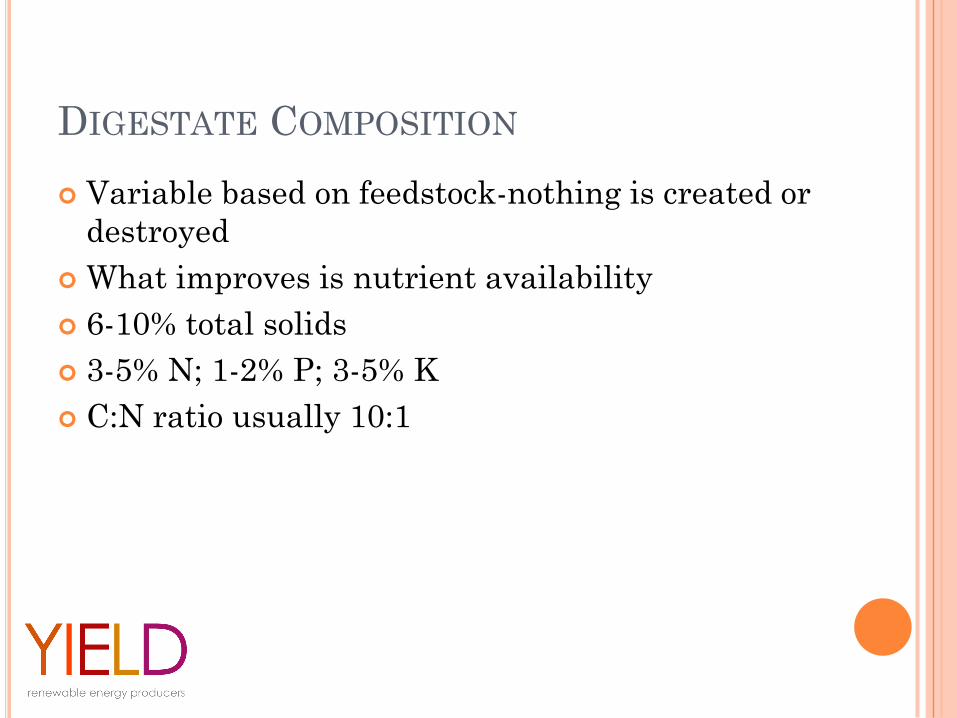
DIGESTATE COMPOSITION
Variable based on feedstock-nothing is created or
destroyed
What improves is nutrient availability
6-10% total solids
3-5% N; 1-2% P; 3-5% K
C:N ratio usually 10:1

THANK YOU
Tom Ferencevic
Yield Energy Inc.
1 289 668 0201


