27
BioSeek BioSeek BioSeek - ToxCast Phase I Project Update Ellen Berg, PhD, BioSeek, Inc. EPA Chemical Prioritization Community of Practice Monthly Meeting January 24, 2008
BioSeekBioSeek
BioSeek - ToxCast Phase I Project Update
Ellen Berg, PhD, BioSeek, Inc.
EPA Chemical Prioritization Community of PracticeMonthly Meeting
January 24, 2008

BioSeek
Agenda
Introduction to BioSeek’s BioMAP Technology
Summary of results - Proof-of-Concept study
Next steps
2
BioSeek
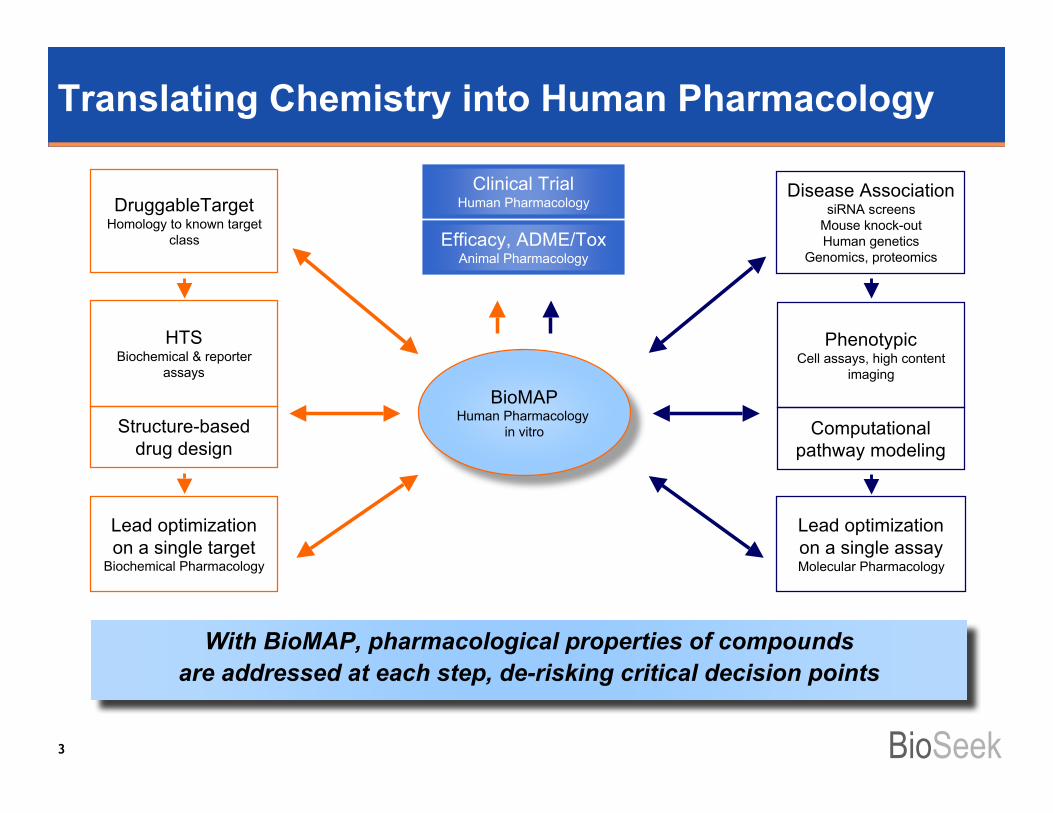
With BioMAP, pharmacological properties of compoundsare addressed at each step, de-risking critical decision points
BioMAPHuman Pharmacology
in vitro
Translating Chemistry into Human Pharmacology
DruggableTargetHomology to known target
class
HTSBiochemical & reporter
assays
Structure-baseddrug design
Lead optimizationon a single target
Biochemical Pharmacology
Disease AssociationsiRNA screens
Mouse knock-outHuman genetics
Genomics, proteomics
Lead optimizationon a single assayMolecular Pharmacology
Efficacy, ADME/ToxAnimal Pharmacology
PhenotypicCell assays, high content
imaging
Computationalpathway modeling
Clinical TrialHuman Pharmacology
3
BioSeek
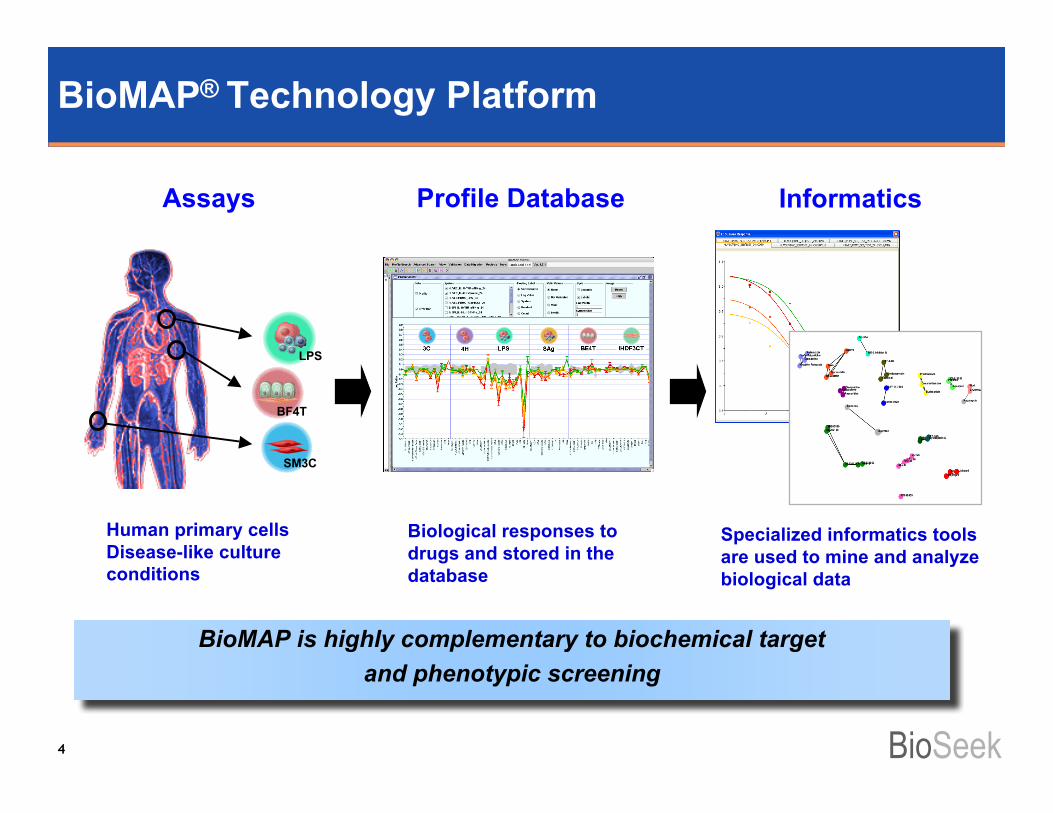
BioMAP® Technology Platform
Assays
Human primary cellsDisease-like cultureconditions
LPS
BF4T
SM3C
Profile Database Informatics
Biological responses todrugs and stored in thedatabase
Specialized informatics toolsare used to mine and analyzebiological data
BioMAP is highly complementary to biochemical targetand phenotypic screening
4
BioSeek
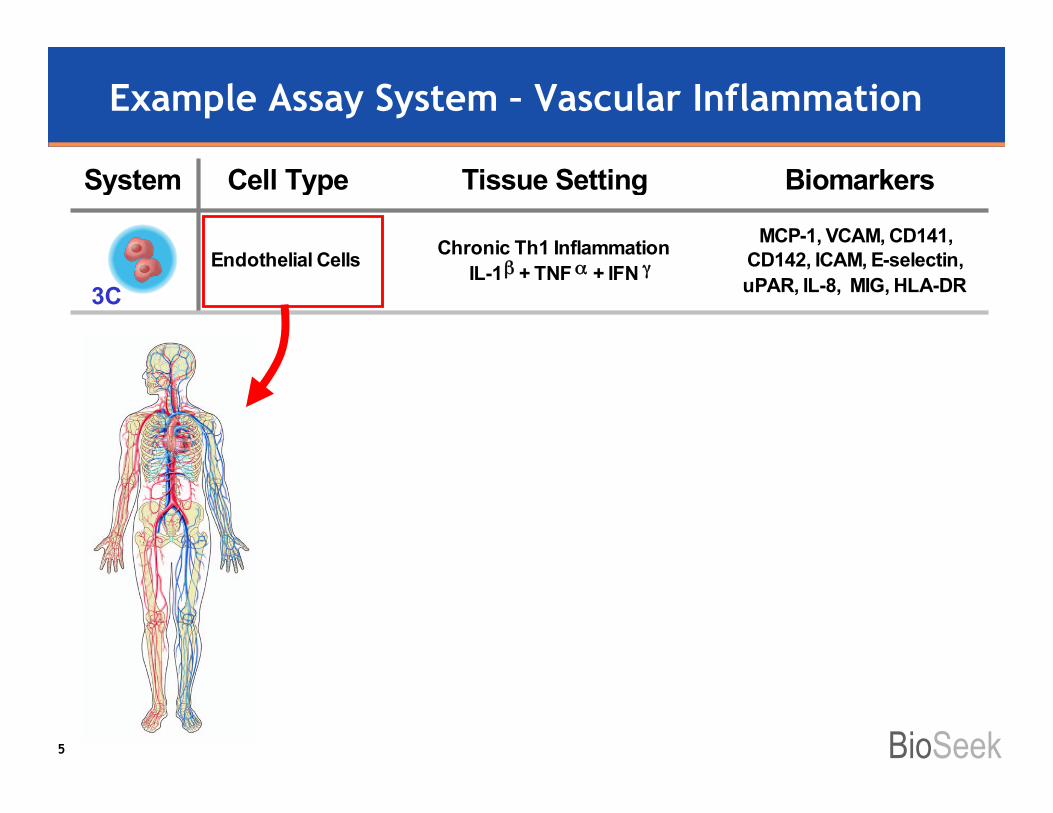
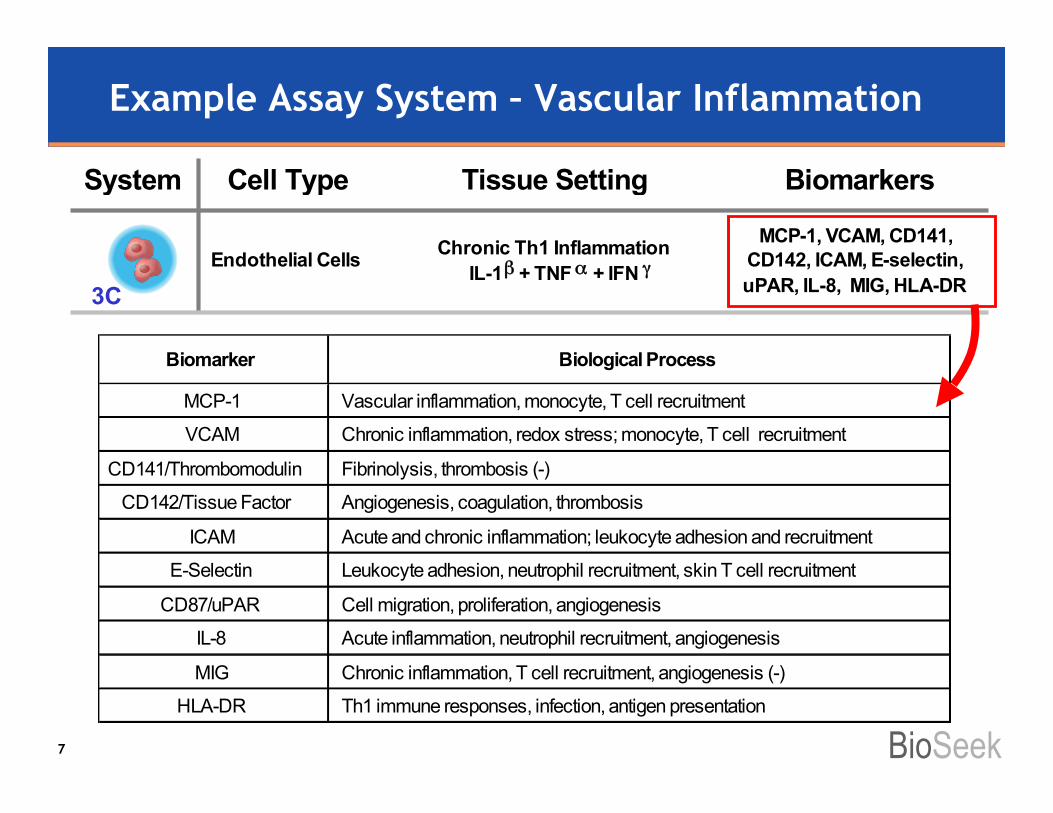
Example Assay System – Vascular Inflammation
3C
System Cell Type Tissue Setting Biomarkers
Endothelial CellsChronic Th1 Inflammation
IL-1! + TNF" + IFN #
MCP-1, VCAM, CD141,
CD142, ICAM, E-selectin,
uPAR, IL-8, MIG, HLA-DR
5

BioSeek
Example Assay System – Vascular Inflammation
StrokeMultiple
Sclerosis
ArthritisAutoimmune
Disease
RespiratoryDisease
COPDHeart
Disease
CardiovascularDisease
3C
System Cell Type Tissue Setting Biomarkers
Endothelial CellsChronic Th1 Inflammation
IL-1! + TNF" + IFN #
MCP-1, VCAM, CD141,
CD142, ICAM, E-selectin,
uPAR, IL-8, MIG, HLA-DR
6
BioSeek
Biomarker Biological Process
MCP-1 Vascular inflammation, monocyte, T cell recruitment
VCAM Chronic inflammation, redox stress; monocyte, T cell recruitment
CD141/Thrombomodulin Fibrinolysis, thrombosis (-)
CD142/Tissue Factor Angiogenesis, coagulation, thrombosis
ICAM Acute and chronic inflammation; leukocyte adhesion and recruitment
E-Selectin Leukocyte adhesion, neutrophil recruitment, skin T cell recruitment
CD87/uPAR Cell migration, proliferation, angiogenesis
IL-8 Acute inflammation, neutrophil recruitment, angiogenesis
MIG Chronic inflammation, T cell recruitment, angiogenesis (-)
HLA-DR Th1 immune responses, infection, antigen presentation
Example Assay System – Vascular Inflammation
3C
System Cell Type Tissue Setting Biomarkers
Endothelial CellsChronic Th1 Inflammation
IL-1! + TNF" + IFN #
MCP-1, VCAM, CD141,
CD142, ICAM, E-selectin,
uPAR, IL-8, MIG, HLA-DR
7
BioSeek
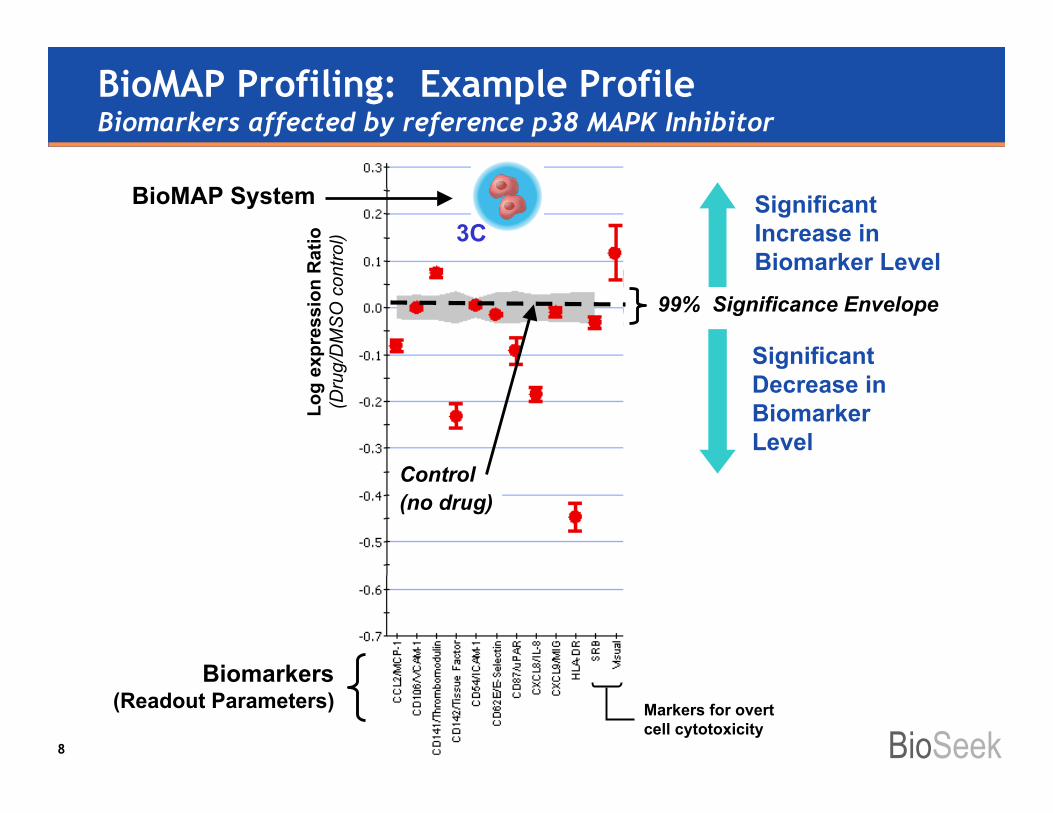
BioMAP Profiling: Example ProfileBiomarkers affected by reference p38 MAPK Inhibitor
Log
expr
essi
on R
atio
(Dru
g/D
MS
O c
ontro
l)
Control(no drug)
8
3CBioMAP System
Biomarkers(Readout Parameters)
99% Significance Envelope
SignificantIncrease inBiomarker Level
SignificantDecrease inBiomarkerLevel
Markers for overtcell cytotoxicity
BioSeek
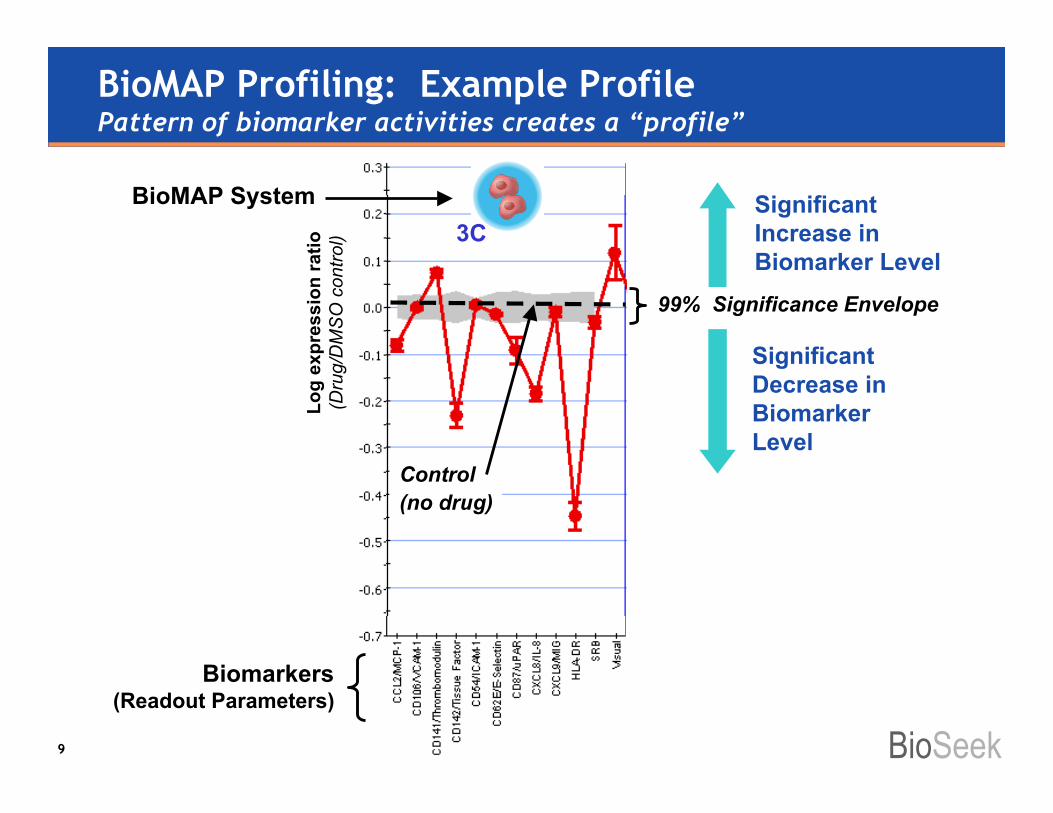
BioMAP Profiling: Example ProfilePattern of biomarker activities creates a “profile”
Log
expr
essi
on ra
tio(D
rug/
DM
SO
con
trol)
Control(no drug)
9
3CBioMAP System
99% Significance Envelope
SignificantIncrease inBiomarker Level
SignificantDecrease inBiomarkerLevel
Biomarkers(Readout Parameters)

BioSeek
BioMAP Profiling: Example ProfileMultiple dose profile of reference p38 MAPK Inhibitor
Log
expr
essi
on ra
tio(D
rug/
DM
SO
con
trol)
Control(no drug)
10
3CBioMAP System
99% Significance Envelope
DoseResponse
Biomarkers(Readout Parameters)
BioSeek
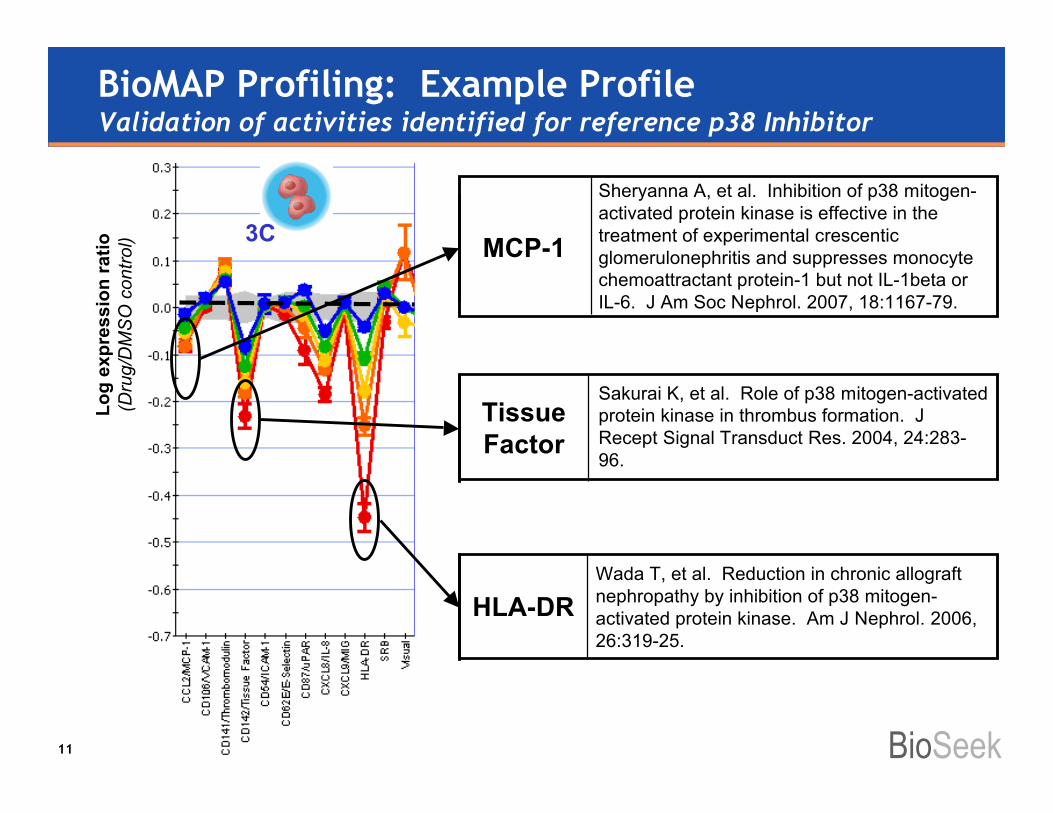
BioMAP Profiling: Example ProfileValidation of activities identified for reference p38 Inhibitor
Log
expr
essi
on ra
tio(D
rug/
DM
SO
con
trol)
11
3C
Sheryanna A, et al. Inhibition of p38 mitogen-activated protein kinase is effective in thetreatment of experimental crescenticglomerulonephritis and suppresses monocytechemoattractant protein-1 but not IL-1beta orIL-6. J Am Soc Nephrol. 2007, 18:1167-79.
MCP-1
Sakurai K, et al. Role of p38 mitogen-activatedprotein kinase in thrombus formation. JRecept Signal Transduct Res. 2004, 24:283-96.
TissueFactor
Wada T, et al. Reduction in chronic allograftnephropathy by inhibition of p38 mitogen-activated protein kinase. Am J Nephrol. 2006,26:319-25.
HLA-DR
BioSeek12
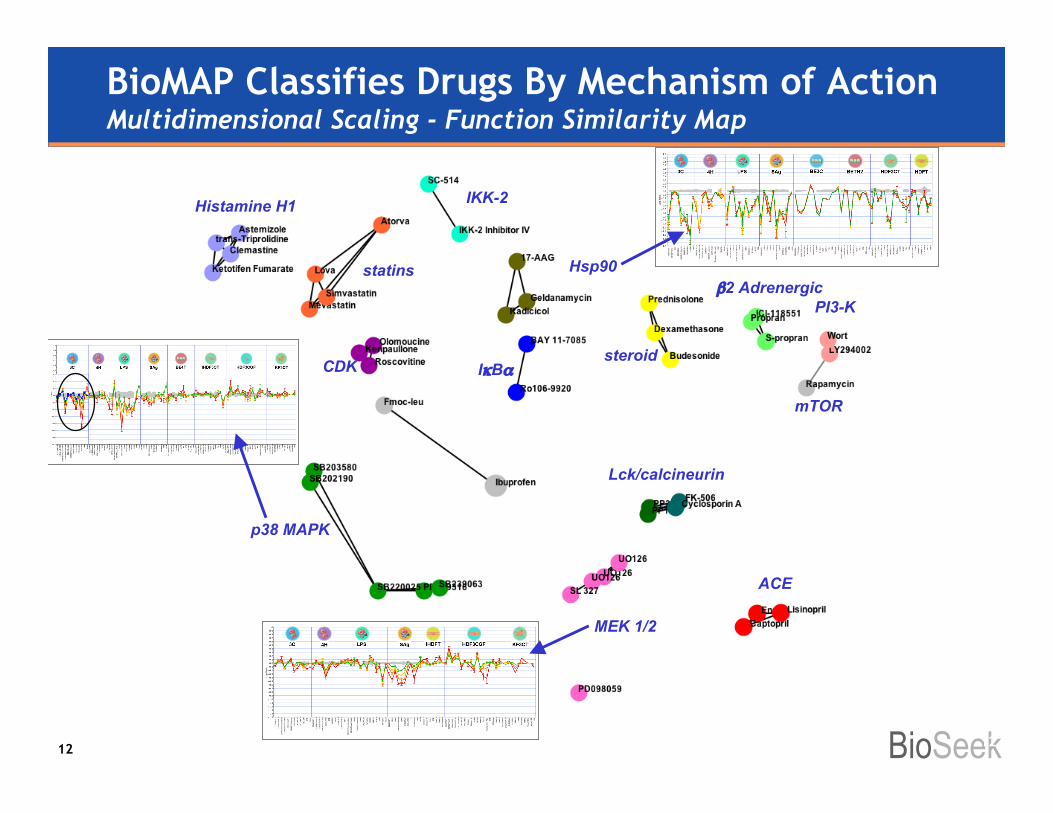
BioMAP Classifies Drugs By Mechanism of ActionMultidimensional Scaling - Function Similarity Map
Hsp90
IκBα
IKK-2
CDK
β2 AdrenergicPI3-K
MEK 1/2
Lck/calcineurin
steroid
ACE
Histamine H1
statins
mTOR
p38 MAPK
12

BioSeek
Similarity Search for Mechanism of ActionBioMAP Database
Test compound:PD169316
p38 MAPK inhibitor
Top matches:other
p38 MAPK inhibitors
13
BioSeek
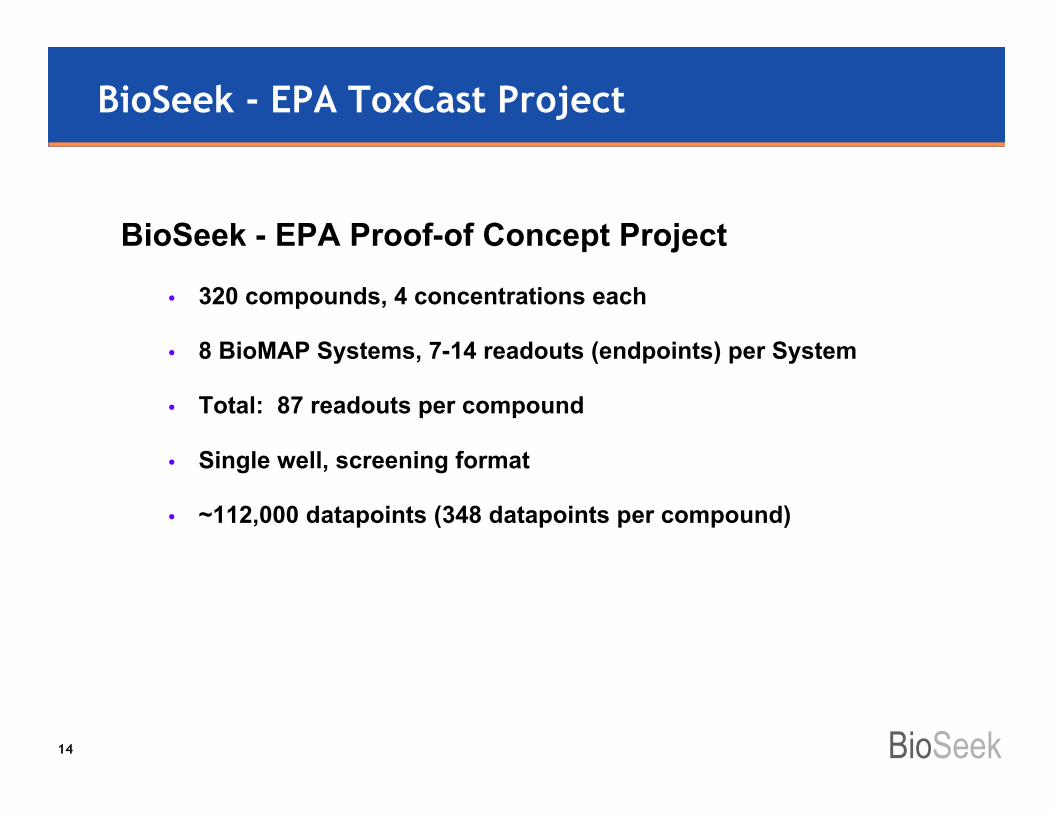
BioSeek - EPA ToxCast Project
BioSeek - EPA Proof-of Concept Project
• 320 compounds, 4 concentrations each
• 8 BioMAP Systems, 7-14 readouts (endpoints) per System
• Total: 87 readouts per compound
• Single well, screening format
• ~112,000 datapoints (348 datapoints per compound)
14
BioSeek
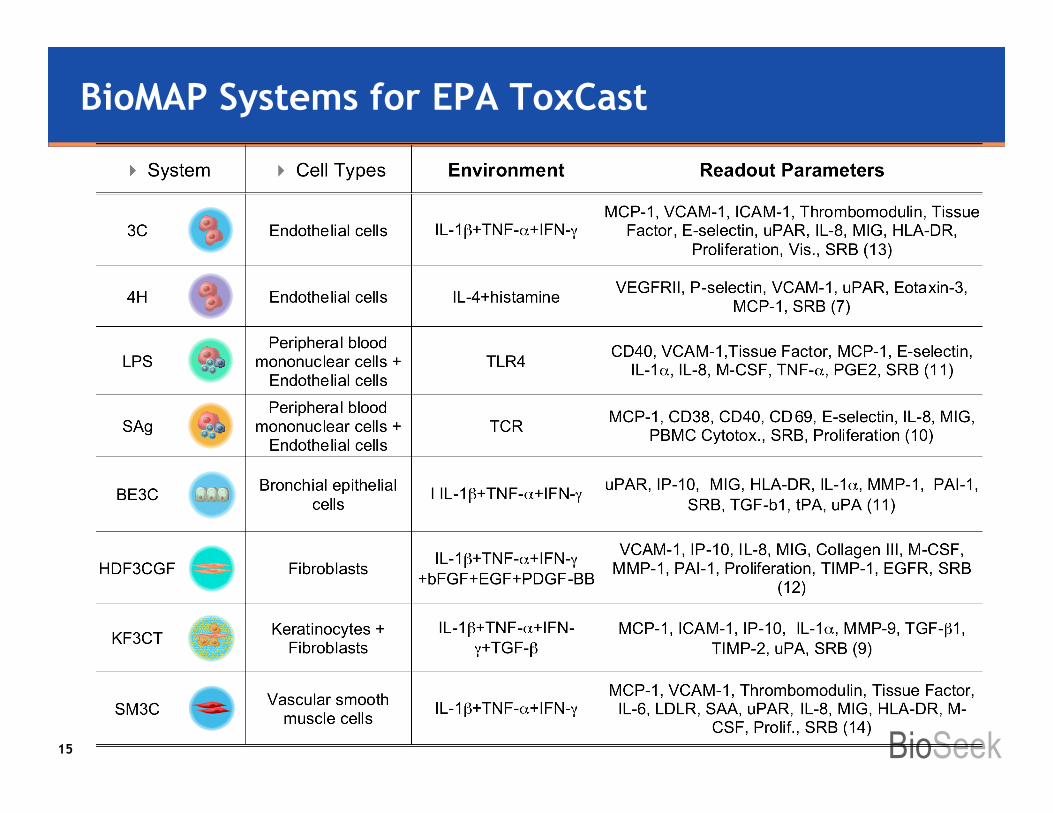
BioMAP Systems for EPA ToxCast
15

BioSeek
Reproducibility of BioMAP ProfilesPositive Control (Colchicine) Replicates
• Overlay of BioMAP profiles of positive controls (colchicine)• Each replicate represents a separate plate (template)• 99% Significance envelope is shown (grey shading)
16
BioSeek
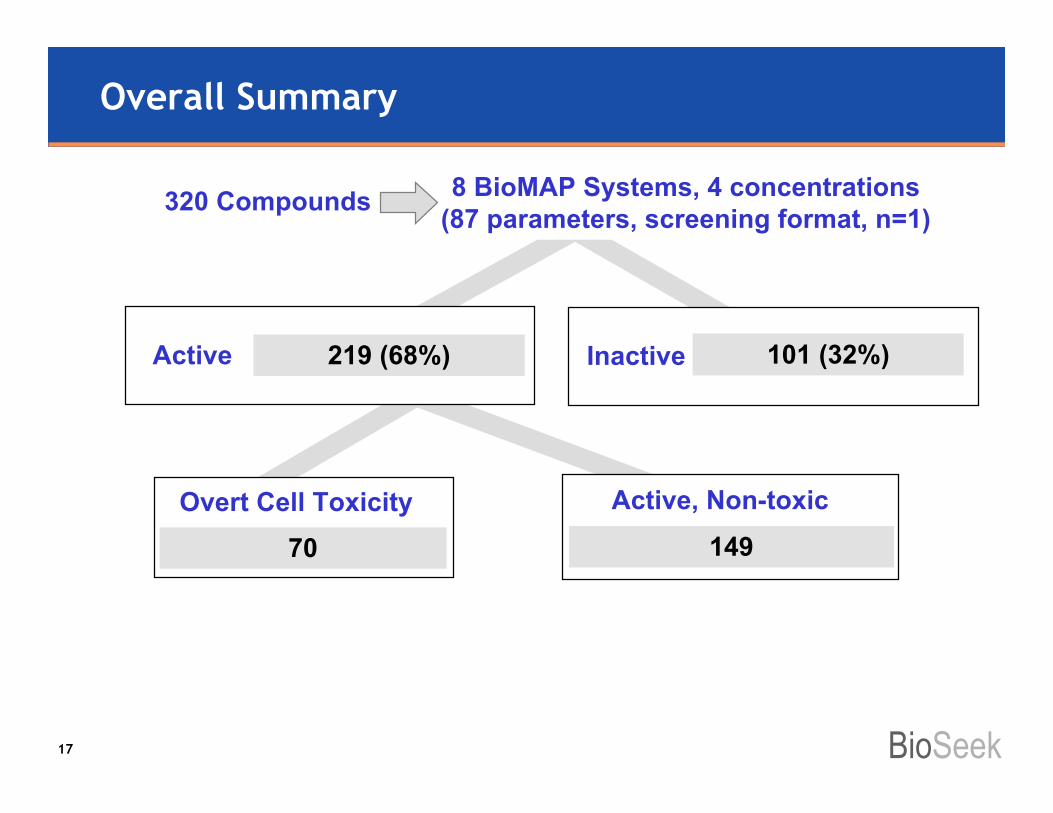
Overall Summary
320 Compounds
70
Overt Cell Toxicity
219 (68%)Active
Active, Non-toxic
Inactive
149
8 BioMAP Systems, 4 concentrations(87 parameters, screening format, n=1)
101 (32%)
17
BioSeek
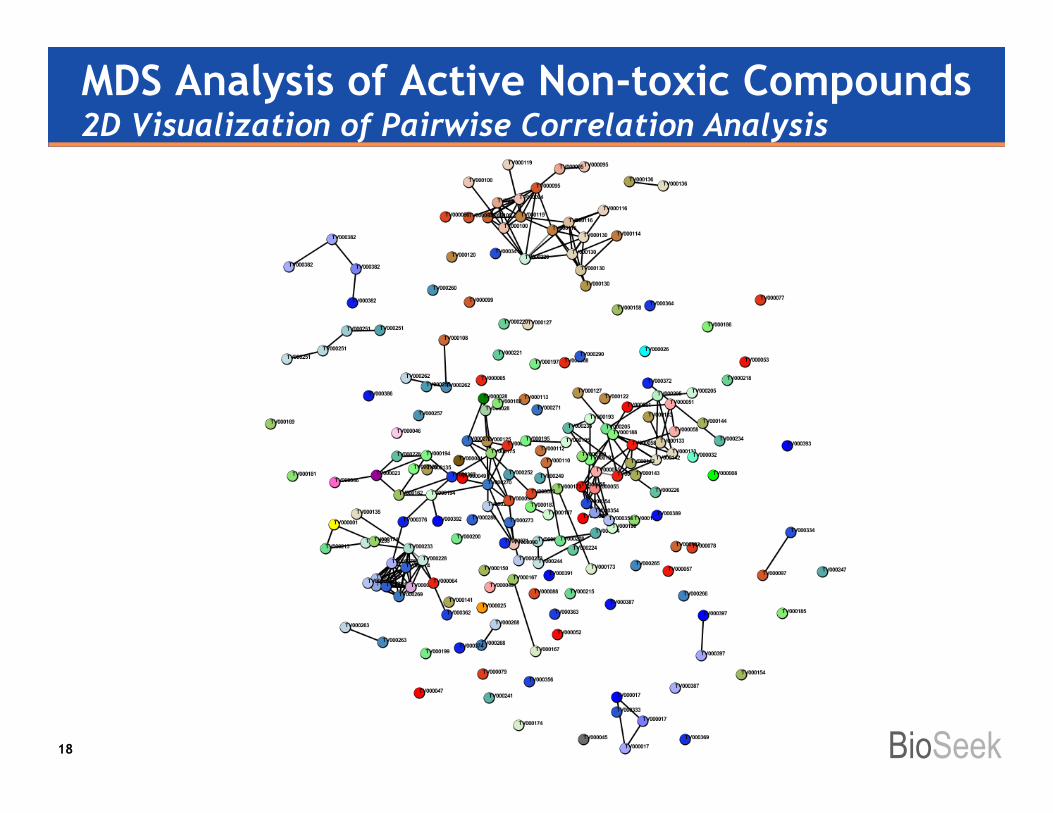
MDS Analysis of Active Non-toxic Compounds2D Visualization of Pairwise Correlation Analysis
18
BioSeek
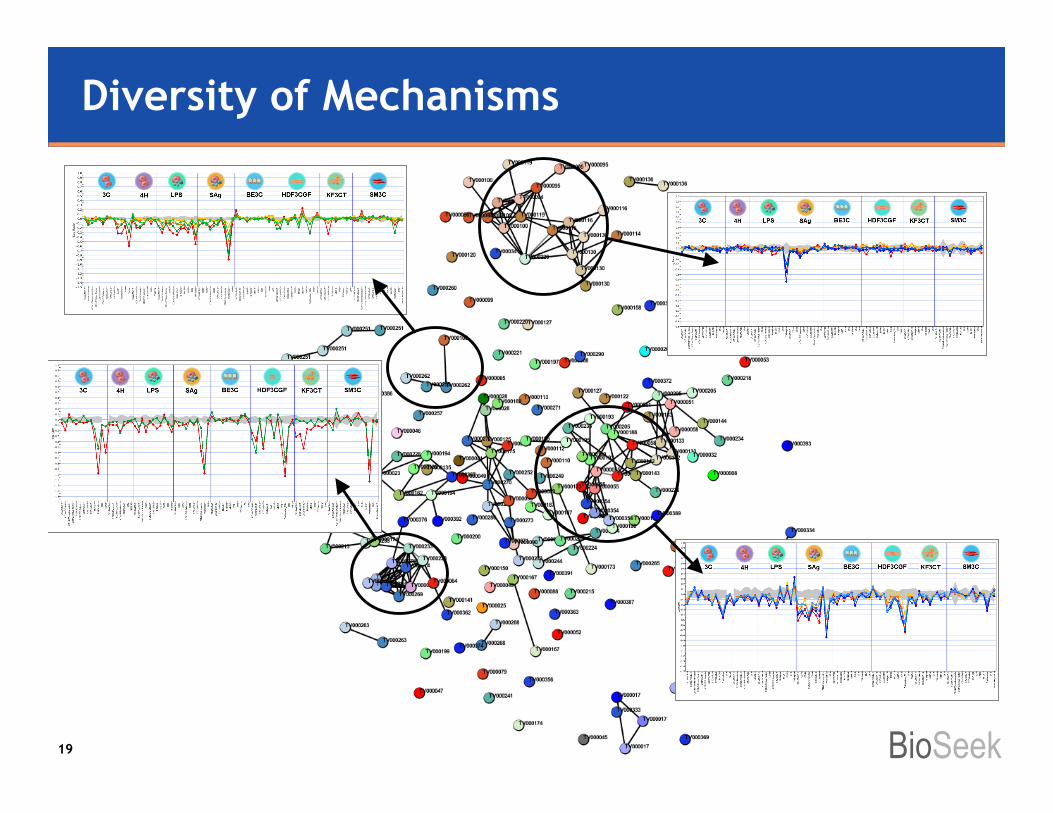
Diversity of Mechanisms
19
BioSeek
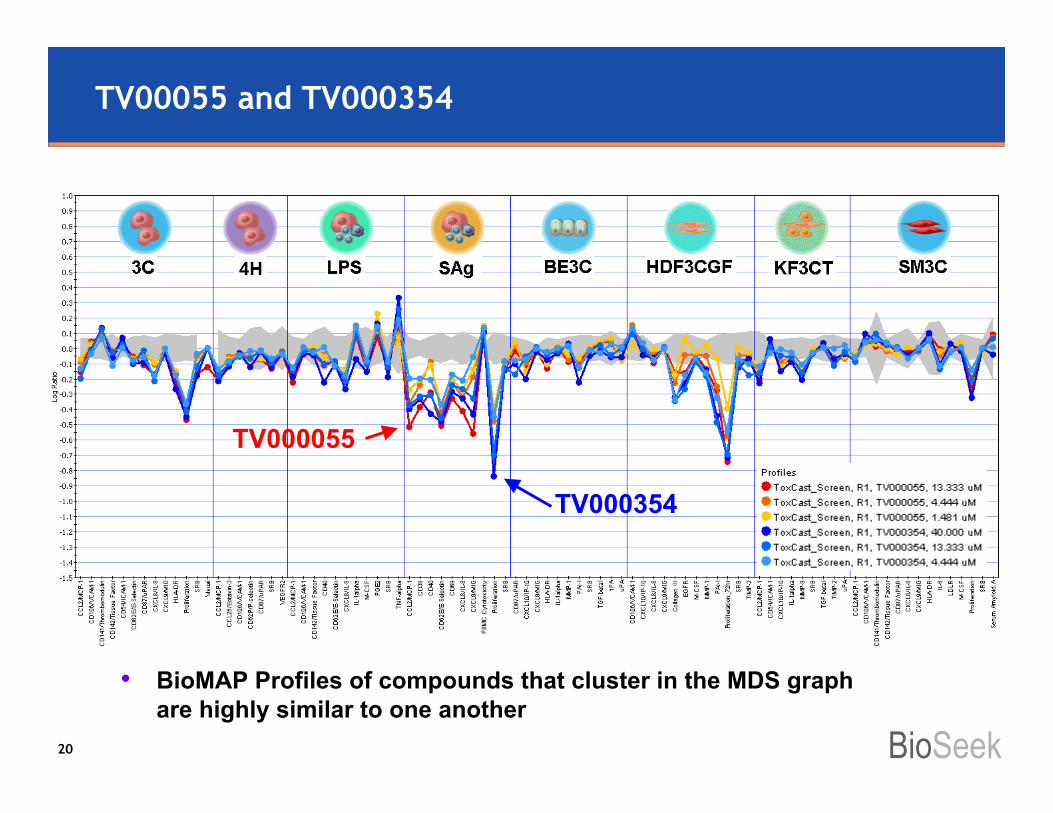
TV00055 and TV000354
TV000354
TV000055
• BioMAP Profiles of compounds that cluster in the MDS graphare highly similar to one another
20

BioSeek
BioMAP Profiles of Oligomycin A and TV000055
• Oligomycin A is an inhibitor of mitochondrial ATPase• Similarity suggests inhibition of mitochondrial function by TV000055
(TV00005 is most similar to Complex I inhibitors)
Oligomycin A
TV000055
21
BioSeek
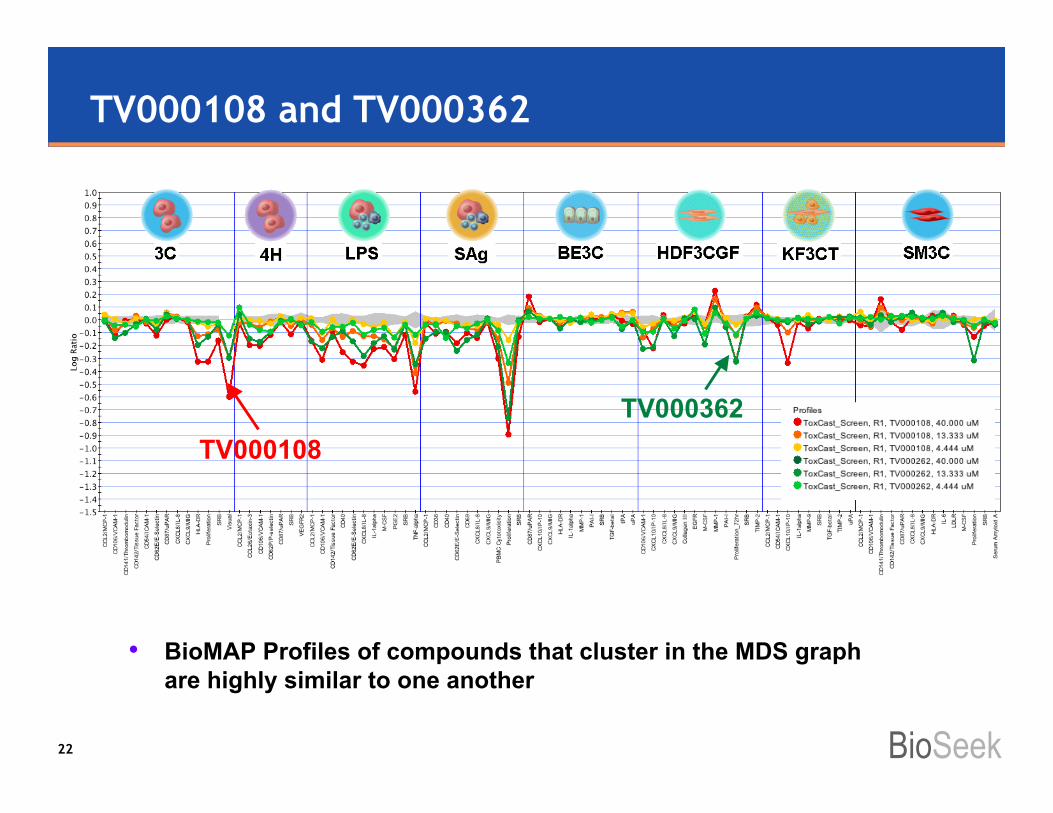
TV000108 and TV000362
• BioMAP Profiles of compounds that cluster in the MDS graphare highly similar to one another
TV000362TV000108
22
BioSeek
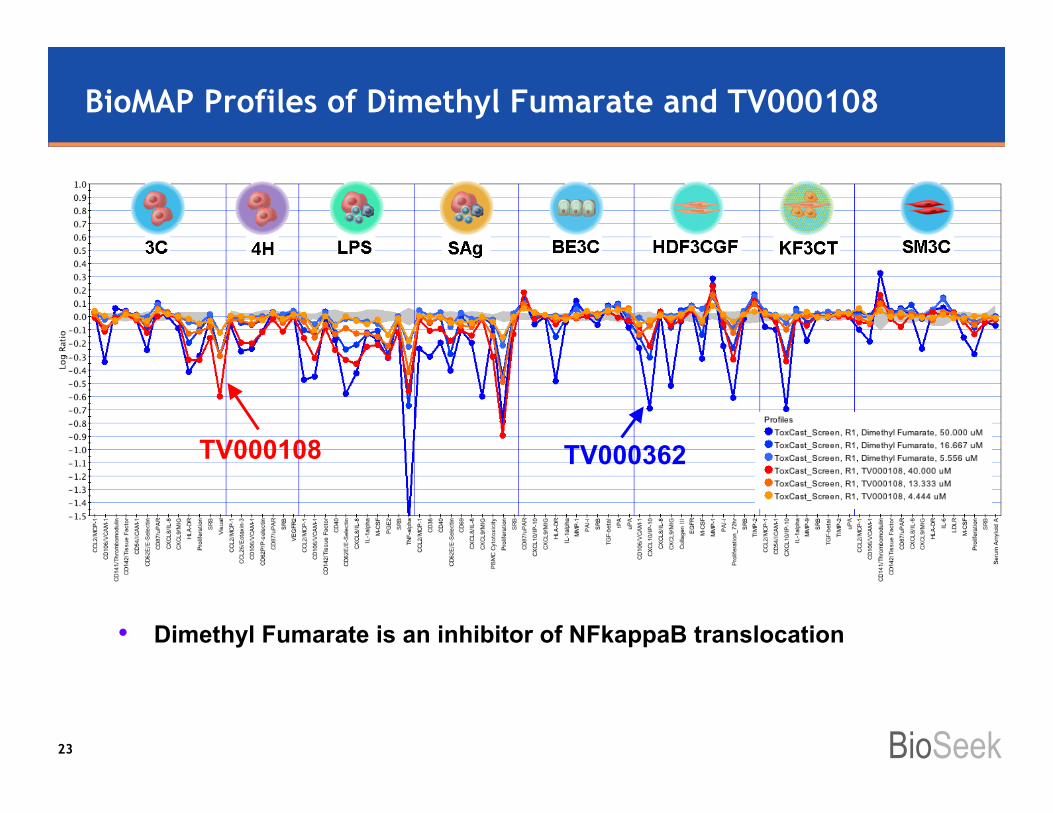
BioMAP Profiles of Dimethyl Fumarate and TV000108
• BioMAP Profiles of compounds that cluster in the MDS graphare highly similar to one another
• Dimethyl Fumarate is an inhibitor of NFkappaB translocation
TV000108 TV000362
23

BioSeek
Classification of CompoundsExample Mechanism Classes
• Mitochondria energy inhibition Electron transport chain inhibitors
• ER stress (unfolded protein response) Proteasome inhibition
DNA damage• Chlorambucil (alkylating agent)
Inhibition of translation• Cycloheximide
• Microtubule function inhibition Colchicine, vincristine, paclitaxel
24
BioSeek
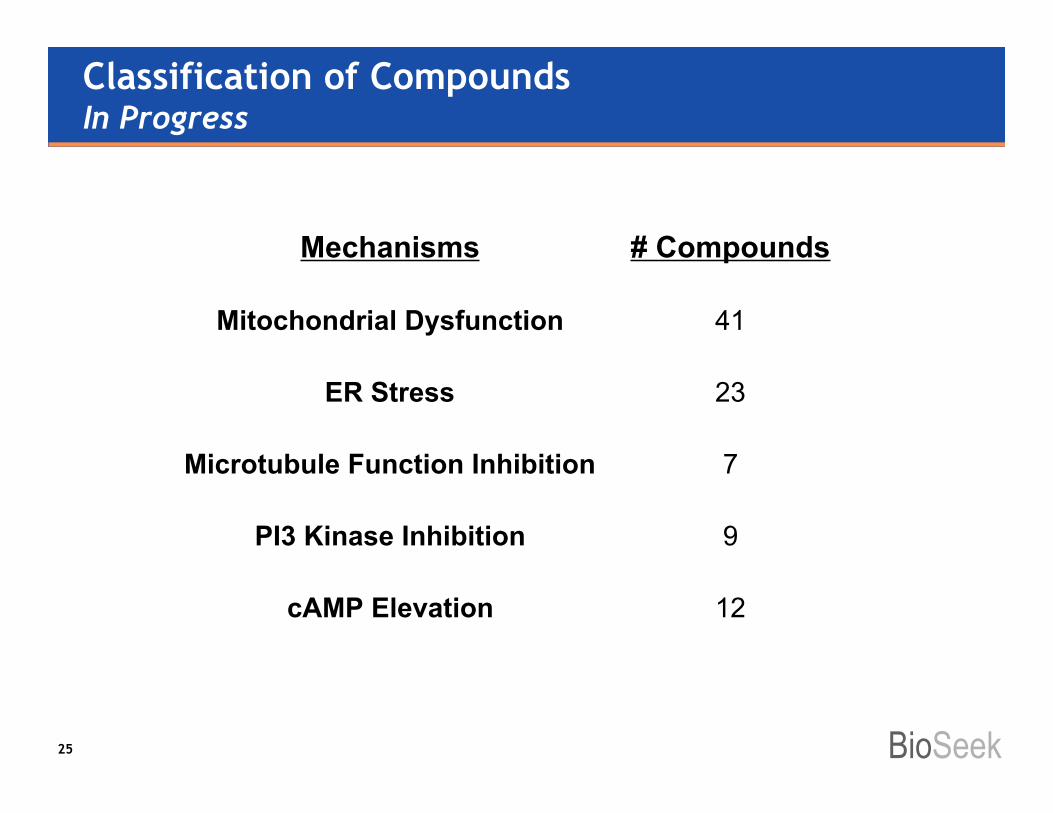
Classification of CompoundsIn Progress
Mechanisms # Compounds
Mitochondrial Dysfunction 41
ER Stress 23
Microtubule Function Inhibition 7
PI3 Kinase Inhibition 9
cAMP Elevation 12
25

BioSeek
Next Steps
• Decode compound IDs
• Complete similarity analyses
• Correlate BioMAP data with other data types
• Build classifiers for specific mechanism classes
26

BioSeek


