70
Birth control, death control and the demographic transition CHRISTOPHER DYE
| Date post: | 25-Dec-2015 |
| Category: |
Documents |
| Upload: | gregory-thornton |
| View: | 218 times |
| Download: | 1 times |

Birth control, death controland the demographic transition
CH
RIS
TO
PH
ER
DY
E

Birth control, death controland the demographic transition
CH
RIS
TO
PH
ER
DY
E
We're getting older
How did it happen?What are the consequences?What should we do?

Not true: More people are alive today than have ever died
True: Two thirds of all people who have made it to 65 in the history of mankind are alive today
"Behind every human being now living stand thirty ghosts" 2001: A Space Odyssey, Arthur C. Clarke and Stanley Kubrick

Who knows?
(but beware the prophets
of immortality)
"I think the first person to live to 1000 might be 60 already"
Aubrey de Grey
RAY KURZWEIL
AUBREY DE GREY

The demographic transition
Europe since 1500
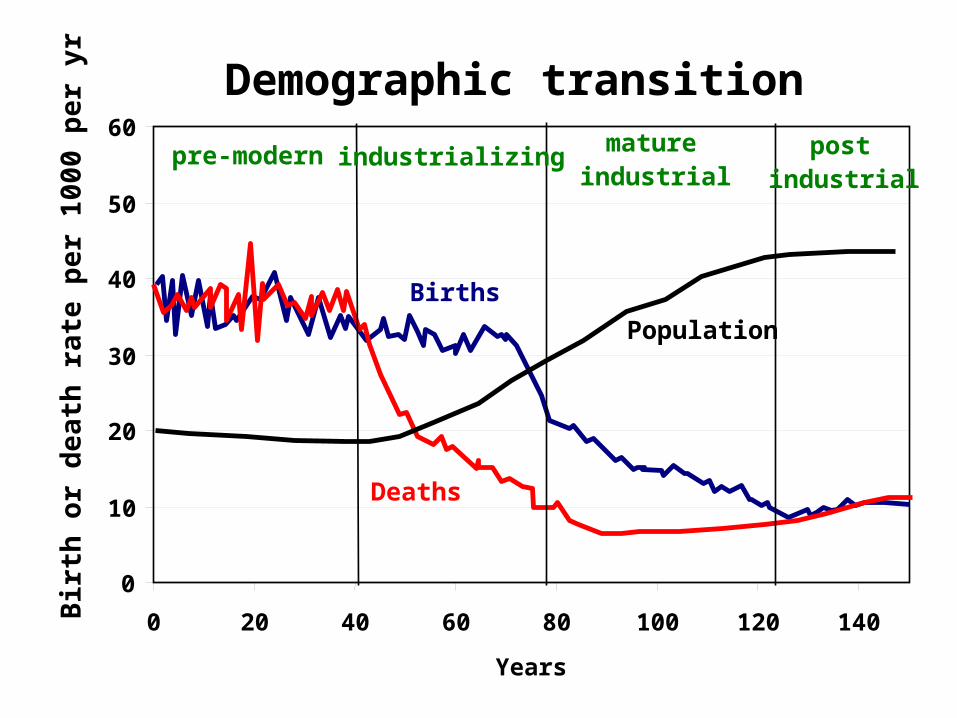
Demographic transition
0
10
20
30
40
50
60
0 20 40 60 80 100 120 140
Years
Bir
th o
r d
eath
rat
e p
er 1
000
per
yr
pre-modern industrializing mature industrial
post industrial
Deaths
Births
Population
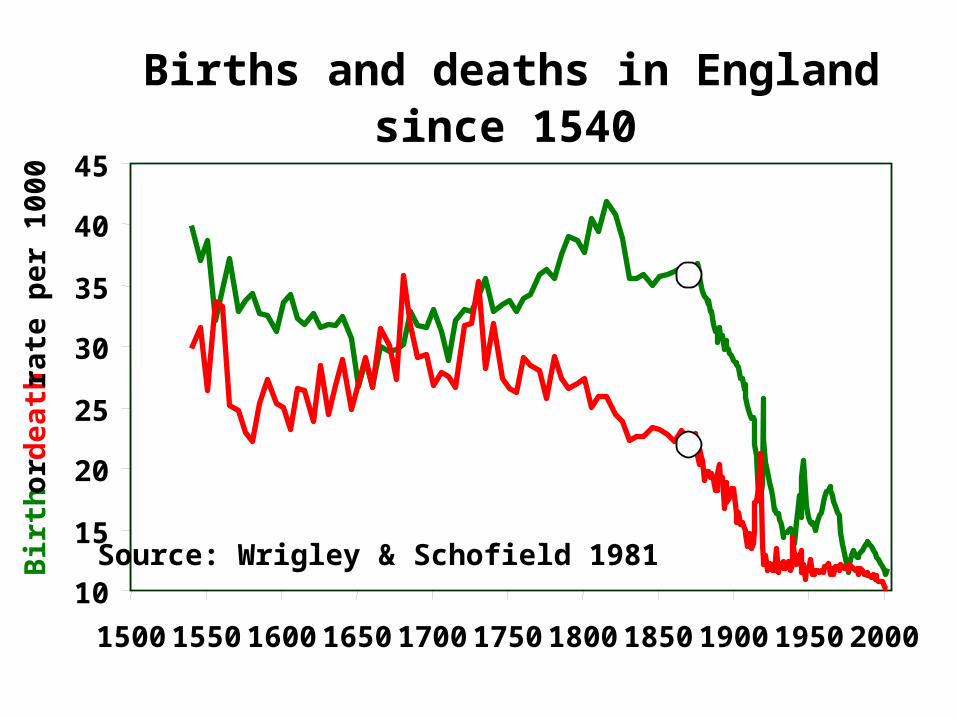
Births and deaths in Englandsince 1540
10
15
20
25
30
35
40
45
1500 1550 1600 1650 1700 1750 1800 1850 1900 1950 2000
Bir
th o
r d
eath
rat
e p
er 1
000
Source: Wrigley & Schofield 1981
20
30
40
50
60
70
80
1300 1400 1500 1600 1700 1800 1900 2000
Lif
e ex
pec
tan
cy a
t b
irth
(ye
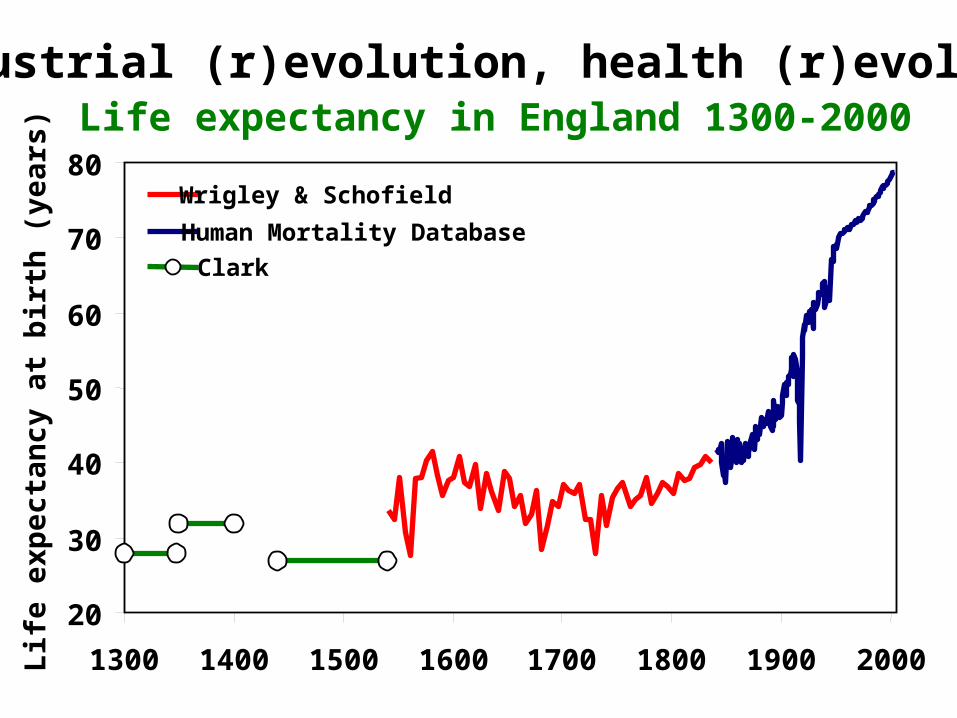
ars) Wrigley & Schofield
Human Mortality Database
Clark
Industrial (r)evolution, health (r)evolution Life expectancy in England 1300-2000

Births and deaths in Englandsince 1540
10
15
20
25
30
35
40
45
1500 1550 1600 1650 1700 1750 1800 1850 1900 1950 2000
Bir
th o
r d
eath
rat
e p
er 1
000
Source: Wrigley & Schofield 1981
0
0.5
1
1.5
1600 1650 1700 1750 1800
De
ath
mo
the
r in
pre
gn
an
cy
(%
)
0
2
4
6
8
10
1600 1650 1700 1750 1800
Pre
na
nc
y d
ea
ths
du
rin
g m
arr
iag
e (
%)
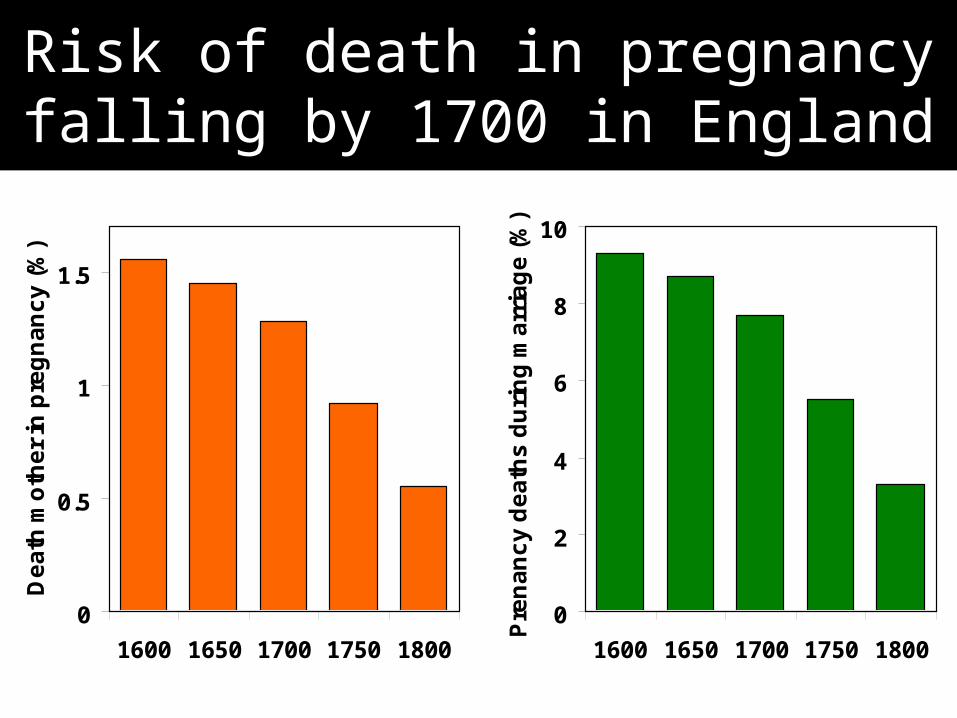
Risk of death in pregnancy falling by 1700 in England

23
24
25
26
27
28
29
1600 1650 1700 1750 1800 1850
Ag
e o
f fi
rst
ma
rria
ge
(y
r)
Men
Women
Source: Clark 2005
Safe pregnancy encouraged earlier marriage in England?
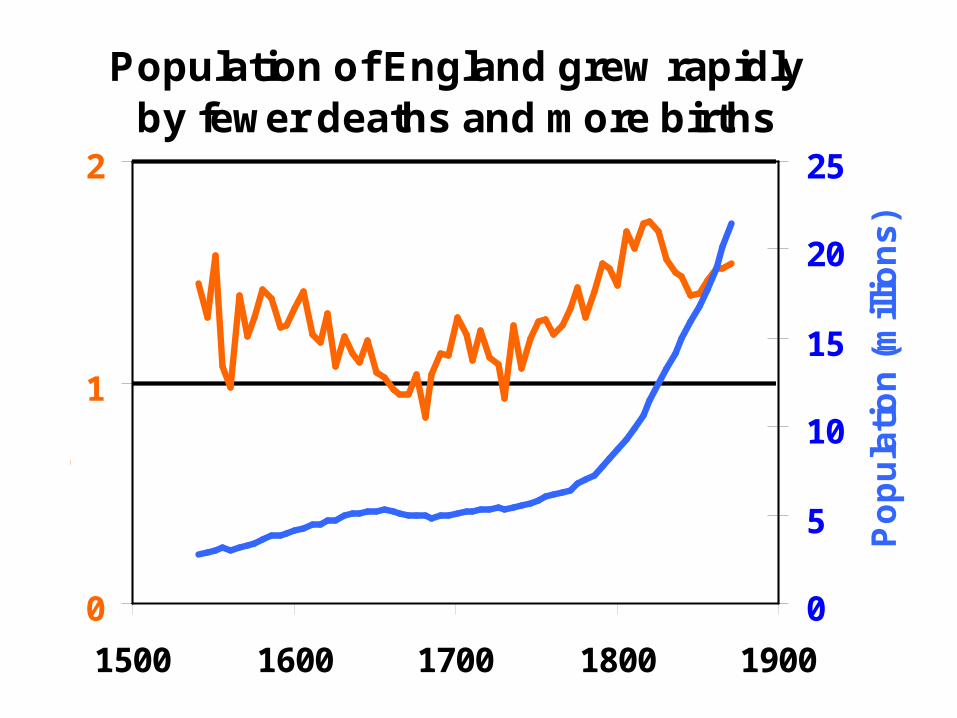
Population of England grew rapidly by fewer deaths and more births
0
1
2
1500 1600 1700 1800 1900
0
5
10
15
20
25
Po
pu
lati
on
(m
illio
ns
)
Ne
t re
pro
du
cti
ve
ra
te

Births and deaths in Englandsince 1540
10
15
20
25
30
35
40
45
1500 1550 1600 1650 1700 1750 1800 1850 1900 1950 2000
Bir
th o
r d
eath
rat
e p
er 1
000
Source: Wrigley & Schofield 1981
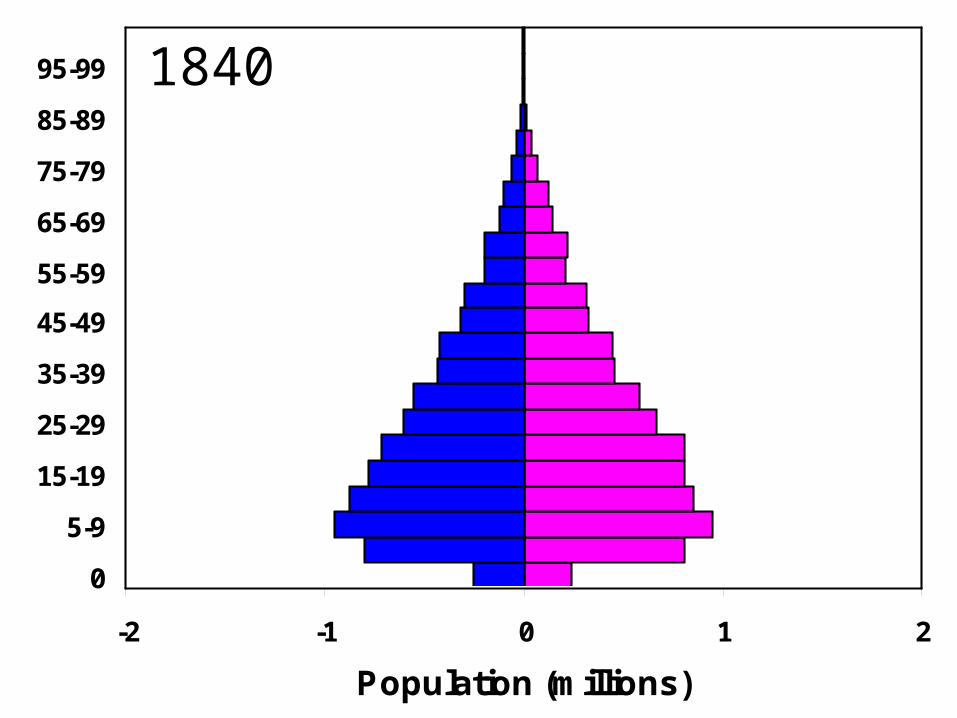
-2 -1 0 1 2
0
5-9
15-19
25-29
35-39
45-49
55-59
65-69
75-79
85-89
95-99
Population (millions)
1840

-2 -1 0 1 2
0
5-9
15-19
25-29
35-39
45-49
55-59
65-69
75-79
85-89
95-99
Population (millions)
1850

-2 -1 0 1 2
0
5-9
15-19
25-29
35-39
45-49
55-59
65-69
75-79
85-89
95-99
Population (millions)
1860

-2 -1 0 1 2
0
5-9
15-19
25-29
35-39
45-49
55-59
65-69
75-79
85-89
95-99
Population (millions)
1870

-2 -1 0 1 2
0
5-9
15-19
25-29
35-39
45-49
55-59
65-69
75-79
85-89
95-99
Population (millions)
1880

-2 -1 0 1 2
0
5-9
15-19
25-29
35-39
45-49
55-59
65-69
75-79
85-89
95-99
Population (millions)
1890
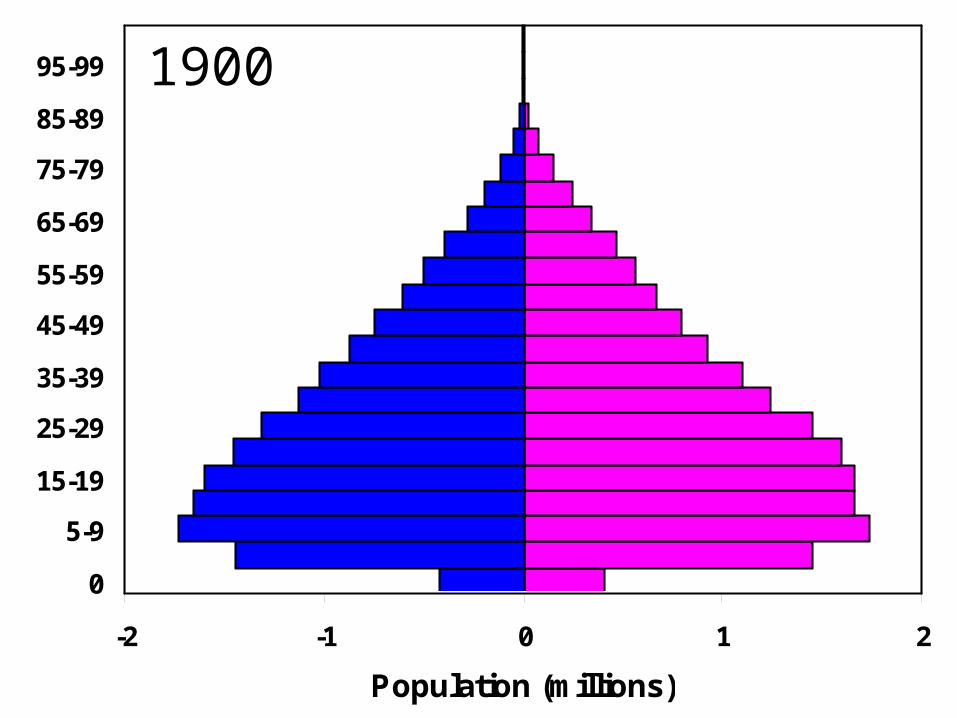
-2 -1 0 1 2
0
5-9
15-19
25-29
35-39
45-49
55-59
65-69
75-79
85-89
95-99
Population (millions)
1900

-2 -1 0 1 2
0
5-9
15-19
25-29
35-39
45-49
55-59
65-69
75-79
85-89
95-99
Population (millions)
1910

-2 -1.5 -1 -0.5 0 0.5 1 1.5 2
0
5-9
15-19
25-29
35-39
45-49
55-59
65-69
75-79
85-89
95-99
Population (millions)
1920
-2 -1.5 -1 -0.5 0 0.5 1 1.5 2
0
5-9
15-19
25-29
35-39
45-49
55-59
65-69
75-79
85-89
95-99
Population (millions)
1930

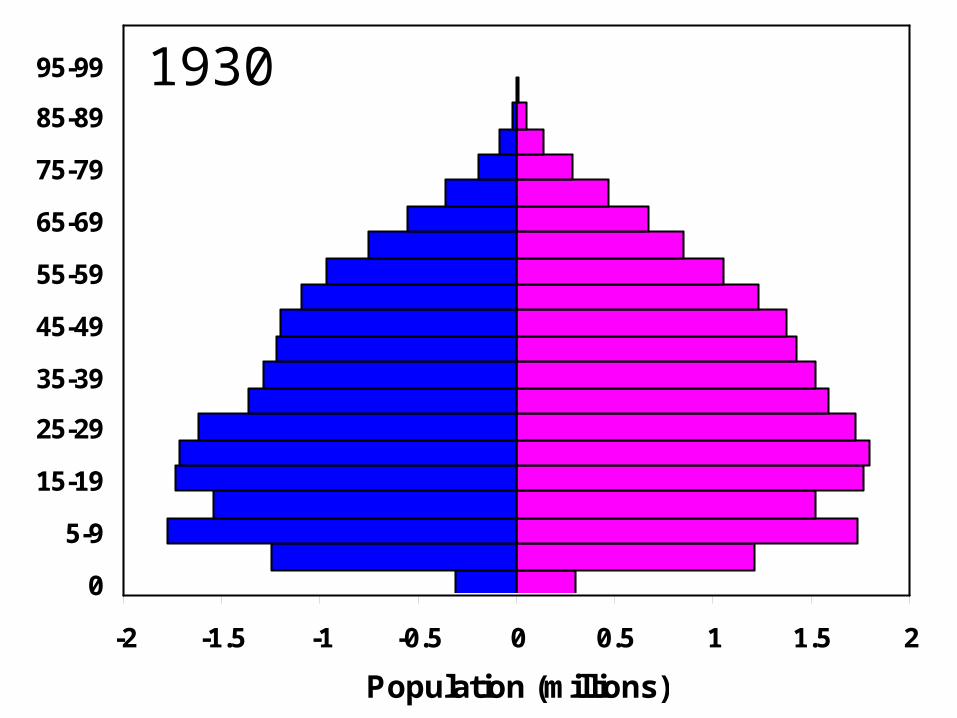
-2 -1.5 -1 -0.5 0 0.5 1 1.5 2
0
5-9
15-19
25-29
35-39
45-49
55-59
65-69
75-79
85-89
95-99
Population (millions)
1940

-2 -1.5 -1 -0.5 0 0.5 1 1.5 2
0
5-9
15-19
25-29
35-39
45-49
55-59
65-69
75-79
85-89
95-99
Population (millions)
1950
-2 -1.5 -1 -0.5 0 0.5 1 1.5 2
0
5-9
15-19
25-29
35-39
45-49
55-59
65-69
75-79
85-89
95-99
Population (millions)
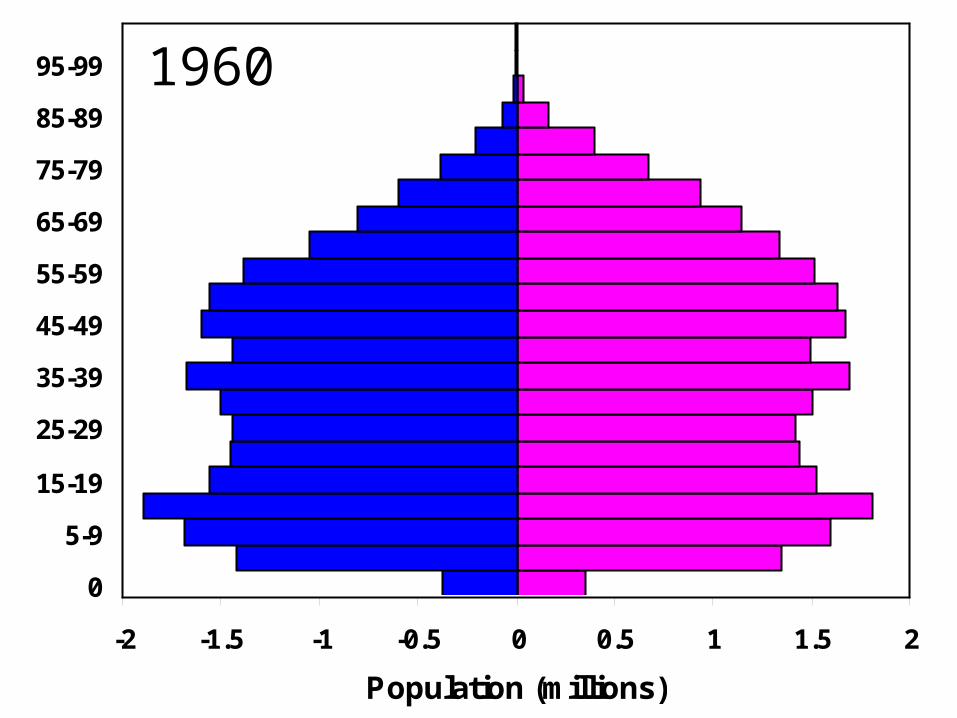
1960

-2 -1.5 -1 -0.5 0 0.5 1 1.5 2
0
5-9
15-19
25-29
35-39
45-49
55-59
65-69
75-79
85-89
95-99
Population (millions)
1970

-2 -1.5 -1 -0.5 0 0.5 1 1.5 2
0
5-9
15-19
25-29
35-39
45-49
55-59
65-69
75-79
85-89
95-99
Population (millions)
1980

-2 -1.5 -1 -0.5 0 0.5 1 1.5 2
0
5-9
15-19
25-29
35-39
45-49
55-59
65-69
75-79
85-89
95-99
Population (millions)
1990
-2 -1.5 -1 -0.5 0 0.5 1 1.5 2
0
5-9
15-19
25-29
35-39
45-49
55-59
65-69
75-79
85-89
95-99
Population (millions)
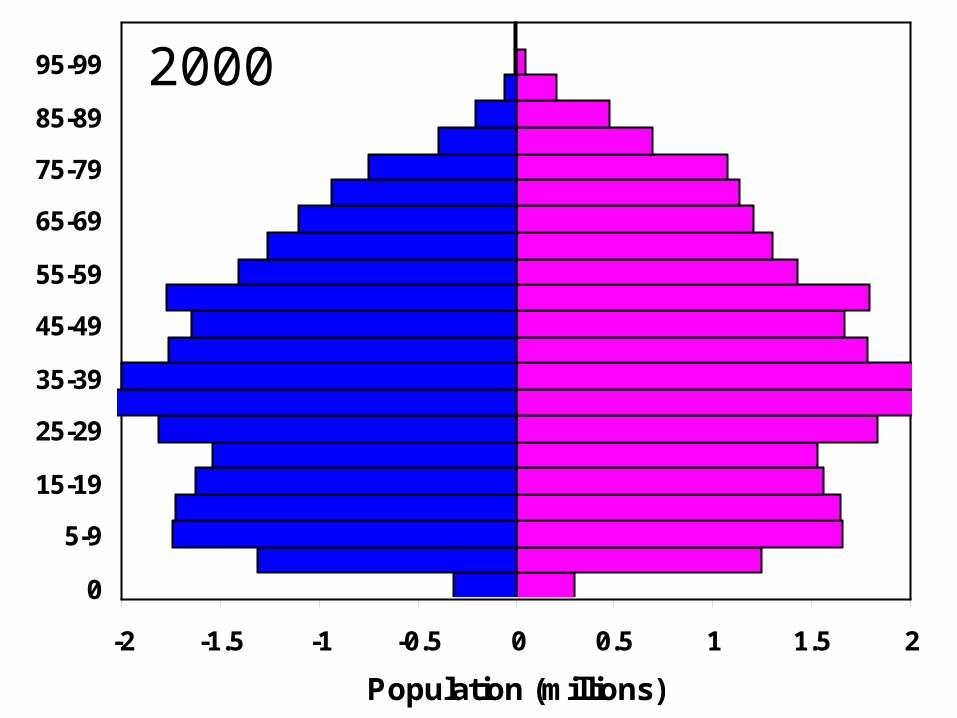
2000

-2 -1.5 -1 -0.5 0 0.5 1 1.5 2
0
5-9
15-19
25-29
35-39
45-49
55-59
65-69
75-79
85-89
95-99
Population (millions)
2004

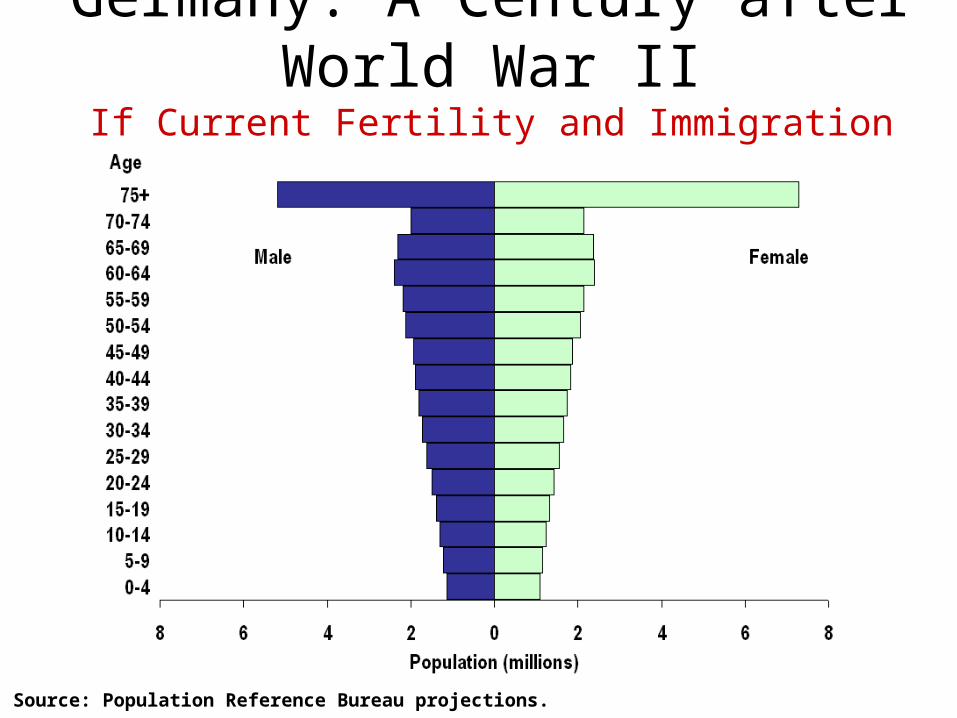
The coming face of GermanyPopulation "pyramids" in 1910, 2005,
and 2025
JW Vaupel, Science (2006)
Post WW2 baby boom
Few men – war dead
Long-term fertility decline
Fall births

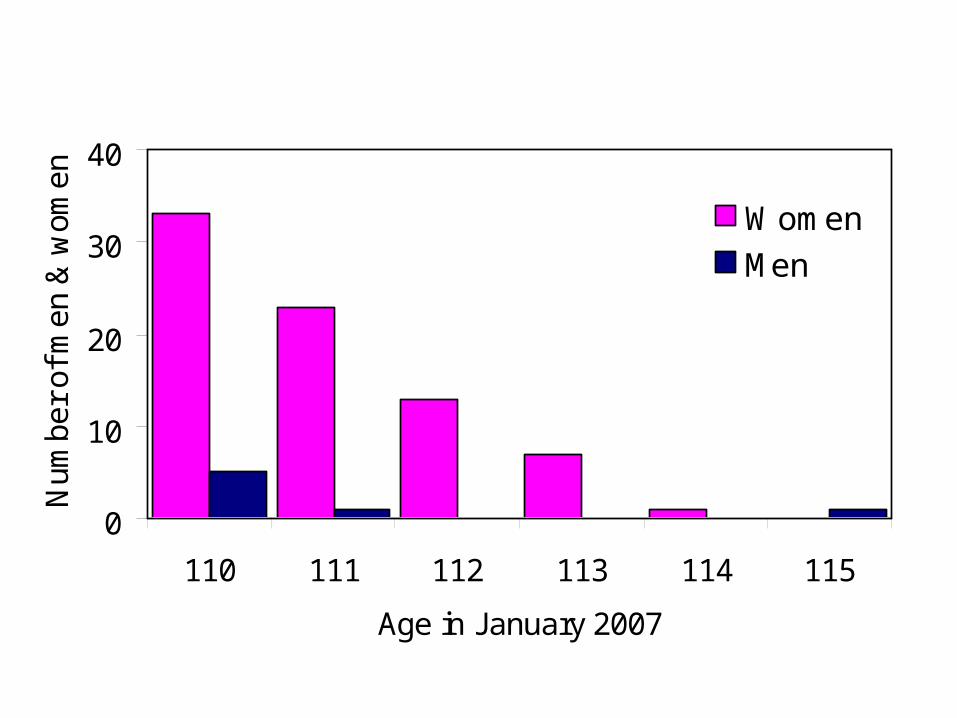
News - World's oldest woman dies at 115She was officially proclaimed the world's oldest woman, and the second oldest person, after the death of American Elizabeth Bolden in December.19 Jan 2007News - 'Oldest' woman dies at age of 111She shared her birthday with Britain's oldest man, Henry Allingham, who turned 110 in June. The oldest person in the world is 116-year-old Elizabeth Bolden, of Memphis, Tennessee.29 Nov 2006News - World's oldest woman dies at 116Capovilla's likely successor as oldest woman is an American, Elizabeth Bolden of Memphis, Tennessee, said Mr Young.28 Aug 2006News - UK's oldest woman dies aged 111She became the country's oldest person on 1 March this year when 112-year-old Judy Ingamells died.2 Aug 2006News - Birthday 111 for 'oldest' womanA woman believed to be Scotland's oldest person reaches her 111th birthday in Aberdeen.. 6 Jun 2006
0
10
20
30
40
110 111 112 113 114 115
Age in January 2007
Num
ber
of m
en &
wom
en
Women
Men
Supercentenarians alive in Jan 200777 women + 7 men
Validated Living Supercentenarians: www.grg.org/Adams/E.HTM
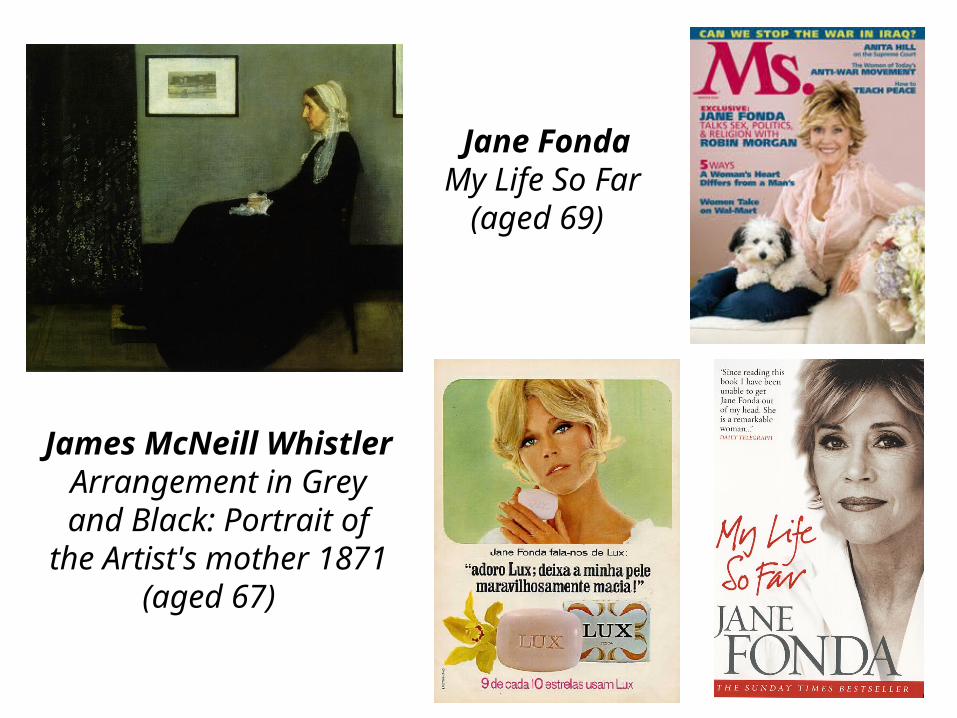
James McNeill Whistler
Arrangement in Grey and Black: Portrait of the
Artist's mother 1871 (aged 67)
Jane FondaMy Life So Far
(aged 69)

Pyramids and totem polesDeveloping countries
emerging from the pre-modern era

Source: United Nations, World Population Prospects: The 2004 Revision (2005).
Population by age and sex, less developed countries, 2005
Pyramids and….Young Population in Developing Countries Has Great Potential for Growth
Source: United Nations, World Population Prospects: The 2004 Revision (2005).
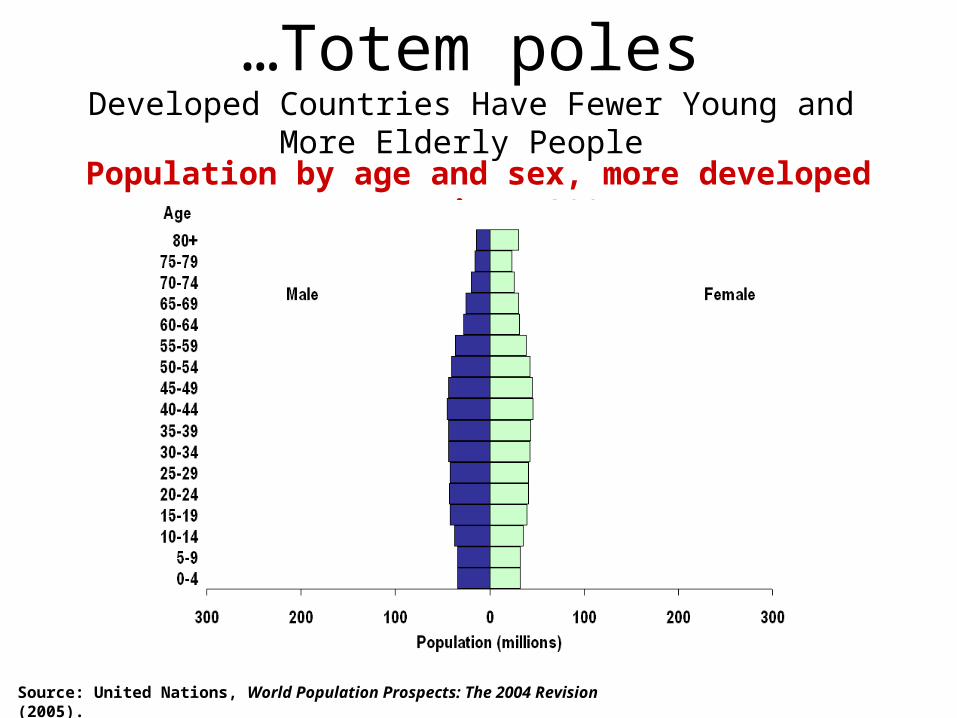
Population by age and sex, more developed countries, 2005
…Totem polesDeveloped Countries Have Fewer Young and More Elderly People
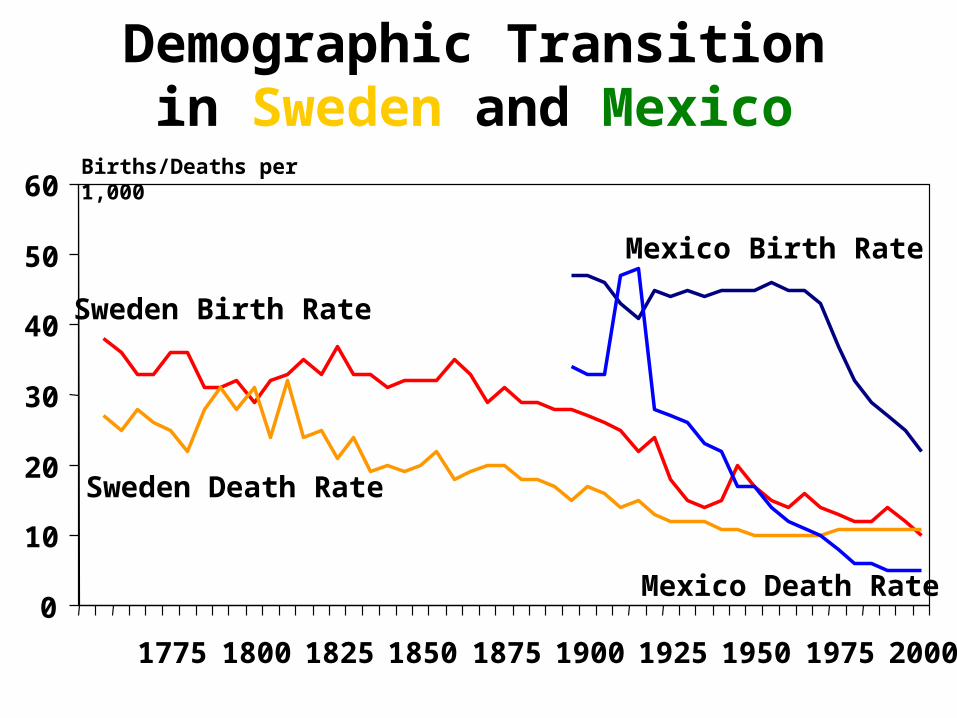
Demographic Transition in Sweden and Mexico
Births/Deaths per 1,000
0
10
20
30
40
50
60
1775 1800 1825 1850 1875 1900 1925 1950 1975 2000
Sweden Birth Rate
Sweden Death Rate
Mexico Birth Rate
Mexico Death Rate

Which means that….
Country Growth Doubling time
1.3%/year 50 years
3.5%/year 20 years
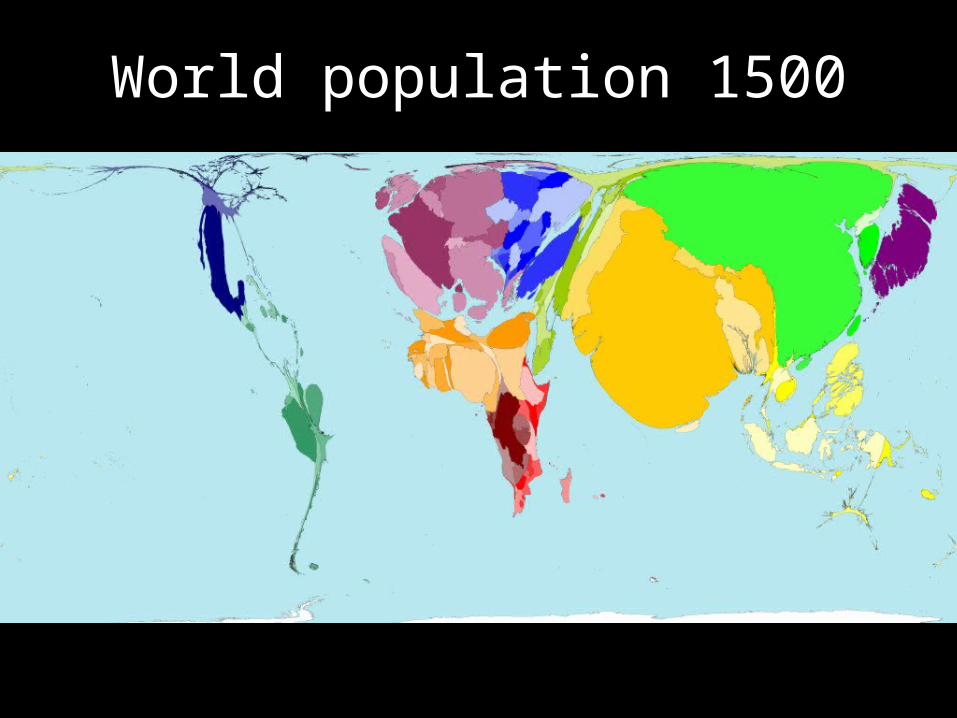
World population 1500

World population 2000

Births 2000

Teenage mothers 2000

The demographic
division andthe future of world
population

6 billion by 2000
more developed countries
less developed countries
Nine billion people by 2050?
0
2
4
6
8
10
12
1950 1960 1970 1980 1990 2000 2010 2020 2030 2040 2050
Po
pu
lati
on
(b
illio
ns)
More developed
Less developed
World population
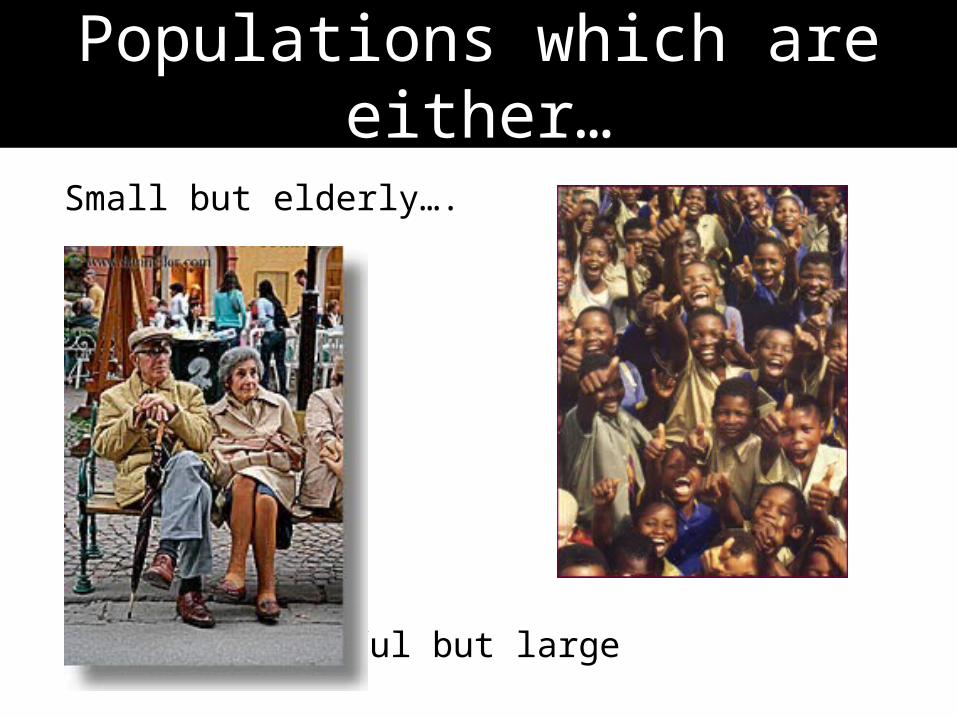
Populations which are either…
Small but elderly….
…or youthful but large
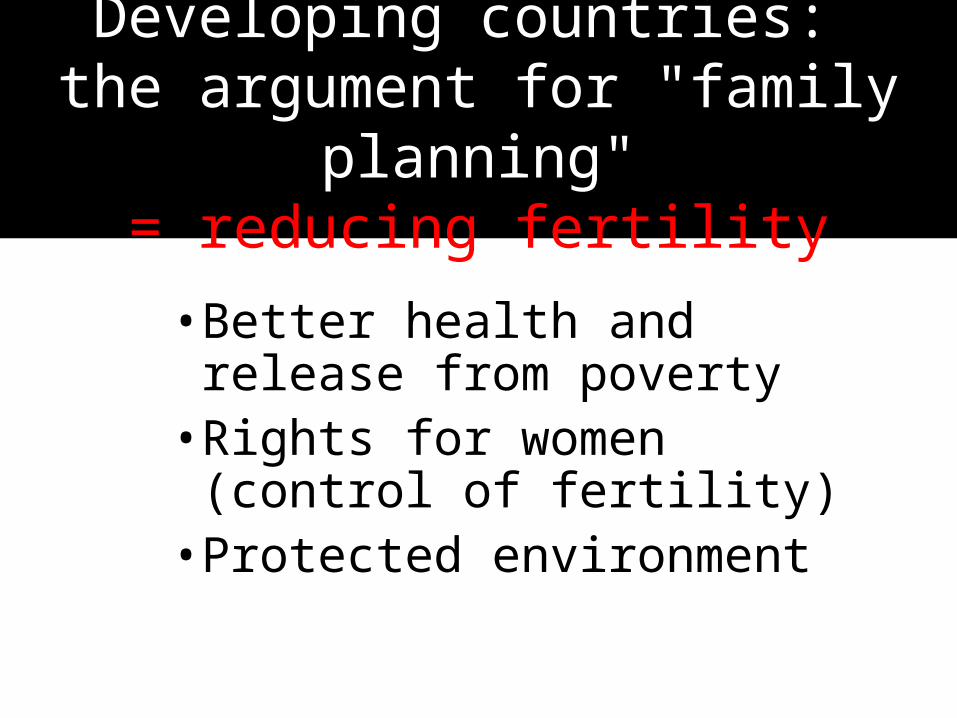
Developing countries: the argument for "family planning"
= reducing fertility
• Better health and release from poverty
• Rights for women (control of fertility)
• Protected environment

Source: United Nations, World Population Prospects: The 2004 Revision, CD-ROM Edition, Extended Dataset (2005).
Pakistan 2005 and 2050Today’s Youth, Tomorrow’s Labour Force
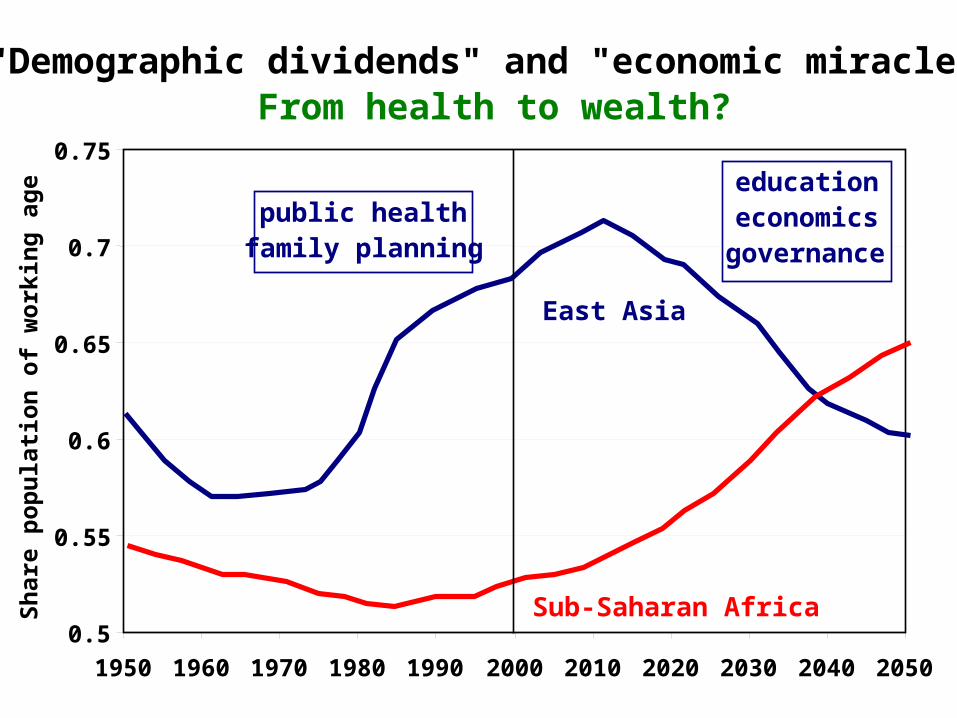
One third economic growth from
"demographic gift"
0.5
0.55
0.6
0.65
0.7
0.75
1950 1960 1970 1980 1990 2000 2010 2020 2030 2040 2050
Sh
are
po
pu
lati
on
of
wo
rkin
g a
ge
East Asia
Sub-Saharan Africa
"Demographic dividends" and "economic miracles"From health to wealth?
educationeconomicsgovernance
public healthfamily planning
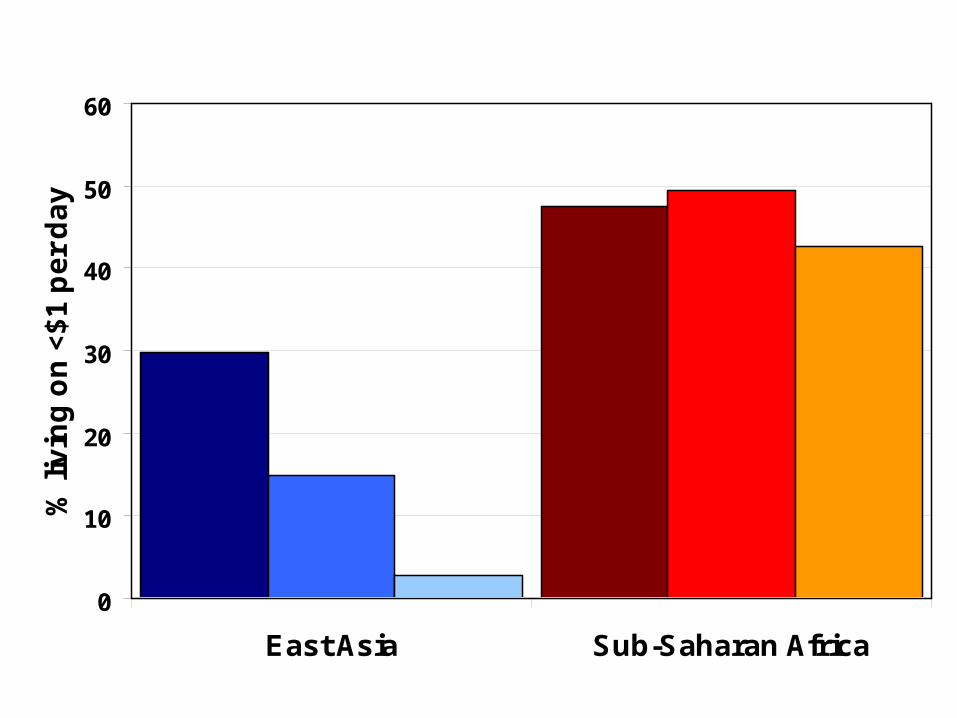
0
10
20
30
40
50
60
East Asia Sub-Saharan Africa
% li
vin
g o
n <
$1
pe
r d
ay
Africa awaits the economic miracle
1990 2008 2015

Source: United Nations, World Population Prospects: The 2004 Revision, CD-ROM Edition, Extended Dataset (2005)
South Africa 2020Without AIDS: youth bulge

Source: United Nations, World Population Prospects: The 2004 Revision, CD-ROM Edition, Extended Dataset (2005)
South Africa 2020With AIDS: Loss of the middle-aged

Carl Djerassi & Co 1950sgiving women control of fertility

Fertility around the world Total fertility rate
Average number of children born to each woman
in 2005

Kenya contraceptives reduce fertility
3
4
5
6
7
8
9
1975 1980 1985 1990 1995 2000 2005
Bir
ths
pe
r w
om
an
0
5
10
15
20
25
30
35
Co
ntr
ac
ep
tiv
e u
se
(%
)
Fertility
Contraceptives

Population growth slows in Kenyabut will there still be too many people?
0
5
10
15
20
1980 1990 2000 2010 2020
Mil
lio
ns
of
wo
men

Impending disaster in Niger?SUMMER 2004
Locust infestation resulting in widespread crop and pasture losses
Poor rainy season with rainfall ending earlier than usual
Cereal and fodder harvest insufficient
JANUARY 2005
Higher than average incidence of severe and moderate malnutrition
MARCH 2005
Rapid rise in cereal prices combined with a drop in livestock prices
JULY 2005
Niger government’s food security measures, taken in collaboration with numerous donors, are insufficient to tackle the growing crisis
Tuareg family have to sell half their cattle to buy enough feed for the other half

Impending disaster in Niger?
Population 2006 14m
Population 2050 82m
Fertility rate 7.5
Desired children 8.2
Contraceptive use 4.6%
Life expectancy 43yr
Grain production 85%
Children stunted 40%
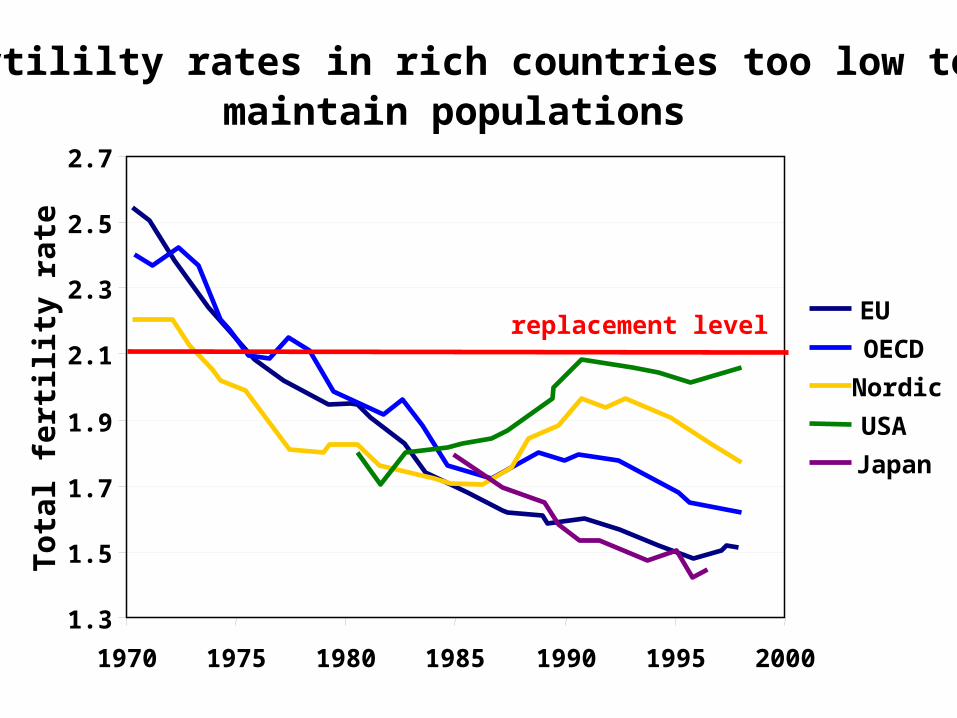
Fertililty rates in rich countries too low to maintain populations
1.3
1.5
1.7
1.9
2.1
2.3
2.5
2.7
1970 1975 1980 1985 1990 1995 2000
To
tal f
ert
ility
ra
te
EU
OECD
Nordic
USA
Japan
replacement level
Source: Population Reference Bureau projections.
Germany: A Century after World War IIIf Current Fertility and Immigration Rates Continue to 2050…

"A fertility rate of 1.7 is a disaster if you look a couple of generations down the line”
“Urban areas in… Europe…filled with empty buildings and crumbling infrastructure…"
David Reher
Industrial world: the argument for increasing fertility

The "Population Bomb" defused?
"We took a first cut at… what is an optimal human population, and came up with… 2 billion"
"Population shrinkage is a hugely positive trend"Paul Ehrlich

Work longer, save moreHow to redistribute work in an aging population?
Average hours to be worked per week in Germany
JW Vaupel, Science 312, 1911 -1913 (2006)
16.3 hr/person 2005
16.3 hr/person 2025 older people
16.3 hr/person 2025 young &
old people

Human population will stabilize in 21st century?
0
5
10
15
20
25
2000 2020 2040 2060 2080 2100 2120 2140
Bil
lion
s o
f p
eo
ple
lower fertility - lower life expectancy
higher fertility - higher life expectancy

How many dependents in 2050?
0
0.1
0.2
0.3
0.4
0.5
0.6
0.7
2000 2020 2040 2060 2080 2100 2120 2140
Fra
cti
on
of
po
pu
lati
on 15-59 years
0-14 years
60+ years
About half the population in 2150 -
retirement age?
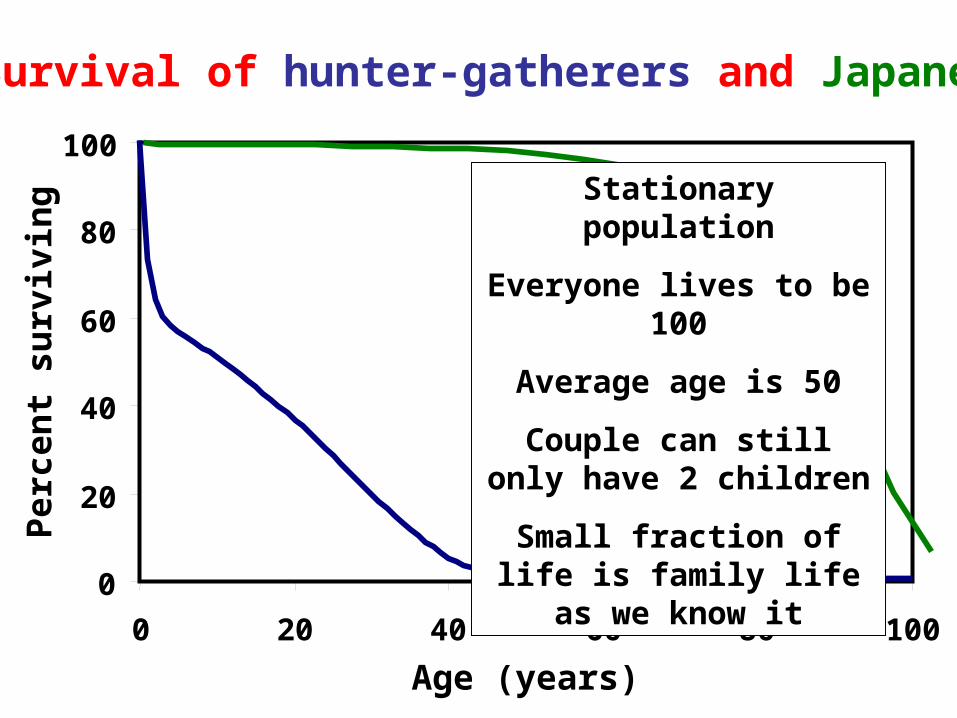
0
20
40
60
80
100
0 20 40 60 80 100
Age (years)
Pe
rce
nt
su
rviv
ing
Survival of hunter-gatherers and Japanese
Stationary population
Everyone lives to be 100
Average age is 50
Couple can still only have 2 children
Small fraction of life is family life as we know it

''I dream, I think, I go over my life, I never get bored''
Born 1875
Meets van Gogh 1889
Daughter dies 1934
Husband dies 1946
Grandson dies 1963
Quits smoking 1994
Dies age 122 1997Jeanne Calment
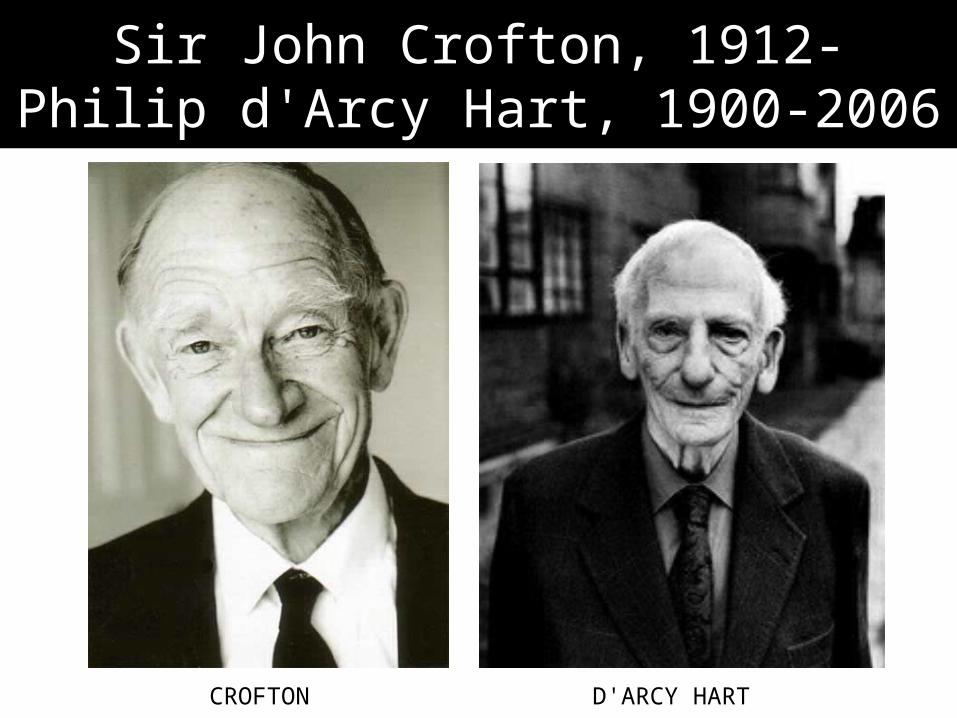
Sir John Crofton, 1912-Philip d'Arcy Hart, 1900-2006
CROFTON D'ARCY HART
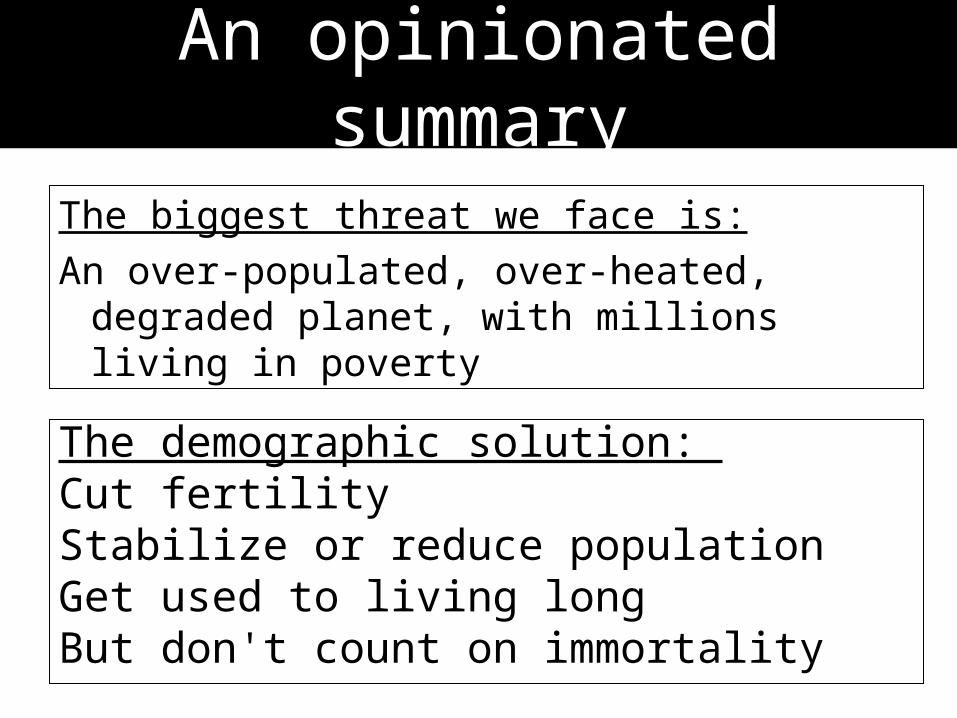
An opinionated summary
The biggest threat we face is:
An over-populated, over-heated, degraded planet, with millions living in poverty
The demographic solution: Cut fertilityStabilize or reduce populationGet used to living longBut don't count on immortality


