Page 1 of 17 Black-Tailed Prairie Dog Habitat within Little Bighorn Battlefield National Monument. Final Report to the National Park Service A Rocky Mountain Cooperative Ecosystems Studies Unit Task Agreement with the University of Wyoming Research Services Performed by the Wyoming Geographic Information Science Center over the period August 1 to December 31, 2011. Principal Investigator Eli Rodemaker Background In 2011 the Wyoming Geographic Information Science Center (WYGISC) agreed to assist the National Park Service (NPS) investigate appropriate ways to map the distribution of Black Tailed Prairie Dog (BTPD) habitat at the Custer and Reno-Benteen Battlefield areas of the Little Bighorn Battlefield National Monument (LIBI) in Montana. The BTPD was once native to LIBI and is still found within five miles or less of monument (Appendix A of this report shows a map of local prairie dog counties). The NPS desired an efficient means of assessing prairie dog habitat within the monument. The products are expected to aid in planning processes for LIBI management and in assessing possible reintroduction of the prairie dog. The BTPD is a species that is vital, as prey, to the Black Footed Ferret one of the most endangered animals in the United States. Previous examples of prairie dog mapping have been conducted with remotely sensed and Geographic Information System (GIS) data. By analyzing a combination of environmental and remotely sensed variables, the studies were able to develop models that can be used to map BTPD habitat. Interestingly two previous studies were conducted near the Little Bighorn. One study by Assal and Lockwood (2007) mapped existing BTPD habitat (colonies) on a 550 km 2 site within the Thunder Basin National Grassland in northeastern Wyoming using Landsat7 satellite imagery, Wyoming GAP Analysis Land Cover for 1996, 1:24,000 scale SSURGO soils, and a 30m Digital Elevation Model (DEM) from the US Geological Survey. They found that using a GIS model with remotely sensed imagery provided an ‘inexpensive coarse-filter approach’ for finding possible BTPD colonies and should be complemented with a more detailed analysis of the possible colony areas. In our case at LIBI there currently are no BTPD colonies that could be distinguished on imagery. Another study by Proctor, Beltz, and Haskins (1998) was conducted for the Charles M. Russell and UL Bend National Wildlife Refuges and Phillips County, Montana. In this study the investigators used the locations of known BTPD colonies to build a GIS model from environmental layers and then used the model to map potential BTPD for southern Phillips County to provide a test of the model and map
Transcript
Page 1 of 17
Black-Tailed Prairie Dog Habitat within Little Bighorn Battlefield National Monument.
Final Report to the National Park Service
A Rocky Mountain Cooperative Ecosystems Studies Unit Task Agreement with
the University of Wyoming
Research Services Performed by the Wyoming Geographic Information Science Center over
the period August 1 to December 31, 2011.
Principal Investigator Eli Rodemaker
Background
In 2011 the Wyoming Geographic Information Science Center (WYGISC) agreed to assist the National
Park Service (NPS) investigate appropriate ways to map the distribution of Black Tailed Prairie Dog
(BTPD) habitat at the Custer and Reno-Benteen Battlefield areas of the Little Bighorn Battlefield National
Monument (LIBI) in Montana. The BTPD was once native to LIBI and is still found within five miles or
less of monument (Appendix A of this report shows a map of local prairie dog counties). The NPS
desired an efficient means of assessing prairie dog habitat within the monument. The products are
expected to aid in planning processes for LIBI management and in assessing possible reintroduction of
the prairie dog. The BTPD is a species that is vital, as prey, to the Black Footed Ferret one of the most
endangered animals in the United States.
Previous examples of prairie dog mapping have been conducted with remotely sensed and Geographic
Information System (GIS) data. By analyzing a combination of environmental and remotely sensed
variables, the studies were able to develop models that can be used to map BTPD habitat. Interestingly
two previous studies were conducted near the Little Bighorn. One study by Assal and Lockwood (2007)
mapped existing BTPD habitat (colonies) on a 550 km2 site within the Thunder Basin National Grassland
in northeastern Wyoming using Landsat7 satellite imagery, Wyoming GAP Analysis Land Cover for 1996,
1:24,000 scale SSURGO soils, and a 30m Digital Elevation Model (DEM) from the US Geological Survey.
They found that using a GIS model with remotely sensed imagery provided an ‘inexpensive coarse-filter
approach’ for finding possible BTPD colonies and should be complemented with a more detailed analysis
of the possible colony areas. In our case at LIBI there currently are no BTPD colonies that could be
distinguished on imagery.
Another study by Proctor, Beltz, and Haskins (1998) was conducted for the Charles M. Russell and UL
Bend National Wildlife Refuges and Phillips County, Montana. In this study the investigators used the
locations of known BTPD colonies to build a GIS model from environmental layers and then used the
model to map potential BTPD for southern Phillips County to provide a test of the model and map
Page 2 of 17
results. Their study found terrain slope angle, vegetation type, and soil type were all significant
variables in determining BPTD habitat location.
Investigation of Available LIBI Map Data Layers
WYGISC and NPS employed a collaborative implementation approach in performing this project. Eli
Rodemaker a Research Scientist at WYGSIC, Darcee Killpack GIS Coordinator of the NPS Intermountain
Region, and Melana Stichman Biological Sciences Technician at LIBI developed a BTPD model for LIBI
through a process of refinement including field assessment that will be explained below. The three
worked together to assess the best possible environmental GIS layers available for mapping BTPD
habitats at LIBI.
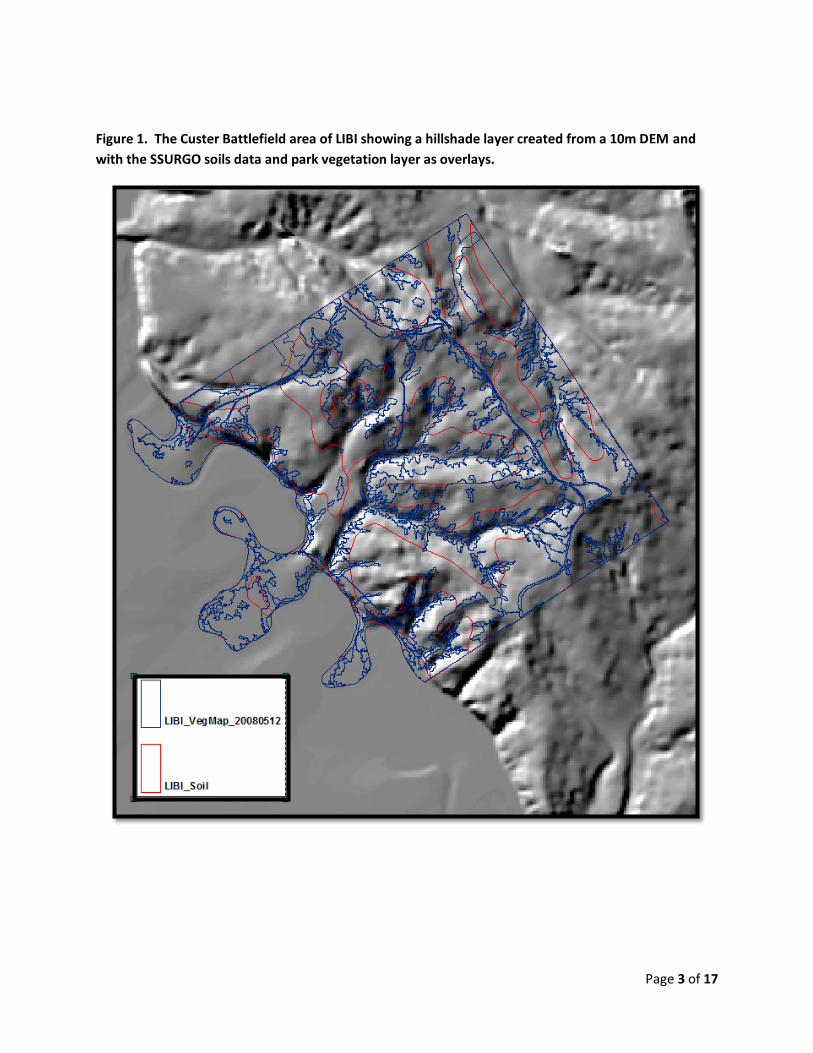
The 10m National Elevation Dataset (NED), the NRCS Soil Survey Geographic (SSURGO) data, and the
park vegetation map derived from fine resolution remotely sensed imagery were tested as potential
response variables. Figure 1 below shows a hillshade layer derived from the DEM and the soil and
vegetation layers. Examination of these layers shows that the soil and vegetation layers are not spatially
independent of each other and use of both in a model must be undertaken with caution. We also
recognize that the vegetation present on LIBI follow a distribution controlled by the type of soil, terrain
type, and disturbance history. Since vegetation is controlled by soil characteristics and has been
mapped at a much finer spatial scale than the soils data use of the vegetation layer alone in a GIS model
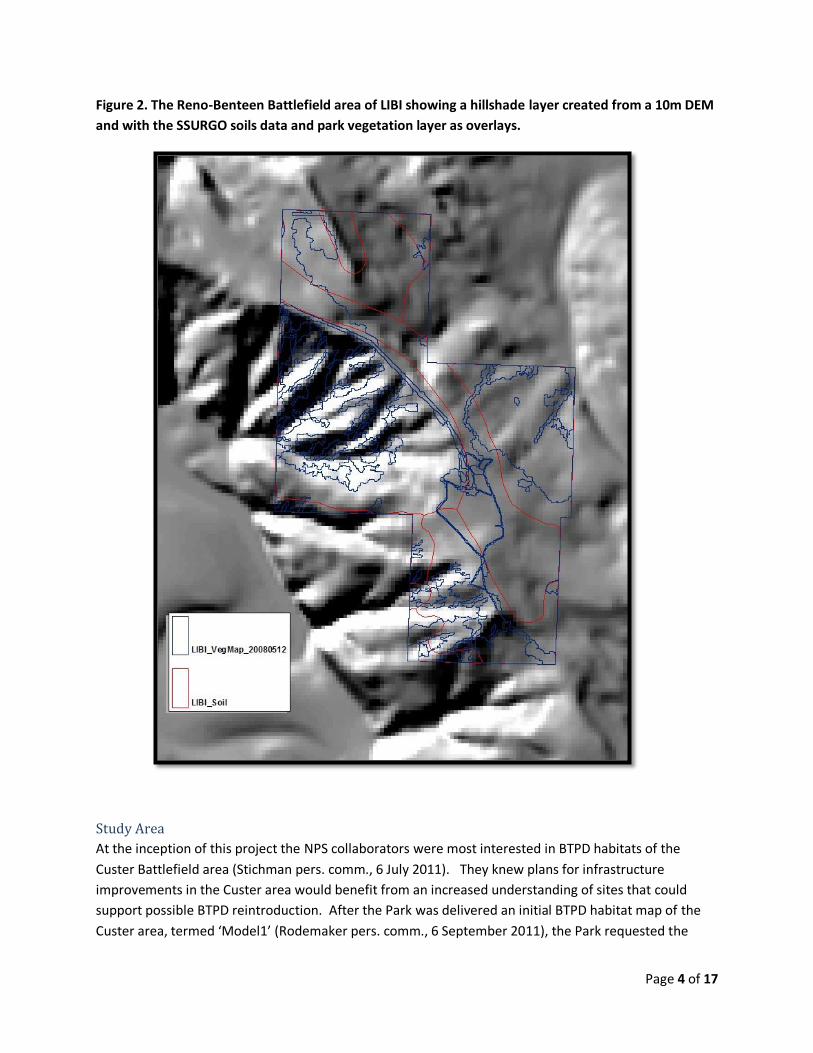
would be appropriate. The differences in scale are readily apparent in Figures 1 and 2 when we
compare the red soil type boundaries to the blue vegetation type boundaries. Further, the vegetation
database also provides delimitations for park resource features at the battlefield such as roads and
buildings.
Page 3 of 17
Figure 1. The Custer Battlefield area of LIBI showing a hillshade layer created from a 10m DEM and
with the SSURGO soils data and park vegetation layer as overlays.
Page 4 of 17
Figure 2. The Reno-Benteen Battlefield area of LIBI showing a hillshade layer created from a 10m DEM
and with the SSURGO soils data and park vegetation layer as overlays.
Study Area
At the inception of this project the NPS collaborators were most interested in BTPD habitats of the
Custer Battlefield area (Stichman pers. comm., 6 July 2011). They knew plans for infrastructure
improvements in the Custer area would benefit from an increased understanding of sites that could
support possible BTPD reintroduction. After the Park was delivered an initial BTPD habitat map of the
Custer area, termed ‘Model1’ (Rodemaker pers. comm., 6 September 2011), the Park requested the
Page 5 of 17
Reno-Benteen area to the modeling and mapping effort. Both areas were modeled and mapped
simultaneously with the process described next.
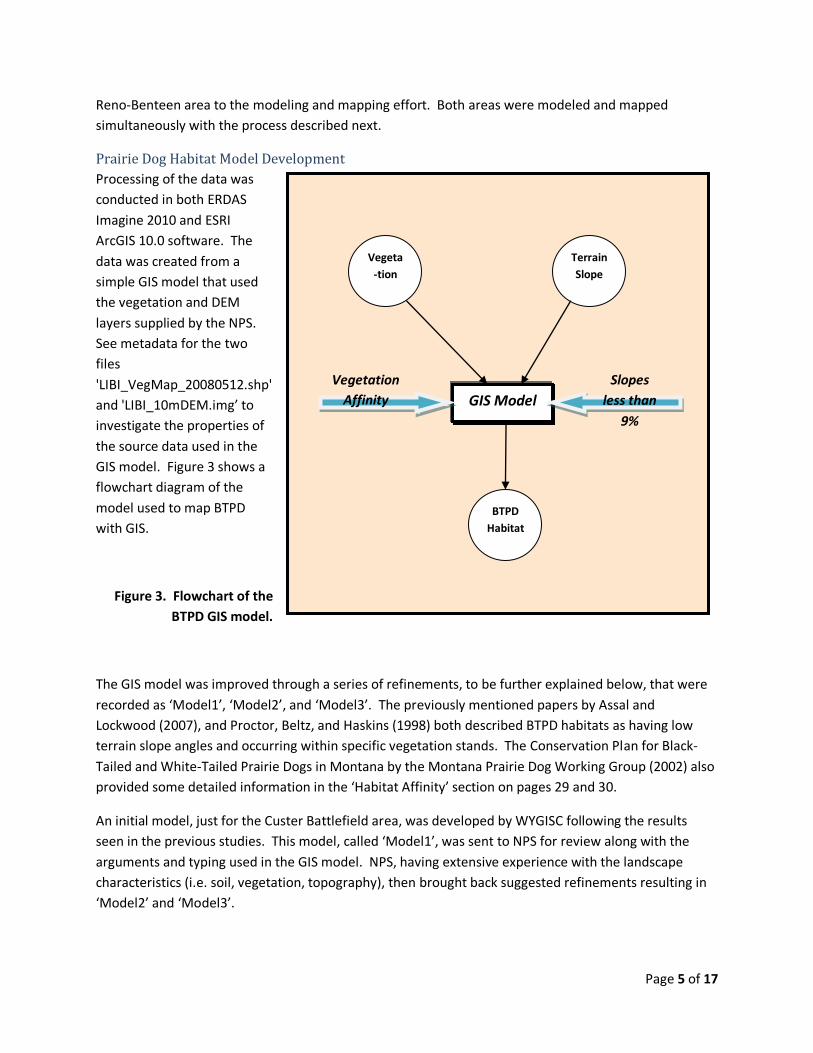
Prairie Dog Habitat Model Development
Processing of the data was
conducted in both ERDAS
Imagine 2010 and ESRI
ArcGIS 10.0 software. The
data was created from a
simple GIS model that used
the vegetation and DEM
layers supplied by the NPS.
See metadata for the two
files
'LIBI_VegMap_20080512.shp'
and 'LIBI_10mDEM.img’ to
investigate the properties of
the source data used in the
GIS model. Figure 3 shows a
flowchart diagram of the
model used to map BTPD
with GIS.
Figure 3. Flowchart of the
BTPD GIS model.
The GIS model was improved through a series of refinements, to be further explained below, that were
recorded as ‘Model1’, ‘Model2’, and ‘Model3’. The previously mentioned papers by Assal and
Lockwood (2007), and Proctor, Beltz, and Haskins (1998) both described BTPD habitats as having low
terrain slope angles and occurring within specific vegetation stands. The Conservation Plan for Black-
Tailed and White-Tailed Prairie Dogs in Montana by the Montana Prairie Dog Working Group (2002) also
provided some detailed information in the ‘Habitat Affinity’ section on pages 29 and 30.
An initial model, just for the Custer Battlefield area, was developed by WYGISC following the results
seen in the previous studies. This model, called ‘Model1’, was sent to NPS for review along with the
arguments and typing used in the GIS model. NPS, having extensive experience with the landscape
characteristics (i.e. soil, vegetation, topography), then brought back suggested refinements resulting in
‘Model2’ and ‘Model3’.
GIS Model
Vegeta
-tion
Terrain
Slope
BTPD
Habitat
Vegetation
Affinity
Slopes
less than
9%
Page 6 of 17
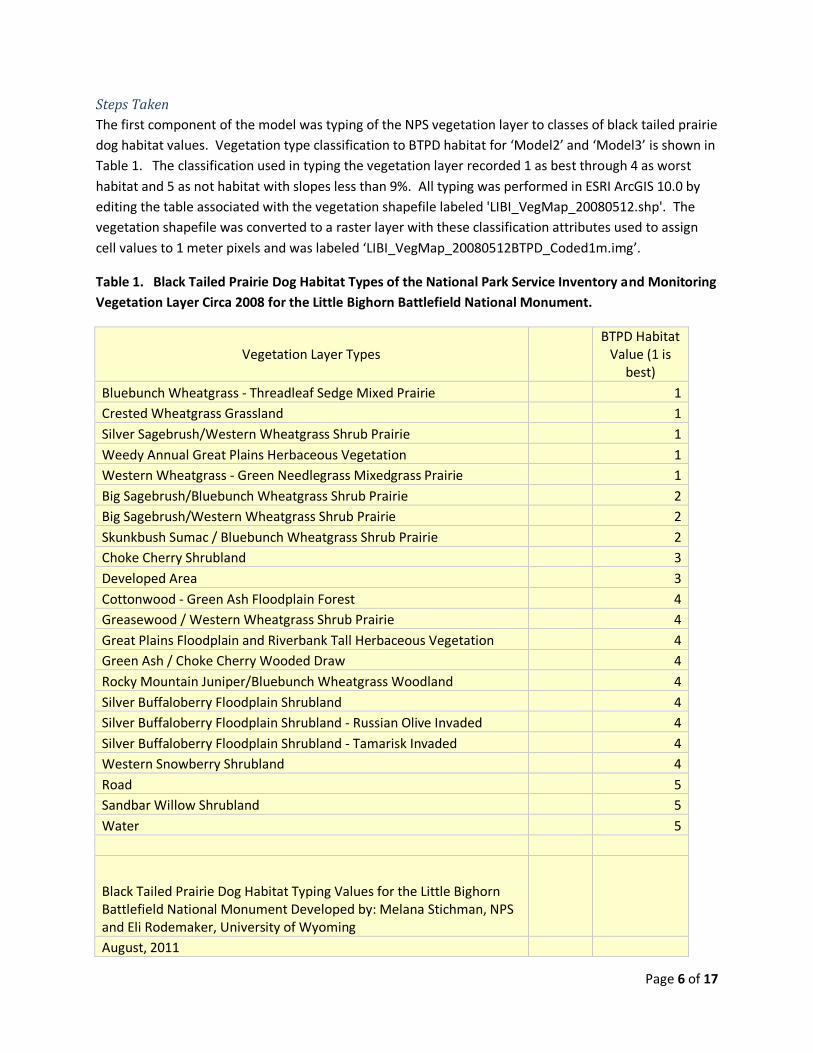
Steps Taken
The first component of the model was typing of the NPS vegetation layer to classes of black tailed prairie
dog habitat values. Vegetation type classification to BTPD habitat for ‘Model2’ and ‘Model3’ is shown in
Table 1. The classification used in typing the vegetation layer recorded 1 as best through 4 as worst
habitat and 5 as not habitat with slopes less than 9%. All typing was performed in ESRI ArcGIS 10.0 by
editing the table associated with the vegetation shapefile labeled 'LIBI_VegMap_20080512.shp'. The
vegetation shapefile was converted to a raster layer with these classification attributes used to assign
cell values to 1 meter pixels and was labeled ‘LIBI_VegMap_20080512BTPD_Coded1m.img’.
Table 1. Black Tailed Prairie Dog Habitat Types of the National Park Service Inventory and Monitoring
Vegetation Layer Circa 2008 for the Little Bighorn Battlefield National Monument.
Black Tailed Prairie Dog Habitat Typing Values for the Little Bighorn Battlefield National Monument Developed by: Melana Stichman, NPS and Eli Rodemaker, University of Wyoming
August, 2011
Page 7 of 17
The second component of the model was creation of a terrain slope GIS layer from the DEM supplied by
NPS. In ERDAS Imagine 2010 software the terrain slope layer was computed as percent slope and
resulted in a raster layer with 10 meter pixels labeled ‘libi_10m_dem_slope_per.img’. All terrain slopes
greater than 8 percent were masked out of the vegetation typing raster producing the GIS model result.
The resulting raster layer of BTPD habitat was categorized as primary (1), secondary (2), human
developed areas, such as landscaping, and tertiary (3), tertiary (4), and not habitat with slopes less than
9% (5).
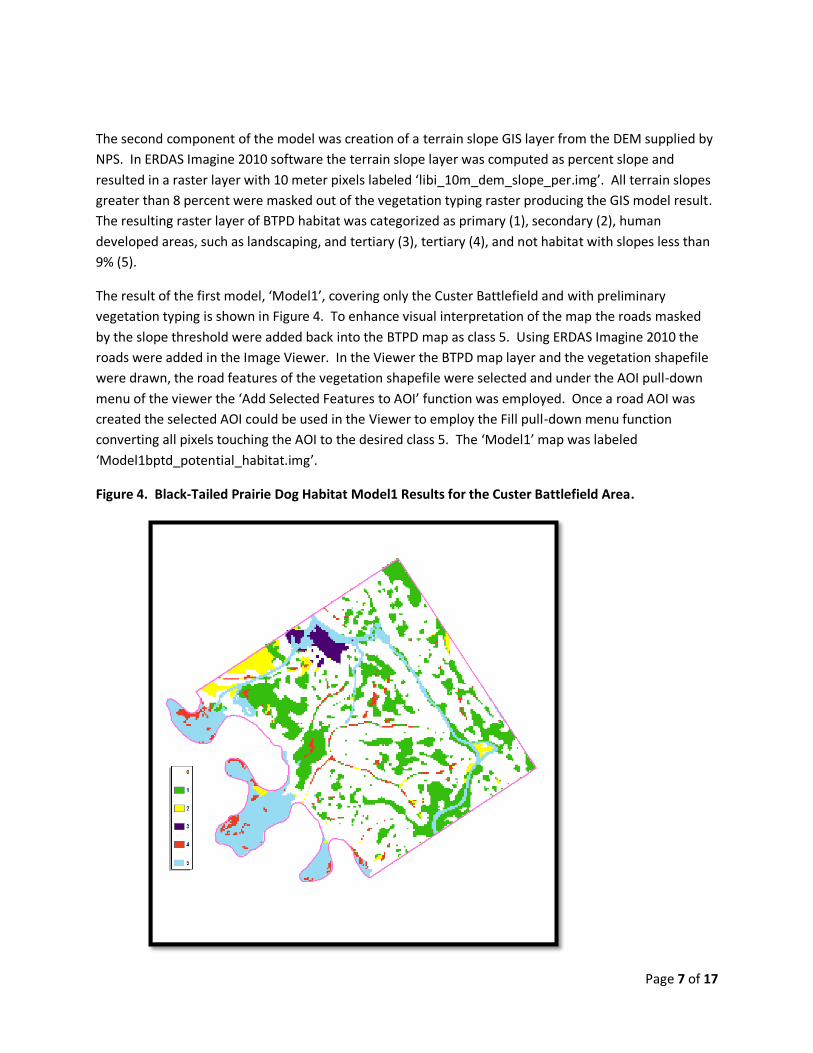
The result of the first model, ‘Model1’, covering only the Custer Battlefield and with preliminary
vegetation typing is shown in Figure 4. To enhance visual interpretation of the map the roads masked
by the slope threshold were added back into the BTPD map as class 5. Using ERDAS Imagine 2010 the
roads were added in the Image Viewer. In the Viewer the BTPD map layer and the vegetation shapefile
were drawn, the road features of the vegetation shapefile were selected and under the AOI pull-down
menu of the viewer the ‘Add Selected Features to AOI’ function was employed. Once a road AOI was
created the selected AOI could be used in the Viewer to employ the Fill pull-down menu function
converting all pixels touching the AOI to the desired class 5. The ‘Model1’ map was labeled
‘Model1bptd_potential_habitat.img’.
Figure 4. Black-Tailed Prairie Dog Habitat Model1 Results for the Custer Battlefield Area.
Page 8 of 17
After testing and refinement of multiple models the preferred model, ultimately Model 2, was recoded
in ERDAS Imagine 2010 to convert category 5 to 0 or ‘No Data or Not Habitat.’ The recoded product,
labeled ‘libi_btpd_habitat_model2recode.img’ was then put through a final spatial analysis to remove
small areas on the map less than a half acre (2,023 m2). Conversion of the 1 meter recoded map to half
acre minimum mapping units involved, in ERDAS Imagine 2010, running an 8 sided or queens rule clump
command and then using this clump file as the source to an eliminate command. Clumps are spatially
contiguous groups of pixels with the same value. The eliminate command removed all clumps smaller
than 2023 pixels. with an iterative majority neighbor filtering approach and produced a file labeled
‘libi_btpd_habitats_model2.img’. The filtering approach removes pixels from small clumps and replaces
the pixel with the majority value from neighboring pixels of a different value including 0. The final map,
recoded and filtered to remove small areas, is considered to have a half acre Minimum Mapping Unit
(MMU) and was labeled ‘libi_btpd_habitats_model2_half_acre_mmu.img’.
Field Investigation and Refinement of Model
The three researchers collaboratively reviewed and refined the initial BTPD habitat model. The first
model BTPD map was sent to the NPS along with the vegetation typing table. Using local knowledge of
the plant associations at LIBI NPS provided revisions to the vegetation typing. This typing was used in
the generation of subsequent models. Table 1 shows the final typing used to generate a second and
third model version.
The first model, mapped to a file called ‘Model1btpd_potential_habitat.img’, was investigated in the
field by NPS staff. Appendix B shows the field notes generated by NPS for the Custer Battlefield area
using Model 1. Appendix C shows the producers reply to these notes. Investigation of Model1 in the
field instigated a change in vegetation typing as mentioned above, questions about the appropriate
slope threshold, and a change in scale of the slope layer to match the vegetation layer. These changes
were incorporated into a second model that was mapped to a file labeled
‘libi_btpd_habitats_model2.img’. Figure 5 below shows the map of the second model.
Page 9 of 17
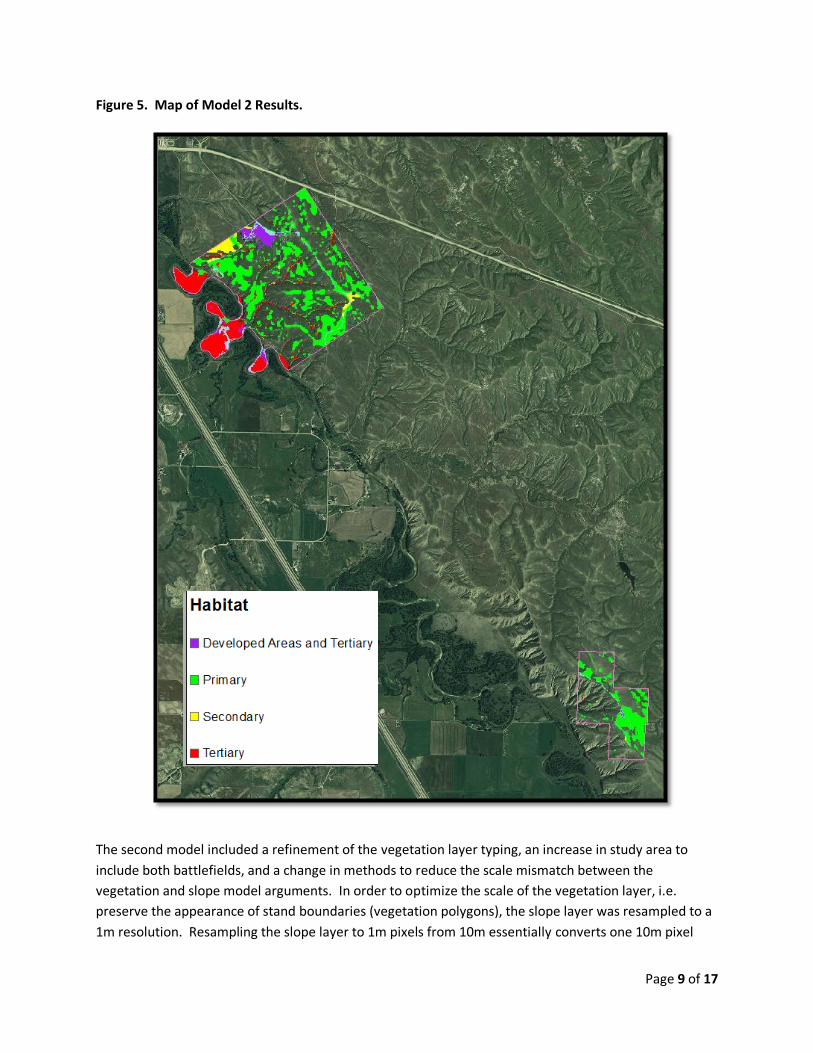
Figure 5. Map of Model 2 Results.
The second model included a refinement of the vegetation layer typing, an increase in study area to
include both battlefields, and a change in methods to reduce the scale mismatch between the
vegetation and slope model arguments. In order to optimize the scale of the vegetation layer, i.e.
preserve the appearance of stand boundaries (vegetation polygons), the slope layer was resampled to a
1m resolution. Resampling the slope layer to 1m pixels from 10m essentially converts one 10m pixel
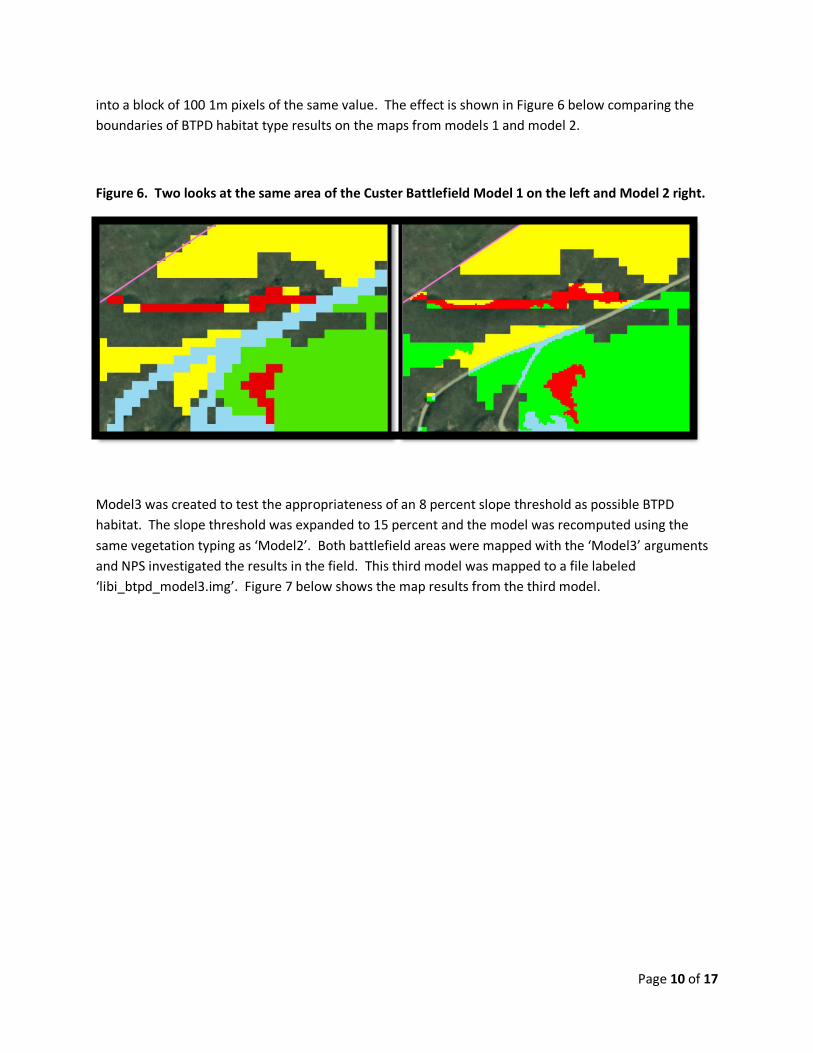
Page 10 of 17
into a block of 100 1m pixels of the same value. The effect is shown in Figure 6 below comparing the
boundaries of BTPD habitat type results on the maps from models 1 and model 2.
Figure 6. Two looks at the same area of the Custer Battlefield Model 1 on the left and Model 2 right.
Model3 was created to test the appropriateness of an 8 percent slope threshold as possible BTPD
habitat. The slope threshold was expanded to 15 percent and the model was recomputed using the
same vegetation typing as ‘Model2’. Both battlefield areas were mapped with the ‘Model3’ arguments
and NPS investigated the results in the field. This third model was mapped to a file labeled
‘libi_btpd_model3.img’. Figure 7 below shows the map results from the third model.
Page 11 of 17
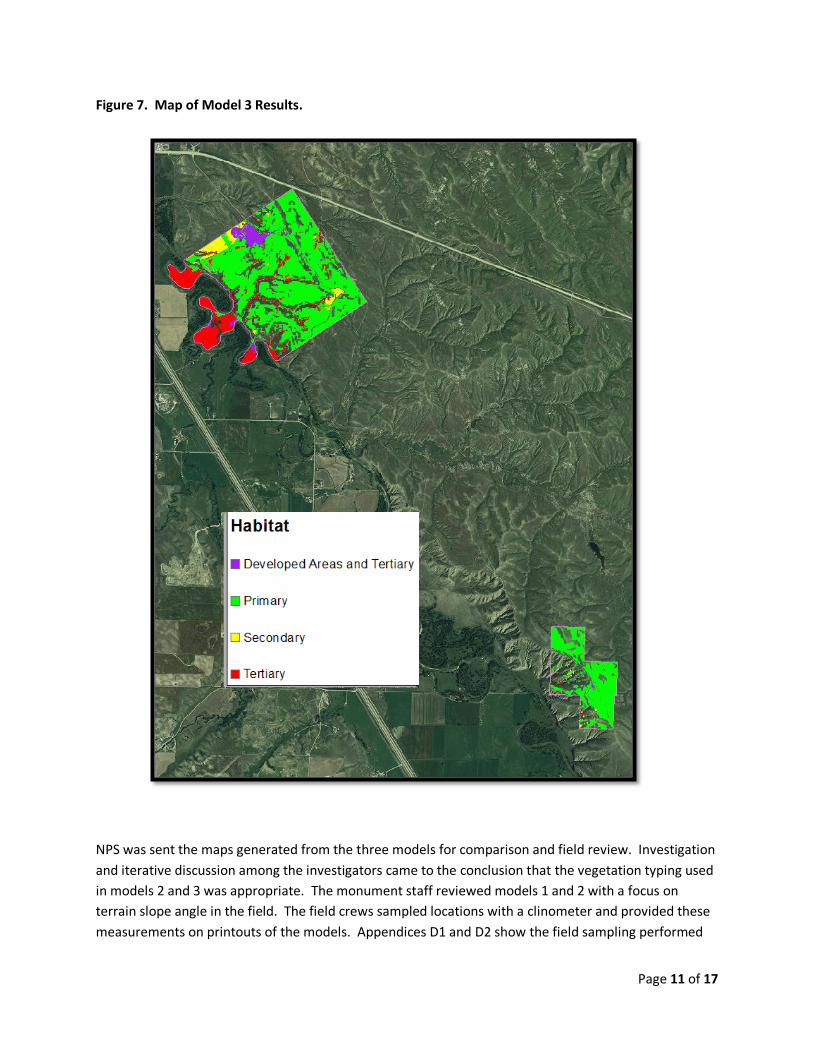
Figure 7. Map of Model 3 Results.
NPS was sent the maps generated from the three models for comparison and field review. Investigation
and iterative discussion among the investigators came to the conclusion that the vegetation typing used
in models 2 and 3 was appropriate. The monument staff reviewed models 1 and 2 with a focus on
terrain slope angle in the field. The field crews sampled locations with a clinometer and provided these
measurements on printouts of the models. Appendices D1 and D2 show the field sampling performed
Page 12 of 17
with the clinometers. Most clinometer shots found angles within the 8 percent threshold of model 2, a
few (4 of 28) were within the 8 to 15 percent range of model3, and 1 had a 20 percent slope but was
taken at the edge of a possible habitat patch. In general the field sampling provided strong support for
the model2 result and concluded the model3 result was too inclusive of terrain with higher slope angle.
The results section below contains a further look at the field sampling.
Issues between the BTPD maps of the two battlefields were noticed in the field when comparing models
2 and 3. The Reno-Benteen battlefield was fairly well represented by the third model but did contain
some commission error. Model 2 for Reno-Benteen missed a few areas that NPS Biologists thought may
be appropriate BTPD habitat but the model was successful for the Custer area. Field review and
collaborative communication among the principals concluded that model2 represented the best singular
model for both areas. Appendix E shows field notes comparing models 2 and 3 in the Reno-Benteen
area specifically.
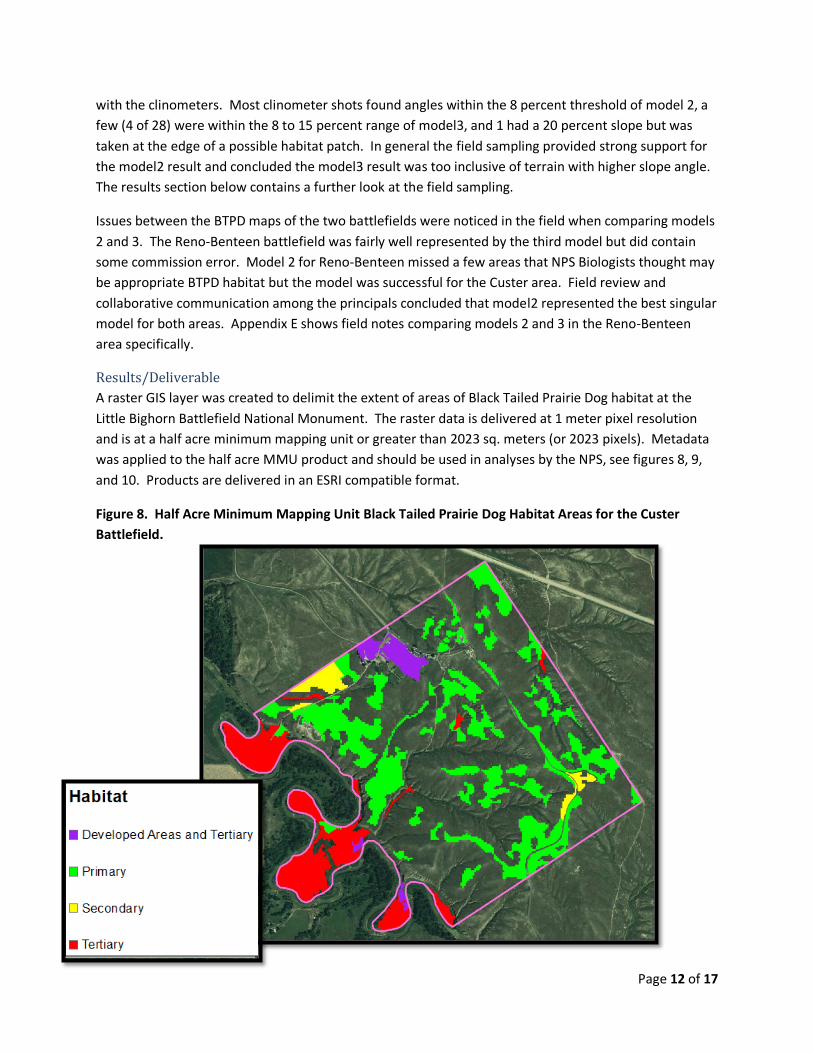
Results/Deliverable
A raster GIS layer was created to delimit the extent of areas of Black Tailed Prairie Dog habitat at the
Little Bighorn Battlefield National Monument. The raster data is delivered at 1 meter pixel resolution
and is at a half acre minimum mapping unit or greater than 2023 sq. meters (or 2023 pixels). Metadata
was applied to the half acre MMU product and should be used in analyses by the NPS, see figures 8, 9,
and 10. Products are delivered in an ESRI compatible format.
Figure 8. Half Acre Minimum Mapping Unit Black Tailed Prairie Dog Habitat Areas for the Custer
Battlefield.
Page 13 of 17
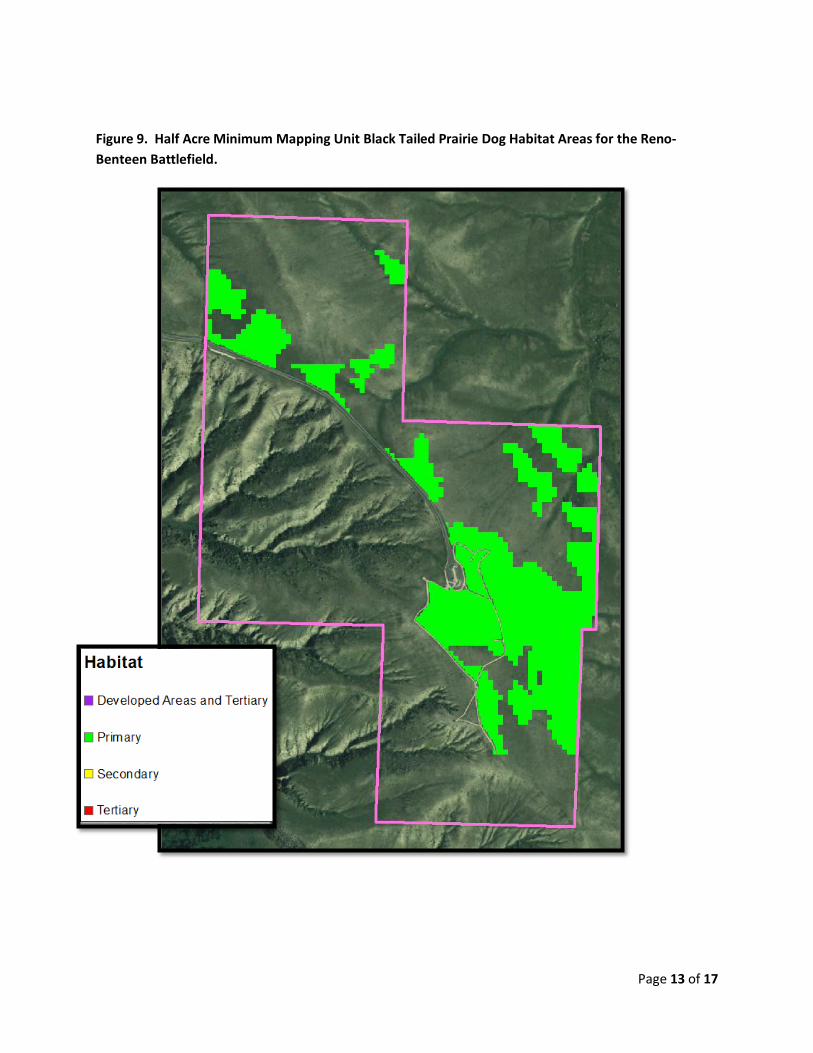
Figure 9. Half Acre Minimum Mapping Unit Black Tailed Prairie Dog Habitat Areas for the Reno-
Benteen Battlefield.
Page 14 of 17
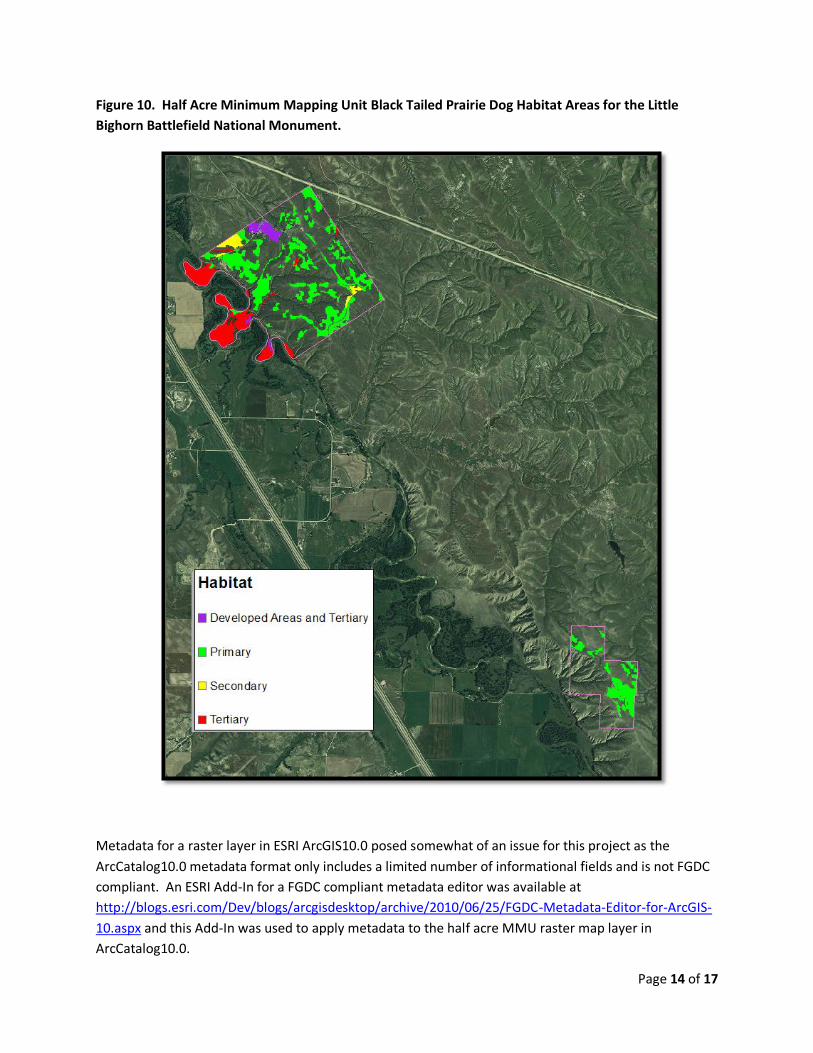
Figure 10. Half Acre Minimum Mapping Unit Black Tailed Prairie Dog Habitat Areas for the Little
Bighorn Battlefield National Monument.
Metadata for a raster layer in ESRI ArcGIS10.0 posed somewhat of an issue for this project as the
ArcCatalog10.0 metadata format only includes a limited number of informational fields and is not FGDC
compliant. An ESRI Add-In for a FGDC compliant metadata editor was available at
The BTPD habitat values 1 through 5 have been mapped for the Custer and Reno-Benteen battlefield
areas of the Little Bighorn Battlefield National Monument. Absence of prairie dog colonies within the
study area prohibited building a sample based model of the habitat and we relied on an Expert Decision
Rule approach instead. The authors used previously published examples of BTPD GIS models and the
Conservation Plan for Black-Tailed and White-Tailed Prairie Dogs in Montana to assess appropriate
available environmental layers and attributes for the BTPD Habitat model described in this report.
The model developed provides LIBI managers a spatially explicit description of BTPD habitat for lands at
the monument. The model also provides a qualitative assessment those lands hold for possible BTPD
affinity. The habitat value classification of 1 as best and 5 as worst is a relative scale and labels have
been applied to the categories as a description. The common attribute of all habitat values is that they
occur on terrain slopes of less than 9 percent slope at least according to the 10m DEM data available.
The habitat value classification essentially creates a scale that ranks each vegetation stands at the
monument. The type of vegetation controls the resulting habitat value class to be mapped with those
areas of slope greater than 8 percent excluded.
This study did not attempt to rank the possible terrain slope angles other than habitat and not habitat.
Previous studies did have a rank applied in their model for different categories of slope angle. Perhaps a
simple rank of 0 to 4% as best, 4 to 8% second, and greater than 8% as not habitat would be beneficial
but in the case of the model described here the inaccuracy evident in the slope and DEM layer at 10m
were well within the range of possible angle categories. Further addition of a slope based rank
complicates the interpretation of map from the model by increasing the number of map classes.
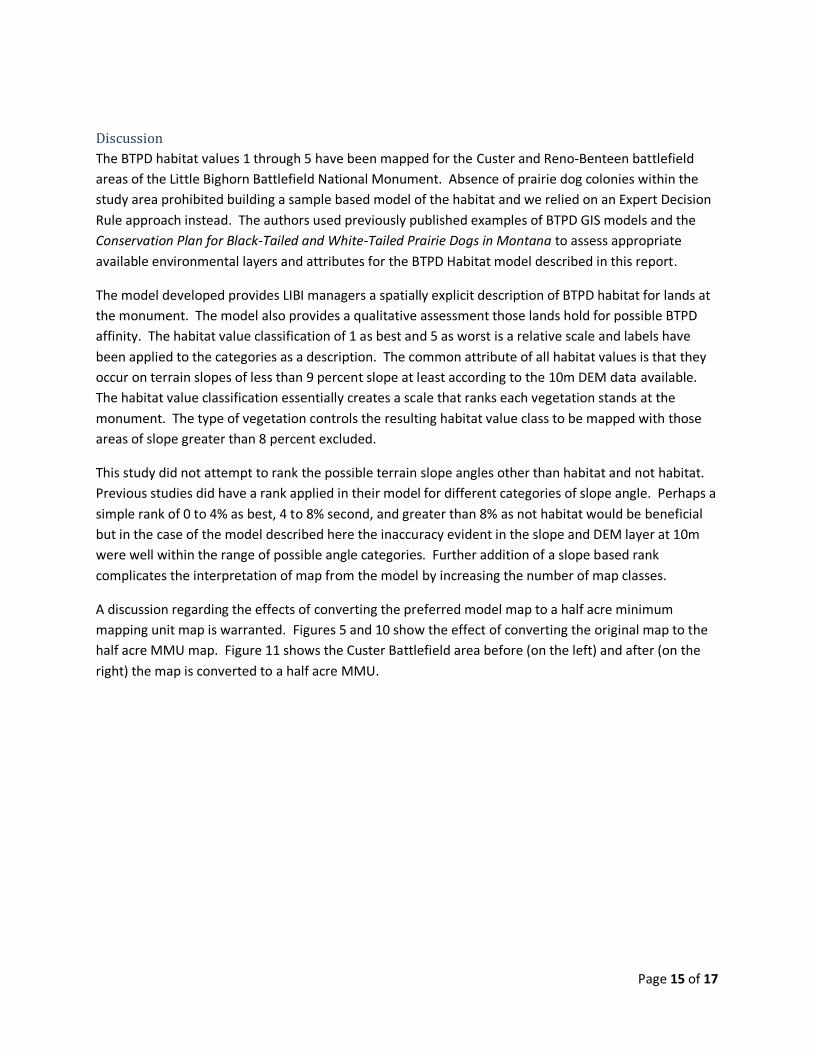
A discussion regarding the effects of converting the preferred model map to a half acre minimum
mapping unit map is warranted. Figures 5 and 10 show the effect of converting the original map to the
half acre MMU map. Figure 11 shows the Custer Battlefield area before (on the left) and after (on the
right) the map is converted to a half acre MMU.
Page 16 of 17
Figure 11. The BTPD Habitat Map for the Custer Battlefield Area Shown as the GIS Model Result on
the Left and a Half Acre Minimum Mapping Unit Version on the Right.
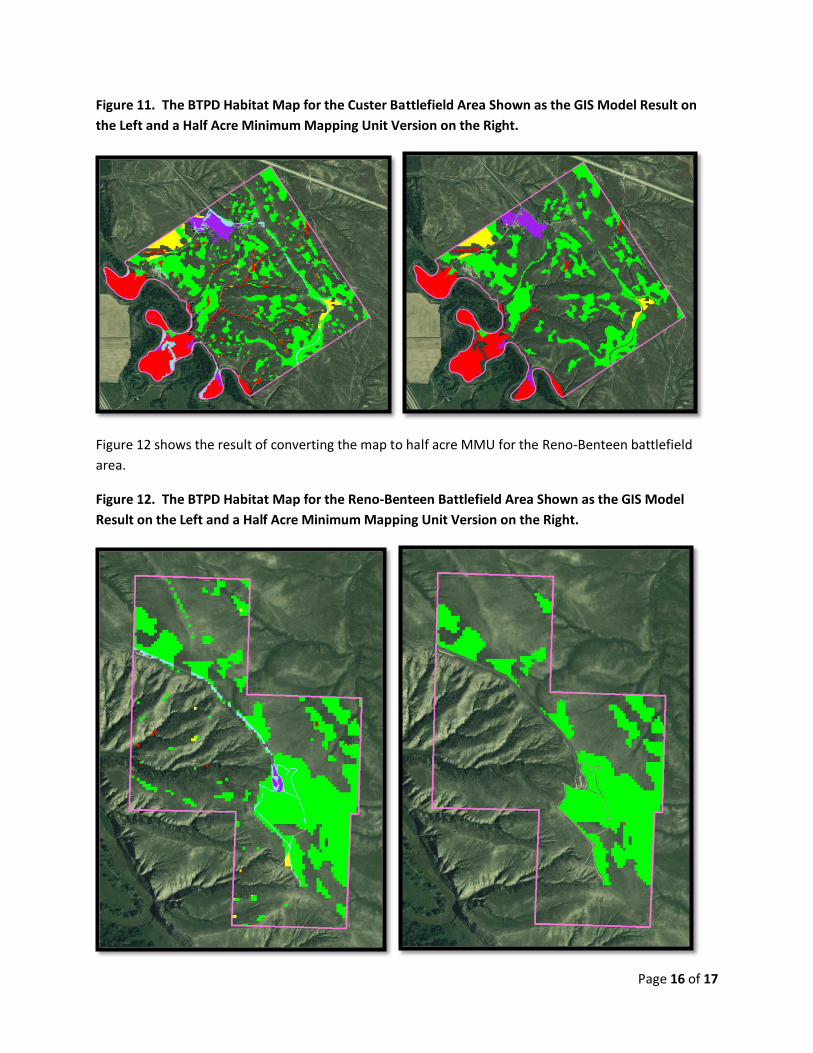
Figure 12 shows the result of converting the map to half acre MMU for the Reno-Benteen battlefield
area.
Figure 12. The BTPD Habitat Map for the Reno-Benteen Battlefield Area Shown as the GIS Model
Result on the Left and a Half Acre Minimum Mapping Unit Version on the Right.
Page 17 of 17
Changing the map to a half acre MMU version has the effect of removing small areas and filling them in
with neighboring pixels. A group of pixels greater than a half acre in size may have other values from
the original model incorporated into the clump. Conversely small areas of habitat, less than a half acre,
within a larger area of habitat may have been removed in the MMU version. Use of the map in the
office and in the field should keep these caveats in mind.
Field investigation and review has shown that the simple GIS model is effective in mapping BTPD
habitats at LIBI. The effect of using two different scale datasets was noted in the field and lab. The
slope layer generated from a 10m DEM is a large source of variance in the model. Areas that field crews
could detect as possible habitat may have been too small to be found in the DEM layer and the slope
used in the model. See Appendices B, C, D1, D2, and E for examples and notes regarding terrain slopes
at the monument. A finer spatial resolution DEM would be helpful for this and other management
needs at LIBI. A lidar system flown onboard an aircraft would be a possible source for this data.
Literature Cited
Assal, Timothy J. and Jeffrey A. Lockwood. 2007. Utilizing Remote Sensing and GIS to Detect Prairie Dog
Colonies. Rangeland Ecology and Management, 60(1):45-53.
Montana Prairie Dog Working Group. 2002. Conservation Plan for Black-Tailed and White-Tailed Prairie
Dogs in Montana. Montana Fish, Wildlife, and Parks, Helena. 51 pgs.
Proctor, Jonathan, Michael Beltz, and William Haskins. 1998. A GIS Model for Identifying Potential
Black-Tailed Prairie Dog Habitat in the Northern Great Plains Shortgrass Prairie. 18th Annual ESRI User
Conference, San Diego, July 27-31. 20pgs.
Rodemaker, Eli, Remote Sensing Scientist, WYGISC. 6 September 2011. Personal Communication –
Email to Darcee Killpack and Melana Stichman.
Stichman, Melana, Biological Sciences Technician, LIBI. 6 July 2011. Personal Communication –
Teleconference with Darcee Killpack and Eli Rodemaker.
Stichman, Melana, Biological Sciences Technician, LIBI. 7 September 2011. Personal Communication –
Email to Eli Rodemaker.
Wyoming Geographic Information Science Center University of Wyoming, Department 4008 1000 East University Avenue Laramie, Wyoming 82071 December 31, 2011