46
Bloomington’s Water Supply: System Overview and Planning by: Rick Twait, Superintendent of Water Purification City of Bloomington Mahomet Aquifer Consortium Meeting No. 56 October 22, 2007
| Date post: | 16-Dec-2015 |
| Category: |
Documents |
| Upload: | horace-lyons |
| View: | 219 times |
| Download: | 1 times |
Bloomington’s Water Supply:
System Overview and Planning
by: Rick Twait,
Superintendent of Water Purification
City of Bloomington
Mahomet Aquifer Consortium
Meeting No. 56 October 22, 2007

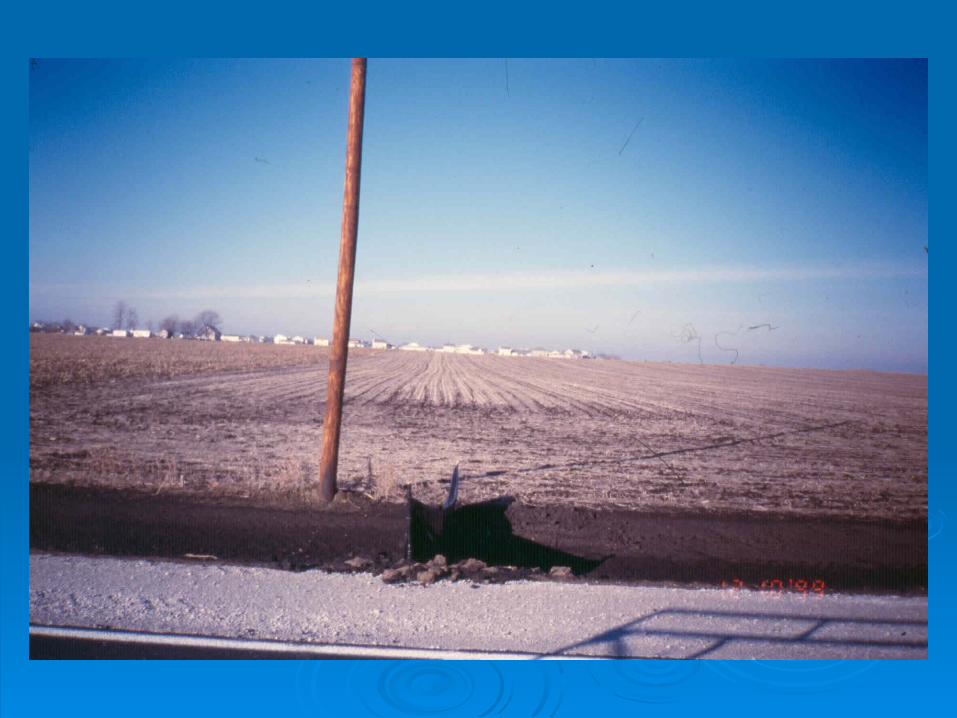
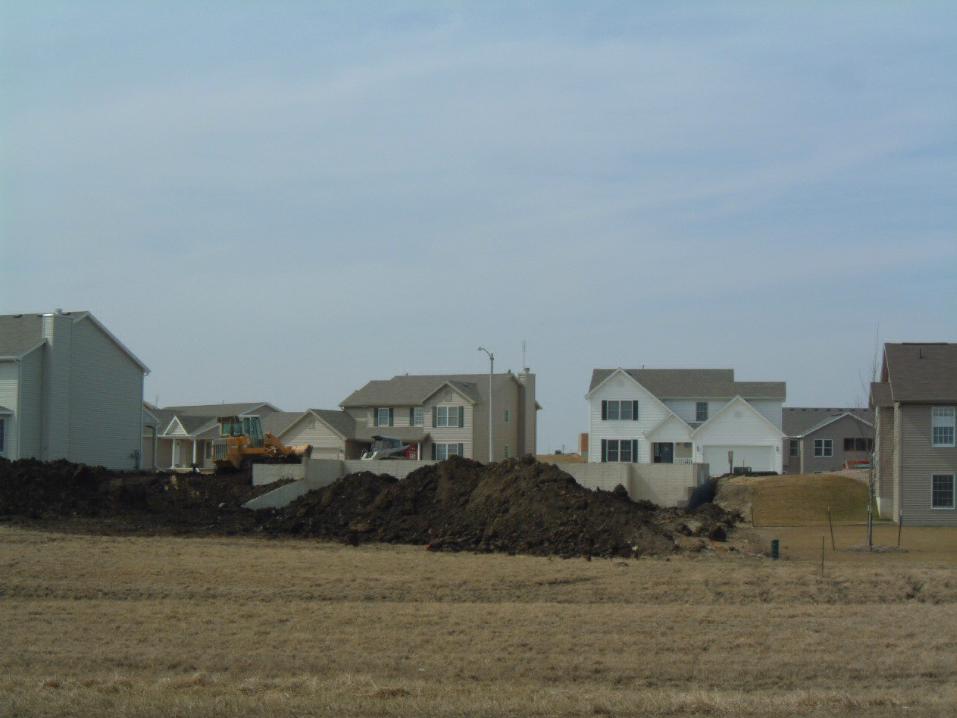
Urban-Rural Growth, 1950-2000McLean County, Illinois
Year
1940 1950 1960 1970 1980 1990 2000 2010
Po
pu
lati
on
0
20000
40000
60000
80000
100000
120000
Urban (Bloomington/Normal)
Rural (All other Areas)
Source: U.S Census of Population, 1950-2000McLean County Regional Planning Commission

Bloomington, IllinoisWater Rates per 100 Cubic Feet
Cubic Feet Purchased per Month
First 2,300 Next 11,700 Next 486,000 Over 500,000
Wat
erR
ate
(Do
llars
/10
0 cu
bic
Fee
t)
1.80
2.00
2.20
2.40
2.60
2.80
3.00
3.20
RatePer100Ft3 InsideCity
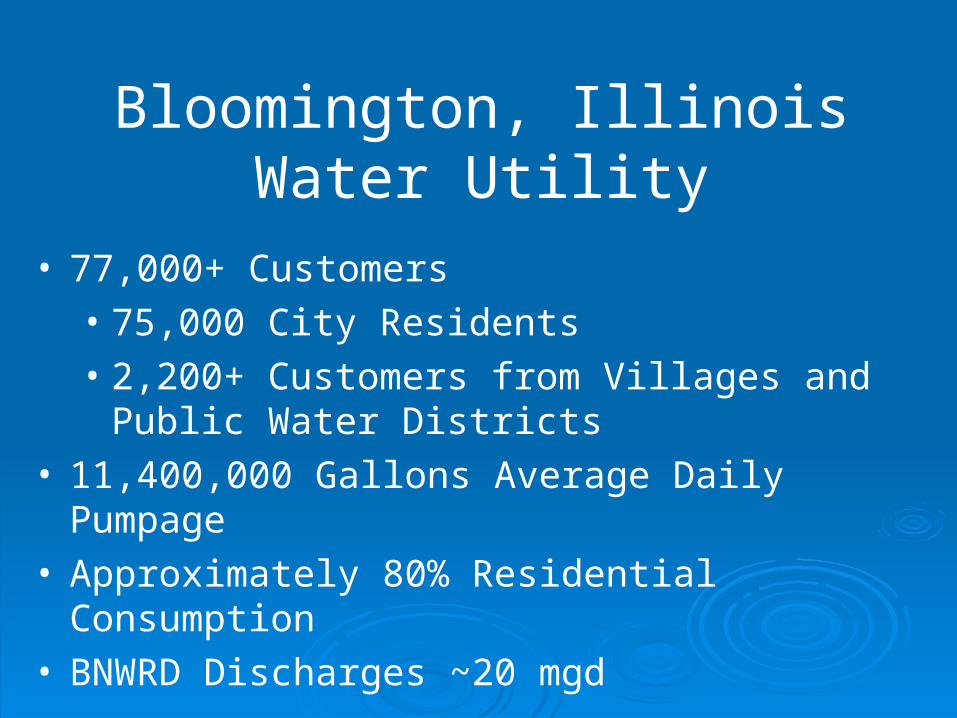
Bloomington, IllinoisWater Utility
• 77,000+ Customers• 75,000 City Residents• 2,200+ Customers from Villages and Public
Water Districts• 11,400,000 Gallons Average Daily Pumpage• Approximately 80% Residential Consumption• BNWRD Discharges ~20 mgd
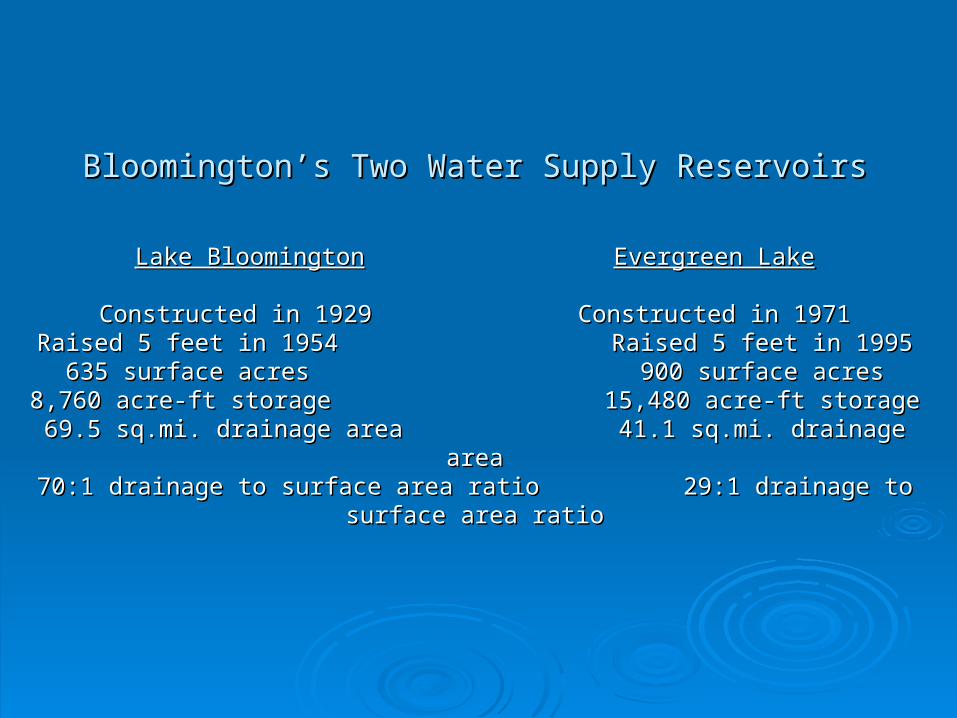
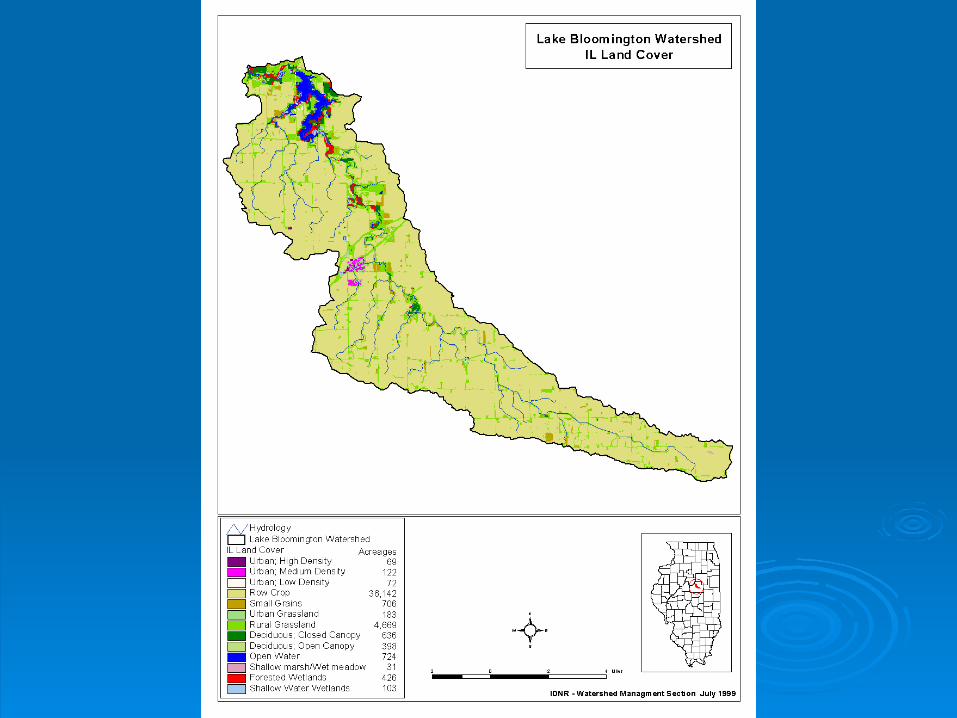
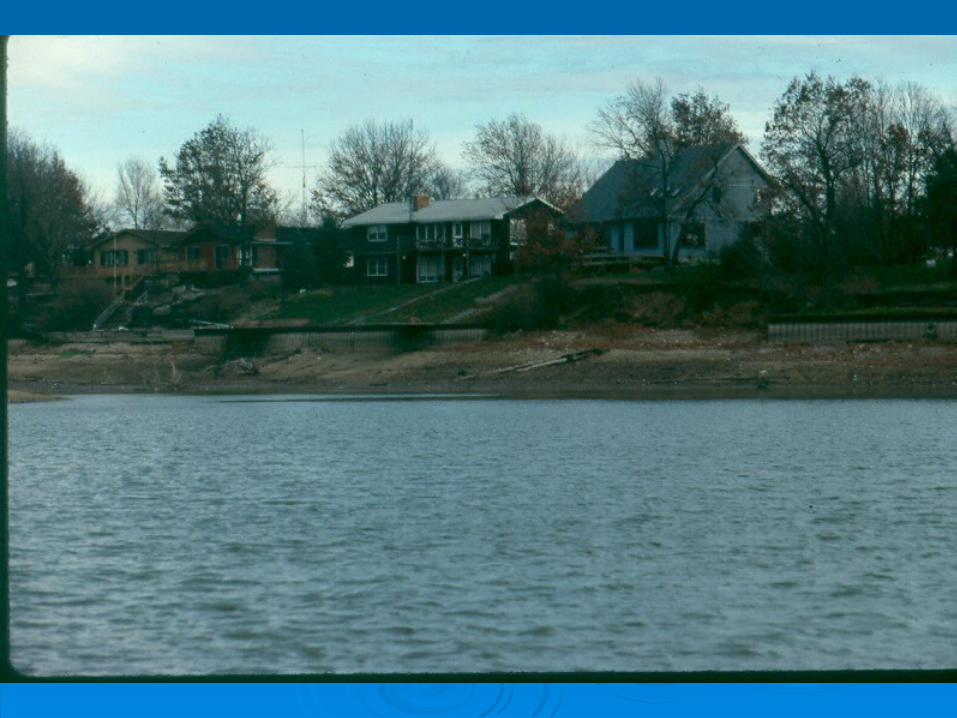
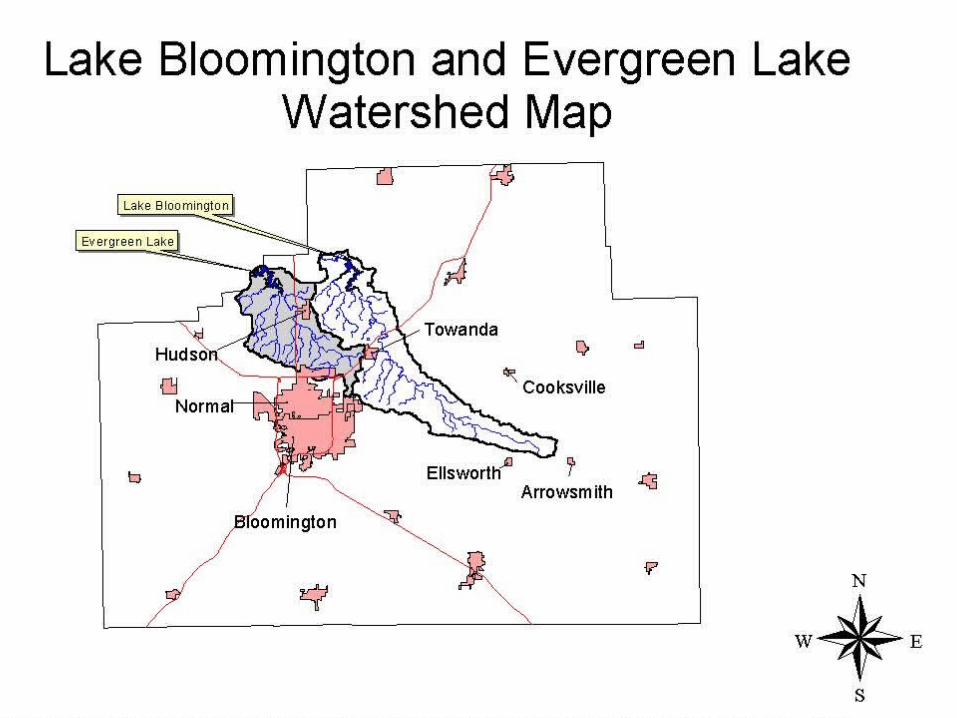
Bloomington’s Two Water Supply ReservoirsBloomington’s Two Water Supply Reservoirs
Lake BloomingtonLake Bloomington Evergreen LakeEvergreen Lake
Constructed in 1929Constructed in 1929 Constructed in 1971Constructed in 1971Raised 5 feet in 1954Raised 5 feet in 1954 Raised 5 feet in 1995Raised 5 feet in 1995
635 surface acres635 surface acres 900 surface acres900 surface acres8,760 acre-ft storage8,760 acre-ft storage 15,480 acre-ft storage15,480 acre-ft storage
69.5 sq.mi. drainage area69.5 sq.mi. drainage area 41.1 sq.mi. drainage area41.1 sq.mi. drainage area70:1 drainage to surface area ratio70:1 drainage to surface area ratio 29:1 drainage to surface area ratio 29:1 drainage to surface area ratio

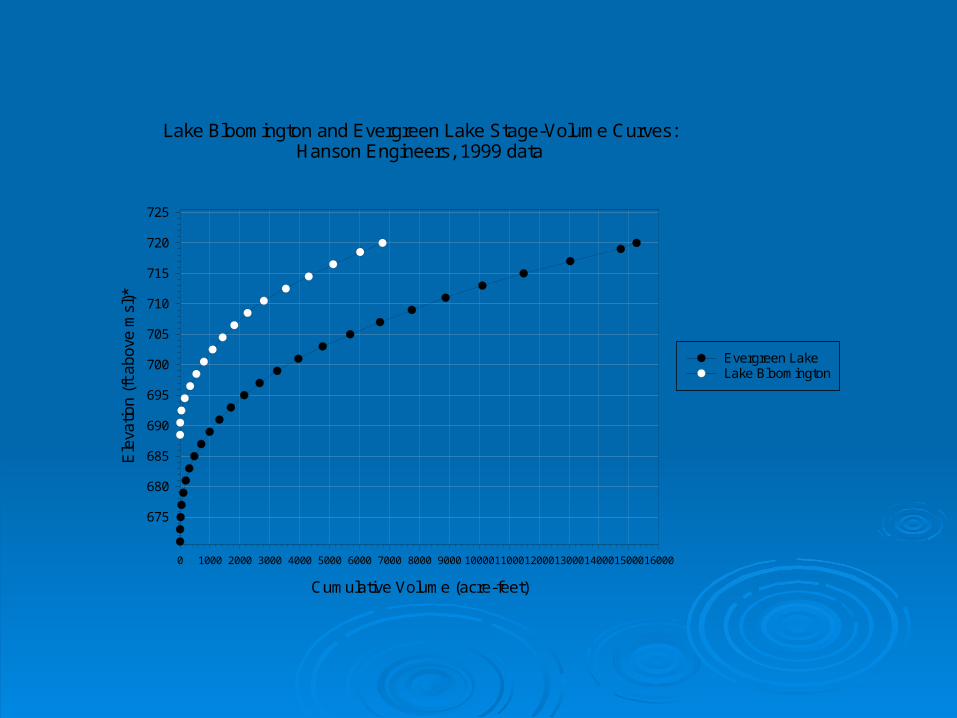
Lake Bloomington and Evergreen Lake Stage-Volume Curves:Hanson Engineers, 1999 data
Cumulative Volume (acre-feet)
0 1000 2000 3000 4000 5000 6000 7000 8000 9000 10000110001200013000140001500016000
Ele
vatio
n (f
t abo
ve m
sl)*
675
680
685
690
695
700
705
710
715
720
725
Evergreen LakeLake Bloomington

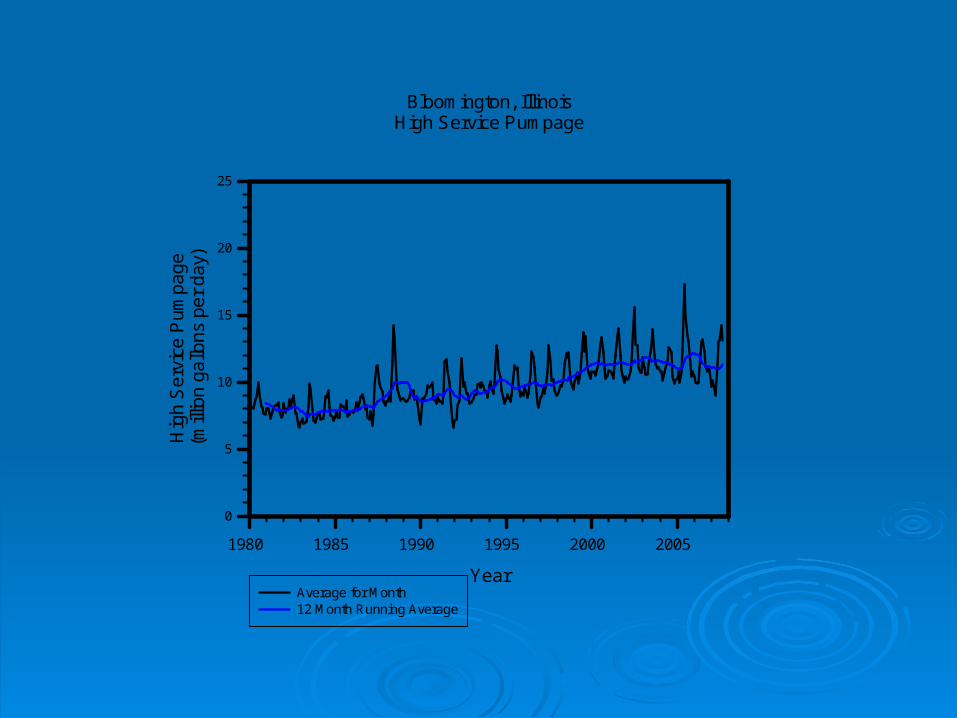
Bloomington, IllinoisHigh Service Pumpage
Year
1980 1985 1990 1995 2000 2005
Hig
h S
ervi
ce P
umpa
ge(m
illio
n ga
llons
per
day
)
0
5
10
15
20
25
Average for Month
Bloomington, IllinoisHigh Service Pumpage
Year
1980 1985 1990 1995 2000 2005
Hig
h S
ervi
ce P
umpa
ge(m
illio
n ga
llons
per
day
)
0
5
10
15
20
25
Average for Month12 Month Running Average
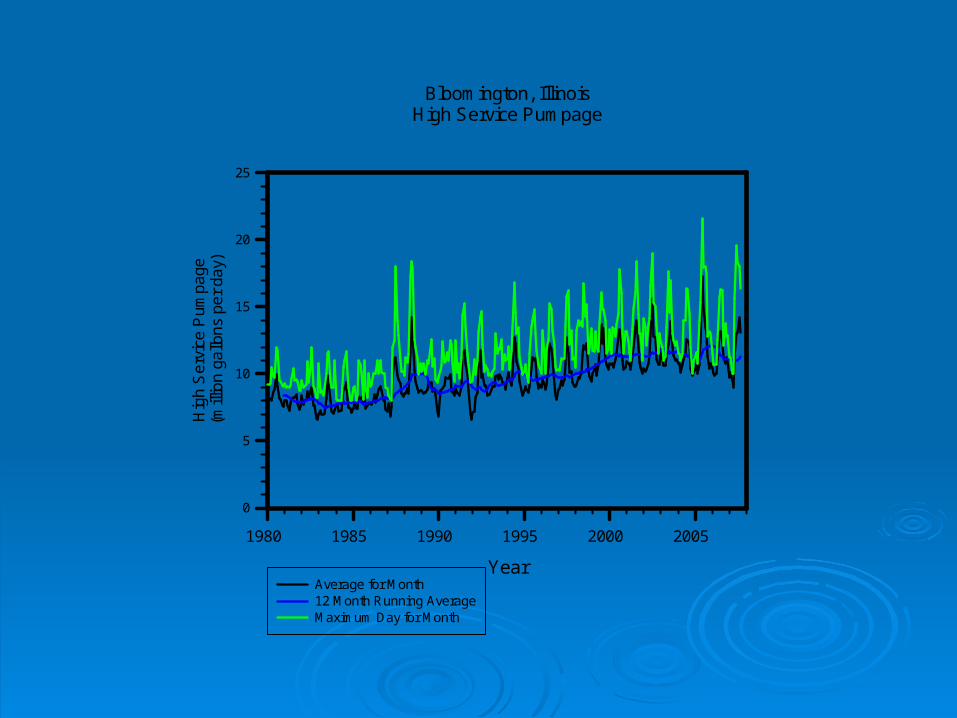
Bloomington, IllinoisHigh Service Pumpage
Year
1980 1985 1990 1995 2000 2005
Hig
h S
ervi
ce P
um
pag
e(m
illio
n g
allo
ns
per
da
y)
0
5
10
15
20
25
Average for Month12 Month Running AverageMaximum Day for Month
Dry Spells to DroughtsDry Spells to Droughts
In In Detecting Drought Conditions in IllinoisDetecting Drought Conditions in Illinois Changnon (1987): Described Changnon (1987): Described Meterological, Agricultural, Hydrological, Meterological, Agricultural, Hydrological, and Economic Drought Conditionsand Economic Drought Conditions
US Drought Monitor (website): Describes US Drought Monitor (website): Describes conditions in terms from abnormally dry to conditions in terms from abnormally dry to exceptional drought, agricultural and/or exceptional drought, agricultural and/or hydrologichydrologic
Dry Spells to DroughtsDry Spells to Droughts
In In Drought Response Plan, City of Bloomington, Drought Response Plan, City of Bloomington, Illinois Water Department, Illinois Water Department, Wittman (2006) Wittman (2006) proposed a practical definition of drought for proposed a practical definition of drought for municipal water systems as:municipal water systems as:
““A reduction in precipitation or aquifer recharge A reduction in precipitation or aquifer recharge that affects the ability of the public water system that affects the ability of the public water system to meet the demands of the customers or to meet the demands of the customers or causes regulatory or aesthetic reductions in causes regulatory or aesthetic reductions in water quality.”water quality.”
Types of Municipal Water Types of Municipal Water ShortagesShortages
Supply Shortages Can be Caused Supply Shortages Can be Caused by:by:
DroughtDrought DemandDemand Quality:Quality:
• Health (Regulatory)Health (Regulatory)• AestheticAesthetic

Types of Municipal Water Types of Municipal Water Shortages (cont’d)Shortages (cont’d)
Treatment Shortages Can be Caused by Treatment Shortages Can be Caused by Inadequate:Inadequate:
Treatment CapacityTreatment Capacity Transmission CapacityTransmission Capacity Storage CapacityStorage Capacity
To Meet DemandsTo Meet Demands


Lake Bloomington Water Levels and Precipitation
Year
89 90 91 92 93 94 95 96 97 98 99 00
Ele
vatio
n (f
t abo
ve m
sl)
700
705
710
715
720
725
Pre
cipi
tatio
n (in
)
01234567891011121314151617181920


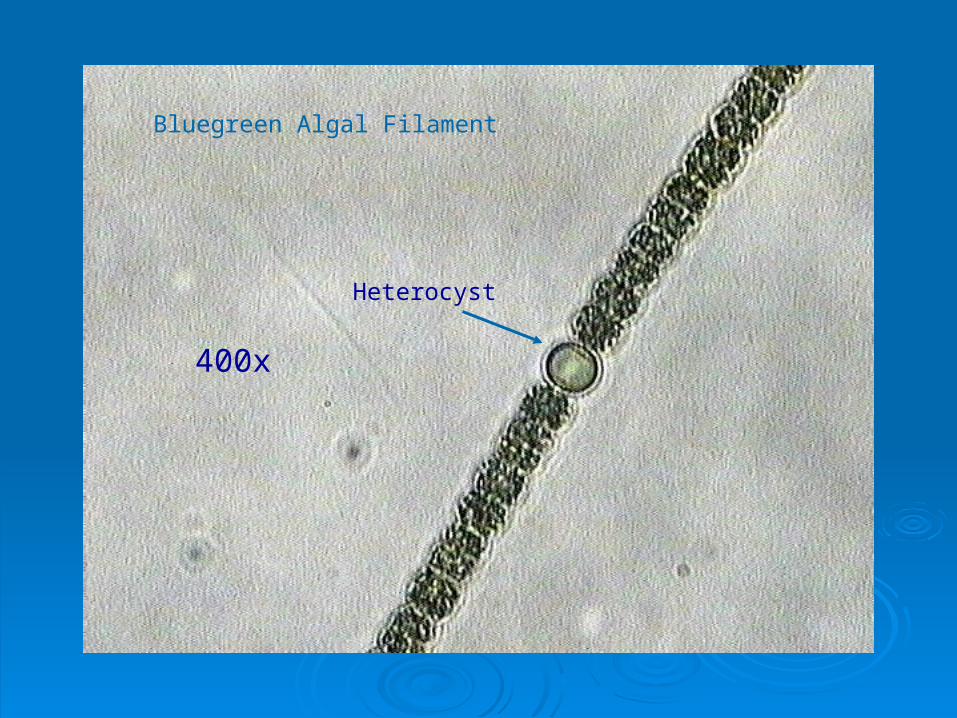
400x
Heterocyst
Bluegreen Algal Filament
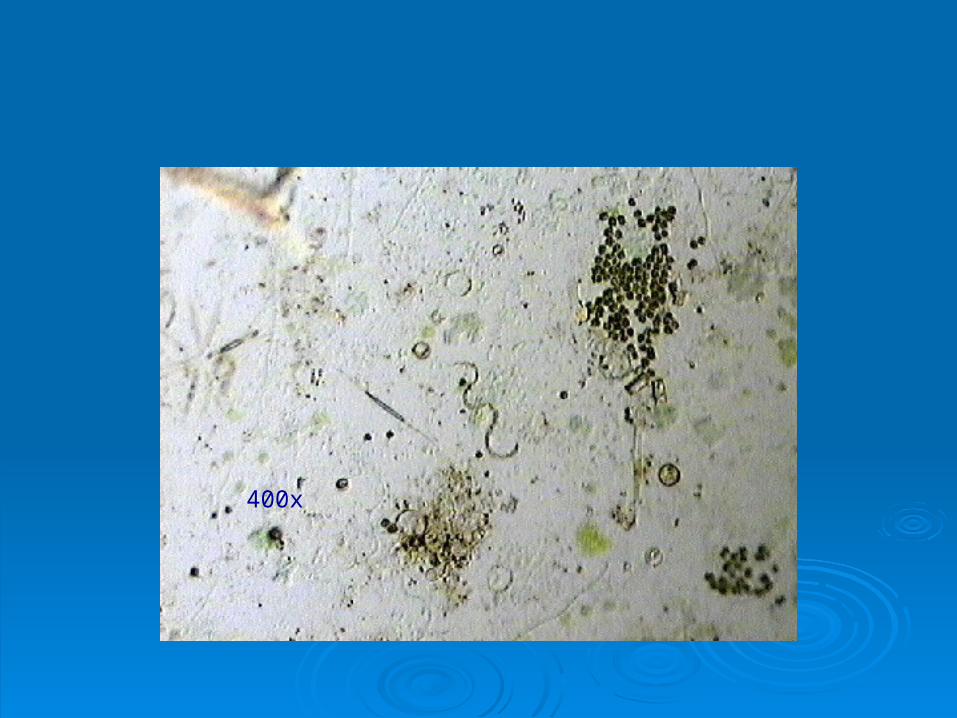
400x
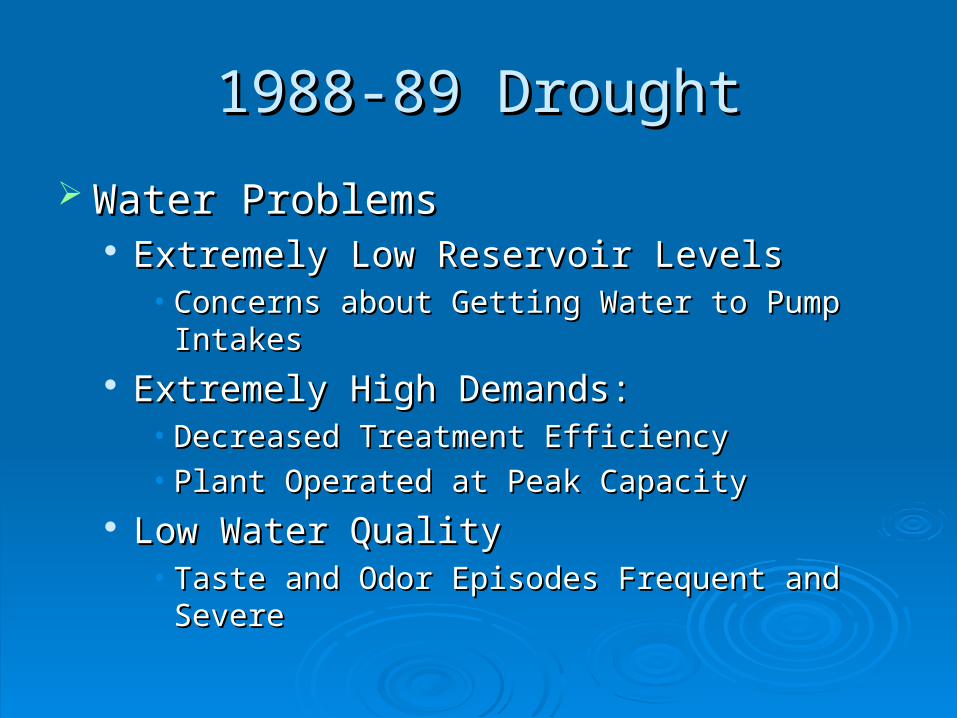
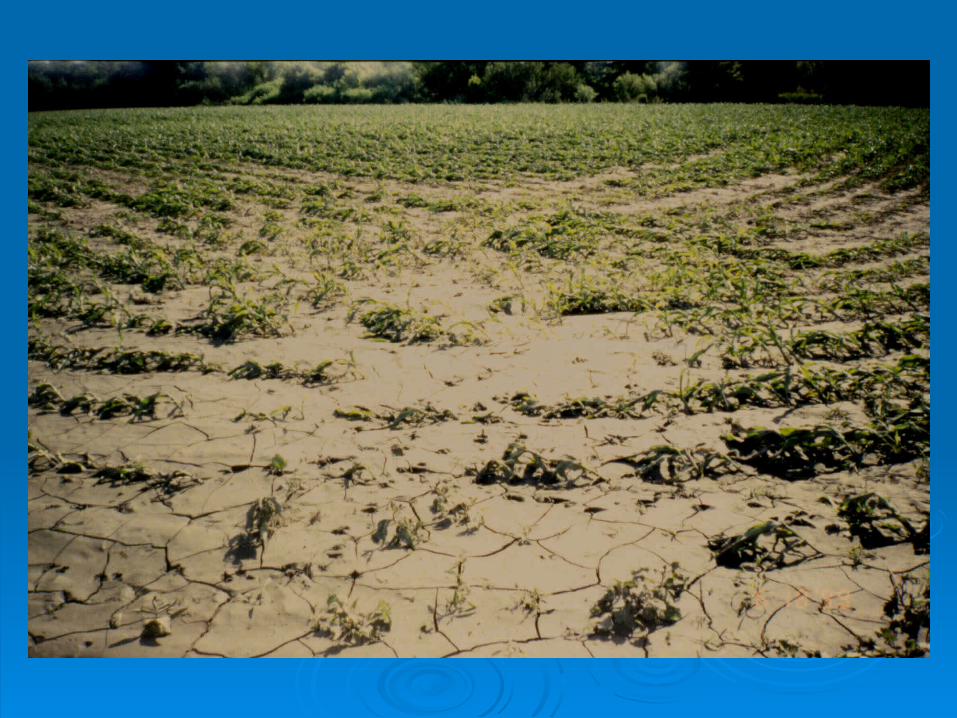
1988-89 Drought1988-89 Drought
Water ProblemsWater Problems Extremely Low Reservoir LevelsExtremely Low Reservoir Levels
• Concerns about Getting Water to Pump Intakes Concerns about Getting Water to Pump Intakes Extremely High Demands:Extremely High Demands:
• Decreased Treatment EfficiencyDecreased Treatment Efficiency• Plant Operated at Peak CapacityPlant Operated at Peak Capacity
Low Water QualityLow Water Quality• Taste and Odor Episodes Frequent and SevereTaste and Odor Episodes Frequent and Severe
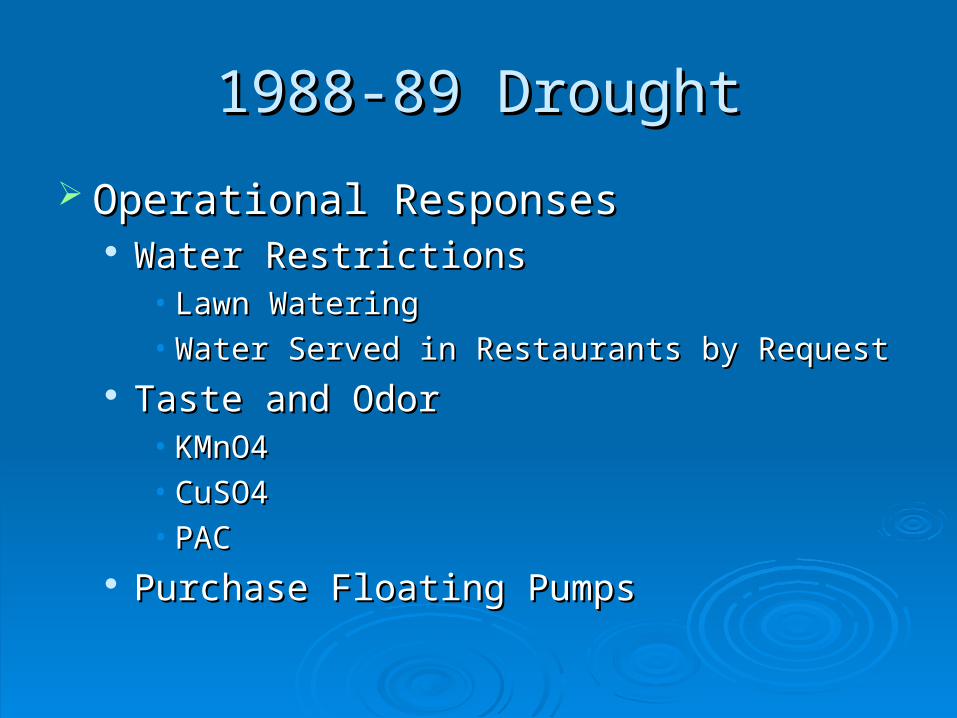
1988-89 Drought1988-89 Drought
Operational ResponsesOperational Responses Water RestrictionsWater Restrictions
• Lawn WateringLawn Watering• Water Served in Restaurants by RequestWater Served in Restaurants by Request
Taste and Odor Taste and Odor • KMnO4KMnO4• CuSO4CuSO4• PACPAC
Purchase Floating PumpsPurchase Floating Pumps
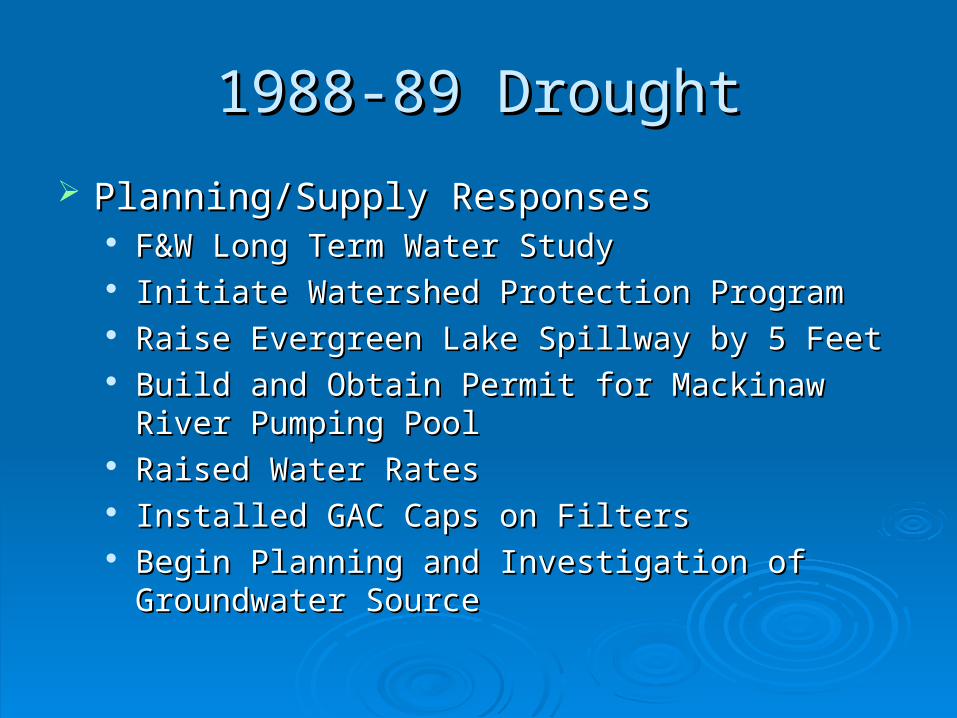
1988-89 Drought1988-89 Drought
Planning/Supply ResponsesPlanning/Supply Responses F&W Long Term Water StudyF&W Long Term Water Study Initiate Watershed Protection ProgramInitiate Watershed Protection Program Raise Evergreen Lake Spillway by 5 FeetRaise Evergreen Lake Spillway by 5 Feet Build and Obtain Permit for Mackinaw River Pumping Build and Obtain Permit for Mackinaw River Pumping
PoolPool Raised Water RatesRaised Water Rates Installed GAC Caps on FiltersInstalled GAC Caps on Filters Begin Planning and Investigation of Groundwater Begin Planning and Investigation of Groundwater
SourceSource
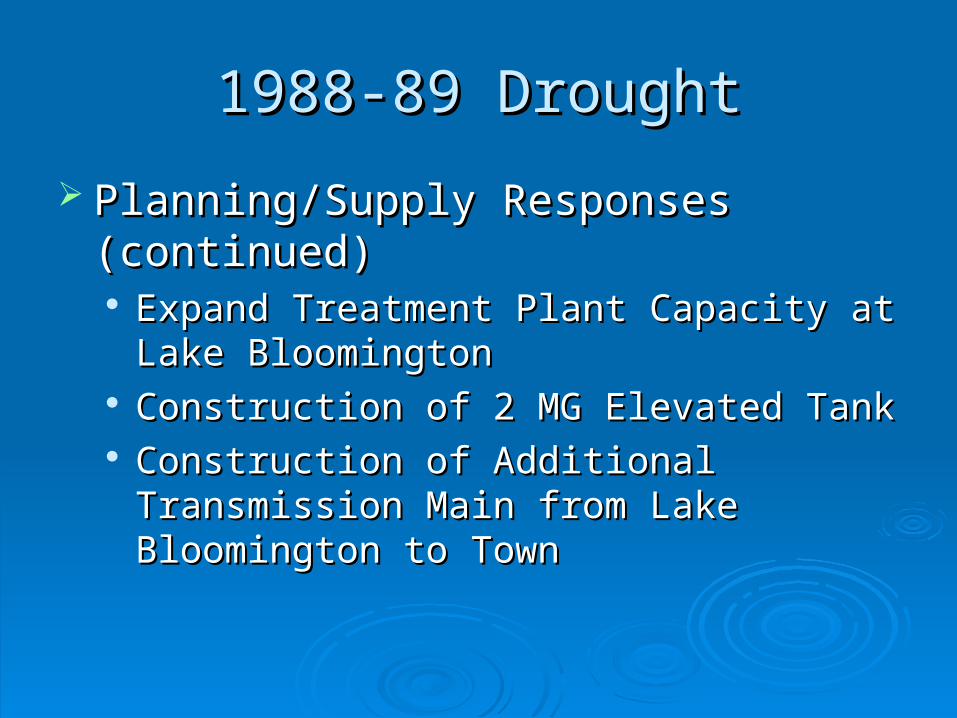
1988-89 Drought1988-89 Drought
Planning/Supply Responses (continued)Planning/Supply Responses (continued) Expand Treatment Plant Capacity at Lake Expand Treatment Plant Capacity at Lake
BloomingtonBloomington Construction of 2 MG Elevated TankConstruction of 2 MG Elevated Tank Construction of Additional Transmission Main Construction of Additional Transmission Main
from Lake Bloomington to Townfrom Lake Bloomington to Town
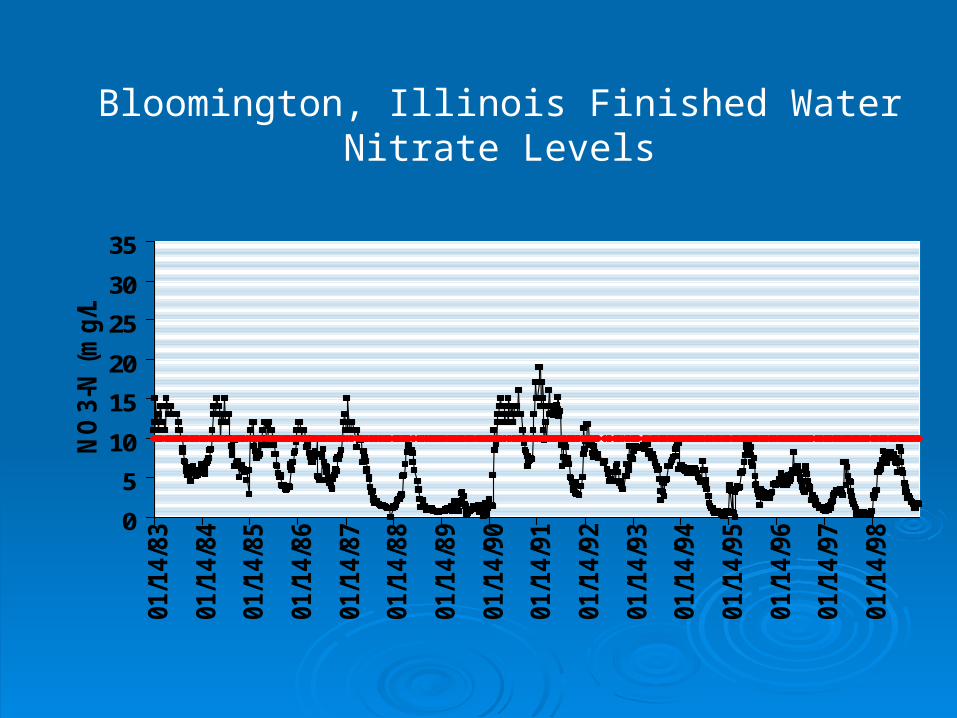
Bloomington, Illinois Finished Water Nitrate Levels
0
5
10
15
20
25
30
35
01
/14/8
3
01
/14/8
4
01
/14/8
5
01
/14/8
6
01
/14/8
7
01
/14/8
8
01
/14/8
9
01
/14/9
0
01
/14/9
1
01
/14/9
2
01
/14/9
3
01
/14/9
4
01
/14/9
5
01
/14/9
6
01
/14/9
7
01
/14/9
8
NO
3-N
(m
g/L
)
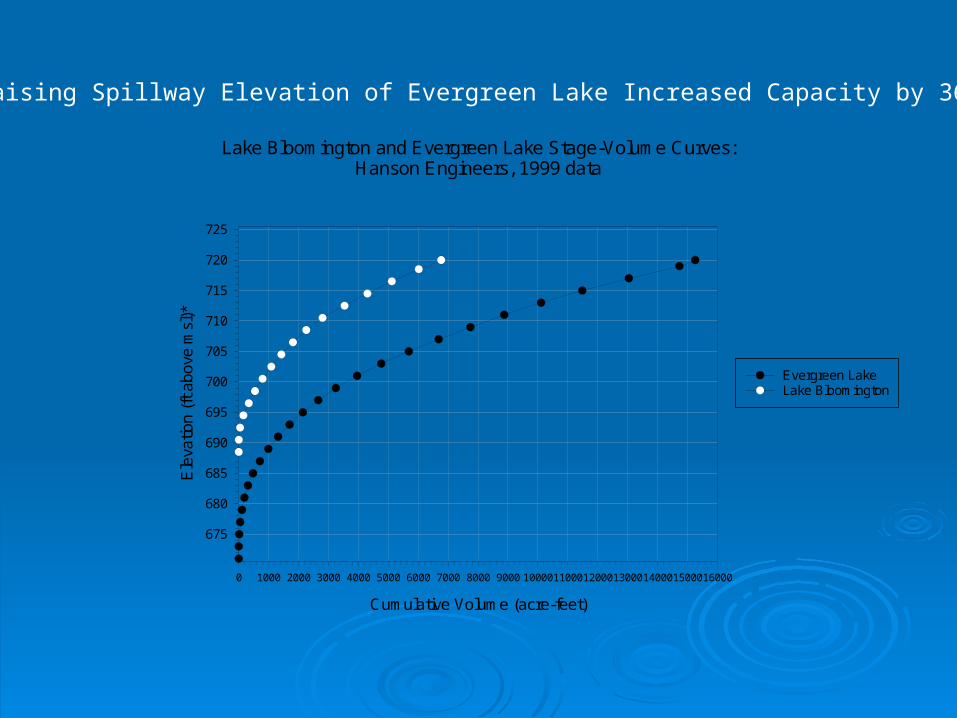
Lake Bloomington and Evergreen Lake Stage-Volume Curves:Hanson Engineers, 1999 data
Cumulative Volume (acre-feet)
0 1000 2000 3000 4000 5000 6000 7000 8000 9000 10000110001200013000140001500016000
Ele
vatio
n (f
t abo
ve m
sl)*
675
680
685
690
695
700
705
710
715
720
725
Evergreen LakeLake Bloomington
Raising Spillway Elevation of Evergreen Lake Increased Capacity by 36%
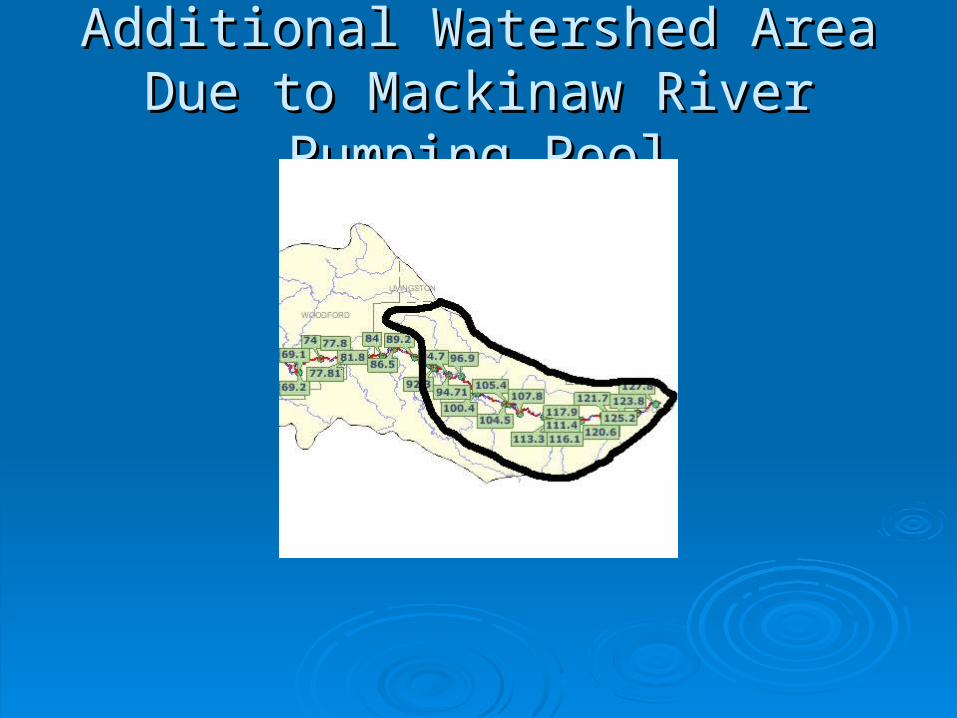
Additional Watershed Area Due to Additional Watershed Area Due to Mackinaw River Pumping PoolMackinaw River Pumping Pool

Drought of 2005Drought of 2005
Demand Hit Plant CapacityDemand Hit Plant Capacity Cool Period Limited Duration of Extreme Cool Period Limited Duration of Extreme
DemandDemand Extra Capacity of Evergreen Lake Extra Capacity of Evergreen Lake
Extended Days of Available SupplyExtended Days of Available Supply Higher Reservoir Levels, GAC Caps, and Higher Reservoir Levels, GAC Caps, and
Destratifiers Resulted in Fewer T&O Destratifiers Resulted in Fewer T&O Issues (initially)Issues (initially)
Drought of 2005Drought of 2005
Pumping Pool: From late December 2005 Pumping Pool: From late December 2005 through April 2006: 364 million gallons through April 2006: 364 million gallons pumped (over a month’s supply at average pumped (over a month’s supply at average usage) despite no/minimal runoff to lakes usage) despite no/minimal runoff to lakes from tributariesfrom tributaries
Extra capacity of Evergreen Lake Extra capacity of Evergreen Lake Reservoir resulted in more reserve Reservoir resulted in more reserve capacity at start of droughtcapacity at start of drought

Responses to the Drought of 2005Responses to the Drought of 2005
Contracted with Wittman Hydro Planning Contracted with Wittman Hydro Planning Associates for Drought Response Plan Associates for Drought Response Plan and Draft Drought Ordinanceand Draft Drought Ordinance
Performed Intensive In-House and Performed Intensive In-House and Contracted Studies of Dealing with Taste Contracted Studies of Dealing with Taste and Odor Causing Compoundsand Odor Causing Compounds
Expand Existing Source Water Protection Expand Existing Source Water Protection EffortsEfforts

Responses to the Drought of 2005 Responses to the Drought of 2005 (continued)(continued)
Initiate Phytoplankton Surveillance Initiate Phytoplankton Surveillance Program and Investigate In-Lake Program and Investigate In-Lake Treatment MethodsTreatment Methods
Continue Supplemental Water Supply Continue Supplemental Water Supply ActivitiesActivities
Update Master Plan, including Blending Update Master Plan, including Blending OptionsOptions
Coordinate TMDL Plans with Drought Coordinate TMDL Plans with Drought Strategies and Emergency PlansStrategies and Emergency Plans

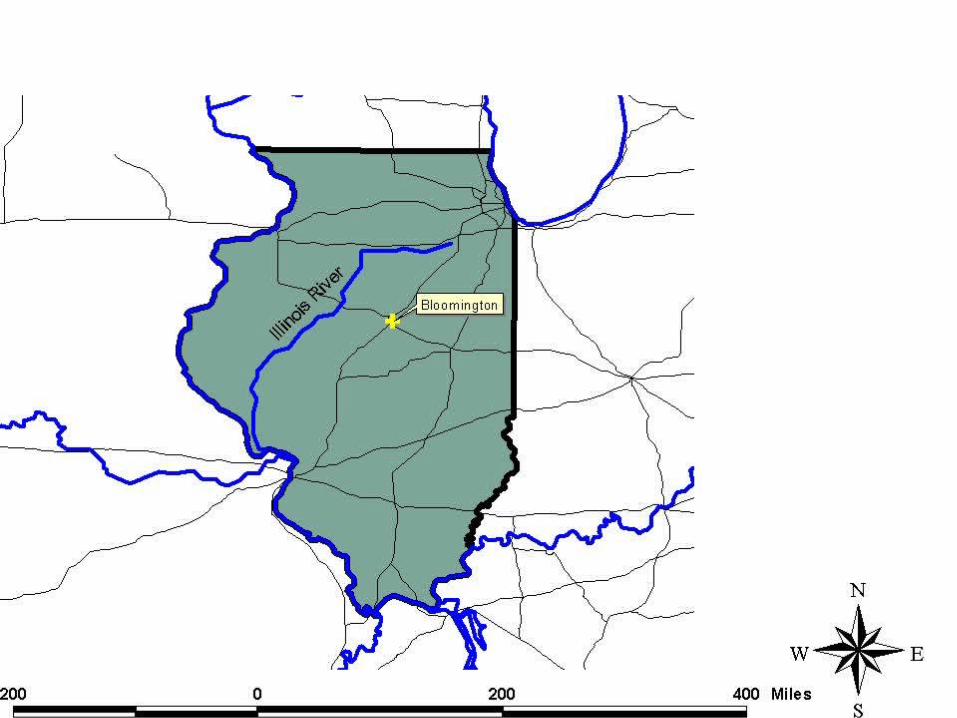
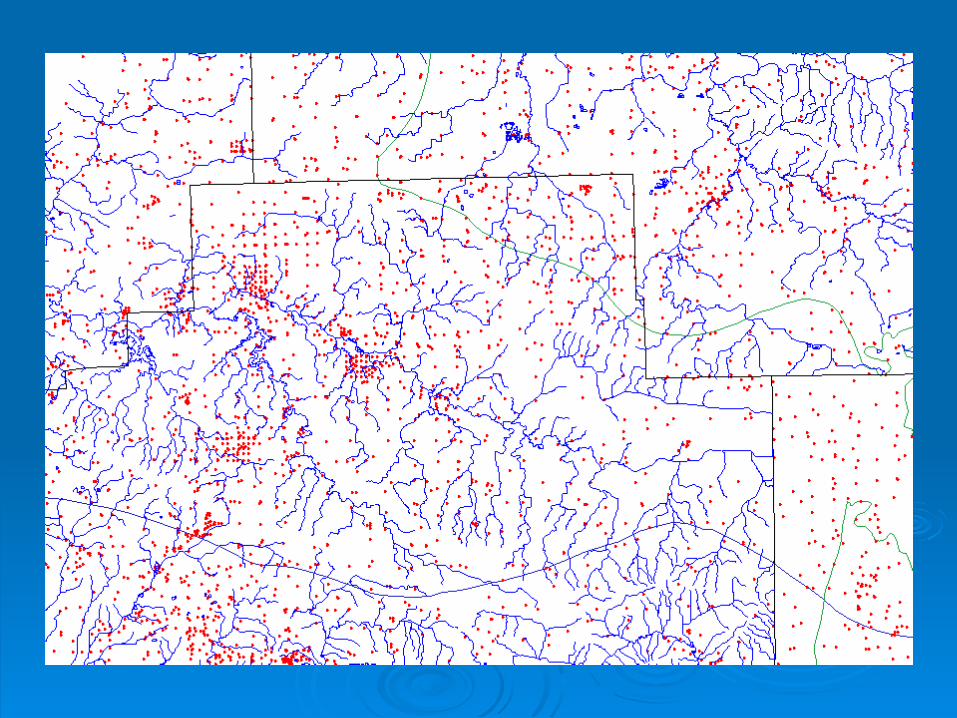
Source: Illinois State Water Survey,Center for Groundwater Science
Mahomet Aquifer

AcknowledgementsDave Stockton, Mayor, City of Bloomington
Bloomington City Council, Tom Hamilton, City Manager
Brian Brakebill, Deputy City Manager
Craig Cummings, Director of Water
Jill Mayes, Bloomington Water Treatment Plant
Dr. John O’Connor, H2O’C Engineering
Dr. Jack Wittman, Wittman Hydro Planning Associates
The Staff of the Bloomington Water Treatment Plant and Water Department
Our Water Customers