+ All Categories
Home > Environment > Blue Water: A Common Platform to Put Water Quality Data in India to Productive Use by Integrating...

Blue Water: A Common Platform to Put Water Quality Data in India to Productive Use by Integrating...

Date post: 22-Jan-2018
Category:
Upload: biplav-srivastava
View: 437 times
Download: 0 times
Share this document with a friend
38
© 2016 IBM Corporation Blue Water Putting Water Quality Data in India to Productive Use by Integrating Historical and Real-time Sensing Data Sandeep Sandha, Dr. Sukanya Randhawa, Dr. Biplav Srivastava IBM Research – India Acknowledgements: Our colleagues at IBM Research and collaborators at various agencies. Talk at CSE Workshop on Mainstreaming Citywide Sanitation at New Delhi, India 4-5 April, 2016
Transcript

© 2016 IBM Corporation

Blue Water – Putting Water Quality Data in India to Productive Use by Integrating Historical and Real-time Sensing Data

Sandeep Sandha, Dr. Sukanya Randhawa, Dr. Biplav Srivastava IBM Research – India

Acknowledgements: Our colleagues at IBM Research and collaborators at various agencies.

Talk at CSE Workshop on Mainstreaming Citywide Sanitation at New Delhi, India 4-5 April, 2016

© 2016 IBM Corporation 2

Acknowledgements / Partners

S. No. Area People, Organization 1 Core Technology Supratik Guha, Theodore G van

Kessel, Hendrik Hamann, Bharat Kumar, Jaikrishnan Hari, Sachin Gupta, Karthik Visweswariah, Anupam Saronwala, IBM Research Worldwide

2 Hindon exploration, Agriculture Use-case

2030 Water Group and their partners; Dr. V. Rajagopalan

3 Yamuna exploration Delhi Jal Board 4 Ganga exploration, Khumbh

use-case Prof. V. Raychoudhary and students, IIT Roorkee

5 Analytics Ben Ford, Prof. M. Tambe and colleagues, University of Southern California, USA

© 2016 IBM Corporation 3

What Our Team Can (And Cannot) Do

§ We are not water quality experts

§  Expertise in helping make decisions via analytics and machine learning §  Expertise in cloud based data management and apps (web, mobile) § WW expertise in physics and chemistry—measurement technique

development §  Expertise in designing robust sensor network systems

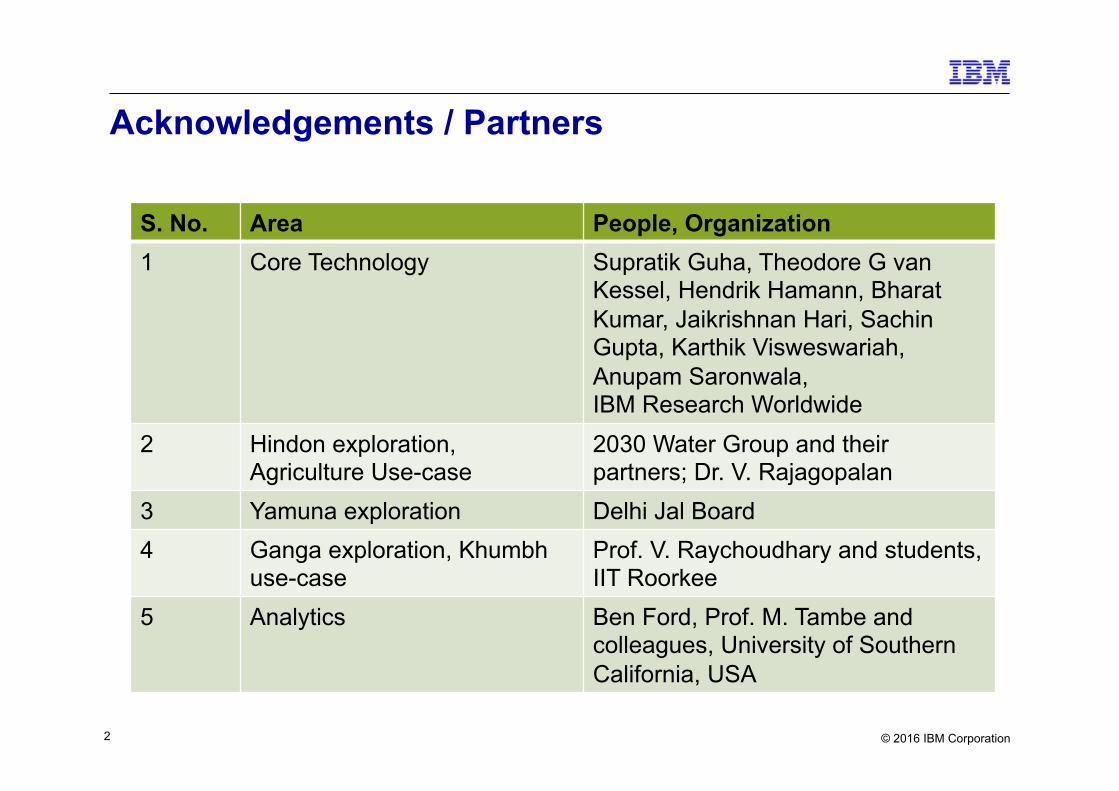
§  IBM Research active in India since 1998, winner of a National Award for developing country focused innovation

–  Have collaborated with local faculty via Faculty Awards, PhD Fellowships and internships

–  Taken many “made-in-India” innovations to the world

© 2016 IBM Corporation 4

Main Messages

§ We want common citizens to make better decisions around water

§ We are building tools that others can use: GangaWatch, Neer Bandhu powered by BlueWater Architecture

§ We are measuring water quality with a novel, multi-sensor approach combining traditional lab tests, real-time sensors and mobile apps –  We use a novel real-time sensing approach of

using mobile platform to collect data at fine spatial and temporal granularity

–  We have done actual measurements on Yamuna, Hindon and Ganga

§ We are looking for partners and business models to help scale and make real impact in a timely manner

Anindica(onofqueriesaboutGanga

Anindica(onofpossibleapproaches

As of April 3, 2016

© 2016 IBM Corporation 5

Better Information Flow is Critical for Better Water Flow

“One barrier to better management of water resources is simply lack of data — where the water is, where it's going, how much is being used and for what purposes, how much might be saved by doing things differently. In this way, the water problem is largely an information problem. The information we can assemble has a huge bearing on how we cope with a world at peak water.” Source: Wired Magazine, “Peak Water: Aquifers and Rivers Are Running Dry. How Three Regions Are Coping”, Matthew Power, April 21st, 2008

The nature of water management must rapidly evolve

From To

Manual Data Collection Automated Sensing Managing Collaboratively

Intermittent Measurement Real-Time Measurement Multiple Data Sets Data Integration “Guesstimation” Tools Modeled Decision Support Commodity Pricing Value Pricing Tactical Problem Solving Strategic Risk Management

Managing in Isolation

© 2016 IBM Corporation 6

[India] Ganga – Local Ground Situation @ Varanasi (Assi/ Tulsi Ghats) + Patna

Photos of/ at Assi/ Tulsi Ghat, Varanasi on 25 March 2016 during 1700-1800 Hrs

Assi Ghat post recent cleanup Bathing on Tulsi Ghat

A nullah draining into Ganga A manual powered boat

Photos at Gandhi Ghat, Patna on 18 March 2016 during 1700-1800 Hrs

Common scene around Indian water bodies

© 2016 IBM Corporation 7

Decision Example –River Water Pollution

§  Value – To individuals, businesses, government institutions –  Example – Can I take a bath? Will it cause me dysentery? –  Example – How should govt spend money on sewage treatment for maximum

disease reduction?

§  Data – Quantitative as well as qualitative –  Dissolved oxygen, –  pH, –  … 30+ measurable quantities of interest

§  Access – –  Today, little, and that too in water technical jargon –  In pdf documents, website

Key Idea: Can we make insights available when needed and help people make better decisions?

© 2016 IBM Corporation 8

Demo: GangaWatch

Data Covering Ganga Basin Fine-grained Geo-tagged Data from a Real Time Run on Yamuna

© 2016 IBM Corporation 9

ArtofPossibleTanneryExample:Kanpur,India

© 2016 IBM Corporation 10

BackgroundofLeatherTanningProblem

•  > 700 tanneries in Kanpur –  Employing > 100,000 people –  Bringing > USD 1B revenue

•  Discharge water after leather processing to river or Sewage treatment plants (STPs) –  Requirement

•  Must have their own treatment facility •  Or, have at least chrome recovery unit

–  But don’t implement due to costs which is a burden to main operations •  Installation •  Operations : electricity, manpower, technology upgrade, …

–  State pollution board is supposed to do inspections to enforce but doesn’t perform effectively

•  Government’s STPs do not process chrome, the main pollutant •  Knee-jerk reaction: 98 tanneries banned in Feb 2016 by National

Green Tribunal; more threatened

© 2016 IBM Corporation 11

NECTAR: Nirikshana for Enforcing Compliance for Toxic wastewater Abatement and Reduction Protecting the Nectar of the Ganga River through Game-Theoretic Factory Inspections, B. Ford, A. Yadav, A. Singh, M. Brown, A. Sinha, B. Srivastava, C. Kiekintveld, M. Tambe 14th International Conference on Practical Applications of Agents and Multi-Agent Systems, Sevilla, Spain, June 1-3, 2016.

"Very promising approach. Use of decoys and data-driven random were not known in the inspection community where it was known that random could help. Surprise elements of decoys and variable fines provide new factors for compliance. The data from drone monitoring can help improve the plans significantly as future work." Dr. Venkatraman Rajagopalan, IAS Ex-Secretary, Ministry of Environment, Forests and Climate Change, and Ex-Chairman, Central Pollution Control Board, India

Setting •  Attackers

•  M sites with N factory units each

•  When inspection at a site happens, all units know

•  Defenders •  Inspectors base office is

fixed •  Inspection team

consists of •  Environment Inspectors •  Security personnel •  Transport provider / drivers

•  Inspection team starts and ends at their office

•  Security and transport can vary daily

•  Objective •  Create daily inspection

plan which minimizes violation over a time period

MainResultsProposedmethodachievescompliancefasterthanexis(ngmethodsandscalefast.•  Usedactualloca(onof50tanneriesinKanpur•  Withafixedfine(onefineamountforallsites)

anddecoys,compliancefromallsites(simultaneously)willbeachievedfasterthanexis(ngmethods.

•  Withavariablefine(basedonnumberoffactoriesatthesite),proposedmethodperformsbeGerthanexis(ngmethods,withorwithoutdecoys.

•  Canimprovefurtherwithmonitoredpollu(ondata

Joint work with USC, USA

© 2016 IBM Corporation 12

Outline

§ Background – Challenges, Trends, Motivation §  Illustrative Case Study – Tanneries at Kanpur § Pollution Sensing, Analytics Platform

– What’s new – Yamuna @Delhi [Dec 2015] – Ganga @Haridwar [Mar 2016 - ]

§ Discussion

© 2016 IBM Corporation 13

Water Pollution Sensing

§ Method 1: Sample collection and lab-testing –  Accurate when done well –  Time-consuming, costly and for a few places at a time –  Only quantitative –  Science: lab tests, sample collection

§ Method 2: Real-time sensing –  Timely, inexpensive –  Some parameters are NOT feasible –  Only quantitative –  Science: how to deploy sensors and analyze data

§ Method 3: Crowd-sourcing –  Timely, inexpensive –  Only qualitative assessment –  Practical for India with people and mobiles –  Science: Combining qualitative and quantitative data

© 2016 IBM Corporation 14

Quantitative Sensing Scope

Dimension {Yamuna | Hindon| Ganga} Scenario focus General, Agriculture

Real-time measurement DO, pH, conductivity, turbidity

Lab / samples BOD, COD, FCC

Sensing COTS sensors, Machine learning, In-lab test

Data ingestion Bluemix cloud, Cloudant database

Primary §  Temp §  ORP §  D.O §  EC §  Turbidity §  Pressure §  Nitrate §  GPS Lat §  GPS Long

Secondary

•  Resistivity •  TDS •  Salinity •  SeaWater Sigma

Sensor Measures

© 2016 IBM Corporation 15

Water Qualitative Data Via Crowdsourcing – NeerBandhu App

Data at http://nalanda.haifa.il.ibm.com/naturetrack/visualization.php

© 2016 IBM Corporation 16

Gaps Filled by Our Approach

§ High spatial and temporal resolution (real-time) – Current data are at low resolution of few places and limited time

points; limits usage in applications – Use floating platform and real-time sensor to collect GPS-enabled

data – Use location to re-create water body condition

§ New source of data (qualitative; crowd-sourcing) § Fusion of historic and new real-time data on single platform with

safety levels and purpose § Future: contextualize quantitative data with qualitative inputs for

data validation and stakeholders buy-in

© 2016 IBM Corporation 17

Sensing on Yamuna

© 2016 IBM Corporation 18

Real-Time Sensor Deployment

© 2016 IBM Corporation 19

Day1-mulFpleanchoringapproachesforreal-Fmesensoronanotherday(16Dec)in2-3kmstretch

16-Dec-15

LocaFonName DescripFonSample-collected Sample-tesFng Sensor@site

RealFme(Stretch) NeerBandhu

1Point1[A] Nigambodh,inwaterY

Y(ph,DO,Temp,Turb,Cond,BOD,FCC) Y Y

2Point2[B] Y Y3Point3[C] ITObridge Y Y Y4Point4[D] Y Y

5Pointe5[E] YY(ph,DO,Temp,Turb,Cond) Y

6Point6 Moving(7-8Kmph) Y 7Point7 Moving(10Kmph) Y Y

8Point8 Drain YY(ph,DO,Temp,Turb,Cond) Y Y

9Point9 WithTedbuoy Y

© 2016 IBM Corporation 20

Dec 16 Example Run

16/12/15 13:59:34

16/12/15 13:46:50

•  ~12 minute downstream travel

•  765 data points

© 2016 IBM Corporation 21

TurbidityinYamuna–measuredon16thDec,2015Datamin:56.7Datamax:138Gradient:Default

© 2016 IBM Corporation 22

Day2-Covered~7-8kmone-wayononeofthedays(18Dec)roughlycovering33%ofthenavigablestretchofYamunainDelhi(22kmone-way).

18-Dec-15

LocaFonName DescripFonSample-collected Sample-tesFng Sensor@site

RealFme(Stretch) NeerBandhu

1Point21[AA] Nigambodh,inwaterY

Y(ph,DO,Temp,Turb,Cond,BOD,FCC) Y Y

2Point22[AB] Pastrope(ISBT) Y Y3Point23[AC] 2ndrope Y Y

4Point24[AD] Drain YY(ph,DO,Temp,Turb,Cond) Y Y Y

5Pointe25[AE] Drain Y Y6Point26[AF] Drain,gurudwara Y Y

7Point27[AG] Wazirabadbridge YY(ph,DO,Temp,Turb,Cond) Y Y Y

8Point28[AH]Majnuka(la,greenery Y Y

9Point29[AI] 1strope,ISBT Y

© 2016 IBM Corporation 23

Dec 18 Example Run

2015/12/18,12:13:45

2015/12/18,12:51:37

•  ~38 minute upstream travel

•  2273 data points

© 2016 IBM Corporation 24

TurbidityinYamuna–measuredon18thDec,2015Datamin:37.5Datamax:144.4Gradient:Default

© 2016 IBM Corporation 25

Lab Samples and Traditional Testing

© 2016 IBM Corporation 26

16/12/2016 18/12/2016 Temp(°C) 15.93 15.34 pH 7.82 7.81 ORP(mV) -182 -86.4 D.O(mg/L) 3.76 3.53 EC (µS/cm) 1604 1279 Turbidity (F.N.U) 84.25 66.9 BOD (mg/L) 46 28.2 Fecal Coliform (No./100 mL) 430 210

ChangeinparametersmeasuredfortwodifferentdaysS

enso

r La

b

More water released into river

© 2016 IBM Corporation 27

NBQualitaFveData

http://nalanda.haifa.il.ibm.com/naturetrack/visualization.php

© 2016 IBM Corporation 28

Correlating RT Sensor and Crowd Data to Get Verifiable Data!

© 2016 IBM Corporation 29

Sensing on Ganga

Joint work with Prof. Vaskar Raychoudhury and students at IIT Roorkee

© 2016 IBM Corporation 30

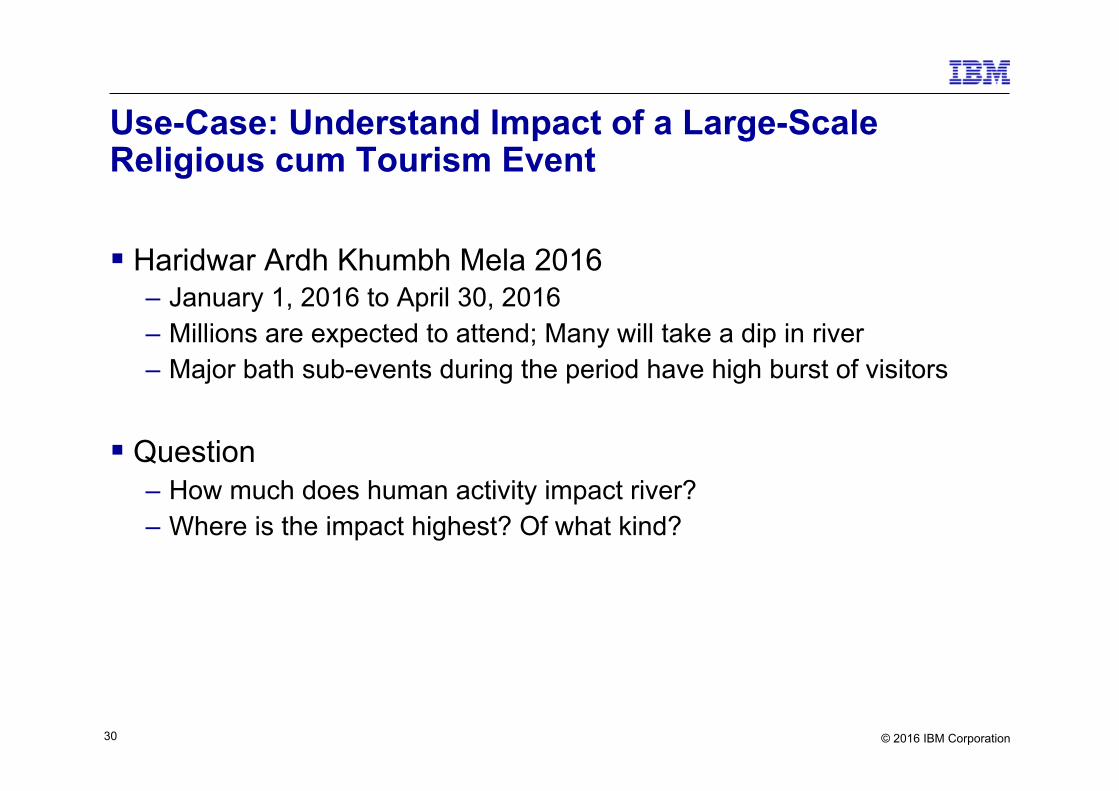
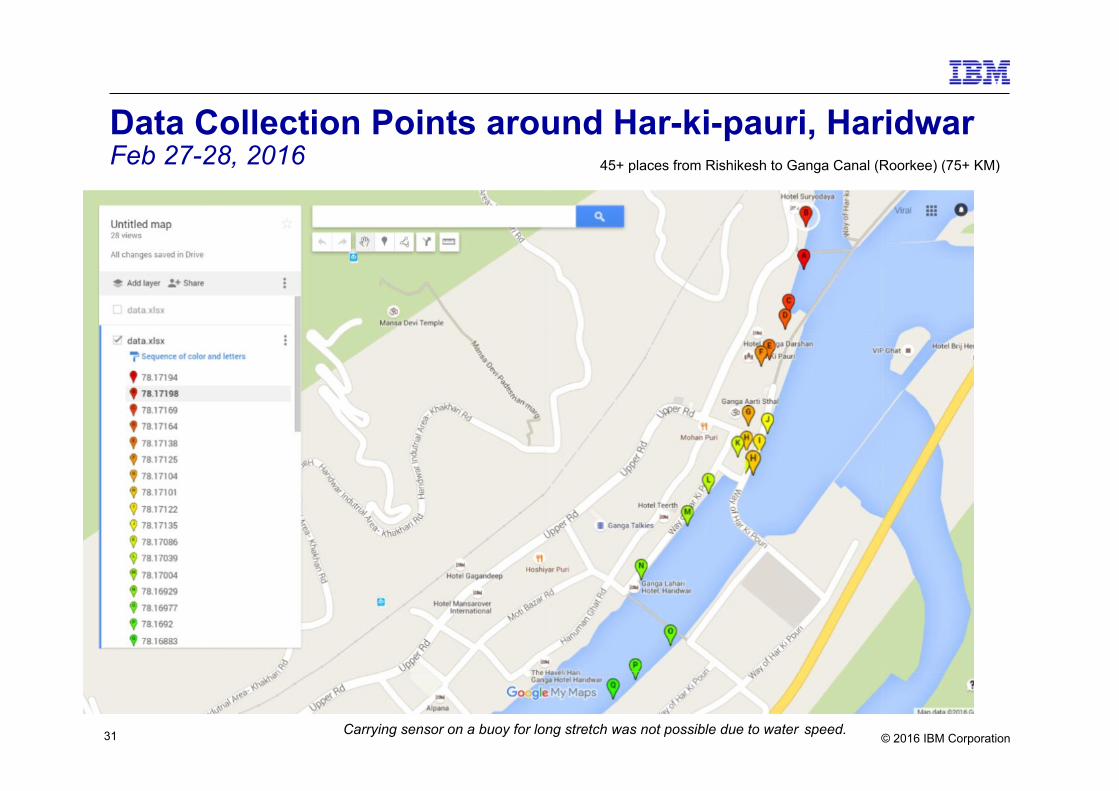
Use-Case: Understand Impact of a Large-Scale Religious cum Tourism Event

§ Haridwar Ardh Khumbh Mela 2016 –  January 1, 2016 to April 30, 2016 – Millions are expected to attend; Many will take a dip in river – Major bath sub-events during the period have high burst of visitors

§ Question – How much does human activity impact river? – Where is the impact highest? Of what kind?

© 2016 IBM Corporation 31

Data Collection Points around Har-ki-pauri, Haridwar Feb 27-28, 2016

Carrying sensor on a buoy for long stretch was not possible due to water speed.

45+ places from Rishikesh to Ganga Canal (Roorkee) (75+ KM)

© 2016 IBM Corporation 32

Turbidity Variations Feb 27-28, 2016

Turbidity values at different places (places marked red have turbidity value above the drinking range, places marked blues ha turbidity value in range of drinking water)

© 2016 IBM Corporation 33

Pollution on Major Bath Day around Har-ki-pauri, Haridwar March 7, 2016

Turbidity values at different places (places marked red have turbidity value above the drinking range, places marked blues ha turbidity value in range of drinking water)

© 2016 IBM Corporation 34

Outline

§ Background – Challenges, Trends, Motivation §  Illustrative Case Study – Tanneries at Kanpur § Pollution Sensing, Analytics Platform

– What’s new – Hindon @Meerut and upstream [Sep 2015] – Yamuna @Delhi [Dec 2015] – Ganga @Haridwar [Mar 2015 - ]

§ Discussion

© 2016 IBM Corporation 35

Blue Water Architecture

© 2016 IBM Corporation 36

Research Issues

§ Sensing – How to sense cost-effectively? (Quantitative sensing)

•  Install sensors •  Ensure sensor up-keep, inspections

– How to involve people-as-sensors? (Qualitative sensing) •  Use people as inspectors (increase resources for defense) •  Mobilization when needed on short notice •  Devising incentives for contribution

© 2016 IBM Corporation 37

Research Issues

§  Interconnection – Within water: quantitative and qualitative; relation between fresh and

sewage water – Across domains: energy implications on water management, physical

safety, waste water treatment

§ Analytics – Deliver overall-value from invested assets – Pricing to incentivize water conservation and behavioral change

© 2016 IBM Corporation 38

Call for Action

§ Join environment community under Indian open data, http://data.gov.in

§ User NeerBandhu to contribute data, use them § Use GangaWatch app to use available data § Focus on a water use-case and look at how you can formulate a

basic problem; solve them


Recommended