22
BLUEBERRY BLUEBERRY TRENDS AND TRENDS AND MARKET MARKET CHALLENGES CHALLENGES
| Date post: | 11-Mar-2018 |
| Category: |
Documents |
| Upload: | phungtuyen |
| View: | 215 times |
| Download: | 2 times |

BLUEBERRY BLUEBERRY TRENDS AND TRENDS AND
MARKET MARKET CHALLENGESCHALLENGES
BLUEBERRY MARKET BLUEBERRY MARKET SITUATIONSITUATION
• Health Interest Continues to Drive Blueberry Demand
• Blueberry Interest Encourages Increased Worldwide Blueberry Production
• Industry Efforts Needed to Keep Demand Ahead of Supply
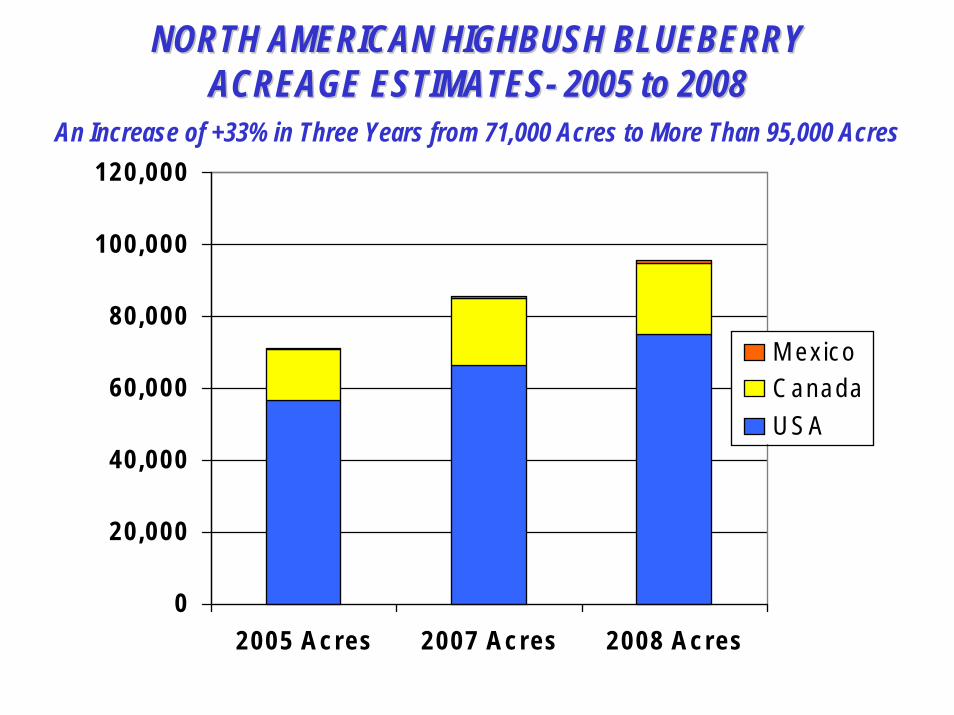
NORTH AMERICAN HIGHBUSH BLUEBERRY NORTH AMERICAN HIGHBUSH BLUEBERRY ACREAGE ESTIMATESACREAGE ESTIMATES-- 2005 to 20082005 to 2008
An Increase of +33% in Three Years from 71,000 Acres to More Than 95,000 Acres
0
20 ,0 00
40 ,0 00
60 ,0 00
80 ,0 00
100 ,000
120 ,000
2005 A c re s 2007 A c res 2 008 A c re s
M ex icoC anadaU S A
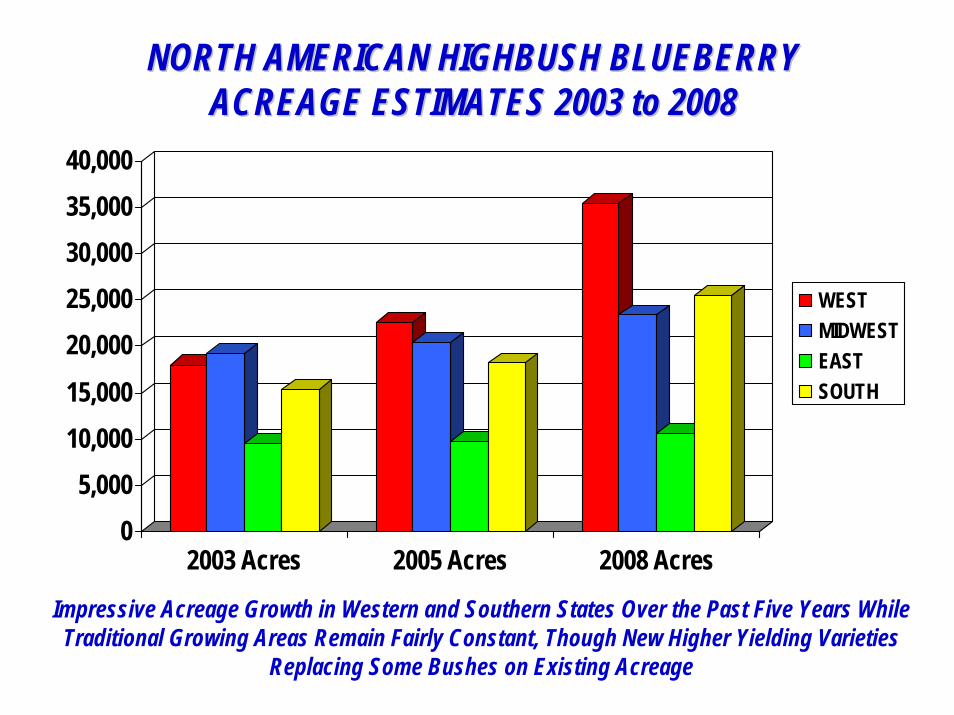
NORTH AMERICAN HIGHBUSH BLUEBERRY NORTH AMERICAN HIGHBUSH BLUEBERRY ACREAGE ESTIMATES 2003 to 2008ACREAGE ESTIMATES 2003 to 2008
05,000
10,00015,00020,00025,00030,00035,00040,000
2003 Acres 2005 Acres 2008 Acres
WESTMIDWESTEASTSOUTH
Impressive Acreage Growth in Western and Southern States Over the Past Five Years While Traditional Growing Areas Remain Fairly Constant, Though New Higher Yielding Varieties
Replacing Some Bushes on Existing Acreage
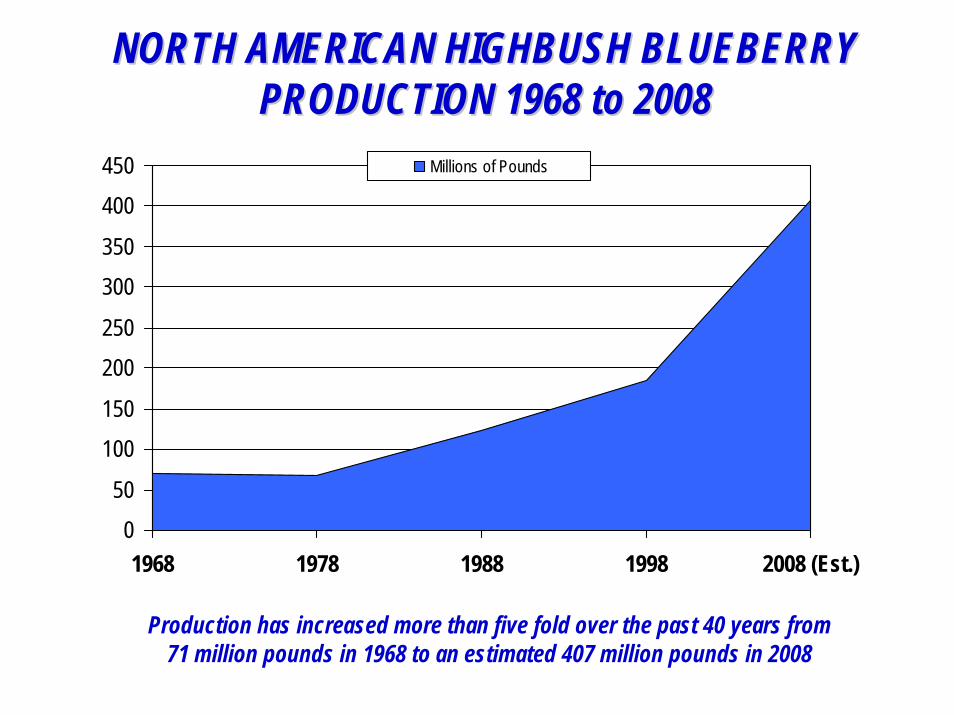
NORTH AMERICAN HIGHBUSH BLUEBERRY NORTH AMERICAN HIGHBUSH BLUEBERRY PRODUCTION 1968 to 2008PRODUCTION 1968 to 2008
050
100150
200250
300350
400450
1968 1978 1988 1998 2008 (Est.)
Millions of Pounds
Production has increased more than five fold over the past 40 years from 71 million pounds in 1968 to an estimated 407 million pounds in 2008
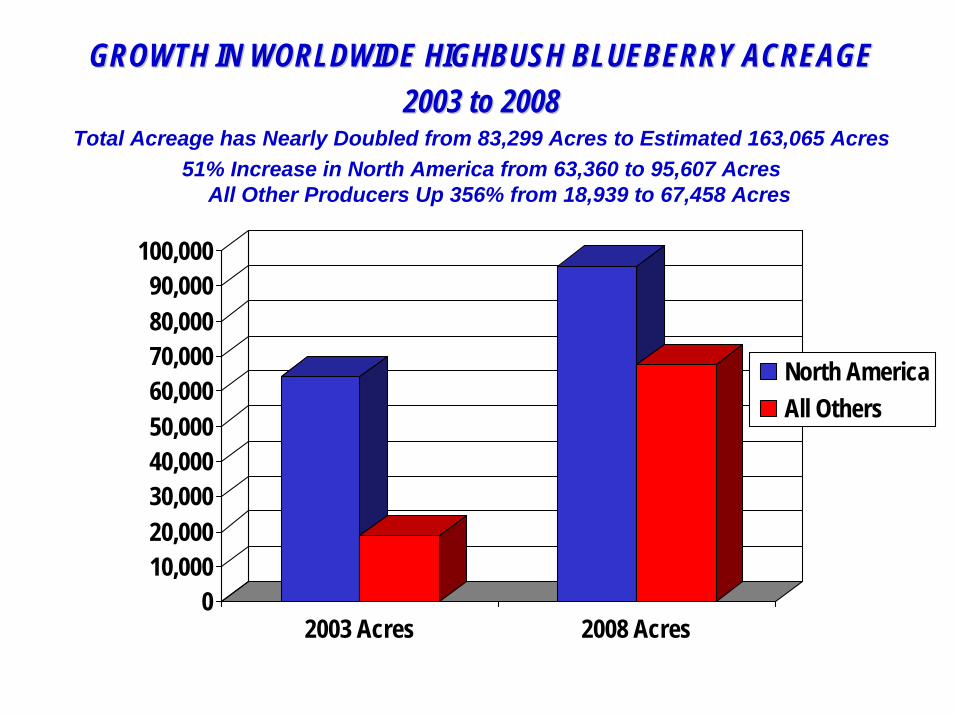
GROWTH IN WORLDWIDE HIGHBUSH BLUEBERRY ACREAGE GROWTH IN WORLDWIDE HIGHBUSH BLUEBERRY ACREAGE 2003 to 20082003 to 2008
Total Acreage has Nearly Doubled from 83,299 Acres to Estimated 163,065 Acres51% Increase in North America from 63,360 to 95,607 Acres
All Other Producers Up 356% from 18,939 to 67,458 Acres
010,00020,00030,00040,00050,00060,00070,00080,00090,000
100,000
2003 Acres 2008 Acres
North AmericaAll Others
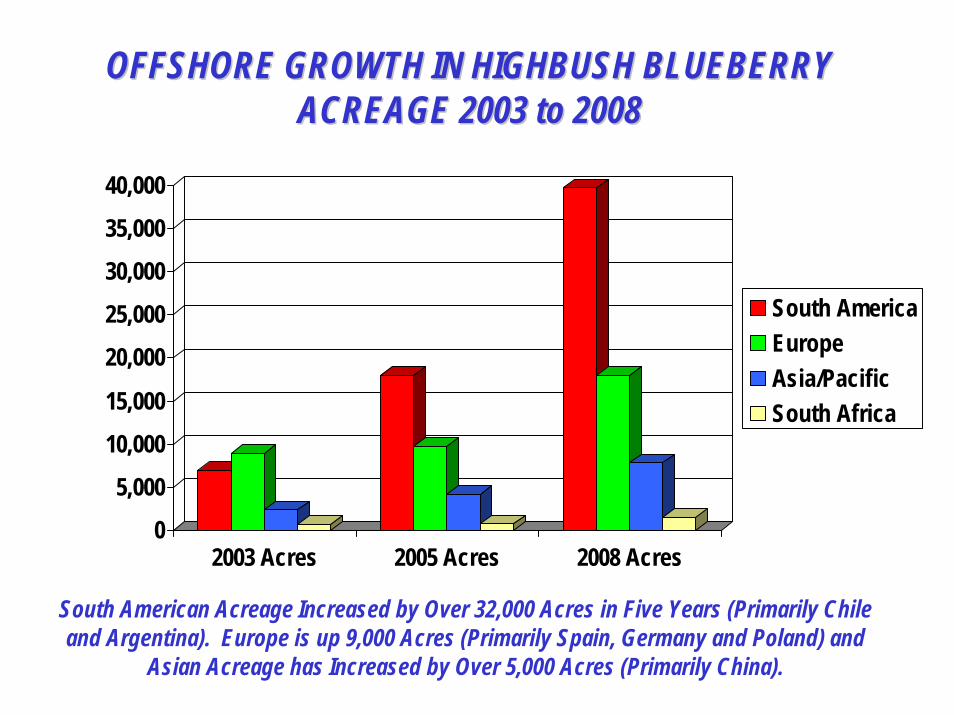
OFFSHORE GROWTH IN HIGHBUSH BLUEBERRY OFFSHORE GROWTH IN HIGHBUSH BLUEBERRY ACREAGE 2003 to 2008ACREAGE 2003 to 2008
05,000
10,00015,000
20,00025,00030,00035,00040,000
2003 Acres 2005 Acres 2008 Acres
South AmericaEuropeAsia/PacificSouth Africa
South American Acreage Increased by Over 32,000 Acres in Five Years (Primarily Chile and Argentina). Europe is up 9,000 Acres (Primarily Spain, Germany and Poland) and
Asian Acreage has Increased by Over 5,000 Acres (Primarily China).
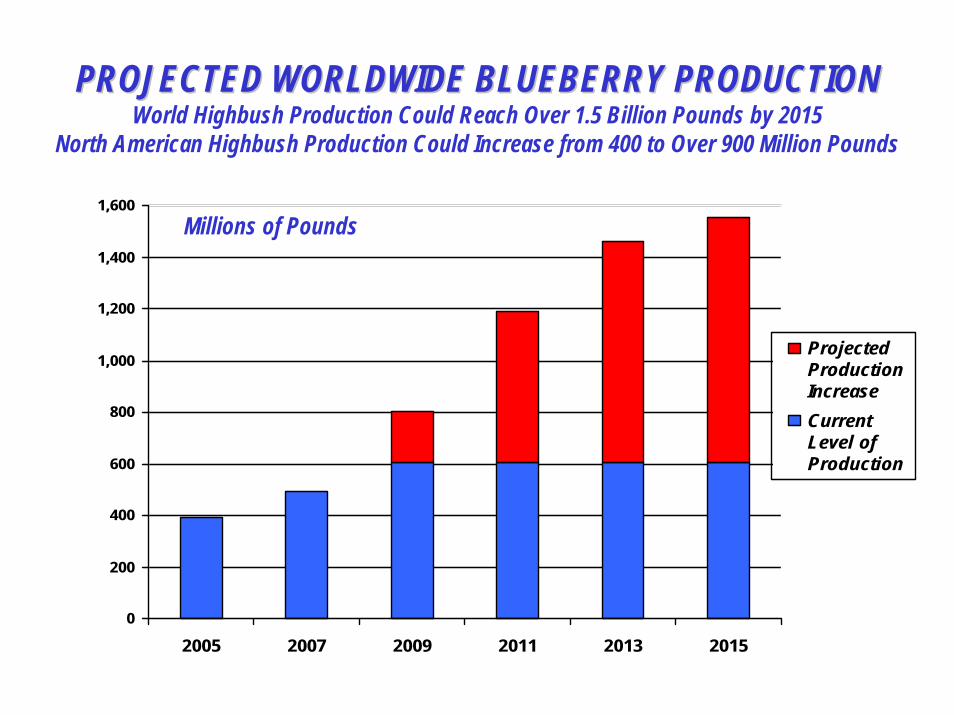
PROJECTED WORLDWIDE BLUEBERRY PRODUCTIONPROJECTED WORLDWIDE BLUEBERRY PRODUCTIONWorld Highbush Production Could Reach Over 1.5 Billion Pounds by 2015
North American Highbush Production Could Increase from 400 to Over 900 Million Pounds
0
200
400
600
800
1,000
1,200
1,400
1,600
2005 2007 2009 2011 2013 2015
ProjectedProductionIncreaseCurrentLevel ofProduction
Millions of Pounds
MARKET OPPORTUNITIESMARKET OPPORTUNITIES
• Blueberry Per Capita Consumption has Room to Grow• Underdeveloped Domestic Markets• Limited Volume Currently Allocated to Offshore Markets • Blueberries Continue as Key Ingredient in New Product
Development• Blueberry “Health Halo” Remains a Purchase Driver
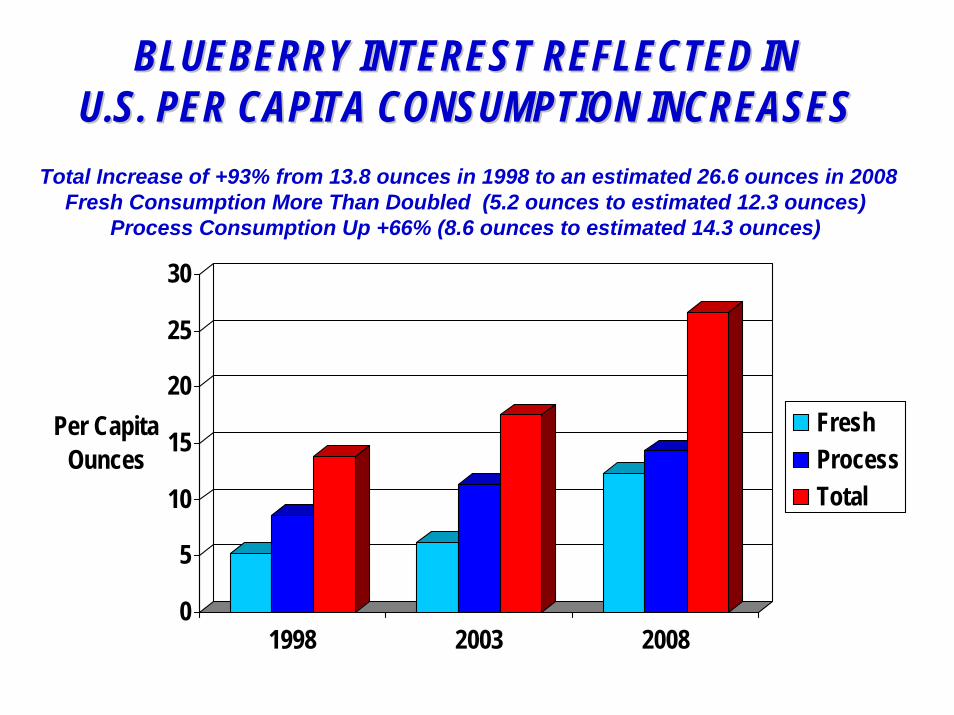
BLUEBERRY INTEREST REFLECTED INBLUEBERRY INTEREST REFLECTED INU.S. PER CAPITA CONSUMPTION INCREASESU.S. PER CAPITA CONSUMPTION INCREASES
Total Increase of +93% from 13.8 ounces in 1998 to an estimated 26.6 ounces in 2008 Fresh Consumption More Than Doubled (5.2 ounces to estimated 12.3 ounces)
Process Consumption Up +66% (8.6 ounces to estimated 14.3 ounces)
0
5
10
15
20
25
30
Per CapitaOunces
1998 2003 2008
FreshProcessTotal
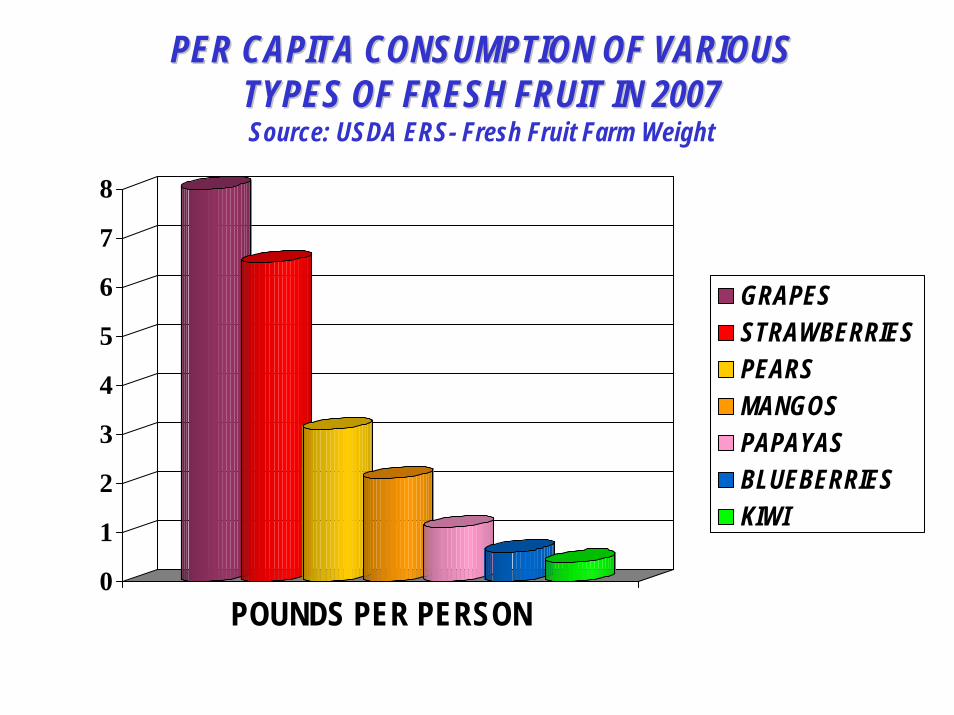
PER CAPITA CONSUMPTION OF VARIOUS PER CAPITA CONSUMPTION OF VARIOUS TYPES OF FRESH FRUIT IN 2007TYPES OF FRESH FRUIT IN 2007Source: USDA ERS- Fresh Fruit Farm Weight
0
1
2
3
4
5
6
7
8
POUNDS PER PERSON
GRAPESSTRAWBERRIESPEARSMANGOSPAPAYASBLUEBERRIESKIWI
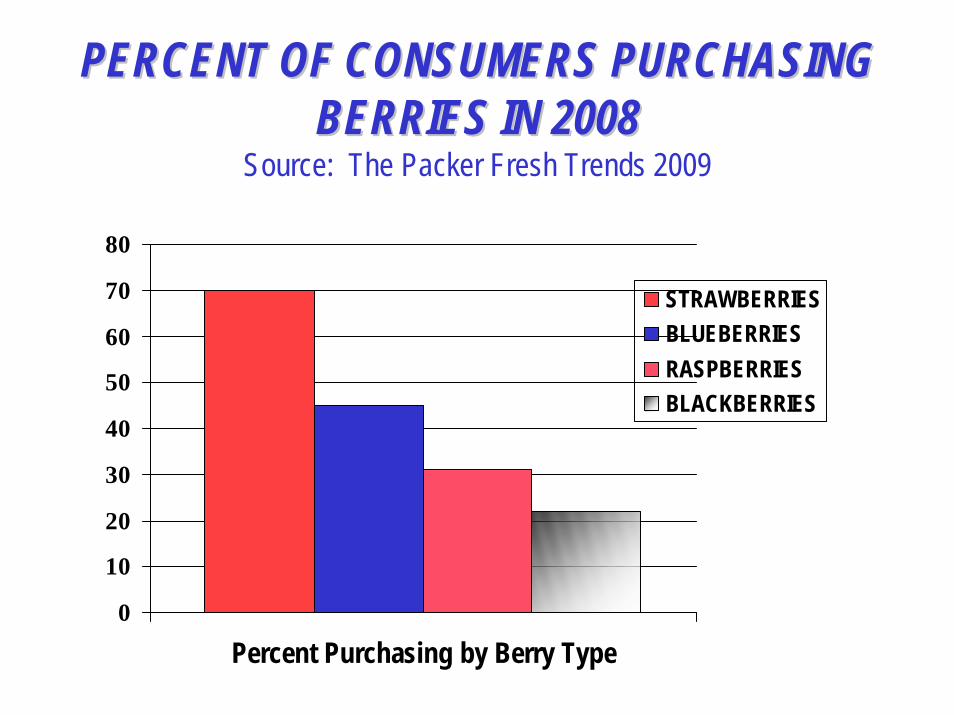
PERCENT OF CONSUMERS PURCHASING PERCENT OF CONSUMERS PURCHASING BERRIES IN 2008BERRIES IN 2008
Source: The Packer Fresh Trends 2009
0
10
20
30
40
50
60
70
80
Percent Purchasing by Berry Type
STRAWBERRIESBLUEBERRIESRASPBERRIESBLACKBERRIES
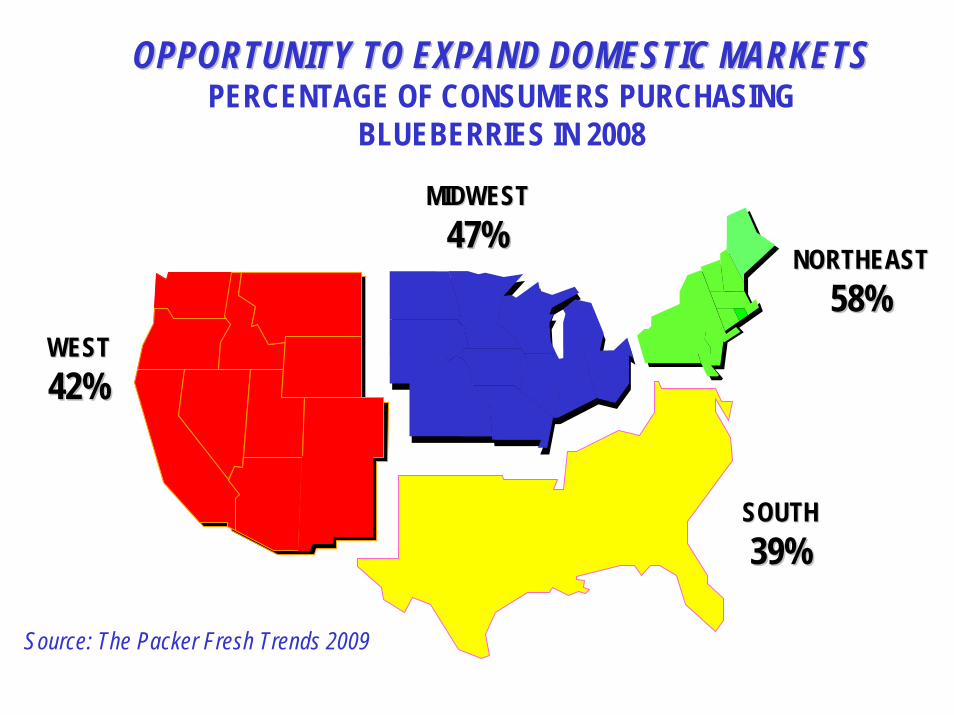
OPPORTUNITY TO EXPAND DOMESTIC MARKETS OPPORTUNITY TO EXPAND DOMESTIC MARKETS PERCENTAGE OF CONSUMERS PURCHASING
BLUEBERRIES IN 2008
WEST WEST 42%42%
MIDWESTMIDWEST47%47%
SOUTHSOUTH39%39%
NORTHEASTNORTHEAST58%58%
Source: The Packer Fresh Trends 2009
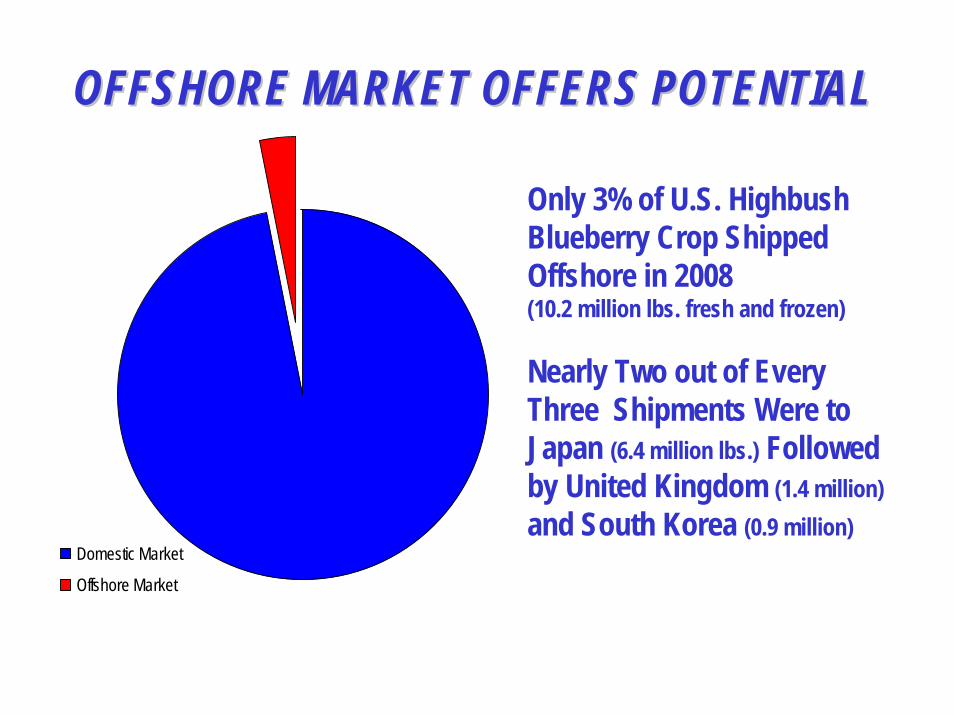
OFFSHORE MARKET OFFERS POTENTIALOFFSHORE MARKET OFFERS POTENTIAL
Domestic Market
Offshore Market
Only 3% of U.S. Highbush Blueberry Crop Shipped Offshore in 2008 (10.2 million lbs. fresh and frozen)
Nearly Two out of Every Three Shipments Were to Japan (6.4 million lbs.) Followed by United Kingdom (1.4 million)and South Korea (0.9 million)

INDIA NOW OPEN TO FRESH BLUEBERRY IMPORTSINDIA NOW OPEN TO FRESH BLUEBERRY IMPORTS
One Billion Potential Blueberry Customers
Growing Middle Class Interested in High Quality Goods
First Fresh Shipments- September 2008
Sampling Promotions at Big Bazaar Stores in Mumbai and New Delhi
Blueberries Well Accepted with 78% Noting Taste as “Excellent”
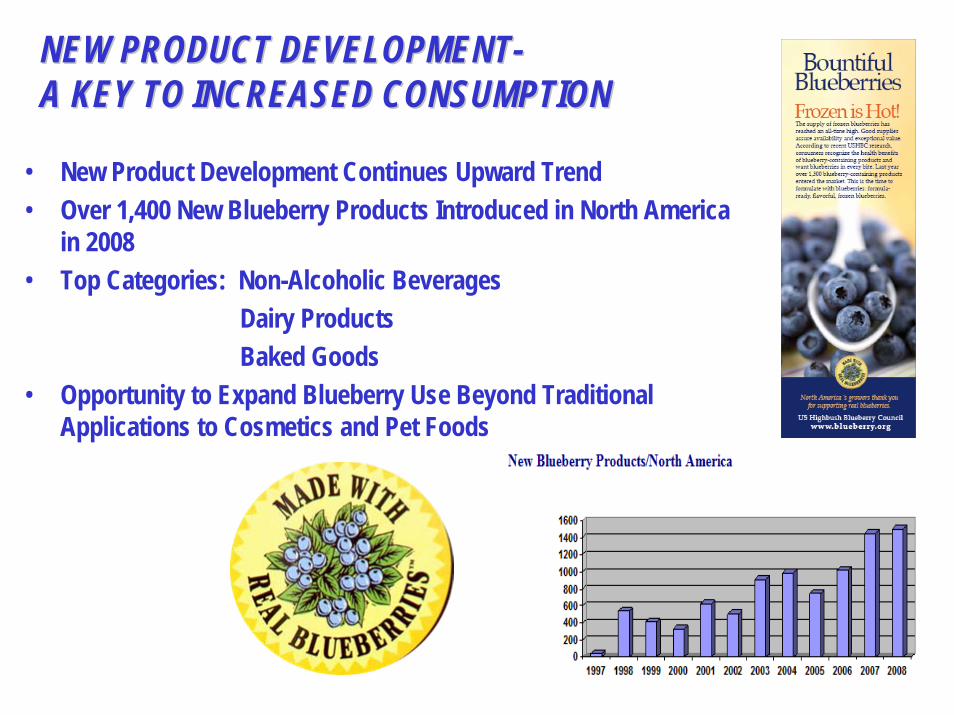
NEW PRODUCT DEVELOPMENTNEW PRODUCT DEVELOPMENT--A KEY TO INCREASED CONSUMPTIONA KEY TO INCREASED CONSUMPTION
• New Product Development Continues Upward Trend• Over 1,400 New Blueberry Products Introduced in North America
in 2008• Top Categories: Non-Alcoholic Beverages
Dairy ProductsBaked Goods
• Opportunity to Expand Blueberry Use Beyond Traditional Applications to Cosmetics and Pet Foods

HEALTH RESEARCH HEALTH RESEARCH A MAJOR COMPONENT OF USHBC MARKET A MAJOR COMPONENT OF USHBC MARKET
PROMOTION PROGRAMPROMOTION PROGRAM
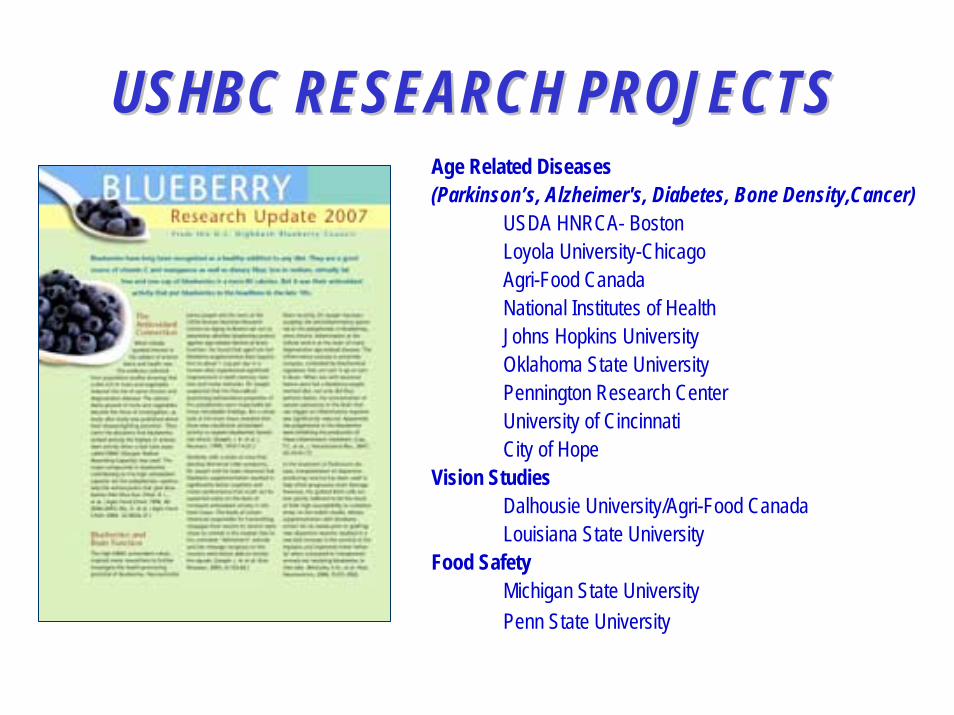
USHBC RESEARCH PROJECTSUSHBC RESEARCH PROJECTSAge Related Diseases (Parkinson’s, Alzheimer's, Diabetes, Bone Density,Cancer)
USDA HNRCA- BostonLoyola University-ChicagoAgri-Food CanadaNational Institutes of HealthJohns Hopkins UniversityOklahoma State UniversityPennington Research CenterUniversity of CincinnatiCity of Hope
Vision StudiesDalhousie University/Agri-Food Canada Louisiana State University
Food SafetyMichigan State UniversityPenn State University

Given Growth Projections Will Need to Significantly Given Growth Projections Will Need to Significantly Increase Per Capita Consumption by Year 2015Increase Per Capita Consumption by Year 2015
Increase U.S. Per Capita Consumption by +65% from Estimated 26.6 Ounces in 2008to 44.0 Ounces by 2015 to Keep Pace WithRecord Levels of Production
USHBC BLUEPRINT 2015 USHBC BLUEPRINT 2015 Building Demand to Meet Future SupplyBuilding Demand to Meet Future Supply
• Expand Health Research and Move to Human Clinical Trials• Reach Out to a Larger Audience, Explore New Markets and
Uses• Maintain Consumer Awareness of Blueberries and Health
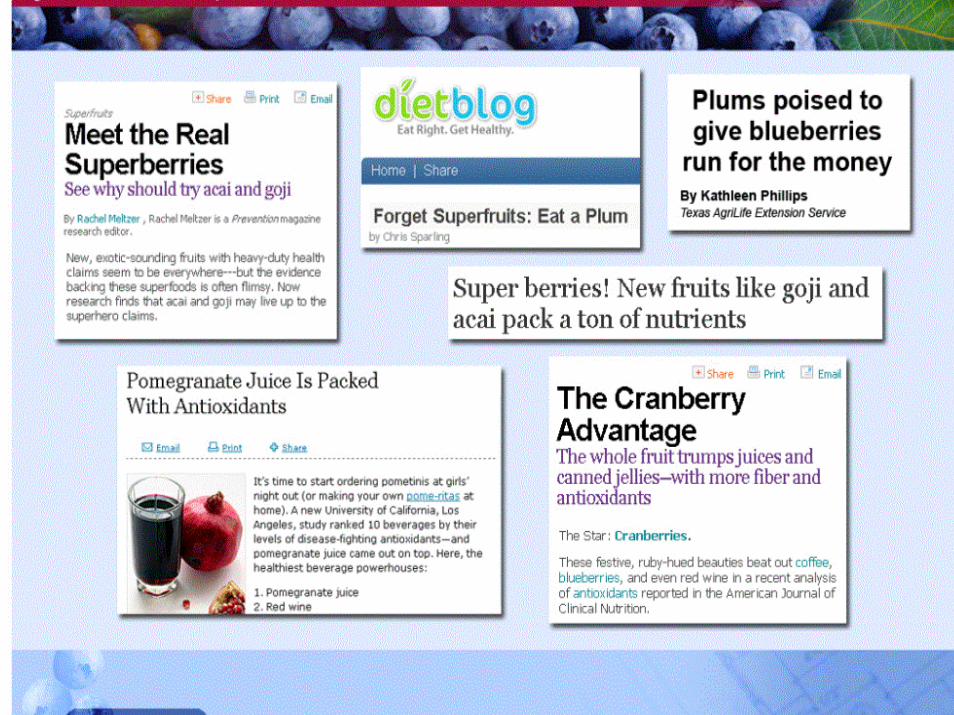
Given More Aggressive Claims By Other Fruit and Vegetable Groups
• Expand Current Promotional Activities and Broaden Audience Reach Through Advertising Programs
• Support Good Management and Food Safety Practices

www.blueberry.org


![Blueberry Hill - Kiama Blowhole Buskers€¦ · Blueberry Hill [C] /// /// [F] /// /// [G7] stop [Tacet] I found my [F]thrill ..... on Blueberry [C]Hill ..... On Blueberry [G] Hill](https://static.documents.pub/doc/80x56/5f334258c6a82b4839519c93/blueberry-hill-kiama-blowhole-buskers-blueberry-hill-c-f-g7.jpg)


