AbstractBackground: Accurate assignment of genes to pathways is essential in order to understand thefunctional role of genes and to map the existing pathways in a given genome. Existing algorithmspredict pathways by extrapolating experimental data in one organism to other organisms for whichthis data is not available. However, current systems classify all genes that belong to a specific ECfamily to all the pathways that contain the corresponding enzymatic reaction, and thus introduceambiguity.
Results: Here we describe an algorithm for assignment of genes to cellular pathways thataddresses this problem by selectively assigning specific genes to pathways. Our algorithm uses theset of experimentally elucidated metabolic pathways from MetaCyc, together with statisticalmodels of enzyme families and expression data to assign genes to enzyme families and pathways byoptimizing correlated co-expression, while minimizing conflicts due to shared assignments amongpathways. Our algorithm also identifies alternative ("backup") genes and addresses the multi-domain nature of proteins.
We apply our model to assign genes to pathways in the Yeast genome and compare the results forgenes that were assigned experimentally. Our assignments are consistent with the experimentallyverified assignments and reflect characteristic properties of cellular pathways.
Conclusion: We present an algorithm for automatic assignment of genes to metabolic pathways.The algorithm utilizes expression data and reduces the ambiguity that characterizes assignmentsthat are based only on EC numbers.
BackgroundPathways are cellular procedures that are associated witha specific functionality in the cell, such as amino acid syn-thesis and degradation, energy metabolism, signal trans-duction, molecular oxidation, and more. The complexityof a cell is a function of its underlying procedures. There-fore, there is a strong interest in identifying the activepathways in an organism. This knowledge can not only
shed light on the mechanisms the cell uses to acquire itsfunctional role; by assigning genes to pathways one canalso better understand the exact role of these genes, andidentify key genes whose existence is crucial to sustainnormal cell functionality.
A wealth of experimental data about molecular complexesand cellular processes that has been accumulated in the
literature initiated several projects that attempted to com-pile the existing knowledge into publicly available data-bases. Among these are EMP [1], MPW [2], WIT [3], UM-BBD [4], KEGG [5], MetaCyc [6], ERGO [7] and SEED [8].These databases store valuable information about hun-dreds of pathways and cellular processes.
Much of the research on pathways so far focused onextrapolating pathways from one organism to other. Thegoal of this research goes beyond just storing, analyzingand extrapolating the biochemical information andstrives to improve the known data by discovering varia-tions to pathways in different organisms as well as to dis-cover novel pathways.
Attempting to complement the experimental data andextend its utility to other systems and newly sequencedgenomes, several methods were developed for pathwayprediction. One approach to pathway reconstruction is toutilize the existing knowledge on enzymatic reactions tocreate a complete graph of a possible metabolic network[9-12]. However, this approach is sought with complexityproblems and it is hard to verify the validity of these pre-dictions. Several studies manually constructed andcurated the metabolic networks for organisms likeEscherichia coli [13-15], Haemophilus influenzae [16]and Saccharomyces cerevisiae [17,18], from a variety ofdata sources and literature. These studies have an advan-tage over automated pathway reconstruction, as thereconstructed networks are more likely to be biologicallyplausible. However, this approach requires close humanintervention.
Perhaps the most popular approach for pathway predic-tion is based on extrapolation. Procedures developed byWIT, KEGG, MetaCyc and ERGO use blueprints of path-ways collected either from biochemical charts or fromactually observed pathways in different organisms, andassign genes to pathways based on homology betweengenes across organisms, database annotations, and man-ual curration. Specifically, many known pathways aremetabolic pathways that consist mostly of sets of reac-tions catalyzed by specific enzymes that are designated bytheir Enzyme Classification (EC) number [19]. Most ofthe existing methods for metabolic pathway predictionthat are based on pathway blueprints assign the vastmajority of genes to pathways based on their EC designa-tion (some address also the problem of finding missingenzymes [20-24]). However, since certain reactionsappear in multiple pathways, this method will assign allenzymes that can catalyze a certain reaction (termed iso-zymes) to all pathways that contain this reaction. Forexample, genes that are designated as malate dehydroge-nase (EC 1.1.1.37) are classified to several different path-ways (including mixed acid fermentation,
gluconeogenesis, superpathway of fatty acid oxidationand glyoxylate cycle, respiration, and more), all of whichuse the same oxidization reaction that is catalyzed bythese genes.
Clearly, this nondiscriminatory assignment of genes topathways is suboptimal, as it is unlikely that all genes withthe same EC designation are used in all pathways that con-tains the corresponding reaction. Rather, it is more likelythat different genes are used in different pathways, and ithas been suggested [25] that "the primary role of isozymesis to allow for differential regulation of the reactions thatare shared by different processes". However, this informa-tion is sparse and without additional experiments it is veryhard to make this type of functional differentiation. Theextent of this problem is not negligible. For example, ofthe 469 pathways in MetaCyc, 336 have at least one reac-tion in common with another pathway. Since in mostgenomes there are multiple instances of some enzymefamilies, the common method for pathway prediction(that is based only on EC numbers) results in many-to-many ambiguous mapping between genes and pathways.
Pathway assignment can be aided by the existence ofmicroarray technology [26-29]. This technology enablesgenome-wide measurements of cell activity, providing uswith snapshots of the molecular machinery at differenttimes along the cell cycle and under different experimen-tal conditions. This data can help to identify groups ofgenes that are co-expressed, i.e. that are likely to exist inthe cell at the same time or under the same set of condi-tions. Although the sequence of reactions in a pathwaydoes not take place simultaneously, given the time-resolu-tion of the mRNA expression measurements these reac-tions can be considered to occur instantly andsimultaneously for all practical purposes. Therefore, it isexpected that genes that participate in the same pathwaywill have similar expression profiles, i.e. they will co-existand will be concurrently available at the cell's disposal tocomplete the pathway. Indeed, correlation in expressionprofiles has been observed for linear pathways that consistof sequences of reactions [25]. It has been also shown thatprediction based on search in the pathway space improveswhen pathways are scored using expression data [30].Other studies used expression data to score gene classesand pathways, in search of interesting classes or modulesof genes or to verify the existence of certain pathways in agenome [31-38]. Expression data can also suggest theexistence of control mechanisms and pathway switches.For example, when a pathway has a fork, isozymes mightbe used to switch between the alternate routes, resultingin anti-correlation [25]. A detailed discussion of thesestudies and others in the field of pathway prediction andanalysis appears in Appendix A.
Page 2 of 25(page number not for citation purposes)
Here, based on this premise, we propose a method forimproving the gene-to-pathway assignment problem andrefining the large-scale predictions of pathways providedby systems like WIT, Pathway Tools and KEGG (that useEC designation only). Our method utilizes pathway blue-prints, statistical models of protein families and expres-sion data. As opposed to previous methods, our algorithmfocuses on elucidating the correct assignment of genes topathways and expression data is used to score assignmentsrather than pathways. Our algorithm predicts all assign-ments simultaneously, while resolving possible conflictsand optimizing the correlated expression.
The paper is organized as follows. We first describe ourmodel and the prediction algorithm. Next we evaluate ourmethods by running a full-scale prediction on the yeastgenome. Finally we compare our predictions to the fewassignments that were verified experimentally.
ResultsOur model organism is Yeast. This choice was motivatedby the myriad of experimental data available for the Yeastgenome, and specifically, time-series expression datawhich is not readily available for other genomes. Ourstudy integrates pathway data with expression data andsequence data. Information on the datasets used in thisstudy is available in the 'Methods' section.
There are many definitions of pathways in the literatureand on-line, depending on the context in which they areused. In our work we adopt the same definition that isused in many other studies and underlies the pathways indatabases such as MetaCyc and KEGG. As was character-ized concisely in [39]: "A metabolic pathway is a sequenceof consecutive enzymatic reactions that brings about thesynthesis, breakdown, or transformation of a metabolitefrom a key intermediate to some terminal compound. Ametabolic pathway may be linear, cyclic, branched, tiered,directly reversible, or indirectly reversible."
We formalize the concept of a metabolic pathway accord-ing to this definition and it is assumed that each pathwayP consists of a set of enzymatic reactions which togetherperform a certain function. Each reaction can be catalyzedby enzymes that are typically associated with one Enzymefamily F.
Pathway assignments – algorithm overviewOur algorithm for assigning genes to pathways takes asinput
• A genome G = {g1, g2, ..., gN}
• Expression data E = {Ei} where Ei is the expression pro-file of gene gi
• An assignment of genes to enzyme families F = {F1, ..,FJ}
• A set of metabolic pathways P = {P1, .., PK}.
Our method consists of the following steps:
1. Search for probable pathways. For each pathway Pk ∈ P:
(a) match enzymes with the reactions that make up thepathway;
(b) eliminate the pathway if more than θ of the reactionscannot be associated with genes (here we set θ = 0.5).
The resulting set of pathways is denoted P'
2. Compute initial pathway assignments and sort assign-ments according to the score from high to low.
3. Refine assignments. Given the assignments from theprevious step:
(a) compute the conflict graph;
(b) compute the connected components in the conflictgraph;
(c) solve the conflicts within each connected component.
We now proceed to describe each step in detail.
Search for probable pathwaysTo assign genes to pathways in a given sequenced andannotated genome, we use the descriptions of the path-ways from MetaCyc and the classification of genes toenzyme families (based on annotations or statistical mod-els, as described in 'Methods') to initially match eachenzyme with a reaction and therefore with a pathway.
We denote by F(Pk) = {F1, F2, ..., Fm} the set of pathwayfamilies – the protein families that catalyze the reactionsthat make up pathway Pk, where m is the number of differ-ent reactions (the number of reactions need not be equalto the number of families, however, each reaction in apathway is usually associated with one family). A pathwayis kept if at least m/2 of its reactions can be assigned withenzymes. Formally, denote by F(G) the set of families thatcan be associated with at least one gene in the genome G.A pathway Pk is considered probable in the genome G if|F(Pk) ∩ F(G)| ≥ m/2. We denote the set of probable path-ways by P', and our algorithm proceeds only with path-ways in P'. Note that at this stage there might be multiplegenes assigned to the same reaction.
Page 3 of 25(page number not for citation purposes)
Initial pathway assignmentsAfter eliminating the improbable pathways we generateinitial assignments by computing the best individualassignment for each candidate pathway, independently.We are given a pathway Pk with m reactions. In search forthe optimal assignment we consider all genes in each oneof the families F1, F2, ..., Fm ∈ F(Pk), resulting in |F1| × |F2|× ...|Fm| possible assignments. Each possible combinationis considered and we evaluate its significance by comput-ing the total correlation score between genes. I.e. the scoreof assignment A = (g1, g2, ..., gm) s.t. gi ∈ Fi is defined as theaverage co-expression score
where sim(Ei, Ej) is the expression similarity of genes gi
and gj as described in 'Methods' and wi is the weight thatrepresents the likelihood that gene gi belongs to family Fi
and is defined as where
evalue(i) is the significance of the match between gene iand the statistical model of family Fi (see 'Methods'). Forexample, assume the best match with family Fi is observedfor an annotated gene with evalue of 10-20. Then a genethat is classified to that family with evalue of 10-10 isassigned a weight of 0.5.
After computing all the assignment scores we sort them inthe order from best to worst. The best assignment isselected as the one that maximizes the average score.
Multi-domain proteinsOf the 71,638 proteins in our database with an EC desig-nation (see section 'Data sets' in 'Methods'), about 1241have multiple enzymatic domains. Of which, the majority(1076 proteins) are two-domain proteins that form 173unique combinations. A simple statistical analysis revealsthat these proteins are more likely to contribute all theirdomains to the same pathway. Specifically, we computedthe fraction of two-domain enzymes that can be com-pletely mapped to a single pathway (i.e. there exist at leastone pathway such that all the enzymatic domains takepart in). Of the 173 two-domain combinations, 67 arecombinations of domains that are in our pathway dataset. Of which 48 (72%) can be mapped completely to asingle pathway. The expected fraction is estimated assum-ing that the two domains are chosen at random from thedomain library, and computing how many random pairsappear in the same pathway. Of the 6786 possible combi-nations of domain pairs (using the domain library derivedfrom the set of 67 combinations used above) only 199(3%) are mapped to a single pathway. The significant dif-
ference (72% vs. 3%) indicates a clear bias for multi-domain proteins.
This is not surprising, as multi-functional proteins wouldbe thermodynamically favorable in pathways. If two reac-tions in a pathway can be catalyzed by the same protein,the efficiency of the reaction can significantly increase,since it saves the need to localize and control the expres-sion of multiple proteins. If the two reactions are consec-utive, it is quite likely that the output of one reaction isimmediately transferred as an input to the second reactioncatalyzed by the second domain. To account for this sce-nario in our model and create a natural bias toward multi-domain proteins, we use the self-similarity score whenassigning these genes to two (or more) different reactionswithin the same pathway. With that bias, multi-domainproteins will be preferred whenever some or all theirdomains can be utilized in the same pathway.
Computational issuesTo find the best assignment of genes to a given pathwaywe exhaustively enumerate all possible assignments. Thisis possible for most pathways, genomes and families. Forexample, most of the pathways in Yeast have less than ahundred possible assignments in our current setting.However, some of the protein families are fairly large(hundreds and even thousands of members), resulting ina large number of possible assignments. The maximumnumber of pathway assignments in Yeast is observed forthe tRNA charging pathway which has 49,152 possibleassignments. Considering all possible combinations inthe cross-product is computationally intensive, and alsounnecessary. To reduce the number of assignments thatare considered one can first compute the similarity scoresof all possible pairs and use only pairs that have signifi-cant similarity score (see the 'Metrics' section in 'Meth-ods') or limit the analysis to the top N scoring pairs. Inpractice, given the size of a typical pathway as well as thenumber of possible genes catalyzing a reaction, the com-plete enumeration of assignments is possible in a reason-able time (a matter of minutes).
Refining the assignmentsThe initial set of assignments is likely to produce a goodunique mapping between genes and pathways (see 'Dis-cussion'). However, since each pathway is analyzed inde-pendently it might happen that the same gene is assignedto the same reaction in multiple pathways. Each suchassignment is considered a conflict. Although in somecases the same gene might play the same functional rolein different pathways, our hypothesis is that if there aremultiple enzymes in the same genome that can catalyzethe same reaction, and that reaction takes place in multi-ple pathways, then it is more probable that each enzyme
Score Pm m
w w simi j i jj i
m
i
m( ))
( )( , )A E E( =
− = +=
−∑∑2
1 11
1
wevalue i
evalue iii Fi
=∈
log ( )
min {log ( ’)}’
Page 4 of 25(page number not for citation purposes)
is "specialized" to catalyze this reaction in a differentpathway. To eliminate the conflicts we revisit the assign-ments and resolve them whenever it is possible, asdescribed next.
The pathway conflict graphWe start by constructing the pathway relation graph. In thisgraph each pathway is a node, and two nodes are con-nected by an edge if the two pathways represented by thenodes share a reaction (see Figure 1a). We introduce oneedge for each such reaction (i.e. there might be multipleedges connecting the same two nodes). The pathway con-flict graph is derived from this graph: we mark an edge asa conflict if the corresponding reaction is associated withthe same gene in both pathways, based on the initialassignments (see Figure 1b).
Connected componentsThe pathway conflict-graph can be split into connectedcomponents, each of which is composed of several path-ways connected by edges (reactions), some of which aremarked and indicate possible conflicts. If several genes areassociated with such a reaction, it might be possible toresolve this conflict. Clearly, the assignments in one con-nected component have no effect on the other connectedcomponents and therefore we can revisit these assign-ments independently for each connected component.
It should be noted that not all conflicts can be resolved. Ifin the given genome there is only a single gene that can be
associated with a specific reaction, then clearly it is notpossible to refine conflicts associated with that reaction.An edge that is linked with such a reaction is referred to asa flat edge. Since for flat edges no alternative assignmentsexist (given the gene data), we unmark these edges in theconflict graph. Our algorithm operates only on connectedcomponents with marked edges (see Figure 1c).
Assignment of genes to pathways in a connected componentTo find the best non-conflicting assignment of genes topathways in a connected component we generalize ourscoring function such that the score of an assignment isthe sum of the scores of the assignments to pathways con-tained in the component, with the restriction that noenzyme can be used twice to catalyze the same reaction indifferent pathways. We ignore inter-pathway expressiondata correlations, assuming different pathways are associ-ated with different cellular processes and therefore are notexpected to be correlated.
Formally, given a set of pathways P = P1, P2, .., Pk and anassignment A, the assignment score is simply the totalweighted co-expression score
where A(Pi) is the subset of genes assigned to pathway Piand Score(A(Pi)) is as defined previously. As before weenumerate all possible assignments of genes to pathway
Pathway graphsFigure 1Pathway graphs. Left: the pathway relation graph. Each pathway is represented as a node, and an edge is drawn between two pathways for each reaction that they share in common. Middle: the pathway conflict graph. Thick edges represent conflicts (i.e. the same gene was assigned to catalyze the same reaction in both pathways connected by the edge). Right: the final conflict graph. The edge between pathways P9 and P10 is a flat edge (no alternative assignments exist for that reaction) and therefore it is unmarked. At the end we are left with only two connected components with possibly solvable conflicts.
a b c
P1
P2
P3
P4
P5
P6
P8
P9
P12
P13
P11
P10
P7
P1
P2
P3
P4
P5
P6
P8
P9
P12
P13
P11
P10
P7
P1
P2
P3
P4
P5
P6
P8
P9
P12
P13
P11
P10
P7
Score Score Pii
( ( ))A P A( )) (= ∑
Page 5 of 25(page number not for citation purposes)
families and each assignment is also marked with thenumber of conflicts it introduces.
Ideally we would like to find high scoring assignmentsthat are conflict-free. However, this ideal situation is notalways attainable as some shared reactions are central andare best catalyzed by the same enzyme. For example, reac-tion 2.6.1.1 that is shared by the asparagine and aspartatebiosynthesis pathways is catalyzed in both pathways bygene AAT2, although there exist another gene (AAT1) thatcan catalyze this reaction (see 'Discussion'). Moreover,some pathways are superpathways of other pathways andare naturally composed of the same genes. Therefore, notall conflicts can and should be resolved. To accommodatethese possible scenarios we consider all assignments thatare within ∆ from the maximal score that is obtainedwhen conflicts are allowed, and pick the one that has theminimal number of conflicts within that range (without abetter methodology at this point, the exact value of ∆ iscurrently set ad-hoc to 1). A significant drop in the scoreof a conflict-free assignment (compared to the highestscoring assignment) suggests that some reactions areindeed catalyzed by the same gene, despite the fact thatalternative genes do exist to perform similar functions.
DiscussionEvaluating our pathway prediction algorithm requires theavailability of well studied and annotated genome forwhich high-quality expression data and empirical knowl-edge of pathways exist. Since most pathway databasesassign genes to pathways collectively based on the EC des-ignation it was hard to find an extensive set of literature-curated pathways. We used one of the curated PGDB YeastBiochemical Pathways [44] at the Saccharomyces GenomeDatabase (SGD) [45]. This database was computationallyderived from the Yeast sequenced and annotated genomeusing the Pathway Tools software [46] and the pathwayblueprints from the Metacyc database [6], and was thenmanually curated by mining the literature. Not all theassignments were done based on direct phenotype exper-iments and the confidence in the assignments variesdepends on the type of the evidence used. The databasecontains 58 pathways, many of which did not exist in theMetacyc database or did not match perfectly with thepathway blueprints in Metacyc. A few other pathways con-tained genes that we were not able to map to our Yeastprotein database, and were eliminated as well. This left uswith 25 pathways that were used for testing. Each curatedpathway in the SGD database describes a sequence of reac-tions as well as the genes that catalyze the reactions. Somereactions are not associated with a specific gene and werenot considered when evaluating the correctness of anassignment. Also, some of the reactions are unclassifiedreactions that either have an incomplete EC number or do
not have an EC number at all. These reactions are cur-rently ignored in our experiments.
It should be noted that some of the curated pathwaysassociate multiple genes with the same reaction. In gen-eral, it seems that there are two possible explanations. Itmight be the case that a complex of proteins catalyzes thereaction and the genes associated with the reaction arepart of this complex. In this case we want to assign all pro-teins to the reaction. This is not taken into account in ouralgorithm currently. The other more common case iswhen each protein can catalyze the reaction by itself, forexample under different specific cellular conditions. Thiscan be verified in knockout experiments and has beenobserved in several systems (e.g. [47]). While it is possiblethat all these genes are used concurrently, our assumptionis that only a few of them actually do. In these cases, ouralgorithm can assess the "affinity" of each gene with thepathway. In the next sections we discuss our results andcompare them with the curated assignments of the path-ways in the test set.
Pathway assignment for curated pathwaysTo test our predictions, we run the algorithm on the Yeastgenome, using the time-series expression data and theblueprints of the 25 pathways in our test set. The EC anno-tations were updated to be consistent with those used bySGD. It should be noted that for many pathways all possi-ble assignments are curated as valid assignments by SGD.A summary of the results is given in Table 1.
Almost all curated assignments are assigned high positivescores (results not shown). There are some exceptions anda few curated assignments have a negative score. In thesecases most or all other assignments have negative scores aswell. For 13 out of the 25 pathways the maximum nor-malized score is greater than 4. The score is an indicationof how significant is the similarity of two expression pro-files [43]. An average score greater than 4 means that theenzymes assigned to the pathways are similarly expressedwith high confidence and are likely to be functionallylinked. Moreover, for 10 out of the 25 pathways, all pair-wise scores (for all pairwise relations) in the top-scoringassignment are positive. These results support ourassumption that proteins that participate in the same cel-lular process are similarly expressed. It is also observedthat curated assignments are assigned better scores thanthe non curated assignments and the best assignment isusually a curated assignment. In the next subsections wetake a closer look at some interesting pathways.
The isoleucine biosynthesis pathwayAs Table 1 indicates, the expression data strongly supportsthe existing knowledge about pathways and can be usedfor prediction. The isoleucine biosynthesis pathway is one
Page 6 of 25(page number not for citation purposes)
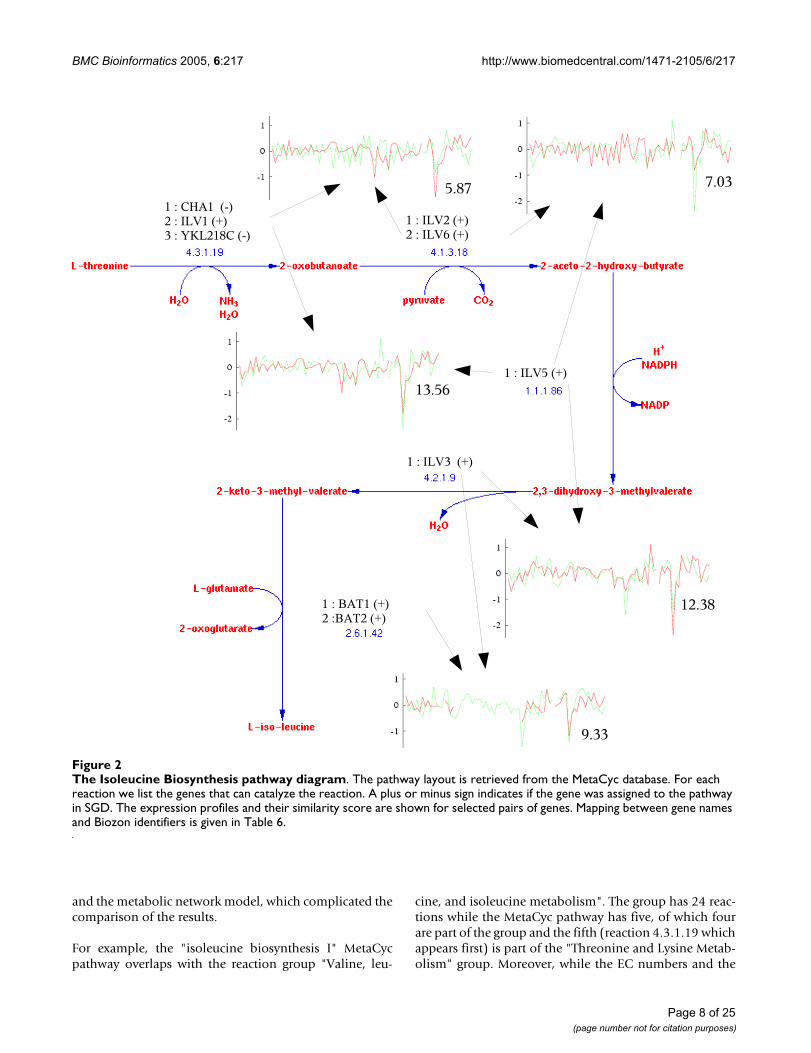
such example (Figure 2). This pathway consists of 5 reac-tions. A total of 12 assignments are considered, of which4 are curated and are considered true assignments, and 8are considered false assignments. Table 2 lists detailedinformation about each candidate assignment. Note thatcurated assignments are assigned a high positive score,and the normalized score of the best assignment is wellover 4. Moreover, the true and false assignments are wellseparated in the sorted list. The baseline score is deter-mined by the two enzymes (EC 1.1.1.86 and EC 4.2.1.9)that have no alternative genes and are shared by all assign-ments. Looking at the break-up of pairwise similaritieswithin the pathway we note that almost all of them havepositive scores for curated assignments, while false assign-ments contain more pairs with negative pairwise scores.
Note that the first two assignments are both assigned highpositive scores. These two assignments differ in the geneused to catalyze the EC reaction 4.1.3.18. The first is usingILV2 while the second is using ILV6 Interestingly, theseproteins form a complex which catalyzes the reaction4.1.3.18 [45]. This and similar cases will be handled infuture versions of our algorithm (see the Conclusion sec-
tion). Of the curated assignments, the fourth one leads toone negative pairwise score of -3.04 for proteins ILV6 andBAT2. Protein BAT2 can catalyze the reaction 2.6.1.42.This reaction can also be catalyzed by protein BAT1, andits selection results in better assignment scores. The twoproteins are very similar in sequence (77% identity), how-ever, the former is highly expressed during stationaryphase of the cell-cycle and down-regulated during the log-arithmic phase of growth (as is documented in the Swiss-Prot record of that gene), while the later exhibits theopposite behavior. In view of the expression data it isunlikely that the two genes participate in this pathway atthe same time, and gene BAT2 is probably assigned onlyduring the stationary phase where the pathway activity isreduced.
We compared our results with the reconstructed meta-bolic network of Saccharomyces cerevisiae, as described in[18] (see 'Related Studies'). This network is not compart-mentalized into separate metabolic pathways, however,the reactions are grouped according to the cellular processthey are involved with. The comparison revealed discrep-ancies between the pathway data from Metacyc and SGD
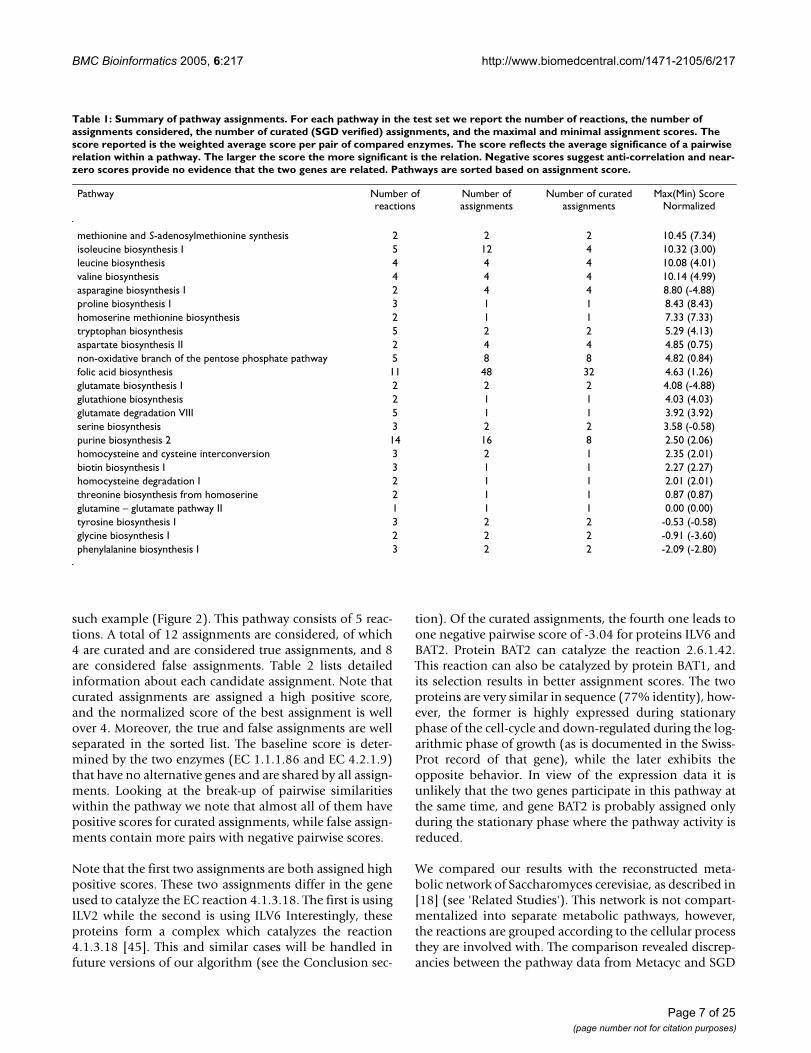
Table 1: Summary of pathway assignments. For each pathway in the test set we report the number of reactions, the number of assignments considered, the number of curated (SGD verified) assignments, and the maximal and minimal assignment scores. The score reported is the weighted average score per pair of compared enzymes. The score reflects the average significance of a pairwise relation within a pathway. The larger the score the more significant is the relation. Negative scores suggest anti-correlation and near-zero scores provide no evidence that the two genes are related. Pathways are sorted based on assignment score.
and the metabolic network model, which complicated thecomparison of the results.
For example, the "isoleucine biosynthesis I" MetaCycpathway overlaps with the reaction group "Valine, leu-
cine, and isoleucine metabolism". The group has 24 reac-tions while the MetaCyc pathway has five, of which fourare part of the group and the fifth (reaction 4.3.1.19 whichappears first) is part of the "Threonine and Lysine Metab-olism" group. Moreover, while the EC numbers and the
The Isoleucine Biosynthesis pathway diagramFigure 2The Isoleucine Biosynthesis pathway diagram. The pathway layout is retrieved from the MetaCyc database. For each reaction we list the genes that can catalyze the reaction. A plus or minus sign indicates if the gene was assigned to the pathway in SGD. The expression profiles and their similarity score are shown for selected pairs of genes. Mapping between gene names and Biozon identifiers is given in Table 6.
Page 8 of 25(page number not for citation purposes)
sequence of reactions with respect to the EC numbers arethe same in MetaCyc and the network model, the reac-tions are different because they do not use the same sub-strates as intermediary metabolites.
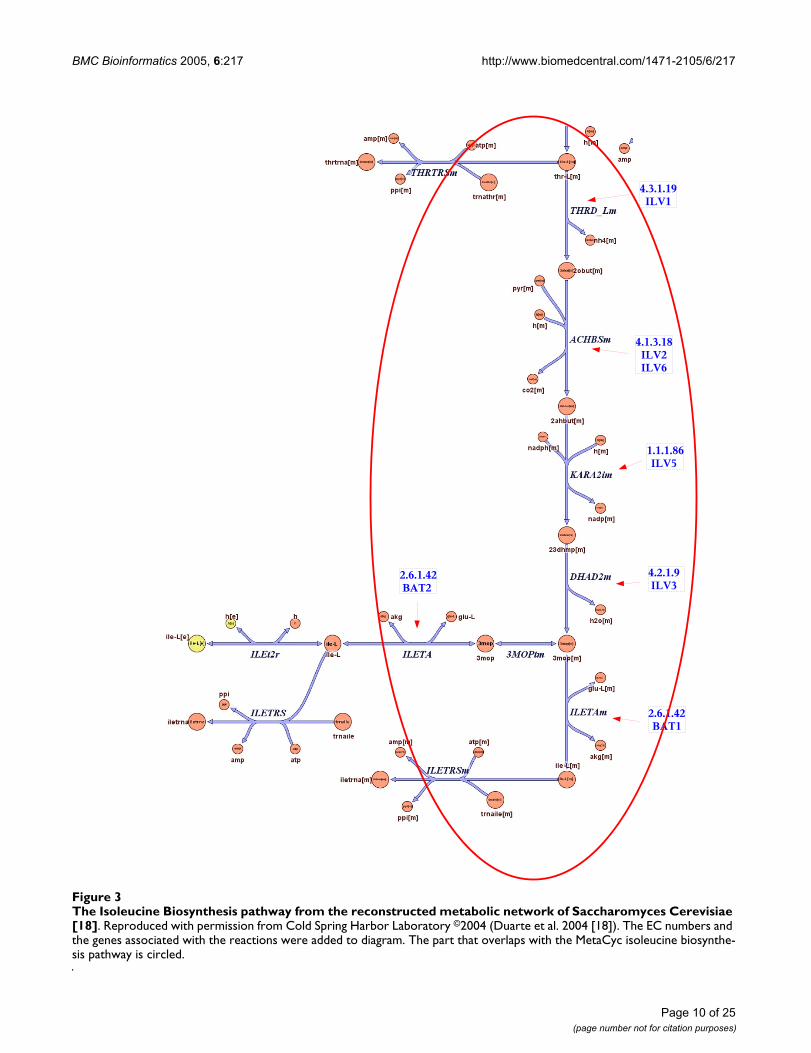
Interestingly, the first four reactions in the isoleucine bio-synthesis MetaCyc pathway take place inside the mito-chondrion, while the last step of the pathway, reaction2.6.1.42 (catalyzed by BAT1 and BAT2), takes place bothin the mitochondrion and in the cytoplasm. Indeed, it hasbeen verified experimentally that BAT1 resides in themitochondrion while BAT2 resides in the cytoplasm (seeFigure 3). In order to obtain cytoplasmic isoleucine, atransport reaction is necessary to transfer the final inter-
mediary metabolite. That might explain why BAT2 isslightly uncorrelated with the other genes in the pathway.Such situations lead to "forks", where two branches areuncoupled even if they have the same EC number. Ourassignments are consistent with these observations.
The folic acid biosynthesisThe metabolic network along with other cellular processesform the computational elements of the cell and as withany computation of this magnitude it needs to be regu-lated and synchronized. This regulation is reflected in theexpression levels of genes. A possible synchronizationdevice might require for example that reaction A is notstarted until reaction B is completed. Therefore, the
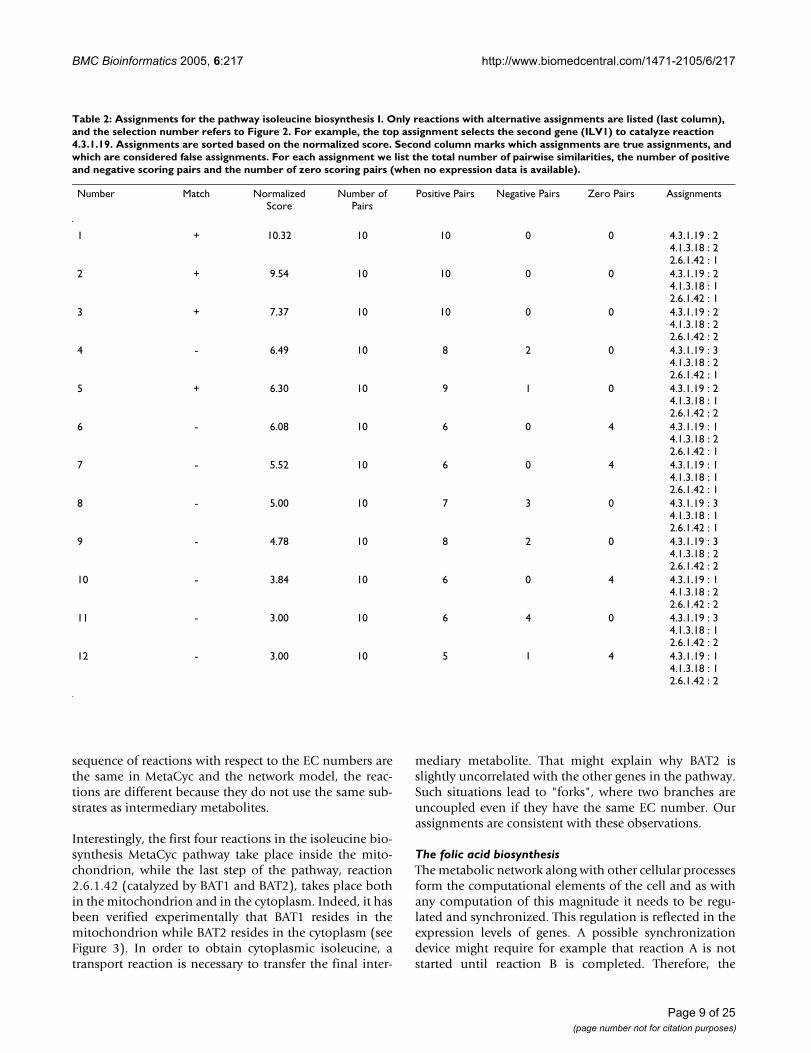
Table 2: Assignments for the pathway isoleucine biosynthesis I. Only reactions with alternative assignments are listed (last column), and the selection number refers to Figure 2. For example, the top assignment selects the second gene (ILV1) to catalyze reaction 4.3.1.19. Assignments are sorted based on the normalized score. Second column marks which assignments are true assignments, and which are considered false assignments. For each assignment we list the total number of pairwise similarities, the number of positive and negative scoring pairs and the number of zero scoring pairs (when no expression data is available).
Number Match Normalized Score
Number of Pairs
Positive Pairs Negative Pairs Zero Pairs Assignments
enzymes that can catalyze A and B are not expected to beactive at the same time, a state that can be achieved bycontrolling the expression levels of the correspondinggenes. This type of mechanism will create a functionalanti-correlation which will be awarded with a negativescore by our scoring system. Beyond controlling timing ofreactions, anti-correlation might also reflect a controlmechanism that is used to govern pathway activity andmetabolic rate.
An illustration of this mechanism is the pathway folic acidbiosynthesis whose trajectory traverses both the mitochon-drion and the cytoplasm. This is a quite complex pathway(see Figure 4) and the mechanism might occur betweengenes FOL1, FOL2 and FOL3. FOL1 is present in the mito-chondrion while FOL2 and FOL3 are in the cytoplasm.Gene FOL1 is strongly anti-correlated with genes FOL2and FOL3 while these two genes are strongly correlatedbetween them. Note that the input to the last reaction cat-alyzed by FOL1 is the output from two different parallelbranches of the pathway (top part). The anti-correlationmight serve as a synchronization mechanism to controlthe reactants flow in the pathway in the presence of forks(that split into or merge different branches).
Interestingly, gene FOL1 is an enzyme with multiple enzy-matic functions positioned between the reactions cata-lyzed by FOL2 and FOL3. FOL1 has three differentenzymatic domains, classified as 4.1.2.25, 2.7.6.3 and2.5.1.15. There are no other genes that are classified(based on database annotations or sequence similarity) toeither of these three enzyme classes. This further supportsour assumption that multi-domain enzymes are morelikely to catalyze several reactions in the same pathway,are are preferred over different enzymes, each assigned toa different reaction.
Multi-domain enzymes are also used in the lower part ofthe pathway. Both MIS1 and ADE3 catalyze three differentconsecutive reactions. Both are assigned to this pathwayby SGD, however, surprisingly, their mutual expressionsimilarity is negative (-2.09), indicating anti-correlation.Interestingly, the three reactions are shared with otherpathways (glycine degradation, formylTHF biosynthesisand carbon monoxide dehydrogenase pathway), and it ishypothesized that the two isozymes, MIS1 and ADE3,serve as switches, to control the pathway activity and itscoupling with other pathways. Indeed, such a mechanismhas been suggested in [25] to control pathway flow.
To better understand these mechanisms we compared ourresults with the metabolic network model of [18]. Thepathway from MetaCyc has 15 reactions, of which 12overlap with the reaction group "Folate Metabolism",which has 29 reactions. Four out of these 12 reactions are
duplicated in the metabolic network model with oneinstance in the cytoplasm and one in the mitochondrion.The discrepancy between MetaCyc and the network modelinvolves the sequence of reactions 4.1.2.25, 2.7.6.3 and2.5.1.15, all catalyzed by FOL1 gene, which are differentlyconnected in the network model (see Figure 5). The net-work model also shows a fourth catalytic function forFOL1. The location of the enzymes and reactions in thenetwork model indicate the intricate trajectory betweencytoplasm and mitochondrion.
In view of these discrepancies, choosing the "right" modelfor this pathway is difficult. However, our results confirmthe interplay between cytoplasm and mitochondrion andcan help distinguish between mitochondrial and cyto-plasmic genes, as each subgroup is mutually co-expressed,suggesting that the pathway expression is controlled bytwo distinct regulatory programs.
The asparagine biosynthesis pathwayNot always it is possible to explain negative pathwayscores (anti-correlation or no correlation). Sometimes, agene that can catalyze a specific reaction in a pathway isnot coordinated with the other genes in the pathway. Thismight be due to the fact that the gene functions in thepathway only under certain conditions while inactiveunder others [27]. Or the gene might serve as a backupgene that is activated only when the main one is missingor is malfunctioning [47]. This problem is especially pro-nounced if the main gene has not been identified yet.Indeed, despite extensive annotation efforts, many geneshave not been characterized yet.
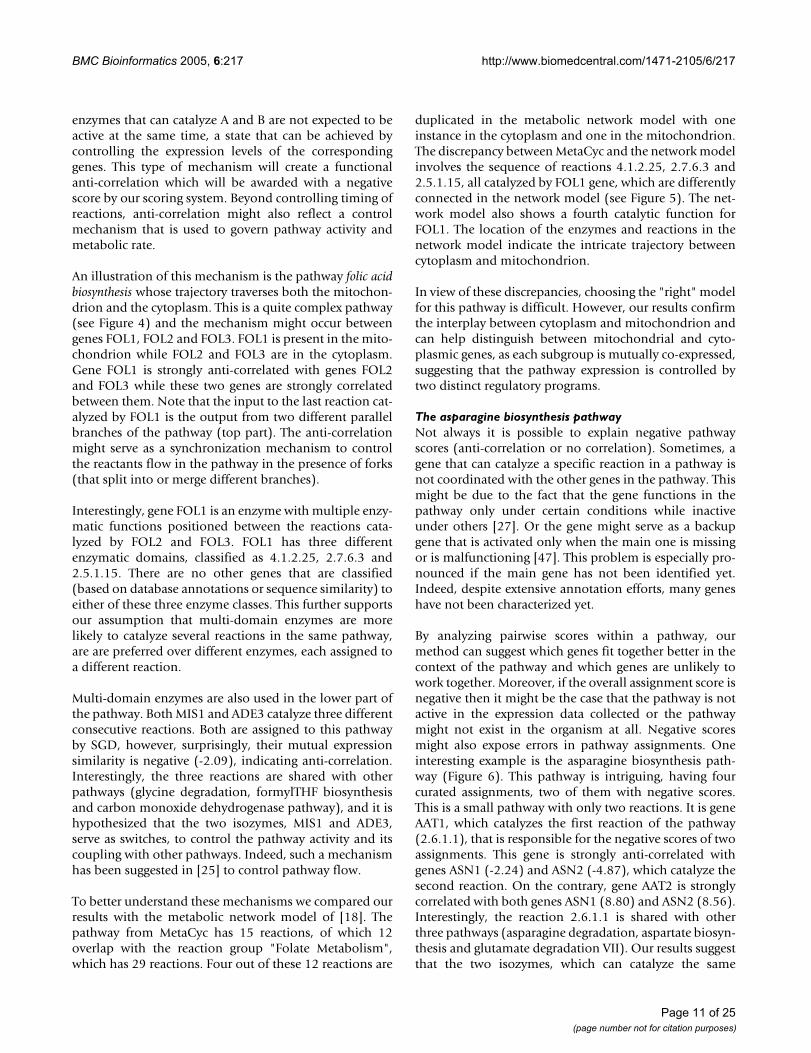
By analyzing pairwise scores within a pathway, ourmethod can suggest which genes fit together better in thecontext of the pathway and which genes are unlikely towork together. Moreover, if the overall assignment score isnegative then it might be the case that the pathway is notactive in the expression data collected or the pathwaymight not exist in the organism at all. Negative scoresmight also expose errors in pathway assignments. Oneinteresting example is the asparagine biosynthesis path-way (Figure 6). This pathway is intriguing, having fourcurated assignments, two of them with negative scores.This is a small pathway with only two reactions. It is geneAAT1, which catalyzes the first reaction of the pathway(2.6.1.1), that is responsible for the negative scores of twoassignments. This gene is strongly anti-correlated withgenes ASN1 (-2.24) and ASN2 (-4.87), which catalyze thesecond reaction. On the contrary, gene AAT2 is stronglycorrelated with both genes ASN1 (8.80) and ASN2 (8.56).Interestingly, the reaction 2.6.1.1 is shared with otherthree pathways (asparagine degradation, aspartate biosyn-thesis and glutamate degradation VII). Our results suggestthat the two isozymes, which can catalyze the same
Page 11 of 25(page number not for citation purposes)
reaction, are used selectively in different pathways; AAT2is involved in asparagine and aspartate biosynthesis,while AAT1 is involved in asparagine and glutamate deg-radation (where it is assigned a high positive score). Butwhy was AAT1 assigned to the asparagine biosynthesispathway? A closer look at the entry for AAT1 in the SGDdatabase reveals that the curator assigned this enzyme tothe pathway based on its enzymatic activity only, which
was determined experimentally. In the literature AAT1 isassociated with aspartate degradation. Obviously synthe-sis and degradation cannot appear at the same time andhence the anti-correlation between AAT1 and genes ASN1and ASN2. This is a clear example of the assignment prob-lem, suggesting that even curated assignments can be fur-ther improved using our method. The metabolic networkmodel [18] confirms the previous conclusions. This path-
The folic acid biosynthesis pathway diagramFigure 4The folic acid biosynthesis pathway diagram. See Figure 2 for description. Note that FOL1, ADE3 and MIS1 are multi-functional enzymes.
Page 12 of 25(page number not for citation purposes)
way has two reactions that are entirely contained in the"Alanine and aspartate metabolism" group, which has 15reactions (see Figure 7). There are 3 instances of the reac-tion 2.6.1.1 in the network model, one in peroxisome(catalyzed by AAT2), the second in cytoplasm (also cata-lyzed by AAT2) and the third in mitochondrion (catalyzedby AAT1) (see Figure 7). On the other hand, the reaction6.3.5.4 takes place in cytoplasm. The expression profiles
are in agreement with these subcellular locations andindeed the cytoplasm genes ASN1/ASN2 are highly corre-lated with AAT2, while anti-correlated with the mitochon-drion AAT1.
Genome wide resultsWe repeated our analysis, this time with a larger set ofpathways from the MetaCyc database, to generate genome
wide assignment of genes to pathways. Most pathwayswere not represented in the Yeast genome, and werestricted our analysis to pathways for which we couldassign genes to all reactions (64 pathways). We eliminatedpathways that had only one fully characterized reactionsince our algorithm is based most dominantly on expres-sion similarity, and therefore assumes at least two reac-tions in a pathway. Reactions with incomplete EC numberor which could not be assigned to a gene in the Yeastgenome were ignored. In total, 52 pathways wereconsidered.
We ran our procedure using the two different expressiondata sets (see the 'Data sets' section). The results are sum-marized in Table 3, where the pathways are divided intofour categories based on their assignment score. Note thatthe majority of the pathways is assigned a high positivescore > 4, indicating strong correlation between theexpression profiles of members in these pathways, and
supporting our very initial assumption. Only a fewpathways are assigned negative scores. These are usuallyshort pathways where one gene is highly anti-correlatedwith the others. It should be noted that both expressiondatasets generate very similar results. However, since theRosetta data set is based on many more experiments thanthe time-series data set, the pairwise expression similarityscores are much more significant, resulting in higher path-way assignment scores (results not shown). In otherwords, our confidence in the assignments is stronger withthe Rosetta dataset (detailed information aboutassignments is available at [48] and will be later madeavailable at the Biozon website at [41].
Lastly, it is interesting to compare the assignments beforeand after resolving conflicts. The pathway relation graphfor the 52 pathways contains 10 connected componentsand 30 singletons. When using the time-series data toassign genes to pathways, we observe conflicts for 9 con-
The asparagine biosynthesis pathwayFigure 6The asparagine biosynthesis pathway. See Figure 2 for description. Both ASN1 and ASN2 are correlated with AAT2 but are anti-correlated with AAT1 (selected pairwise similarities are shown). The later is localized to a different cellular compart-ment than the others, and is likely to be involved in other pathways (see text for details).
Page 14 of 25(page number not for citation purposes)
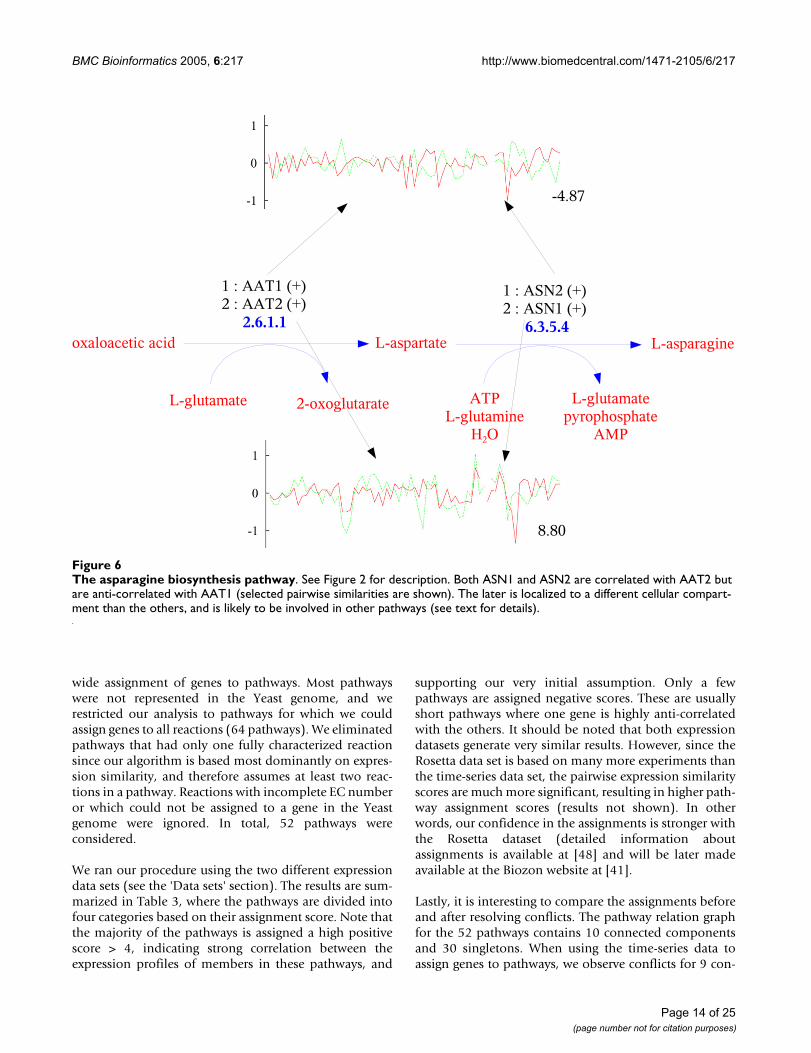
nected components. The final conflict graph contains 9connected components and possibly 12 resolvable con-flicts (shared edges). 12 of these conflicts are resolvedwith a small decrease in the assignment score, as isreported in Table 4. Information on the final assignmentsis given in Table 5. Overall, only a few additional negativepairs are reported after conflicts are resolved, with 32 ofthe 52 pathways consisting solely of positively scoringpairs (compared to 33 pathways, before conflicts areresolved).
ConclusionOngoing sequencing and annotation efforts produce awealth of data consisting of genes and their products. Onthe other hand, new types of biological data such asexpression and interaction data provide new insights intothe mechanisms governing cellular activity. In this light,data integration is necessary in order to accurately analyzethe function of genes and other biological entities. Thestudy of biochemical pathways is especially central tothese efforts.
Information on cellular pathways is available for severalgenomes that were studied extensively. However, for mostgenomes pathway information is not available, what trig-gered the development of pathway prediction algorithms.Pathway prediction is a difficult problem; Since pathwaysare not a physical entity, there is no consensus on the def-inition of a pathway. The pathways that are defined bydatabases like BioCyc are small subgraphs of a large net-work of reactions. However, in reality these pathways donot function independently but are rather linked andcoordinated with other subnetworks. In an attempt tounderstand the processes involving metabolism the net-work has been traditionally divided into smaller subnet-works that can be associated with specific functions. Thesesubnetworks can be considered as the building blocks ofthe metabolic network and the whole network can be par-tially reconstructed by integrating the metabolic knowl-edge contained in these pathways.
In attempt to extrapolate metabolic pathways from oneorganism to another, several studies developed proce-
dures for assigning genes to pathways. However these pro-cedures ambiguously assign genes to pathways as theyusually rely solely on the enzyme class of genes and there-fore assign each gene to all the pathways that contain thereactions it can catalyze.
In this paper we present an algorithm for accurate assign-ment of genes to pathways that attempts to eliminate thisambiguity. For this task, our algorithm utilizes expressiondata. It has been argued that the metabolic network is co-expressed locally, and an enzyme is co-expressed with thegenes catalyzing reactions upstream and downstream ofthe reaction it catalyzes. We further assume that for themost part pathways are local neighborhoods in the meta-bolic network and therefore genes assigned to each path-way tend to be co-expressed. Based on this premise, ouralgorithm assigns genes by maximizing the co-expressionof genes that participate in the same pathway. Our algo-rithm addresses the assignment problem on a genomelevel, by simultaneously optimizing the co-expressionscores for multiple pathways while minimizing thenumber of conflicts (genes that are shared betweendifferent pathways). Our assumption is that if there aremultiple genes that can catalyze the same reaction, andthat reaction is used in multiple pathways, then each geneis optimized for a different pathway. Conflicts that aredetected after initial assignment are reconsidered and ouralgorithm proceeds by refining the assignment of genes topathways within connected components in the pathwayconflict graph.
Our tests show that for most pathways it is possible toidentify a group of genes that can catalyze the pathwayreactions and are similarly expressed. Our algorithm canfind the most probable assignment of specific genes foreach pathway, detect erroneous assignments and suggestcontrol mechanisms of pathways, given a specificexpression dataset. The algorithm tackles also the specialcase of multi-functional enzymes. Since it is difficult toanalyze the global network, an alternative approach todetecting pathways of prescribed functions is to search forsubnetworks or local neighborhoods in the metabolic net-work that consist of co-expressed genes, regardless of
Table 3: Distribution of pathway assignment scores. For each data set we ran our algorithm for pathway assignment. The algorithm considers all pathways simultaneously attempting to maximize expression similarity while minimizing the number of conflicts. The final normalized pathway assignment scores Score(A(P)) are divided into four categories based on the average expression similarity of their genes: strongly correlated genes (4 ≤ Score), mildly correlated genes (1 <Score < 4), weakly or uncorrelated genes (-1 ≤ Score ≤ 1) and anti-correlated genes (Score < -1).
Data Set Assignment Score < -1 score -1 ≤ Score ≤ 1 1 <Score < 4 4 ≤ Score
Time-series 4 5 11 32Rosetta 2 2 7 41
Page 16 of 25(page number not for citation purposes)
pathway blueprints. Finding the co-expressed subnet-works of a metabolic network is the methodology of [49]and other studies (as discussed on 'Related Studies' in thepaper). However, while this assumption is valid in generalit does not always hold and unfortunately these co-expressed subnetworks do not necessarily correspond oroverlap with known pathways (as is also indicated bysome of our examples). This discrepancy makes it difficultto assess and compare pathway prediction algorithms.
The manually curated pathways that are stored in data-bases such as MetaCyc and SGD provide an excellentbenchmark and perhaps the most accurate reflection ofthe existing biochemical knowledge, as of today. Our goalis extrapolate that knowledge when predicting pathwaysin organisms that haven't been studied so far and refineprocedures that rely on pathway blueprints and use justEC numbers. Since our algorithm does not rely on manual
analysis, it can be most successfully applied to thegenomes of organisms that have not fully characterized,once expression data for these genomes becomesavailable. With the pace in which new genomes arerevealed it would be impossible to peruse manual analysisfor all and the need for automated procedures becomesevident. The examples we provided prove the effectivenessof our method.
While our algorithm makes advances in the field of path-way prediction it is also faced with several problems. Forexample, when isozymes are similarly expressed ourmethod picks the best assignment (given the expressiondata) and only one isozyme is associated with every reac-tion. However, in some cases multiple isozymes mightparticipate in the same pathway in response to slightly dif-ferent conditions and substrates. Future versions of ouralgorithm will handle these cases and estimate the affinity
Table 4: Genome wide analysis. Connected components' scores before and after resolving conflicts. For each component we list the names of the constituent pathways, the number of conflicts (shared assignments) and the component score. Note that not all conflicts are solvable. For example, the first connected component contains three pathways, and the best initial assignment results in 6 conflicts. Of these only two are solvable (i.e. there are multiple enzymes that can be assigned to these reactions). The final assignment resolves these conflicts while reducing the score of the connected component only slightly (9.31 compared to 10.22).
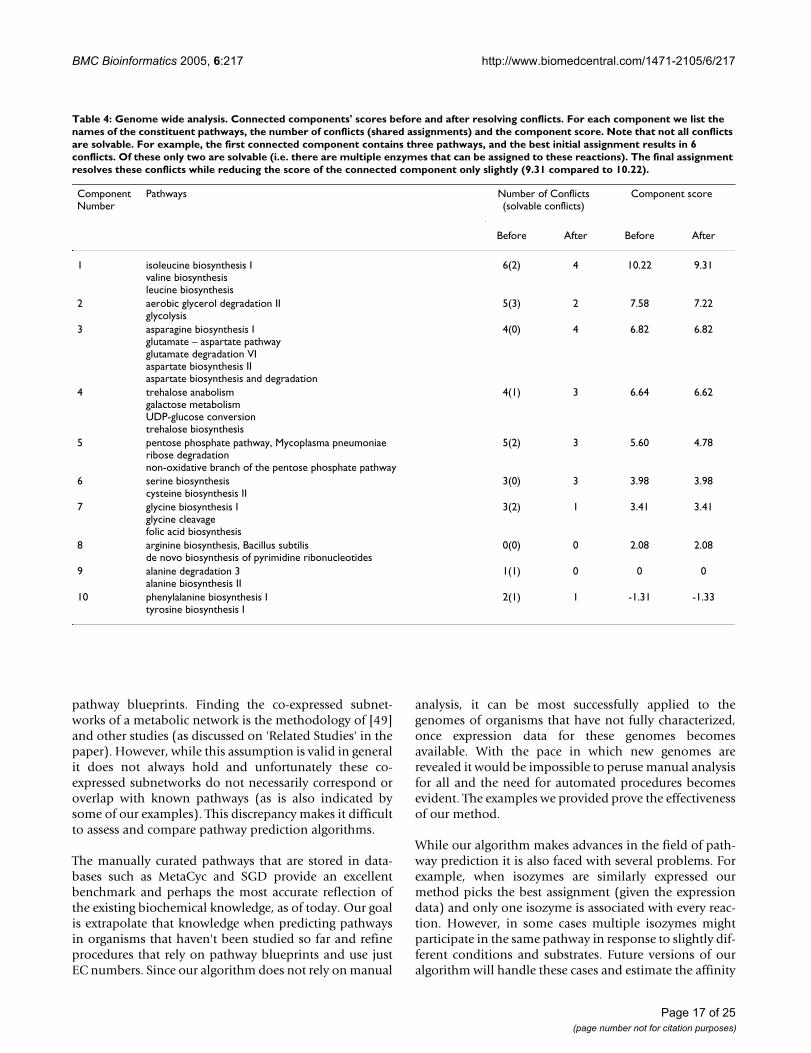
Table 5: Genome wide analysis. Statistics of the final assignments. For each pathway we list the number of possible assignments, the maximum and minimum scores observed over these assignments, and the final score (note that the final score might not be the maximum score, due to conflicts that were resolved at the refinement stage). The last column gives the number of pairwise relations considered in each assignment, and the number of negative-scoring pairs in the final assignment (in parentheses). Negative scores indicate anti or no correlation. Pathways are sorted by the final assignment score. Note that most pathways are assigned a high positive score, and almost all pairs in the final assignments are positive pairs.
Pathway Number of Assignments
Max Score Min Score Final Score Number of pairs (negative Pairs)
of each isozyme to each pathway that contains the corre-sponding reaction.
A host of other problems add to the ambiguity of gene-to-pathway assignments, not all them can be addressed withexpression data. For example, some enzymes have lowspecificity and can accept diverse substrates and thereforeparticipate in several different reactions. On the otherhand an EC number might specify not a single reactionbut rather a class of reactions having common characteris-tics. One such example is the alcohol dehydrogenaseswhich oxidize a variety of alcohols. The corresponding ECnumber 1.1.1.1 represents the class of reactions in whicheither a primary or a secondary alcohol is oxidized, and allalcohol dehydrogenases are annotated with the ECnumber 1.1.1.1. In yeast there are 6 enzymes annotatedwith 1.1.1.1. These are the genes ADH1, ADH2, ADH3,ADH4, ADH5 and SFA1. All ADH genes can catalyze thereactions reducing the aldehydes indole acetaldehyde,phenylacetaldehyde and acetaldehyde into the respectivealcohols (indole-3-ethanol, phenylethanol and ethanol).However, SFA1 takes as substrate only indole-3-ethanoland phenylethanol. Therefore, as this example demon-strates, EC numbers might not be specific enough, andeven database annotations may not be sufficient to differ-entiate between the different functions of these enzymes.
Our method uses a collection of data sets, including path-ways, expression data and statistical models of proteinfamilies. We intend to augment these data sets with otherrelevant biological data sets. For example, integration ofinteraction data and regulator-regulatee data is necessaryin order to predict the global structure of pathways cor-rectly in situations as the one described in 'Discussion' forthe isoleucine biosynthesis pathway. Future versions ofour algorithm will also account for the topology of thenetwork within pathways and the subcellular location ofgenes. Other future enhancements include better methodsfor prediction of enzyme domain families from sequence,to detect new candidates for assignments (thus improvingthe accuracy of our method) and better mapping proce-dures from protein annotations to reactions. It should benoted though that our method can be easily extended toother pathways with non-enzymatic reactions. Finally, weare working on probabilistic algorithms which are basedon the Expectation-Maximization algorithm, to predictsimultaneously gene functions, the existence of pathways,and gene assignments.
MethodsData setsPathwaysAs the pathway blueprints we used the set of 468 path-ways in the MetaCyc database [6] as of May 2003. Thisdatabase contains a complete biochemical description of
pathways that are observed in different organisms. Thesedescriptions are used as templates when predicting similarpathways in other organisms. We extracted from thesedescriptions the composition of a pathway as a collectionof EC classes. It should be noted that most of the pathwaysin the MetaCyc database were observed experimentallyand are linear as opposed to the pathways in KEGG wherea reference pathway might integrate the metabolic infor-mation from multiple alternative pathways.
Expression dataWe used two different expression data sets. The first is thepublicly available cell-cycle data set from the Saccharomy-ces cerevisiae website [26,40]. From this data set weextracted four time series of synchronized S. cerevisiaecells going through the cell cycle. In our analysis each ORFis represented by an extended expression profile derivedby concatenating these time series together. The dimen-sions of these expression vectors range from 1 to 73. Thisdata set has been normalized by [26] to correct for exper-imental variation between the different microarrays. Thesecond set is the Rosetta Inpharmatics Yeast compendiumdata [27]. This data set consists of 300 different condi-tions, mostly deletion mutants. We refer to this set as theRosetta data set.
Sequence dataOur sequence data is the set of protein sequences in theYeast sequence database with a total of 6298 proteins.Almost all (5894 out of 6298) of the ORFs in the expres-sion data sets can be mapped to genes in the Yeastsequence database through the ORF label.
Enzyme familiesEach pathway is associated with a set of families, usuallya list of enzyme families with their enzyme classification(EC) numbers. To assign proteins to EC families we use acomposite non-redundant (NR) database that containsmore than 1 million unique sequence entries compiledfrom more than 20 different databases (the database isavailable at Biozon [41]). Based on the annotations inthese databases, 71,638 proteins can be assigned to one(or more) of 2051 EC families. A total of 70,397 areassigned to a single enzyme family, 1241 are possiblymulti-domain proteins with at least two different EC des-ignations, and 498 are ambiguous (or suspicious) in thesense that different databases assign them to different ECfamilies (but within the same level of the EC hierarchy, i.e.the first two levels are identical).
To assign Yeast genes to EC families we match the Yeastsequence database against this composite database. Of the6298 Yeast genes, 832 can be assigned an EC number,either based on their annotation or the annotation ofentries with identical sequences from the other databases.
Page 19 of 25(page number not for citation purposes)
Of these genes, 27 are proteins with multiple enzymaticdomains.
Predicted EC membershipWe extend the set of enzymes by creating a model(sequence profile) for each EC family. The profiles aregenerated by first grouping proteins with the same,known EC designation from the Biozon NR database. Foreach EC family we then use an iterative PSI-BLAST proce-dure [42] to generate a profile. It should be noted that inmost cases several profiles are needed to cover all mem-bers of the protein family. This is because of the largesequence diversity observed in enzyme families, some ofwhich are composed of several subfamilies that do notexhibit any apparent sequence similarity [22]. Of the2051 EC families, 597 are composed of more than onesubfamily. These models are searched against the Yeastgenome, and all genes that are detected as similar withevalue < 0.001 are assigned to the corresponding family,with a confidence value that depends on the evalue.
MetricsIn a previous study [43] we analyzed and assessed the sen-sitivity and accuracy of different measures of similaritybetween expression profiles. The measures were assessedin terms of their ability to detect functional links betweengenes, such as protein-protein interactions, pathwaymembership, promoter co-regulation, and sequencehomology. Our analysis showed that the z-score basedmeasure that combines the Pearson correlation and theEuclidean metric has the maximal information content.Formally, given two expression vectors V and U of dimen-sion d, denote by Dist(V, U) the normalized Euclideanmetric
and denote by Corr(V, U) the Pearson correlation of thetwo vectors
The two distance measures are converted to zscores basedon the permutation method described in [43]. Thismethod provides reliable measure of significance as itadjusts to the "compositions" of the vectors compared.The zscores are then summed to determine the final simi-larity score. Since higher correlation scores are assignedpositive zscores, and smaller Euclidean distances areassigned negative zscores, the final score is defined as
sim(V, U) = Z [Corr(V, U)] - Z [Dist(V, U)]
with higher scores indicating stronger similarity. For anal-ysis and performance evaluation see [43]
Appendix – Related workMetabolic processes make up a substantial part of thecell's activity, and therefore much of the research onpathways so far focused on creating new databases formetabolic pathways as well as extrapolating the knownbiochemical information from one organism to other.The goal of this research goes beyond just storing, analyz-ing and extrapolating the metabolic information andstrives to improve the known data by discovering varia-tions to pathways in different organisms as well as to dis-cover novel pathways. In this section we review theliterature on the main pathway databases and metabolicpathway reconstruction methods and especially methodsthat use microarray expression data to analyze pathways.
Pathway databasesMost pathway databases were created by compiling meta-bolic information from different literature sources.Among the first such databases was the Enzymes and Met-abolic Pathways (EMP) database [1,50]. It containedinformation about enzymes and metabolic pathwaysfrom over 10000 journal articles, and as of 1996 it stored2180 pathways from about 1400 organisms. This data-base was later replaced by the Metabolic Pathways Data-base (EMP/MPW) [2]. The latter was used as the referencedatabase for metabolic pathway prediction in the WIT("What Is There?") system [3]. This collection contains2800 pathway diagrams and their logical structure isencoded in terms used for electronic circuits. Anothermetabolic database is KEGG [5,51,52]. This database isrepresented as a graph structure based on binary relationsbetween data items [53]. The pathway database consists ofmore than 200 reference diagrams taken from the bio-chemical charts that represent all known realizations of apathway. The database has three parts: the pathway part,the genes part and the reaction and compound part [54].BioCyc [55] is composed of a family of databases calledPathway Genome databases (PGDB) where each one iscentered around a specific genome. The exception is Met-aCyc [6,56] that contains over 491 pathways from multi-ple organisms.
It is also worth mentioning The University of MinnesotaBiocatalysis/Biodegradation Database (UM-BBD) thatspecializes microbial catabolic metabolism of xenobioticorganic compounds [4,57]. Other pathway databasesinclude aMAZE [58], NCGR PathDB [59], ExPASy – Bio-chemical Pathways [60] and Biocarta [61].
Pathway prediction based on pathway blueprintsOne approach for pathway prediction/recovery in a neworganism is based on associating genes that encode
Dist V Ui ii
d( ( )V U, )=
1d
−=∑ 2
1
Corrd
V V U Ui i
V Ui
d(
( )( )V U, ) =
− < > − < >
=∑1
1 σ σ
Page 20 of 25(page number not for citation purposes)
enzymes with blueprints of pathways collected eitherfrom biochemical charts or from actually observed path-ways in different organisms. For example, in order topredict pathways in new genomes, WIT matches the iden-tified enzymes in that genomes with the pathway dia-grams from the MPW database [3]. Recently WIT wasextended in systems like PUMA2, SEED and ERGO. Forexample, PUMA2 [62] uses comparative evolutionaryanalysis of genomes and MPW pathways to extrapolatepathways to new genomes. SEED [8] is an open sourcesystem for manual genome annotation where experts canannotate a specific subsystem in multiple genomes atonce. It is built around the notion of a "molecular subsys-tem" which is a collection of functional roles that togetherfulfill a function. ERGO [7] is a private domain tool thatis based on similar principles, and integrates differenttypes of data such as genomic data, regulatory data andessentiality data. No details are available as for theprocedures that are used for functional annotation orpathway reconstruction. KEGG matches enzymes to thereference pathways and depending on the degree of com-pletion it assumes that the pathway exists or not [63].PathFinder [64] is a system that predicts and visualizepathways using the KEGG pathway blueprints using asimilar methodology. In UM-BBD, biodegradation path-ways of chemical compounds are predicted using aknowledge-based system that matches the compound to aset of biotransformation rules [65]. A biotransformationrule is composed of a sequence of biotransformationfunctions that transform a compound into its products.The prediction is completed when the resulting com-pound can no longer be transformed using the rules in theknowledge base or it is one of the terminationcompounds. In BioCyc, the MetaCyc database is used asthe blueprint for the pathway prediction software Patho-logic [46,66] which matches enzyme coding genes in aspecific genome to reactions in known pathways (butunlike KEGG, they do not re-annotate genes but rather useonly existing annotations). Applying Pathologic on agenome results in the creation of a computationallyderived PGDB. After creation, a PGDB is curated by min-ing the literature and new pathways are studied and addedto the database. The curated pathways are integrated intoMetaCyc to improve the diversity of the database.
All these programs try to address also the problem of find-ing missing enzymes either by considering alternativereactions or by looking for similar proteins based onsequence similarity or using machine learning models[20-22,24].
Reconstructing pathways from metabolic networksReconstructing pathways from metabolic networks is anemerging direction in pathway prediction that does notuse the previously known pathway blueprints. This
approach uses existing knowledge on reactions andenzymes and chemical rules to create a complete graph ofa possible metabolic network, where pathways aredefined as sequences of reactions that transform a metab-olite into another. For example, in [9] each metabolite isconsidered a state and a reaction is considered as atransformation from one state to another. The reactionsare compiled from the KEGG Ligand database [54]. Thisstate space is searched heuristically for pathways that linkmetabolites using the A* algorithm with a cost functionthat is based on the chemical efficiency of the pathway.Similarly, in [10] the metabolic information is structuredas a directed graph with two types of nodes: participants(substrates, enzymes) and events (reactions), and edgeslink reactions to their constituents. Reactions are weightedwith the probability that an enzyme catalyzing this reac-tion exists in the input genome, using sequence similarity.This graph is then searched for maximally weighted path-ways using a depth-first strategy. A similar graph is built in[11], who assert pathways from clusters of co-regulatedgenes that correspond to connected subgraphs. In [12] theauthors represent the metabolic information as Petri netswhich are bipartite graphs where nodes are of two types:places and transitions. Reactions correspond to transi-tions and metabolites to places. Pathways are thengenerated as sequences of transitions in these Petri nets.Related to the prediction of pathways is the analysis of thetopological properties of metabolic networks [67]. Theyshows that metabolic networks from different organismshave the same scaling properties. Furthermore these net-works comply with the design principles of scale-freenetworks.
Similar principles were used in several studies that con-structed genome-wide metabolic networks for organismssuch as Escherichia coli [13-15], Haemophilus infiuenzae[16], Helicobacter pylori [68], and Saccharomyces cerevi-siae [17,18]. In contrast to the automatic methodsdescribed above, these studies were based on manualanalysis of multiple data sources and mostly the literature.Though time-consuming and expensive, manual analysisis also more accurate and the constructed networks ena-bled realistic simulations of metabolic networks. Forexample, in [17] the Saccharomyces cerevisiae metabolicnetwork is reconstructed and its basic features are ana-lyzed. The information was compiled from databases suchas KEGG, YPD, SGD and the literature and was aug-mented with manual functional annotations. The path-ways in the model are compartmentalized betweencytosol, mitochondria and extra-cellular, and transportsteps are added to the model. Extended informationabout the reactions such as stoichiometry, reversibilityand cofactors is also added to the model in order to facil-itate the analysis later on. This model is extensively ana-lyzed in [69] and the phenotype of yeast is simulated
Page 21 of 25(page number not for citation purposes)
using a procedure that considered stoichiometric, thermo-dynamic and reaction capacity constraints. They tested theeffect of gene loss and different growth media on thenetwork viability. Most of the simulations were in agree-ment with the experimental data. In [18] the model isextended by fully compartmentalizing the metabolic reac-tions by adding five more cellular locations to the modeland revising functional assignments for gene products.They also refine the definitions of reactions to include fac-tors such as mass conservation and charge balance. Theirresults were quite consistent with the experimental data.
Expression data and pathway predictionAnother approach to pathway prediction is based on theanalysis of expression data. The main idea behind thisapproach is that genes participating in the same cellularprocess are functionally interconnected and this intercon-nection can be induced from expression data by clustering(e.g. [70]). For example, in [31] the authors cluster genesusing expression data, and if multiple genes from a clusterbelong to a certain pathway they infer that the other mem-bers of the cluster might also belong there. Clustering isalso used in [32]. The authors define a distance functionbetween enzyme coding genes that is a combination ofthe distance between the two reactions they catalyze in the
pathway reaction graph, and the correlation-distancebetween their expression profiles. Similarly, in [33] theexpression data and the metabolic information is encodedinto two kernel functions and canonical correlation anal-ysis is used to search for correlations between pathwaysand expression data and therefore identify active path-ways. The work is extended in [71], by including a kernelfunction based on protein-protein interactions. Anapproach for filing holes in pathways based on expressiondata is presented in [23]. In this paper a scoring functionbased on a distance function between expression profilesand the topology of the metabolic network is used to scorecandidate genes.
Module discovery from expression data is anotherapproach to pathway prediction related to clustering. Theassumption is that each cellular process is a moduleinvolving multiple genes that are co-regulated and henceare co-expressed. Moreover, the same gene may partici-pate in more than one process (module) and thereforeeach process accounts for a fraction of the genes expres-sion at a particular measurement. In [72], a probabilisticrelational model for each processes is defined and an algo-rithm to train it is introduced. A similar model based oncombined expression data and protein-protein interac-tion data is developed in [34]. A model for the discoveryof transcriptional modules and their common bindingsite motifs as well as the learning algorithm is developedin [73]. The work is extended to co-regulated gene mod-ules and their regulation program (a small common set ofregulators) in [74]. In that work the modules were consid-ered disjoint but in [75] a new model is developed whichconsiders overlapping processes and tries to find the regu-lation program for each process. All the above models areprobabilistic graphical models that employ EM like learn-ing methods.
A different approach is taken in [49], who focus on metab-olites as the driving force behind the evolution of meta-bolic regulation. They search for metabolites aroundwhich the most significant transcriptional changes occur(as measured by the expression data of the genes that cat-alyze reactions in which this metabolite is involved) andidentify significantly correlated subnetworks of enzymes.In [25], the authors study regulation in metabolic net-works and construct a hierarchy of pathways based ontheir mutual correlation as measured by expression data.The authors also suggest that correlation in expressionprofiles is an indication of linear pathways that consist ofsequences of reactions. Different isozymes might be inde-pendently co-regulated with different groups of genes andtherefore might be used to switch between the alternateroutes or in the differential regulation of reactions that areshared between different pathways. Expression data wasused not only for pathway prediction but also in pathway
Table 6: The correspondence of genes to Biozon NR identifiers. We refer to genes using their unique and stable Biozon NR identifiers, at http://biozon.org [41]. To view an entry with identifier x follow the URL: http://biozon.org/Biozon/ProfileLink/x.
analysis. Efforts for integrating expression data with met-abolic information started by trying to visualize theexpression data on top of the pathways diagrams. In Path-way Processor [36] the system tries to assess the probabil-ity that the expression of a large number of genes in anygiven pathway is significantly changed in a given experi-ment and each pathway is scored using this probability.Similarly, MAPPFinder [76] annotates the GO hierarchywith expression data. The method first associate the GOterms with genes and then calculates the percentage of thegenes that meet a user specified criterion. A zscore is com-puted in order to quantify the significance of the obtainedpercentage. PathMAPA [77] is a system that visualizesmetabolic pathways and expression data in ArabidopsisThaliana, where pathways are represented in terms ofenzymes annotated with EC numbers. The tool estimatesthe significance of a pathway being up regulated or downregulated in a given experiment. In [35] the authors sug-gest three functions to score pathways: based on the activ-ity of the genes in the pathway, co-regulations of the genesand the topology of the pathway. The method is thenapplied to putative pathways in the KEGG database inorder to asses the biological significance of these path-ways. In [37] the authors present a scoring method forclasses of genes. These classes are based on Gene Ontologyclassification and the scoring is based on expression data.Three types of scores are proposed: co-expression of genesin the same class, statistical significance of gene expres-sion changes, and the learnability of the classification. Thescores are converted to p-values to assess their statisticalsignificance, in search of classes with significant scores.Similarly, the biological significance of the pathwaysasserted in [12] (see previous subsection) is computed byusing a scoring function based on expression data in [30].They score both pathways and genes using two differenttypes of scores (conspicuousness of the expression profileand the synchrony), and the scores are used to asses whichare the most probable pathways. Another pathway scoringapproach was developed in [38], in search of active path-ways. This approach scores a gene set (the set of geneswhich catalyze reactions in a pathway) by summing allpairwise similarity of the genes in the set. The scoreobtained is then transformed to a pvalue. All theseapproaches are related to our approach. However, ourmethod does not score pathways but rather it scores geneassignments to determine the best assignment and iden-tify alternative assignments. Furthermore, our algorithmis geared toward simultaneous prediction of multiplepathways while minimizing shared assignments.
Authors' contributionsLP implemented the model, ran experiments, comparedto other models and analyzed the result sets. GY con-ceived of the study, designed the model and analyzed theresults.
Additional material
AcknowledgementsThe authors thank Eurie Hong from SGD for providing us with the SGD pathway data, and William Dirks for help with expression data analysis. We also thank the reviewers for their invaluable comments. This work is sup-ported by the National Science Foundation under Grant No. 0218521 to Golan Yona.
References1. Selkov E, Galimova M, Goryanin I, Gretchkin Y, Ivanova N, Komarov
Y, Maltsev N, Mikhailova N, Nenashev V, Overbeek R, Panyushkina E,Pronevitch L, Selkov JE: The metabolic pathway collection: anupdate. Nucleic Acids Res 1997, 25:37-38.
2. Selkov JE, Grechkin Y, Mikhailova N, Selkov E: MPW: the Meta-bolic Pathways Database. Nucleic Acids Res 1998, 26:43-45.
3. Overbeek R, Larsen N, Pusch GD, D'Souza M, Jr ES, Kyrpides N, Fon-stein M, Maltsev N, Selkov E: WIT: integrated system for high-throughput genome sequence analysis and metabolicreconstruction. Nucleic Acids Res 2000, 28:123-125.
4. Ellis LBM, Hou BK, Kang W, Wackett LP: The University of Min-nesota Biocatalysis/Biodegradation Database: post-genomicdata mining. Nucleic Acids Res 2003, 31:262-265.
5. Kanehisa M, Goto S, Kawashima S, Okuno Y, Hattori M: The KEGGresource for deciphering the genome. Nucleic Acids Res2004:D277-280.
6. Krieger CJ, Zhang P, Mueller LA, Wang A, Paley S, Arnaud M, Pick J,Rhee SY, Karp PD: MetaCyc: a multiorganism database of met-abolic pathways and enzymes. Nucleic Acids Res 2004:D438-442.
7. Overbeek R, Larsen N, Walunas T, D'Souza M, Pusch G, SelkovEugene J, Liolios K, Joukov V, Kaznadzey D, Anderson I, Bhattach-aryya A, Burd H, Gardner W, Hanke P, Kapatral V, Mikhailova N,Vasieva O, Osterman A, Vonstein V, Fonstein M, Ivanova N, KyrpidesN: The ERGO genome analysis and discovery system. NucleicAcids Res 2003, 31:164-171.
8. The SEED: an Annotation/Analysis Tool Provided by FIG[http://theseed.uchicago.edu/FIG/index.cgi]
9. McShan D, Rao S, Shah I: PathMiner: predicting metabolic path-ways by heuristic search. Bioinformatics 2003, 19(13):1692-1698.
10. Sirava M, Schafer T, Eiglsperger M, Kaufmann M, Kohlbacher O, Born-berg-Bauer E, Lenhof HP: BioMiner–modeling, analyzing, andvisualizing biochemical pathways and networks. Bioinformatics2002, 18(Suppl 2):S219-230.
11. van Helden J, Gilbert D, Wernisch L, Schroeder S, Mand Wodak:Applications of regulatory sequence analysis and metabolicnetwork analysis to the interpretation of gene expressiondata. Lecture Notes in Computer Sciences 2001, 2066:155-172.
12. Kuffner R, Zimmer R, Lengauer T: Pathway analysis in metabolicdatabases via differential metabolic display (DMD). Bioinfor-matics 2000, 16(9):825-836.
Additional File 1Assignments of genes to pathways with the time series dataset. For each pathway we list the 10 highest scoring and the 10 lowest scoring assign-ments (or all assignments, if the number of assignments is 100 or less).Click here for file[http://www.biomedcentral.com/content/supplementary/1471-2105-6-217-S1.pdf]
Additional File 2Assignments of genes to pathways with the rosetta dataset. For each path-way we list the 10 highest scoring and the 10 lowest scoring assignments (or all assignments, if the number of assignments is 100 or less).Click here for file[http://www.biomedcentral.com/content/supplementary/1471-2105-6-217-S2.pdf]
Page 23 of 25(page number not for citation purposes)
13. Pramanik J, Keasling J: Stoichiometric model of Escherichia colimetabolism: Incorporation of growth-rate dependent bio-mass composition and mechanistic energy requirements.Biotechnol Bioengg 1997, 56:398-421.
14. Edwards JS, Palsson BO: The Escherichia coli MG1655 in silicometabolic genotype: Its definition, characteristics, andcapabilities. Proc Natl Acad Sci USA 2000, 97(10):5528-5533.
15. Reed J, Vo T, Schilling C, Palsson B: An expanded genome-scalemodel of Escherichia coli K-12 (iJR904 GSM/GPR). GenomeBiol 2003, 4(9):R54.
16. Edwards J, Palsson B: Systems Properties of the Haemophilusinfluenzae Rd Metabolic Genotype. J Biol Chem 1999,274(25):17410-17416.
17. Forster J, Famili I, Fu P, Palsson BO, Nielsen J: Genome-ScaleReconstruction of the Saccharomyces cerevisiae MetabolicNetwork. Genome Res 2003, 13(2):244-253.
18. Duarte NC, Herrgard MJ, Palsson BO: Reconstruction and Vali-dation of Saccharomyces cerevisiae iND750, a Fully Com-partmentalized Genome-Scale Metabolic Model. Genome Res2004, 14(7):1298-1309.
20. Bono H, Goto S, Fujibuchi W, Ogata H, Kanehisa M: SystematicPrediction of Orthologous Units of Genes in the CompleteGenomes. Genome Inform Ser Workshop Genome Inform 1998,9:32-40.
21. Shah I: Predicting enzyme function from sequence. In PhDthesis George Mason University; 1999.
22. Syed U, Yona G: Using a mixture of probabilistic decision treesfor direct prediction of protein function. In Proceedings of theseventh annual international conference on Computational molecularbiology ACM Press; 2003:289-300.
23. Kharchenko P, Vitkup D, Church GM: Filling gaps in a metabolicnetwork using expression information. Bioinformatics 2004,20(suppl 1):il78-185.
24. Green M, Karp P: A Bayesian method for identifying missingenzymes in predicted metabolic pathway databases. BMCBioinformatics 2004, 5:76.
25. Ihmels J, Levy R, Barkai N: Principles of transcriptional controlin the metabolic network of Saccharomyces cerevisiae. NatBiotechnol 2004, 22:86-92.
26. Spellman PT, Sherlock G, Zhang MQ, Iyer VR, Anders K, Eisen MB,Brown PO, Botstein D, Futcher B: Comprehensive Identificationof Cell Cycle-regulated Genes of the Yeast Saccharomycescerevisiae by Microarray Hybridization. Mol Biol Cell 1998,9(12):3273-3297.
27. Hughes TR, Marton MJ, Jones AR, Roberts CJ, Stoughton R, ArmourCD, Bennett HA, Coffey E, Dai H, He YD, Kidd MJ, King AM, MeyerMR, Slade D, Lum PY, Stepaniants SB, Shoemaker DD, Gachotte D,Chakraburtty K, Simon J, Bard M, Friend SH: Functional Discoveryvia a Compendium of Expression Profiles. Cell 2000,102:109-126.
28. McCormick SM, Frye SR, Eskin SG, Teng CL, Lu CM, Russell CG,Chittur KK, McIntire LV: Microarray analysis of shear stressedendothelial cells. Biorheology 2003, 40(1–3):5-11.
29. Yoo MS, Chun HS, Son JJ, DeGiorgio LA, Kim DJ, Peng C, Son JH:Oxidative stress regulated genes in nigral dopaminergic neu-ronal cells: Correlation with the known pathology in Parkin-sons disease. Brain Res Mol Brain Res 2003, 110:76-84.
30. Zien A, Küffner R, Zimmer R, Lengauer T: Analysis of GeneExpression Data with Pathway Scores. In Proc Int Conf Intell SystMol Biol Edited by: Altman R. La Jolla, CA: AAAI; 2000:407-417.
31. Nakao M, Bono H, Kawashima S, Kamiya T, Sato K, Goto S, KanehisaM: Genome-scale Gene Expression Analysis and PathwayReconstruction in KEGG. Genome Inform Ser Workshop GenomeInform 1999, 10:94-103.
32. Hanisch D, Zien A, Zimmer R, Lengauer T: Co-clustering of bio-logical networks and gene expression data. Bioinformatics 2002,18(Suppl 1):S145-154.
33. Vert JP, Kanehisa M: Extracting active pathways from geneexpression data. Bioinformatics 2003, 19(Suppl 2):II238-II244.
34. Segal E, Wang H, Koller D: Discovering molecular pathwaysfrom protein interaction and gene expression data. Bioinfor-matics 2003, 19(Suppl 1):i264-272.
35. Kurhekar M, Adak S, Jhunjhunwala S, Raghupathy K: Genome-WidePathway Analysis And Visualization Using Gene ExpressionData. Pac Symp Biocomput 2002:462-473.
37. Pavlidis P, Lewis D, Noble W: Exploring gene expression datawith class scores. Pac Symp Biocomput 2002:474-485.
38. Rahnenfuhrer J, Domingues FS, Maydt J, Lengauer T: Calculatingthe Statistical Significance of Changes in Pathway ActivityFrom Gene Expression Data. Statistical Applications in Genetics andMolecular Biology 2004, 3:.
39. Stenesh J: Dictionary of Biochemistry and Molecular Biology 2nd edition.John Wiley & Sons; 1989.
40. Cho RJ, Campbell MJ, Winzeler EA, Steinmetz L, Conway A, WodickaL, Tyra G, Wolfsberg AEG, Landsman D, Lockhart DJ, Davis RW: AGenome-Wide Transcriptional Analysis of the Mitotic CellCycle. Mol Cell 1998, 2:65-73.
41. Birkland A, Yona G: BIOZON: a system for unification, man-agement and analysis of heterogeneous biological data.[http://biozon.org].
42. Altschul S, Madden T, Schaffer A, Zhang J, Zhang Z, Miller W, LipmanD: Gapped BLAST and PSI-BLAST: a new generation of pro-tein database search programs. Nucleic Acids Res 1997,25(17):3389-3402.
43. Dirks W, Yona G: A comprehensive study of the notion offunctional link between genes based on microarray data,promoter signals, protein-protein interactions and pathwayanalysis. 2003.
44. Gene Function, Metabolic Pathways and Comparatiev Genomics in YeastIEEE Computer Society; 2003.
45. Christie KR, Weng S, Balakrishnan R, Costanzo MC, Dolinski K,Dwight SS, Engel SR, Feierbach B, Fisk DG, Hirschman JE, Hong EL,Issel-Tarver L, Nash R, Sethuraman A, Starr B, Theesfeld CL, AndradaR, Binkley G, Dong Q, Lane C, Schroeder M, Botstein D, Cherry JM:Saccharomyces Genome Database (SGD) provides tools toidentify and analyze sequences from Saccharomyces cerevi-siae and related sequences from other organisms. NucleicAcids Res 2004:D311-314.
47. Miklos G, Rubin G: The role of the Genome Project in deter-mining gene function: insights from model organisms. Cell1996, 86(4):521-529.
48. Supplemental information [http://biozon.org/ftp/data/papers/pathway-assignment/]
49. Patil KR, Nielsen J: Uncovering transcriptional regulation ofmetabolism by using metabolic network topology. Proc NatlAcad Sci USA 2005, 102(8):2685-2689.
50. Selkov E, Basmanova S, Gaasterland T, Goryanin I, Gretchkin Y, Malt-sev N, Nenashev V, Overbeek R, Panyushkina E, Pronevitch L, SelkovJE, Yunus I: The metabolic pathway collection from EMP: theenzymes and metabolic pathways database. Nucleic Acids Res1996, 24:26-28.
51. Kanehisa M, Goto S: KEGG: Kyoto Encyclopedia of Genes andGenomes. Nucleic Acids Res 2000, 28:27-30.
52. Kanehisa M, Goto S, Kawashima S, Nakaya A: The KEGG data-bases at GenomeNet. Nucleic Acids Res 2002, 30:42-46.
53. Goto S, Bono H, Ogata H, Fujibuchi W, Nishioka T, Sato K, KanehisaM: Organizing and computing metabolic pathway data interms of binary relations. Pac Symp Biocomput 1997.
54. Goto S, Okuno Y, Hattori M, Nishioka T, Kanehisa M: LIGAND:database of chemical compounds and reactions in biologicalpathways. Nucleic Acids Res 2002, 30:402-404.
55. BioCyc Database [http://biocyc.org/]56. Karp PD, Riley M, Paley SM, Pellegrini-Toole A: The MetaCyc
Database. Nucleic Acids Res 2002, 30:59-61.57. Ellis LBM, Hershberger CD, Wackett LP: The University of Minne-
sota Biocatalysis/Biodegradation Database: microorgan-isms, genomics and prediction. Nucleic Acids Res 2000,28:377-379.
58. Lemer C, Antezana E, Couche F, Fays F, Santolaria X, Janky R, DevilleY, Richelle J, Wodak SJ: The aMAZE LightBench: a web inter-face to a relational database of cellular processes. Nucleic AcidsRes 2004:D443-448.
Page 24 of 25(page number not for citation purposes)
66. Paley SM, Karp PD: Evaluation of computational metabolic-pathway predictions for Helicobacter pylori. Bioinformatics2002, 18(5):715-724.
67. Jeong H, Tombor B, Albert R, Oltvai Z, Barabasi A: The Large-Scale Organization of Metabolic Networks. Nature 2000,407(6804):651-654.
68. Schilling CH, Covert MW, Famili I, Church GM, Edwards JS, PalssonBO: Genome-Scale Metabolic Model of Helicobacter pylori26695. J Bacteriol 2002, 184(16):4582-4593.
69. Famili I, Forster J, Nielsen J, Palsson BO: Saccharomyces cerevi-siae phenotypes can be predicted by using constraint-basedanalysis of a genome-scale reconstructed metabolicnetwork. Proc Natl Acad Sci USA 2003, 100(23):13134-13139.
70. Eisen MB, Spellman PT, Brown PO, Botstein D: Cluster analysisand display of genome-wide expression patterns. Proc NatlAcad Sci USA 1998, 95(25):14863-14868.
71. Yamanishi Y, Vert JP, Nakaya A, Kanehisa M: Extraction of corre-lated gene clusters from multiple genomic data by general-ized kernel canonical correlation analysis. Bioinformatics 2003,19(Suppl):i323-330.
72. Segal E, Battle A, Koller D: Decomposing gene expression intocellular processes. Pac Symp Biocomput, Kaua'i 2003:89-100.
73. Segal E, Yelensky R, Koller D: Genome-wide discovery of tran-scriptional modules from DNA sequence and geneexpression. Bioinformatics 2003, 19(Suppl 1):i273-282.
74. Segal E, Shapira M, Regev A, Pe'er D, Botstein D, Kollerl D, FriedmanN: Module networks: identifying regulatory modules andtheir condition-specific regulators from gene expressiondata. Nat Genet 2003, 34(2):166-176.
75. Battle A, Segal E, Koller D: Probabilistic discovery of overlap-ping cellular processes and their regulation. In Proc 8th InterConf on Research in Computational Molecular Biology (RECOMB) NewYork, NY, USA: ACM Press; 2004:167-176.
76. Doniger S, Salomonis N, Dahlquist K, Vranizan K, Lawlor S, ConklinB: MAPPFinder: using Gene Ontology and GenMAPP to cre-ate a global gene-expression profile from microarray data.Genome Biol 2003, 4:R7.
77. Pan D, Sun N, Cheung KH, Guan Z, Ma L, Holford M, Deng X, ZhaoH: PathMAPA: a tool for displaying gene expression and per-forming statistical tests on metabolic pathways at multiplelevels for Arabidopsis. BMC Bioinformatics 2003, 4:56.
78. in silico Organisms – Saccharomyces cerevisiae (baker'syeast) [http://gcrg.ucsd.edu/organisms/yeast.html]
Page 25 of 25(page number not for citation purposes)