94
User Documentation August 2013 BMC ProactiveNet Performance Management - Dell Compellent Storage Monitoring Version 1.0.00
User Documentation August 2013
BMC ProactiveNetPerformance Management -Dell Compellent StorageMonitoringVersion 1.0.00
Table of Contents 2
Version 1.0.00
BMC ProactiveNet Performance Management - Dell Compellent Storage Monitoring
Table of Contents...........................................................................................................................9User Goals and Features
...........................................................................................................................10Business Value
...........................................................................................................................10Supported Platforms
...........................................................................................................................10Supported Operating Systems
...........................................................................................................................12Adding Central Monitoring Administration Tags
...........................................................................................................................14Installing Dell Compellent Enterprise Manager
...........................................................................................................................15Installing Enterprise Manager Data Collector
...........................................................................................................................20Installing Enterprise Manager Client
...........................................................................................................................25Installing Enterprise Manager Server Agent
...........................................................................................................................30Connecting to Data Collector
...........................................................................................................................32Configuring Dell Compellent Enterprise Manager
...........................................................................................................................33Installing Dell Compellent Storage
...........................................................................................................................33Importing Dell Compellent Storage into Central Administration
...........................................................................................................................36Creating the Installation Package
...........................................................................................................................41Downloading the Installation Package
...........................................................................................................................41Installing the Package
...........................................................................................................................45Creating and Importing an Adapter for a BMC PATROL KM
...........................................................................................................................52Updating an Adapter for a BMC PATROL KM
...........................................................................................................................52Importing and Customizing Thresholds
...........................................................................................................................54Verifying the Data Collection
...........................................................................................................................55Managing Baselines and Key Performance Indicators
...........................................................................................................................58Configuring General Settings
...........................................................................................................................59Managing Policies
...........................................................................................................................60Configuring Monitor Settings
...........................................................................................................................62Enabling the Debug Mode
...........................................................................................................................64Setting Advanced Configuration Variables
...........................................................................................................................66Scheduling Automatic Reports
...........................................................................................................................67Configuring Thresholds
...........................................................................................................................69Using BMC ProactiveNet Performance Management
...........................................................................................................................69Navigating the BMC ProactiveNet Operations Console
...........................................................................................................................73Adding attributes to the graph
...........................................................................................................................73Viewing and manipulating attribute graphs
Table of Contents 3
Version 1.0.00
BMC ProactiveNet Performance Management - Dell Compellent Storage Monitoring
...........................................................................................................................73Viewing monitors for a device
...........................................................................................................................74Changing thresholds
...........................................................................................................................74Managing Baselines and Key Performance Indicators
...........................................................................................................................78Dell Compellent Battery
...........................................................................................................................78Dell Compellent Cache Memory
...........................................................................................................................79Dell Compellent Controller
...........................................................................................................................80Dell Compellent Disk
...........................................................................................................................81Dell Compellent Disk Class
...........................................................................................................................81Dell Compellent Disk Folder
...........................................................................................................................83Dell Compellent Enterprise Manager
...........................................................................................................................83Dell Compellent Fan
...........................................................................................................................84Dell Compellent KM
...........................................................................................................................84Dell Compellent Port
...........................................................................................................................85Dell Compellent Power Supply
...........................................................................................................................85Dell Compellent Storage Center
...........................................................................................................................86Dell Compellent Temperature
...........................................................................................................................87Dell Compellent UPS
...........................................................................................................................87Dell Compellent Voltage
...........................................................................................................................88Dell Compellent Volume
Support Information

5
Version 1.0.00
BMC ProactiveNet Performance Management - Dell Compellent Storage Monitoring
This section contains information about how to contact Customer Support and the levels of supportoffered for this and other releases.
If you have problems with or questions about a BMC product, or for the latest support policies, seethe Customer Support website at http://www.bmc.com/support. You can also access productdocuments and search the Knowledge Base for help with an issue at http://www.SentrySoftware.com. If you do not have access to the web and you are in the United States orCanada, contact Customer Support at 800 537 1813. Outside the United States or Canada, contactyour local BMC office or agent.

Legal Notices
7
Version 1.0.00
BMC ProactiveNet Performance Management - Dell Compellent Storage Monitoring
© Copyright 2011 BMC Software, Inc.
BMC, BMC Software, and the BMC Software logo are the exclusive properties of BMC Software, Inc.,are registered with the U.S. Patent and Trademark Office, and may be registered or pendingregistration in other countries. All other BMC trademarks, service marks, and logos may be registeredor pending registration in the U.S. or in other countries. All other trademarks or registeredtrademarks are the property of their respective owners.
Linux is the registered trademark of Linus Torvalds.
Oracle and Java are registered trademarks of Oracle and/or its affiliates. Other names may betrademarks of their respective owners.
UNIX is the registered trademark of The Open Group in the US and other countries.
The information included in this documentation is the proprietary and confidential information of BMCSoftware, Inc., its affiliates, or licensors. Your use of this information is subject to the terms andconditions of the applicable End User License agreement for the product and to the proprietary andrestricted rights notices included in the product documentation.
BMC Softw are Inc.2101 CityW est Blvd, Houston TX 77042-2827, USA713 918 8800Customer Support: 800 537 1813 (United States and Canada) or contact your local support center

Key Concepts

9
Version 1.0.00
BMC ProactiveNet Performance Management - Dell Compellent Storage Monitoring
The pages in this section provide a high-level overview of the product.
User Goals and Features
Business Value
Supported Platforms
Note that for convenience and brevity, reference to BMC ProactiveNet Performance Management - Dell CompellentStorage Monitoring, may also be made as BPPM Dell Compellent Storage Monitoring.
User Goals and Features
BMC ProactiveNet Performance Management - Dell Compellent Storage Monitoring product allowsyou to view, monitor, and manage your entire Dell storage environment by viewing the current andhistorical information through a centralized console. You can view detailed system metrics on allparts of your environment.
BMC ProactiveNet Performance Management - Dell Compellent Storage Monitoring enables you tomanage the following in your environment:
Storage centers: size, consumed and subscribed capacity, I/Os throughput...
Controllers: Hit ratio, data traffic, response time...
Battery: Charge, status...
Fan: Speed percentage, speed status....
Memory: size, status...
Power Supply: status
Temperature: status, temperature reported by the temperature sensor...
Voltage: status, voltage reported by the voltage sensor...
Ports: status, data traffic, response time…
Disk Folders: size, consumed and subscribed capacity, I/Os throughput...
Disk Classes: size, number of unhealthy disks...
Disks: Size, data traffic...
Volumes: Data traffic, hit ratio, response time...
10User Goals and Features
Version 1.0.00
BMC ProactiveNet Performance Management - Dell Compellent Storage Monitoring
Business Value
BMC ProactiveNet Performance Management - Dell Compellent Storage Monitoring provides currentand historical information through a centralized console so you can easily view and manage yourentire Dell environment. The product collects and brings critical performance data and useful metricsinto the BMC ProactiveNet Performance Management environment and enables SAN Administrators tobe warned whenever a problem occurs in their Dell environment.
BMC ProactiveNet Performance Management - Dell Compellent Storage Monitoring:
collects storage performance and metrics and monitors all the hardware aspects to keep totalcontrol of your SAN environment
identifies performance bottlenecks (storage centers, volumes, controllers, etc.)
manages and helps rationalize disk space consumption
detects oversubscription situations (thin provisioning).
Supported Platforms
BMC ProactiveNet Performance Management - Dell Compellent Storage Monitoring supports any DellCompellent Storage Center compatible with Dell Compellent Enterprise Manager 6.3.
Supported Operating Systems
BMC ProactiveNet Performance Management - Dell Compellent Storage Monitoring can be run on thefollowing operating systems:
Windows
Linux
Solaris.

Planning
12Adding Central Monitoring Administration Tags
Version 1.0.00
BMC ProactiveNet Performance Management - Dell Compellent Storage Monitoring
Adding Central MonitoringAdministration TagsAdding Central Monitoring Administration tags should be taken into consideration before installation.
A policy specifies a set of actions to be taken when a specific condition on the BMC PATROL Agent isfulfilled. A policy enables you to perform the following actions:
Apply specific configuration to one or more BMC PATROL Agents
Configure thresholds and set baselines on BMC ProactiveNet Child Servers
Each policy is assigned a BMC ProactiveNet Central Monitoring Administration tag and each BMCPATROL Agent can have one or more tags assigned to it. When you assign a tag to a BMC PATROLAgent the associated policy is applied to the PATROL Agent. You can assign the tag value of a policyto a PATROL Agent in the following ways:
You can add a PATROL Agent and set the tag as part of the configuration process that youperform from Central Monitoring Administration. For details, see Managing downloads in CentralMonitoring Administration.
If the PATROL Agent has already been installed, use PATROL Configuration Manager to set thefollowing ruleset that provides the tags:/AgentSetup/Identification/Tags/TAG/tagName =tagDescription
For example if the tag which has to be applied is oracleTag, the ruleset is as follows/AgentSetup/Identification/Tags/TAG/oracleTag= “ORACLE MONITORING”
In BMC ProactiveNet version 9.0, the tag description is ignored, and only the tag name is used to evaluate the policy.

Installing

14
Version 1.0.00
BMC ProactiveNet Performance Management - Dell Compellent Storage Monitoring
This section describes the installation procedure for BMC ProactiveNet Performance Management -Dell Compellent Storage Monitoring. It will first explain how to install Dell Compellent EnterpriseManager, which is a requirement to fully monitor Dell Compellent Storage Centers. Then, it willdescribe how to create the installation package from BMC ProactiveNet Central Administration andhow to download and install the package.
Installing Dell CompellentEnterprise ManagerTo fully monitor Dell Compellent, you are required to install Dell Compellent Enterprise Manager. DellCompellent Enterprise Manager allows you to monitor, manage, and analyze Storage Centers from acentralized management console. It consists of the following components:
Data Collector: Data Collector is a service that gathers reporting data and alerts from allStorage Centers. There are two types of Data Collectors: Primary and Remote. All installationsmust include one primary Data Collector. Each Data Collector service (primary or remote) ismanaged using a Data Collector Manager.
Database: Data Collector stores data in a database or flat file. The database can run on thesame or a different platform from Data Collector.
Enterprise Manager Clients: An Enterprise Manager Client connects to the Data CollectorService to provide a centralized management console for one or more Storage Centers.Additional clients can be connected to the same Data Collector Service to provide managementfrom more than one location.
Server Agents: By installing a Server Agent for Microsoft Windows on each Windows serverusing a Storage Center, Data Collector can gather local volume information from a Windowsserver. Using this information, Enterprise Manager can free volume storage space from expiredReplays that would otherwise remain locked by Windows. Each Server Agent is managed by aServer Agent Manager.
This guide describes how to install and configure Enterprise Manager components. For moreinformation, please refer to the Dell Compellent Enterprise Manager documentation.
Requirements
Dell Compellent Enterprise Manager requires Java Runtime Environment (JRE) 1.6 or higher (1.6update 43 or higher recommended) to be installed on each computer that will host the EnterpriseManager Data Collector and/or the Enterprise Manager.
On 64-bit systems, both the 32-bit and the 64-bit JRE are required.
15Installing Dell Compellent Enterprise Manager
Version 1.0.00
BMC ProactiveNet Performance Management - Dell Compellent Storage Monitoring
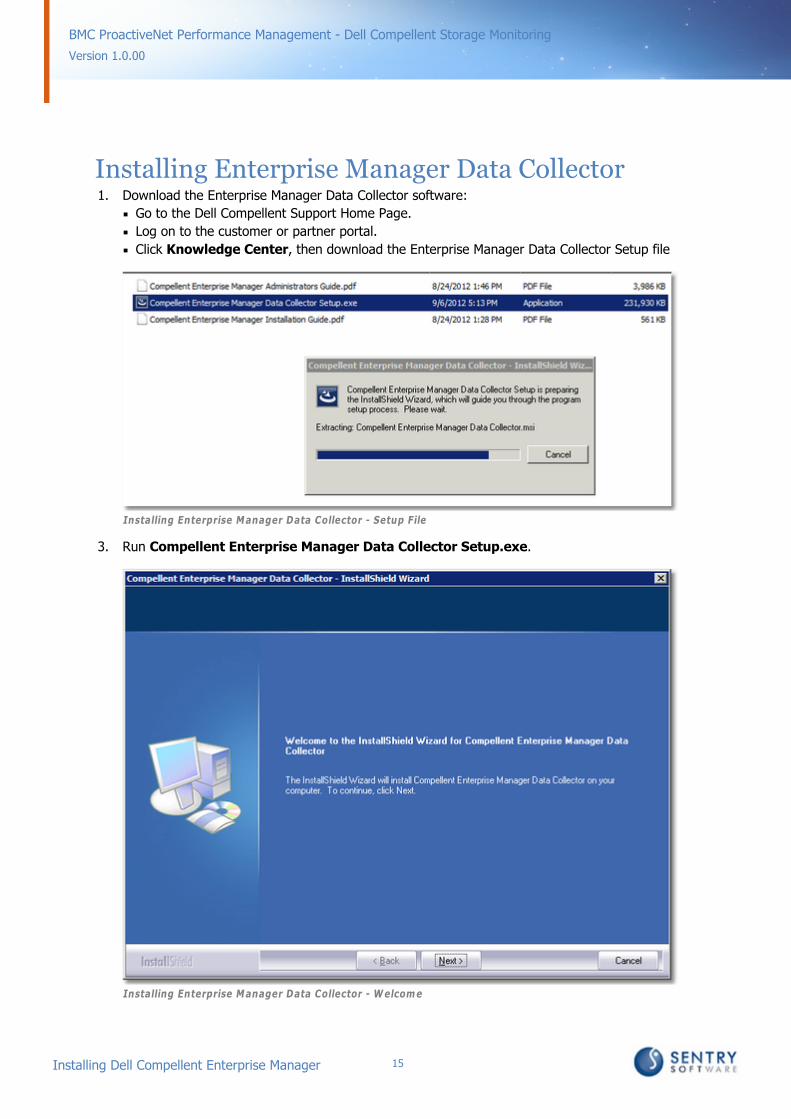
Installing Enterprise Manager Data Collector1. Download the Enterprise Manager Data Collector software:
Go to the Dell Compellent Support Home Page.
Log on to the customer or partner portal.
Click Knowledge Center, then download the Enterprise Manager Data Collector Setup file
Installing Enterprise Manager Data Collector - Setup File
3. Run Compellent Enterprise Manager Data Collector Setup.exe.
Installing Enterprise Manager Data Collector - W elcome
16Installing Dell Compellent Enterprise Manager
Version 1.0.00
BMC ProactiveNet Performance Management - Dell Compellent Storage Monitoring
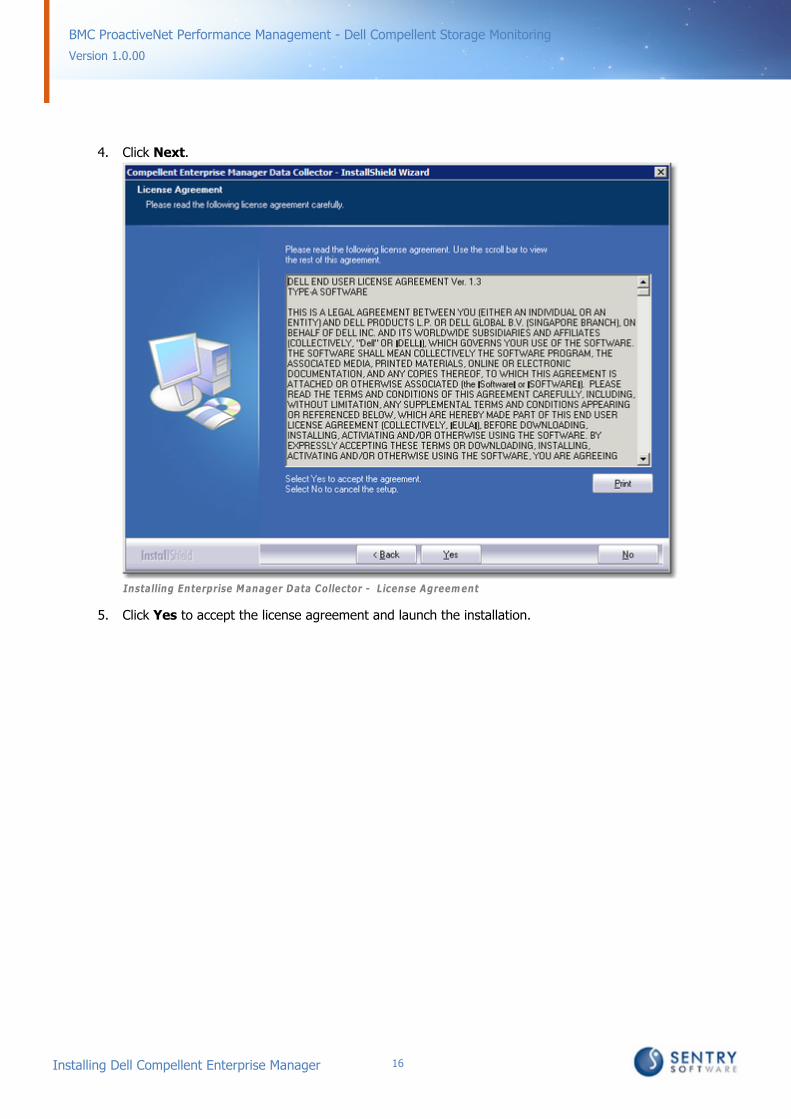
4. Click Next.
Installing Enterprise Manager Data Collector - License Agreement
5. Click Yes to accept the license agreement and launch the installation.

17Installing Dell Compellent Enterprise Manager
Version 1.0.00
BMC ProactiveNet Performance Management - Dell Compellent Storage Monitoring
Installing Enterprise Manager Data Collector - Installation Complete
6. Once the installation is complete, click Finish.

18Installing Dell Compellent Enterprise Manager
Version 1.0.00
BMC ProactiveNet Performance Management - Dell Compellent Storage Monitoring
The Enterprise Manager Data Collector Setup wizard appears:
Installing Enterprise Manager Data Collector - Configuration
7. Configure Enterprise Manager Data Collector:
Select Configure as Primary Data Collector
Set the Data Collector Service and OS Service Information
Click Next.
Installing Enterprise Manager Data Collector - License Activation

19Installing Dell Compellent Enterprise Manager
Version 1.0.00
BMC ProactiveNet Performance Management - Dell Compellent Storage Monitoring
8. Enter the Product Key, choose whether you want to activate your license over Internet or overEmail/Phone, and click Next.
Data collector can be used for 30 days without activation.
Installing Enterprise Manager Data Collector - SMI-S Server Properties
9. Since BMC ProactiveNet Performance Management - Dell Compellent Storage Monitoringleverages the Dell Compellent API, there's no need to enable the SMI-S Server. Leave the fieldsblank and click Next.
Installing Enterprise Manager Data Collector - Administrator User
20Installing Dell Compellent Enterprise Manager
Version 1.0.00
BMC ProactiveNet Performance Management - Dell Compellent Storage Monitoring
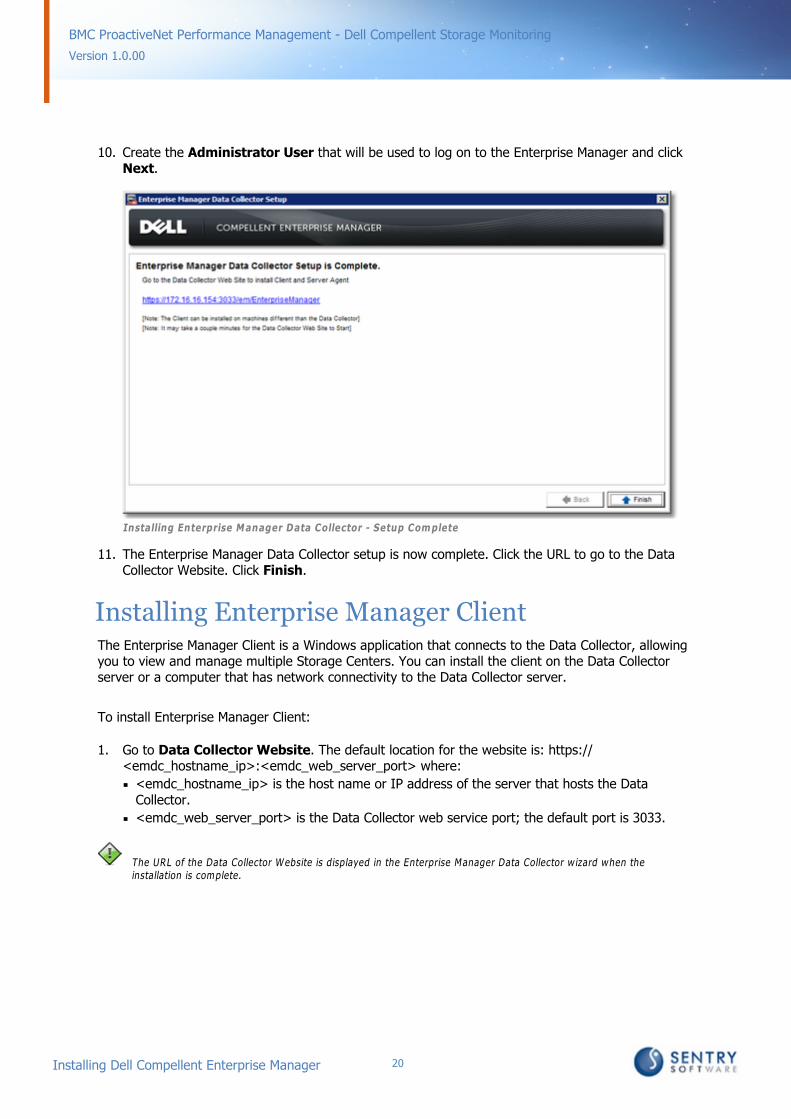
10. Create the Administrator User that will be used to log on to the Enterprise Manager and clickNext.
Installing Enterprise Manager Data Collector - Setup Complete
11. The Enterprise Manager Data Collector setup is now complete. Click the URL to go to the DataCollector Website. Click Finish.
Installing Enterprise Manager ClientThe Enterprise Manager Client is a Windows application that connects to the Data Collector, allowingyou to view and manage multiple Storage Centers. You can install the client on the Data Collectorserver or a computer that has network connectivity to the Data Collector server.
To install Enterprise Manager Client:
1. Go to Data Collector Website. The default location for the website is: https://<emdc_hostname_ip>:<emdc_web_server_port> where:
<emdc_hostname_ip> is the host name or IP address of the server that hosts the DataCollector.
<emdc_web_server_port> is the Data Collector web service port; the default port is 3033.
The URL of the Data Collector Website is displayed in the Enterprise Manager Data Collector wizard when theinstallation is complete.
21Installing Dell Compellent Enterprise Manager
Version 1.0.00
BMC ProactiveNet Performance Management - Dell Compellent Storage Monitoring
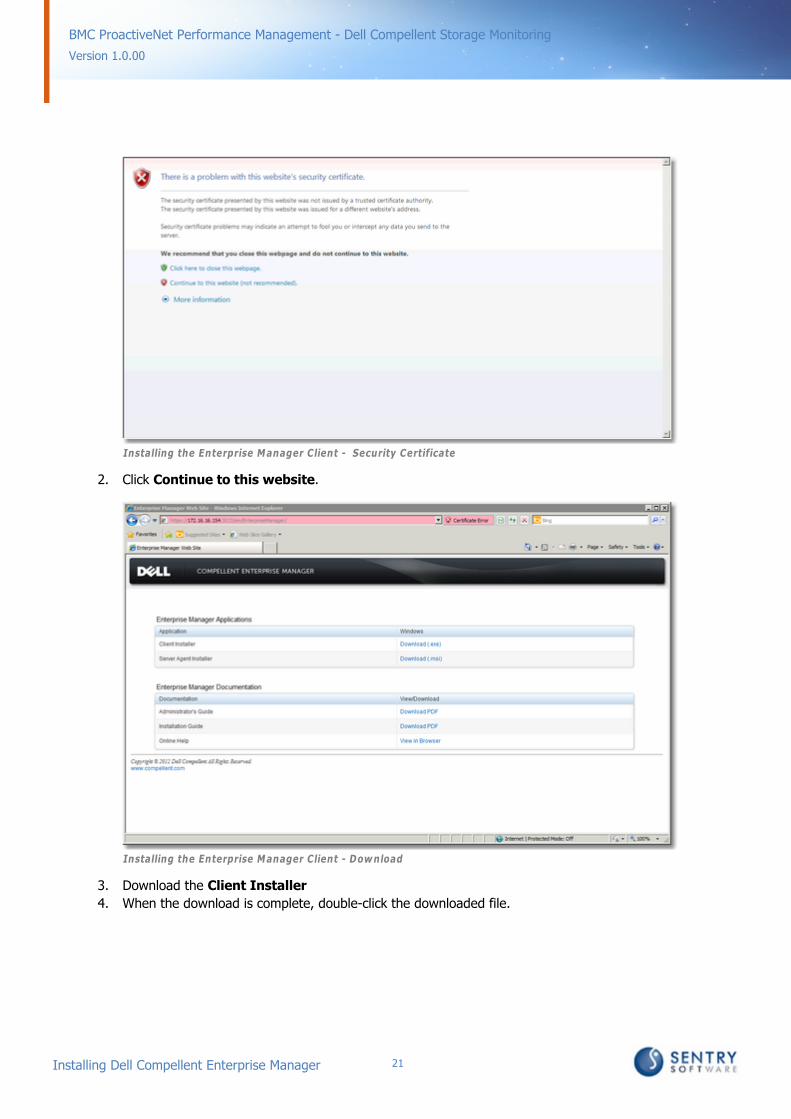
Installing the Enterprise Manager Client - Security Certificate
2. Click Continue to this website.
Installing the Enterprise Manager Client - Dow nload
3. Download the Client Installer
4. When the download is complete, double-click the downloaded file.

22Installing Dell Compellent Enterprise Manager
Version 1.0.00
BMC ProactiveNet Performance Management - Dell Compellent Storage Monitoring
A Security Warning dialog box appears.
Installing the Enterprise Manager Client - Security W arning
5. Click Run to start the installation.
Installing the Enterprise Manager Client - W elcome
6. Click Next.

23Installing Dell Compellent Enterprise Manager
Version 1.0.00
BMC ProactiveNet Performance Management - Dell Compellent Storage Monitoring
Installing the Enterprise Manager Client - License Agreement
7. Click Yes to accept the license agreement and start the installation.
24Installing Dell Compellent Enterprise Manager
Version 1.0.00
BMC ProactiveNet Performance Management - Dell Compellent Storage Monitoring
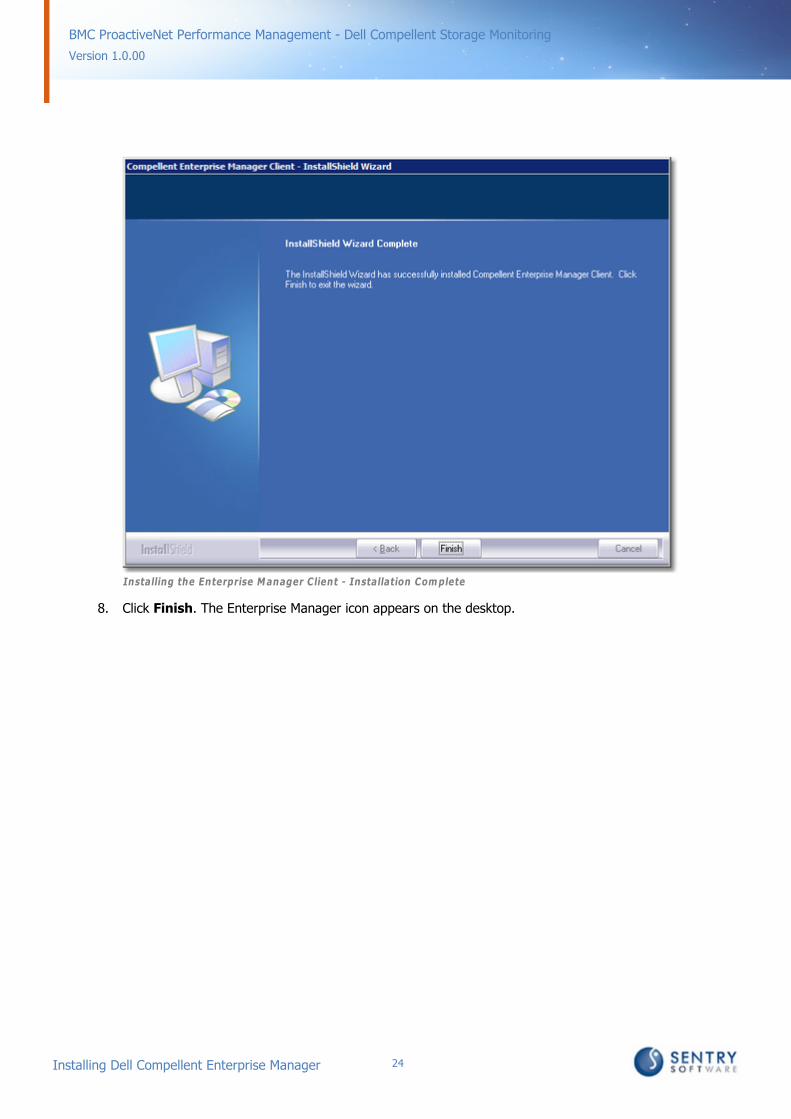
Installing the Enterprise Manager Client - Installation Complete
8. Click Finish. The Enterprise Manager icon appears on the desktop.

25Installing Dell Compellent Enterprise Manager
Version 1.0.00
BMC ProactiveNet Performance Management - Dell Compellent Storage Monitoring
Installing Enterprise Manager Server AgentThe Enterprise Manager Server Agent is a service for Windows that allows you to see serverinformation, recover unused storage space from Windows NTFS, and monitor and control DellCompellent NAS and zNAS servers.
To install Enterprise Manager Server Agent:
1. Go to Data Collector Website. The default location for the website is: https://<emdc_hostname_ip>:<emdc_web_server_port> where:
<emdc_hostname_ip> is the host name or IP address of the server that hosts the DataCollector.
<emdc_web_server_port> is the Data Collector web service port; the default is 3033.
The URL of the Data Collector Website is displayed in the Enterprise Manager Data Collector wizard when theinstallation is complete.
Installing the Server Agent - Security Certificate
2. Click Continue to this website.
26Installing Dell Compellent Enterprise Manager
Version 1.0.00
BMC ProactiveNet Performance Management - Dell Compellent Storage Monitoring
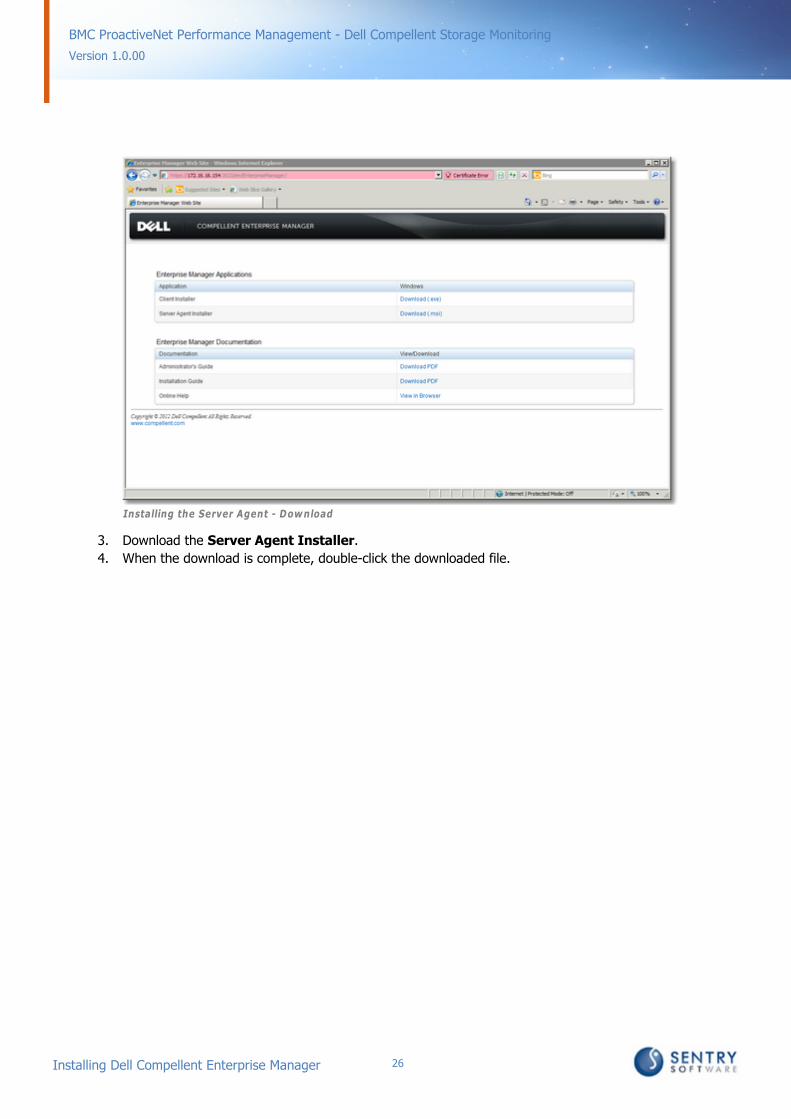
Installing the Server Agent - Dow nload
3. Download the Server Agent Installer.
4. When the download is complete, double-click the downloaded file.
27Installing Dell Compellent Enterprise Manager
Version 1.0.00
BMC ProactiveNet Performance Management - Dell Compellent Storage Monitoring
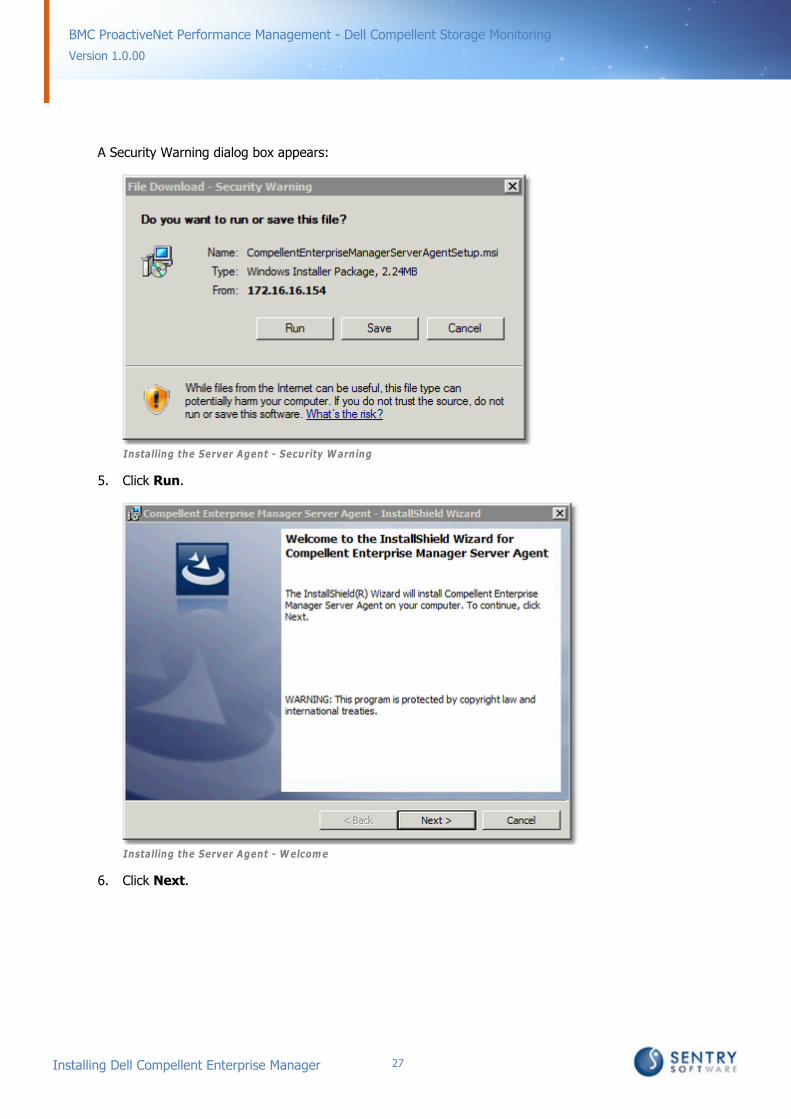
A Security Warning dialog box appears:
Installing the Server Agent - Security W arning
5. Click Run.
Installing the Server Agent - W elcome
6. Click Next.
28Installing Dell Compellent Enterprise Manager
Version 1.0.00
BMC ProactiveNet Performance Management - Dell Compellent Storage Monitoring
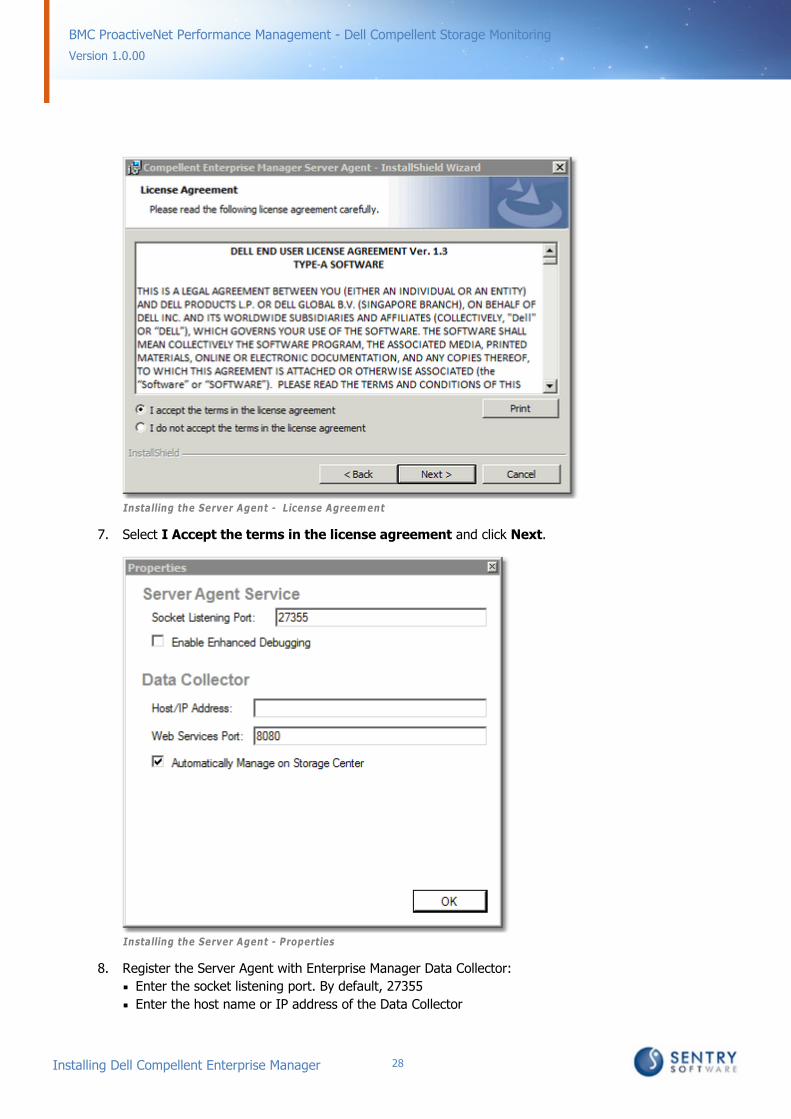
Installing the Server Agent - License Agreement
7. Select I Accept the terms in the license agreement and click Next.
Installing the Server Agent - Properties
8. Register the Server Agent with Enterprise Manager Data Collector:
Enter the socket listening port. By default, 27355
Enter the host name or IP address of the Data Collector
29Installing Dell Compellent Enterprise Manager
Version 1.0.00
BMC ProactiveNet Performance Management - Dell Compellent Storage Monitoring
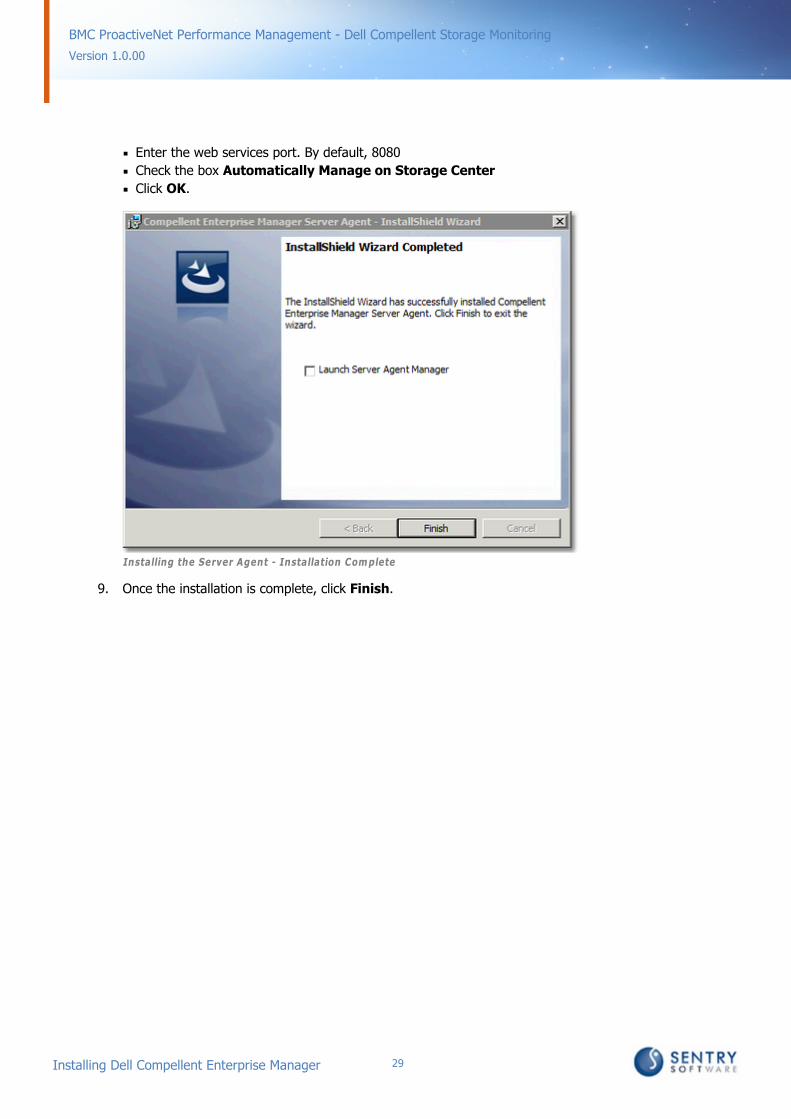
Enter the web services port. By default, 8080
Check the box Automatically Manage on Storage Center
Click OK.
Installing the Server Agent - Installation Complete
9. Once the installation is complete, click Finish.

30Installing Dell Compellent Enterprise Manager
Version 1.0.00
BMC ProactiveNet Performance Management - Dell Compellent Storage Monitoring
Connecting to Data CollectorThe Enterprise Manager Client can be used to connect to the Data Collector to view and managemultiple Storage Centers:
1. On the desktop, double-click the Enterprise Manager Client shortcut. The Login toCompellent Enterprise Manager Client window appears.
Configuring Enterprise Manager Client - Login Page
2. Complete the following fields:
User Name: Enterprise Manager user that was created while installing Data Collector
Password: User's password
Host/IP: host name or IP address of the server that hosts the Data Collector.
Web Server Port: If you changed the Web Server Port during installation, enter the updatedport.
3. Click Log In. The Client connects to the Data Collector and displays the Storage (SAN/NAS) view.

31Installing Dell Compellent Enterprise Manager
Version 1.0.00
BMC ProactiveNet Performance Management - Dell Compellent Storage Monitoring
Configuring Enterprise Manager Client
4. Click Add Storage Center
Configuring Enterprise Manager Client - Add Storage Center
5. Complete the following fields:
Host Name: Host name or IP address of the Storage Center.
User Name: Name of an administrator user on the Storage Center.
Password: Password for the Storage Center user.
6. Click Finish. The Storage Center appears in the list of Storage Centers.
32Installing Dell Compellent Enterprise Manager
Version 1.0.00
BMC ProactiveNet Performance Management - Dell Compellent Storage Monitoring
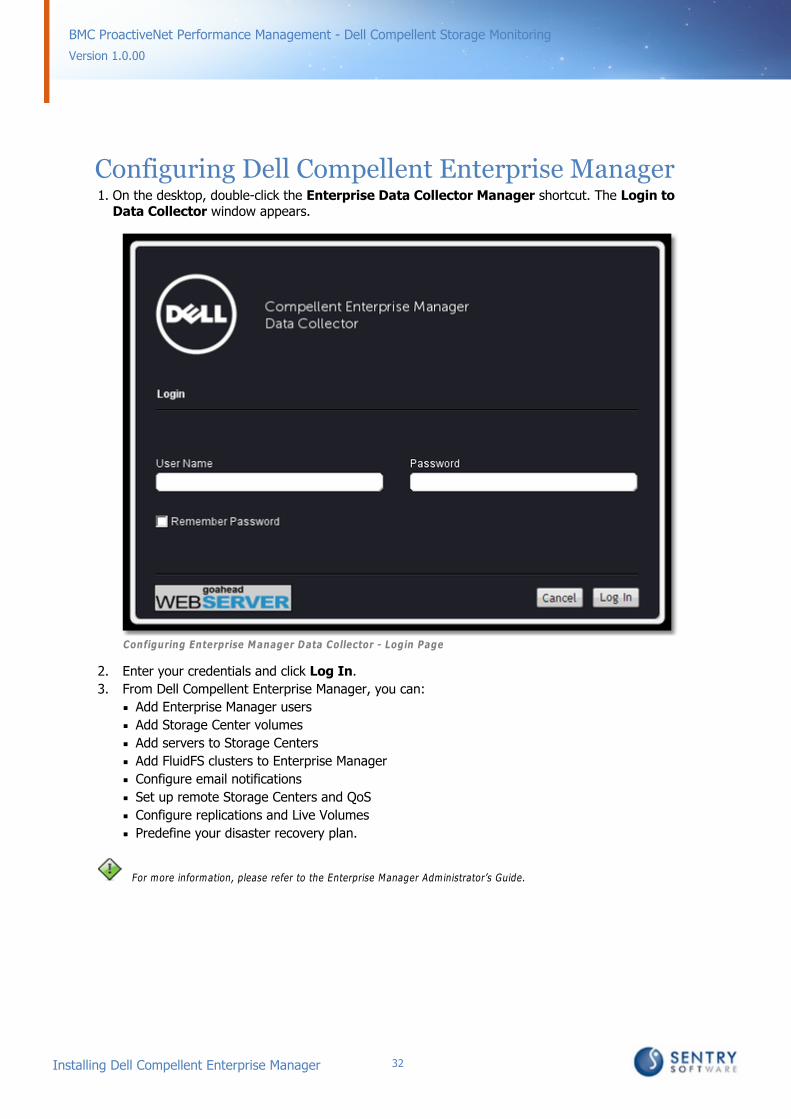
Configuring Dell Compellent Enterprise Manager1. On the desktop, double-click the Enterprise Data Collector Manager shortcut. The Login to
Data Collector window appears.
Configuring Enterprise Manager Data Collector - Login Page
2. Enter your credentials and click Log In.
3. From Dell Compellent Enterprise Manager, you can:
Add Enterprise Manager users
Add Storage Center volumes
Add servers to Storage Centers
Add FluidFS clusters to Enterprise Manager
Configure email notifications
Set up remote Storage Centers and QoS
Configure replications and Live Volumes
Predefine your disaster recovery plan.
For more information, please refer to the Enterprise Manager Administrator’s Guide.
33Installing Dell Compellent Storage
Version 1.0.00
BMC ProactiveNet Performance Management - Dell Compellent Storage Monitoring
Installing Dell Compellent Storage
The installation can be handled from A to Z from BMC ProactiveNet Central MonitoringAdministration. Once the latest version of the solution has been loaded into BMC ProactiveNet CentralMonitoring Administration, administrators can create all the installation packages required for theirdifferent operating systems and platforms and save them for later use in the Monitoring InstallationPackages list. These packages can then be deployed to multiple computers. Administrators just haveto connect to BMC ProactiveNet Central Monitoring Administration from the machine where they wantto install the package, download it and launch the installation.
This section describes the different steps to follow to install BPPM Dell Compellent StorageMonitoring:
Importing Dell Compellent Storage into Central AdministrationCreating the Installation PackageDownloading the Installation PackageInstalling the Package.
Importing Dell Compellent Storage into CentralAdministrationThe BMC ProactiveNet Central Monitoring Repository includes the versions of BMC components thatcan be used with BMC ProactiveNet. If the version available in the Repository does not correspond tothe latest one, you will have to manually import it:
1. Log on to BMC ProactiveNet Central Monitoring Administration
2. Click the Repository drawer and select Manage Repository.

34Installing Dell Compellent Storage
Version 1.0.00
BMC ProactiveNet Performance Management - Dell Compellent Storage Monitoring
Checking the version available
3. Check that the version of the BMC component available is actually the latest one. If not,download the Dell Compellent KM for PATROL package available on the Sentry Software Websiteand save it on the local computer from which you are running the Central MonitoringAdministration web-based console.
35Installing Dell Compellent Storage
Version 1.0.00
BMC ProactiveNet Performance Management - Dell Compellent Storage Monitoring
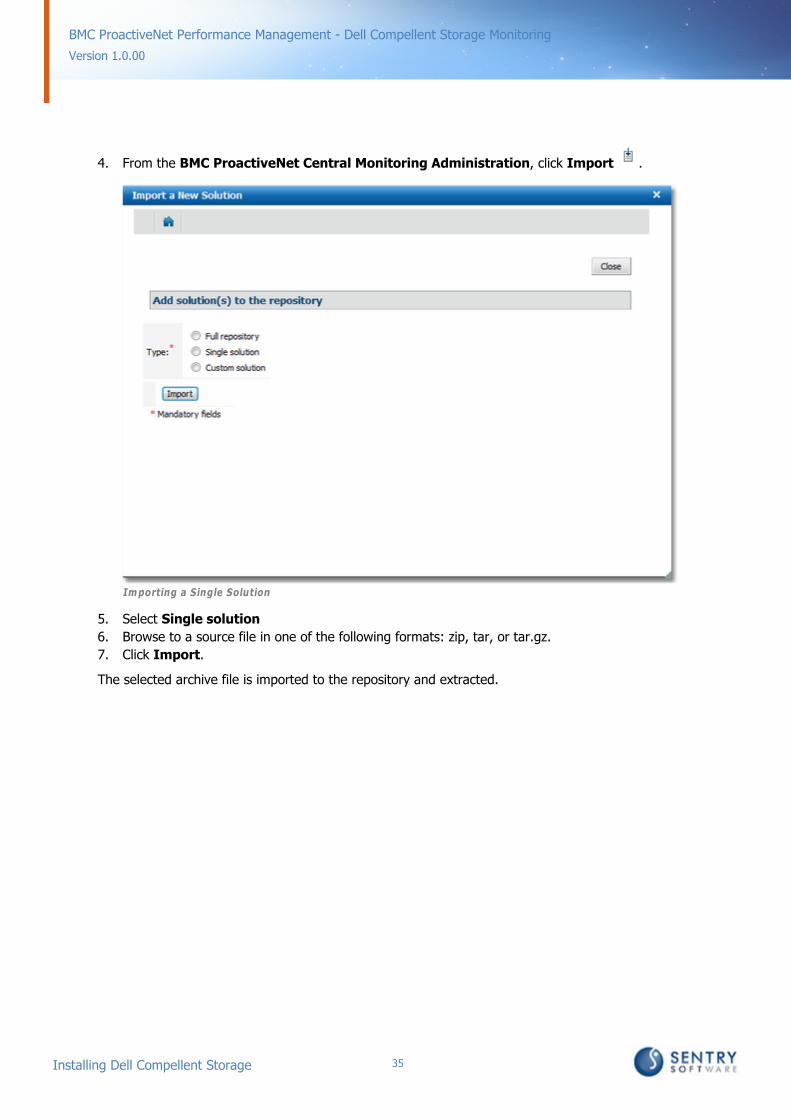
4. From the BMC ProactiveNet Central Monitoring Administration, click Import .
Importing a Single Solution
5. Select Single solution
6. Browse to a source file in one of the following formats: zip, tar, or tar.gz.
7. Click Import.
The selected archive file is imported to the repository and extracted.
36Installing Dell Compellent Storage
Version 1.0.00
BMC ProactiveNet Performance Management - Dell Compellent Storage Monitoring
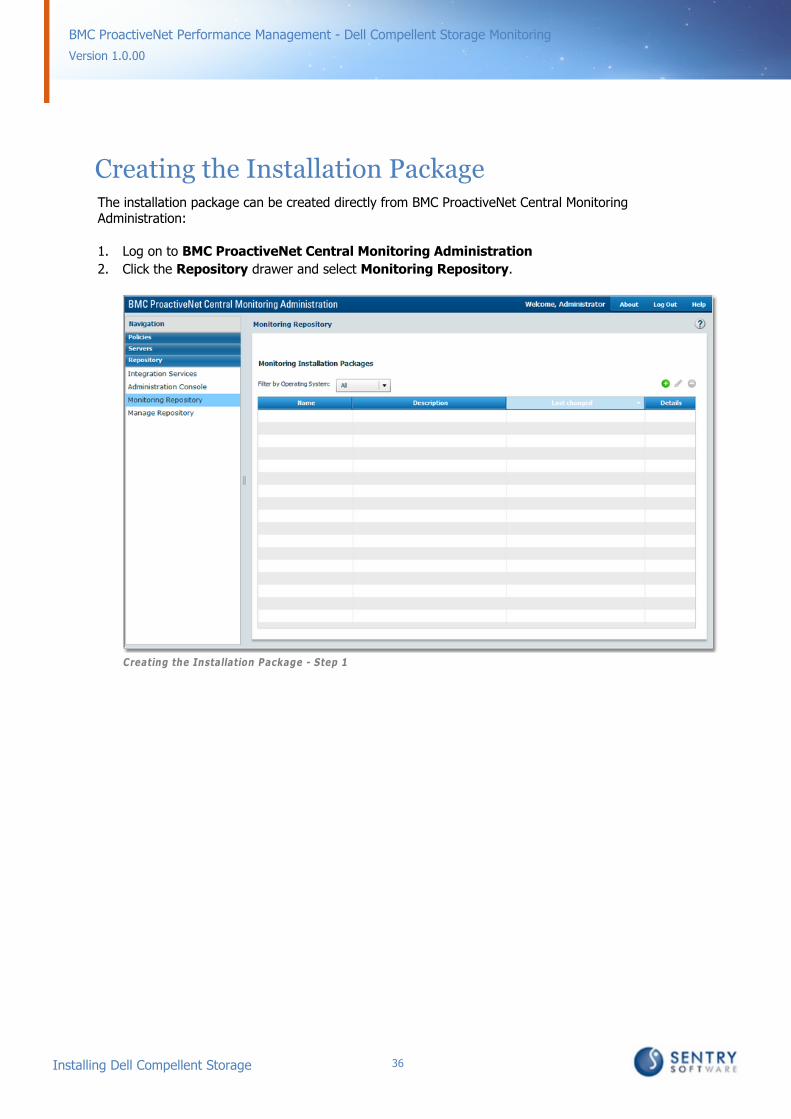
Creating the Installation PackageThe installation package can be created directly from BMC ProactiveNet Central MonitoringAdministration:
1. Log on to BMC ProactiveNet Central Monitoring Administration
2. Click the Repository drawer and select Monitoring Repository.
Creating the Installation Package - Step 1
37Installing Dell Compellent Storage
Version 1.0.00
BMC ProactiveNet Performance Management - Dell Compellent Storage Monitoring
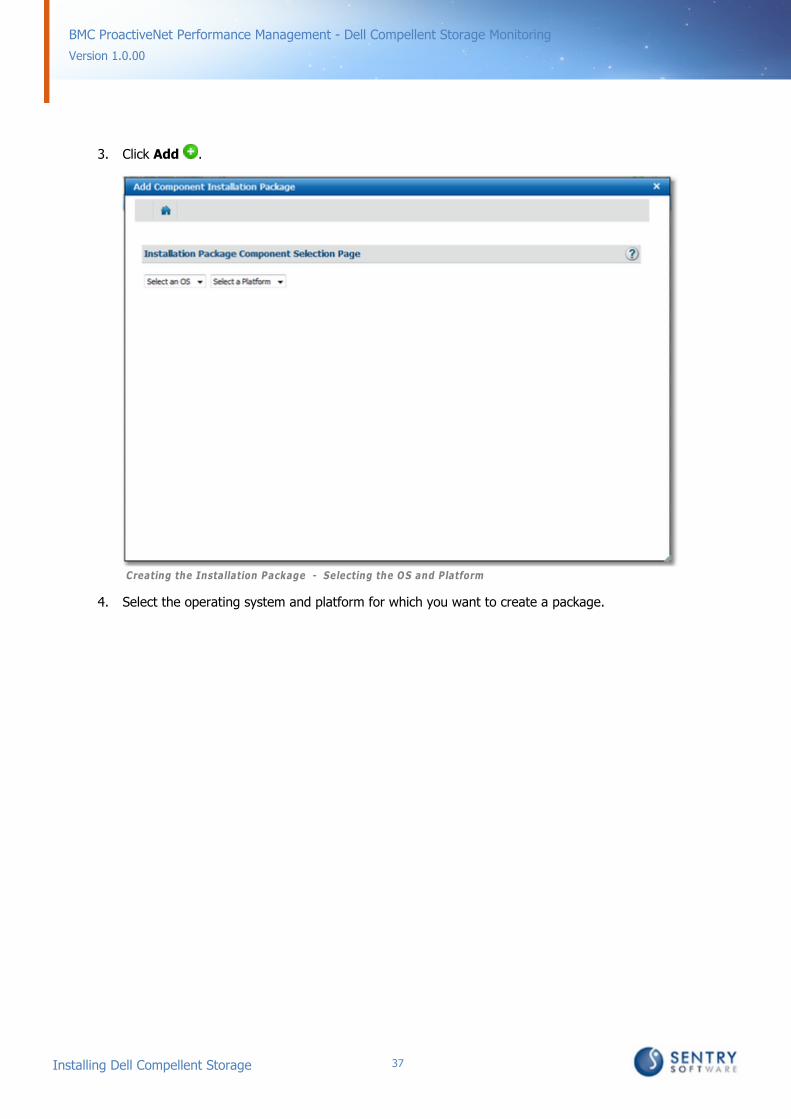
3. Click Add .
Creating the Installation Package - Selecting the OS and Platform
4. Select the operating system and platform for which you want to create a package.
38Installing Dell Compellent Storage
Version 1.0.00
BMC ProactiveNet Performance Management - Dell Compellent Storage Monitoring
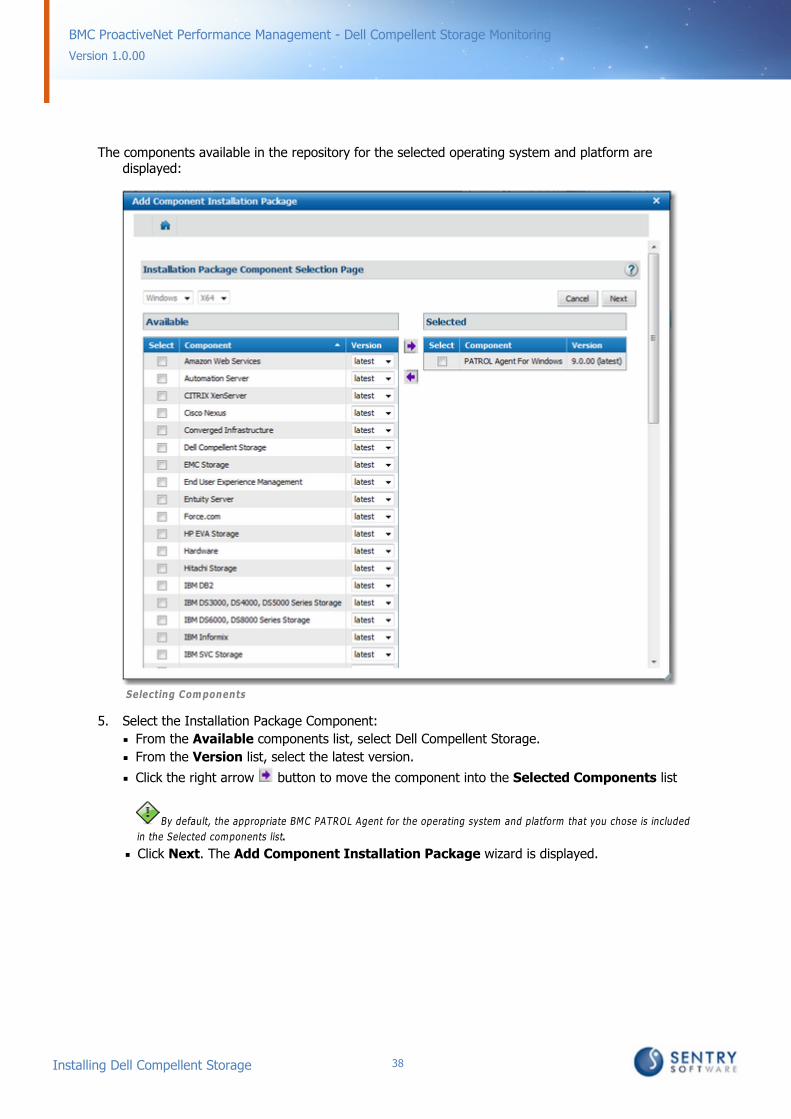
The components available in the repository for the selected operating system and platform aredisplayed:
Selecting Components
5. Select the Installation Package Component:
From the Available components list, select Dell Compellent Storage.
From the Version list, select the latest version.
Click the right arrow button to move the component into the Selected Components list
By default, the appropriate BMC PATROL Agent for the operating system and platform that you chose is included
in the Selected components list.
Click Next. The Add Component Installation Package wizard is displayed.

39Installing Dell Compellent Storage
Version 1.0.00
BMC ProactiveNet Performance Management - Dell Compellent Storage Monitoring
Adding a Component Installation Package
6. Go through the wizard. The Installation Package Details is displayed:
40Installing Dell Compellent Storage
Version 1.0.00
BMC ProactiveNet Performance Management - Dell Compellent Storage Monitoring
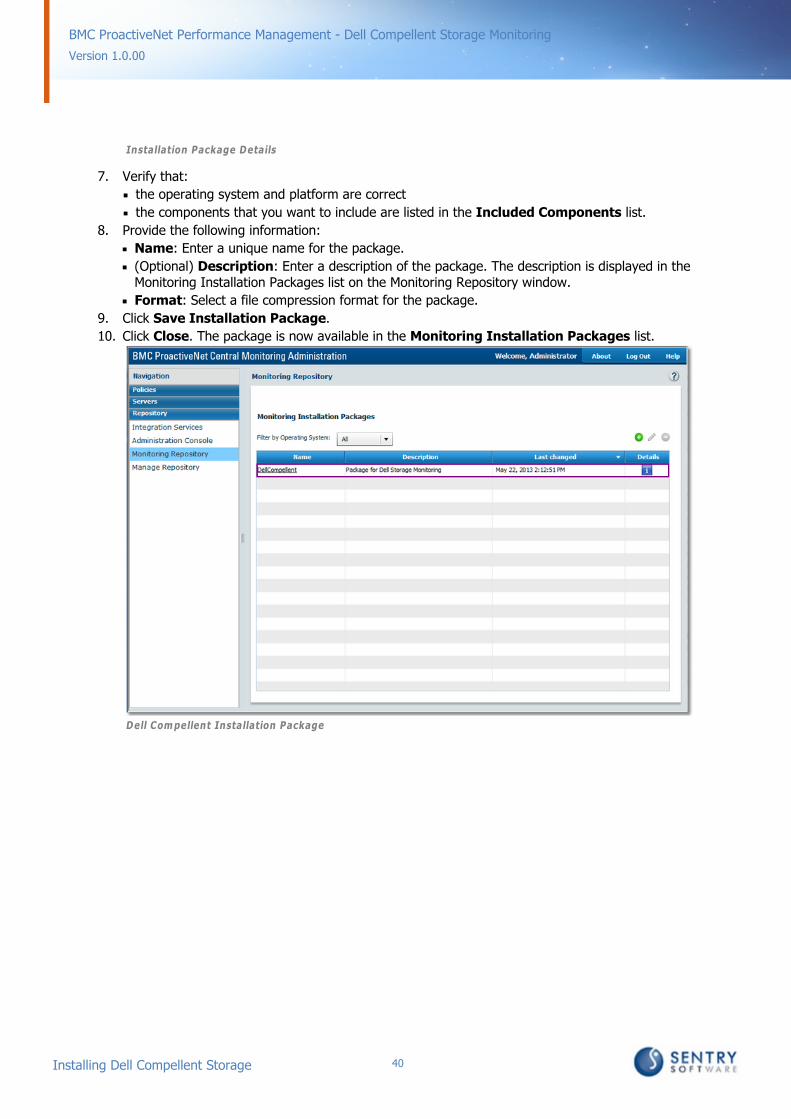
Installation Package Details
7. Verify that:
the operating system and platform are correct
the components that you want to include are listed in the Included Components list.
8. Provide the following information:
Name: Enter a unique name for the package.
(Optional) Description: Enter a description of the package. The description is displayed in theMonitoring Installation Packages list on the Monitoring Repository window.
Format: Select a file compression format for the package.
9. Click Save Installation Package.
10. Click Close. The package is now available in the Monitoring Installation Packages list.
Dell Compellent Installation Package
41Installing Dell Compellent Storage
Version 1.0.00
BMC ProactiveNet Performance Management - Dell Compellent Storage Monitoring
Downloading the Installation PackageYou can download an installation package and install the components on one or more hosts. Theinstallation runs silently with the information entered during package creation.
RecommendationIf you defined the BMC ProactiveNet Integration Service variable for PATROL Agents in theinstallation package, ensure the agents are started in phases. Do not start newly deployed agentsall at once. Start and configure monitoring for the agents in planned phases to reduce theperformance impact on the Integration Service nodes and on the BMC ProactiveNet Serverassociated with the automatic workflow process.
1. Log on to BMC ProactiveNet Central Monitoring Administration from the computer onwhich the PATROL Agent is installed.
2. Click the Repository drawer and select Monitoring Repository.
3. (Optional) To filter the list of installation packages, select an operating system from the Filterby Operating System list.
4. Click the link for the installation package that you want to download.
5. Through the browser's download dialog box, save the installation package.
Installing the Package1. Download the installation package on the host where Dell Compellent Storage needs to be
installed
2. Extract the installation package as appropriate for your operating system. The package isextracted to the bmc_products directory on the current host.
3. From the bmc_products directory, run the installation utility for your operating system:
(UNIX or Linux) RunSilentInstall.sh
(Microsoft Windows) RunSilentInstall.exe
The package is installed on the current host. If the package includes a BMC PATROL Agent, the agentsends a configuration request by passing its tags to BMC ProactiveNet Central MonitoringAdministration, via the Integration Service. Central Monitoring Administration evaluates policies thatmatch the tags, determines the final configuration to be applied, and sends the configurationinformation back to the agent. Monitoring is based on the configuration information received by theagent.
If no policy matches the tags associated with the agent, the agent does not receive configurationinformation. The agent does not begin monitoring until a matching policy is created.
Integrating
43
Version 1.0.00
BMC ProactiveNet Performance Management - Dell Compellent Storage Monitoring
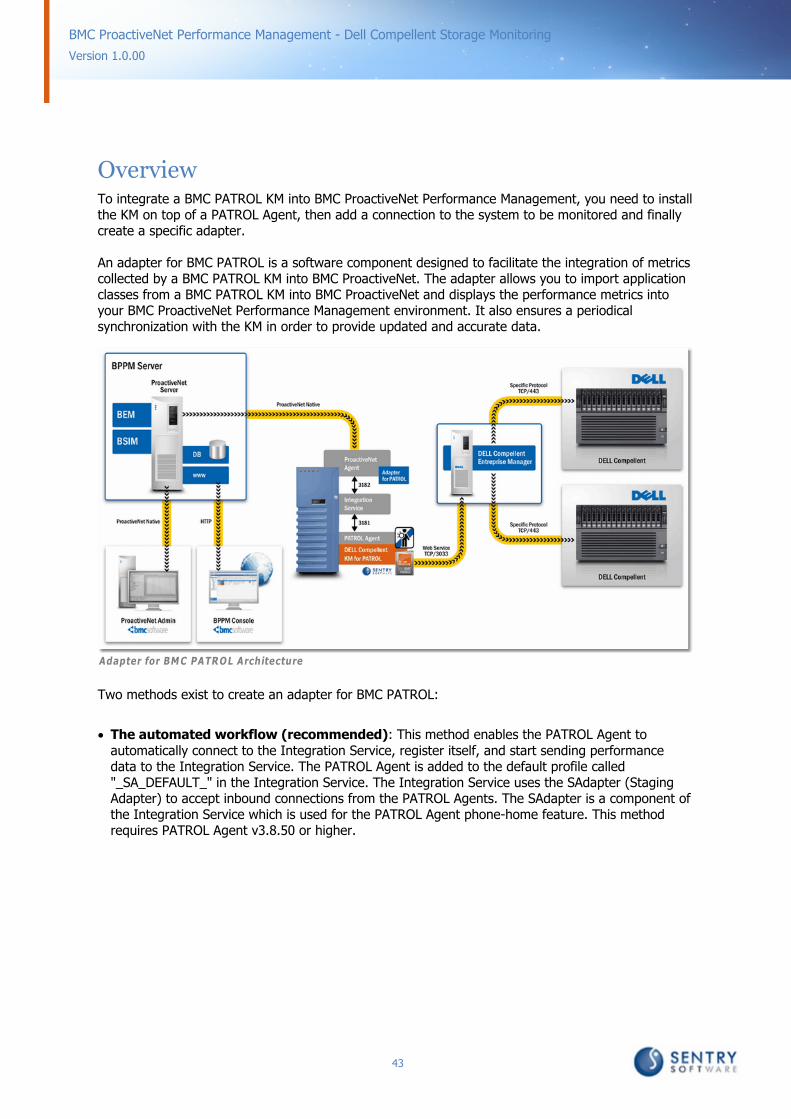
OverviewTo integrate a BMC PATROL KM into BMC ProactiveNet Performance Management, you need to installthe KM on top of a PATROL Agent, then add a connection to the system to be monitored and finallycreate a specific adapter.
An adapter for BMC PATROL is a software component designed to facilitate the integration of metricscollected by a BMC PATROL KM into BMC ProactiveNet. The adapter allows you to import applicationclasses from a BMC PATROL KM into BMC ProactiveNet and displays the performance metrics intoyour BMC ProactiveNet Performance Management environment. It also ensures a periodicalsynchronization with the KM in order to provide updated and accurate data.
Adapter for BMC PATROL Architecture
Two methods exist to create an adapter for BMC PATROL:
The automated workflow (recommended): This method enables the PATROL Agent toautomatically connect to the Integration Service, register itself, and start sending performancedata to the Integration Service. The PATROL Agent is added to the default profile called"_SA_DEFAULT_" in the Integration Service. The Integration Service uses the SAdapter (StagingAdapter) to accept inbound connections from the PATROL Agents. The SAdapter is a component ofthe Integration Service which is used for the PATROL Agent phone-home feature. This methodrequires PATROL Agent v3.8.50 or higher.

44
Version 1.0.00
BMC ProactiveNet Performance Management - Dell Compellent Storage Monitoring
Automated W orkflow - The PATROL Agent connects to the Integration Service
The manual method: This method relies on the p3Adapter profile. Each p3adapter is responsiblefor querying a set of PATROL Agents in a single security domain and retrieves data. This method isnot documented in this guide.
Manual Method - Integration Service connects to PATROL Agent
You can also use the following methods to send events directly to the BPPM cell but you would losethe benefit of the BMC ProactiveNet analytic engine (rate process). The rate process creates thealarms when thresholds are breached and directly sends them to the BPPM cell.
PATROL Architecture Method to be Used
PATROL 7 BMC Impact Integration for PATROL v7
PATROL 3 BMC Impact Integration for PATROL V3 (MCXP)
PATROL Agent 9.0 Wpconfig (Events will be directly sent to cells)
For more info about the above methods, please refer to the knowledge article: Integrating the Events Generated by theKMs into BMC Event Manager.
45Creating and Importing an Adapter for a BMCPATROL KM
Version 1.0.00
BMC ProactiveNet Performance Management - Dell Compellent Storage Monitoring
Creating and Importing an Adapterfor a BMC PATROL KMCreating an Adapter for a BMC PATROL KM
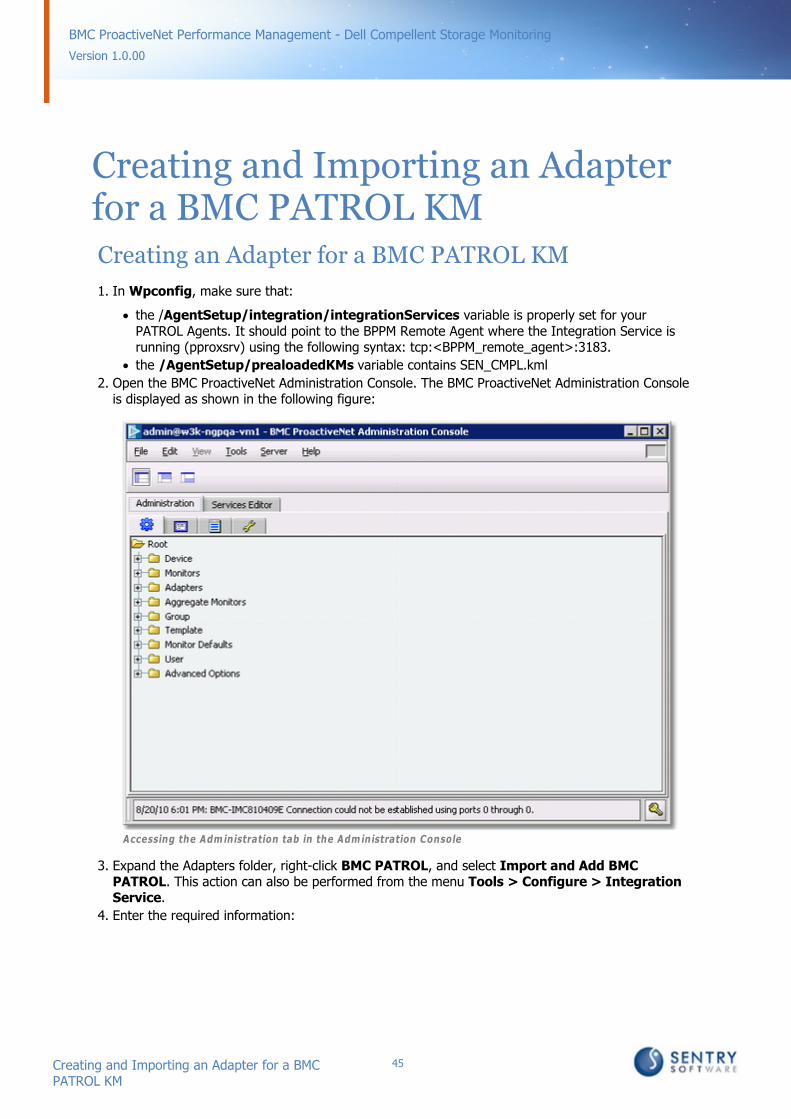
1. In Wpconfig, make sure that:
the /AgentSetup/integration/integrationServices variable is properly set for yourPATROL Agents. It should point to the BPPM Remote Agent where the Integration Service isrunning (pproxsrv) using the following syntax: tcp:<BPPM_remote_agent>:3183.
the /AgentSetup/prealoadedKMs variable contains SEN_CMPL.kml
2. Open the BMC ProactiveNet Administration Console. The BMC ProactiveNet Administration Consoleis displayed as shown in the following figure:
Accessing the Administration tab in the Administration Console
3. Expand the Adapters folder, right-click BMC PATROL, and select Import and Add BMCPATROL. This action can also be performed from the menu Tools > Configure > IntegrationService.
4. Enter the required information:
46Creating and Importing an Adapter for a BMCPATROL KM
Version 1.0.00
BMC ProactiveNet Performance Management - Dell Compellent Storage Monitoring
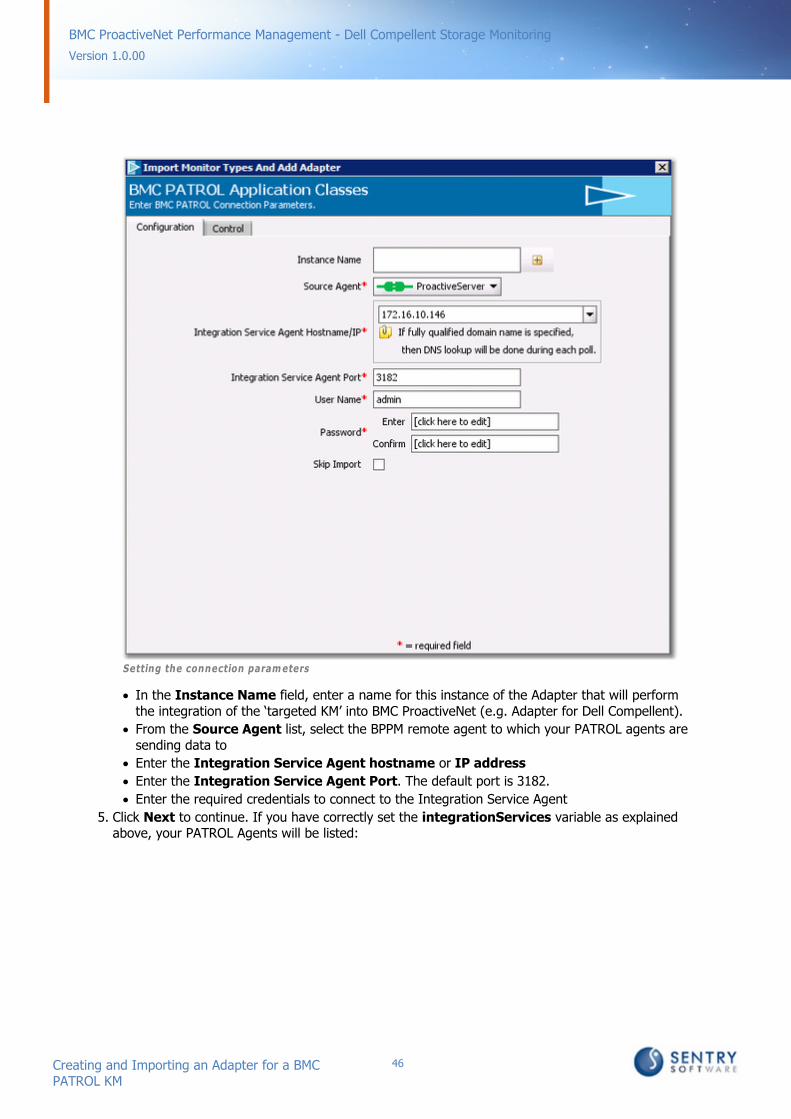
Setting the connection parameters
In the Instance Name field, enter a name for this instance of the Adapter that will performthe integration of the ‘targeted KM’ into BMC ProactiveNet (e.g. Adapter for Dell Compellent).
From the Source Agent list, select the BPPM remote agent to which your PATROL agents aresending data to
Enter the Integration Service Agent hostname or IP address
Enter the Integration Service Agent Port. The default port is 3182.
Enter the required credentials to connect to the Integration Service Agent
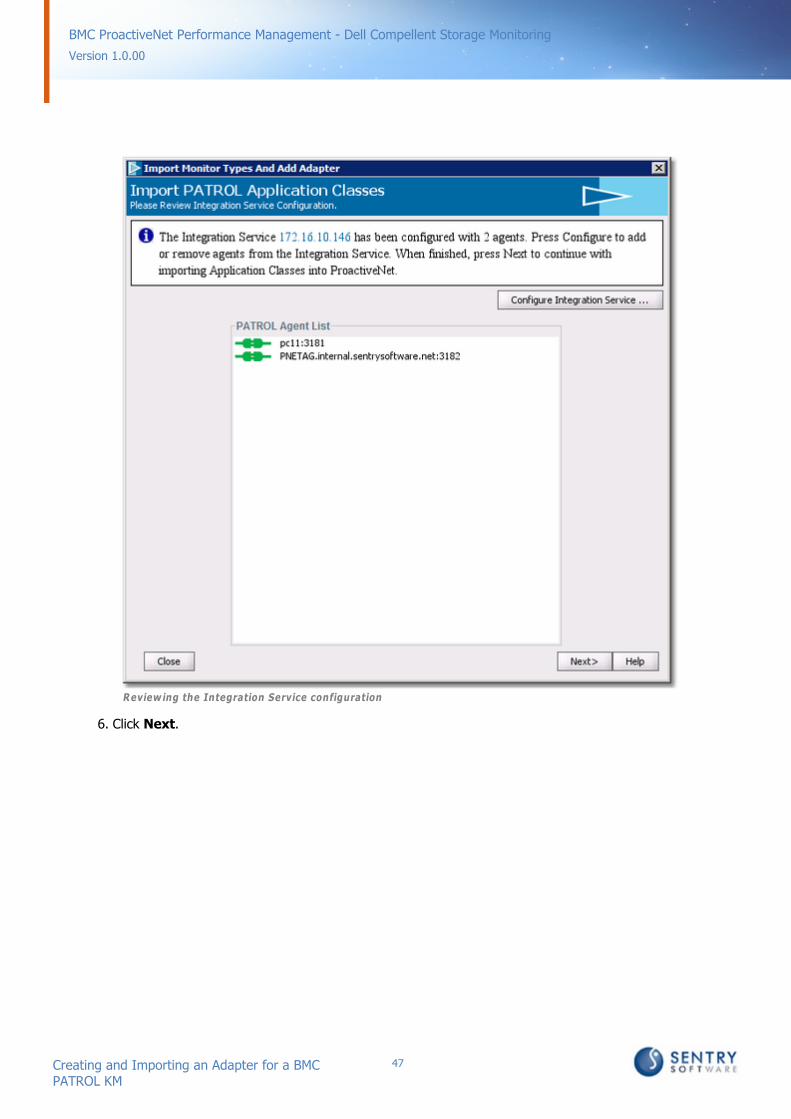
5. Click Next to continue. If you have correctly set the integrationServices variable as explainedabove, your PATROL Agents will be listed:
47Creating and Importing an Adapter for a BMCPATROL KM
Version 1.0.00
BMC ProactiveNet Performance Management - Dell Compellent Storage Monitoring
Review ing the Integration Service configuration
6. Click Next.
48Creating and Importing an Adapter for a BMCPATROL KM
Version 1.0.00
BMC ProactiveNet Performance Management - Dell Compellent Storage Monitoring
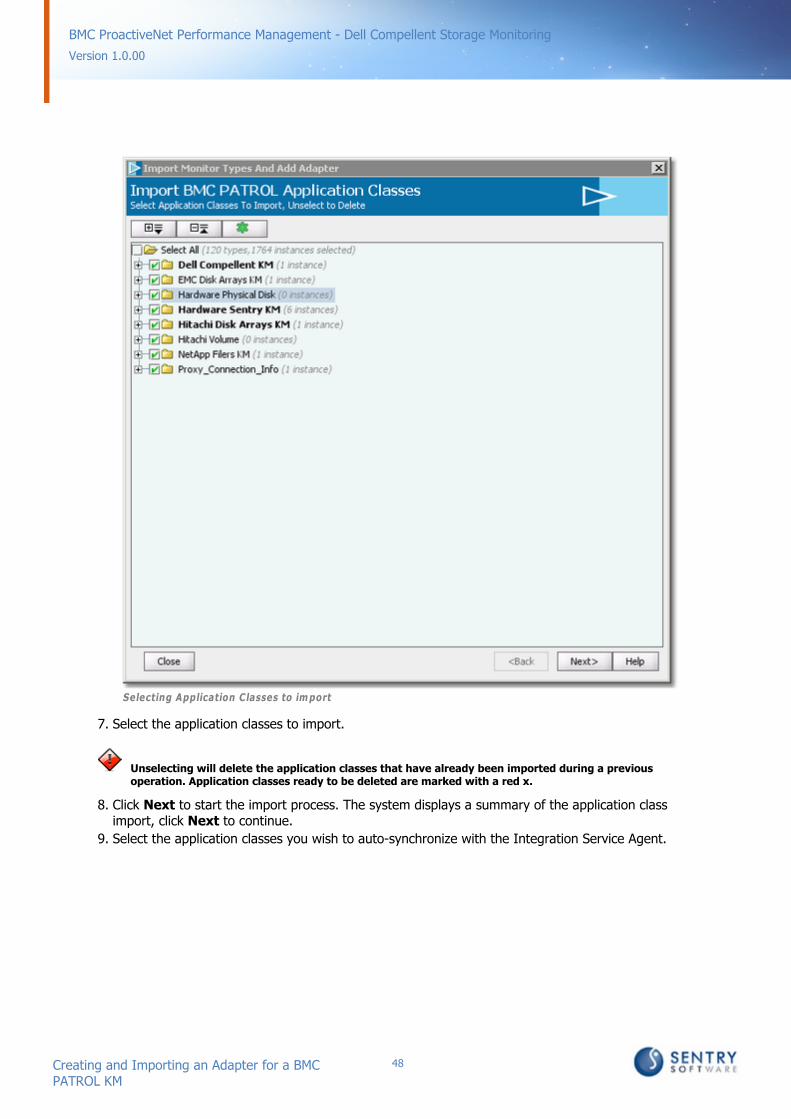
Selecting Application Classes to import
7. Select the application classes to import.
Unselecting will delete the application classes that have already been imported during a previousoperation. Application classes ready to be deleted are marked with a red x.
8. Click Next to start the import process. The system displays a summary of the application classimport, click Next to continue.
9. Select the application classes you wish to auto-synchronize with the Integration Service Agent.

49Creating and Importing an Adapter for a BMCPATROL KM
Version 1.0.00
BMC ProactiveNet Performance Management - Dell Compellent Storage Monitoring
Selecting Application Classes for Auto-sync
10. Click Next to continue
11. If needed, set the Filter details.
50Creating and Importing an Adapter for a BMCPATROL KM
Version 1.0.00
BMC ProactiveNet Performance Management - Dell Compellent Storage Monitoring
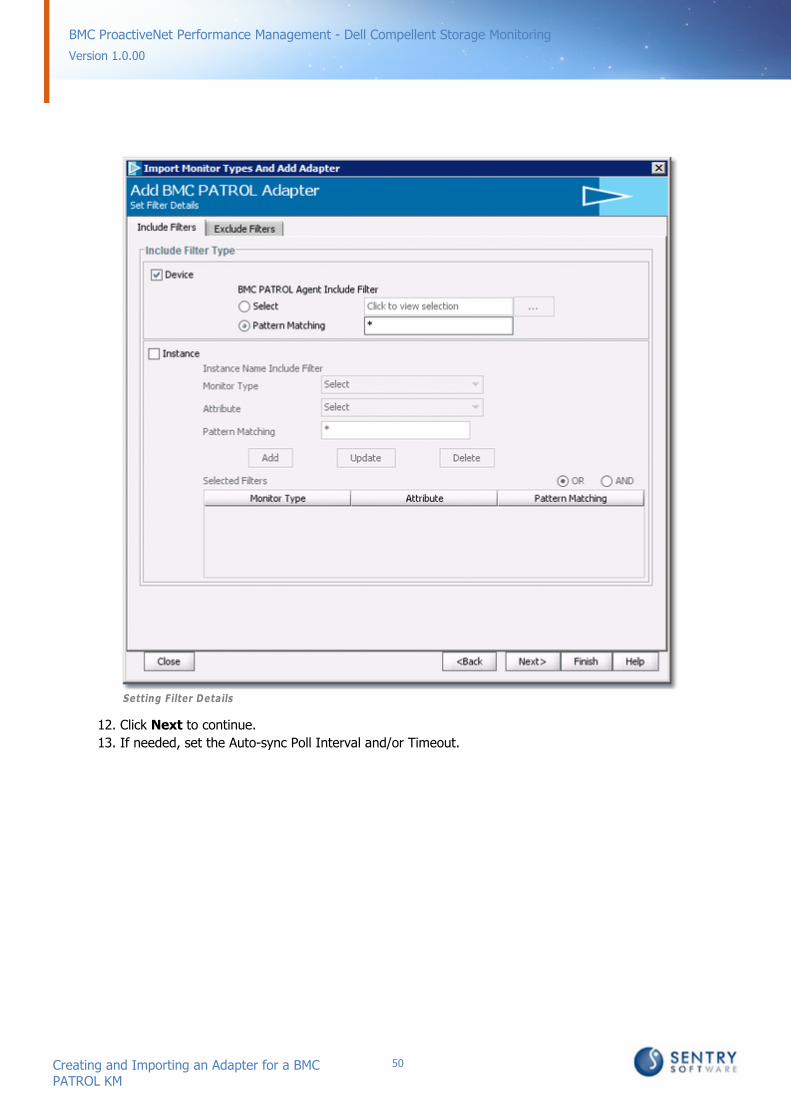
Setting Filter Details
12. Click Next to continue.
13. If needed, set the Auto-sync Poll Interval and/or Timeout.
51Creating and Importing an Adapter for a BMCPATROL KM
Version 1.0.00
BMC ProactiveNet Performance Management - Dell Compellent Storage Monitoring
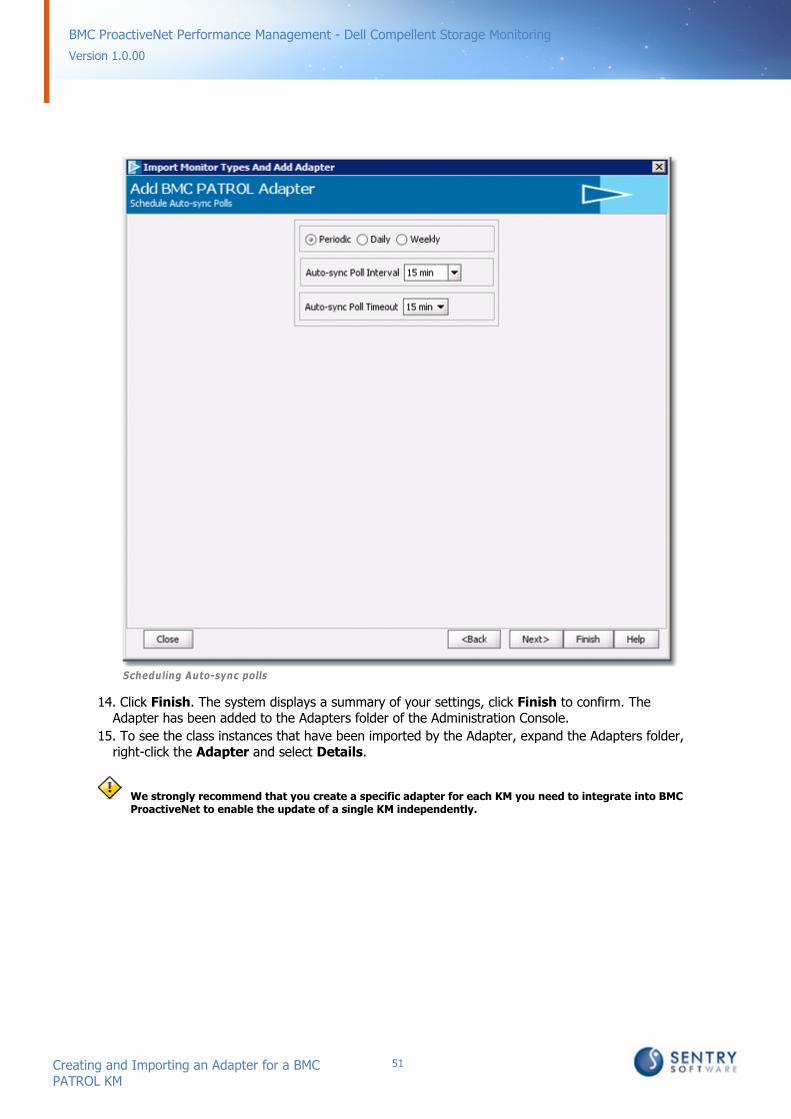
Scheduling Auto-sync polls
14. Click Finish. The system displays a summary of your settings, click Finish to confirm. TheAdapter has been added to the Adapters folder of the Administration Console.
15. To see the class instances that have been imported by the Adapter, expand the Adapters folder,right-click the Adapter and select Details.
We strongly recommend that you create a specific adapter for each KM you need to integrate into BMCProactiveNet to enable the update of a single KM independently.
52Creating and Importing an Adapter for a BMCPATROL KM
Version 1.0.00
BMC ProactiveNet Performance Management - Dell Compellent Storage Monitoring
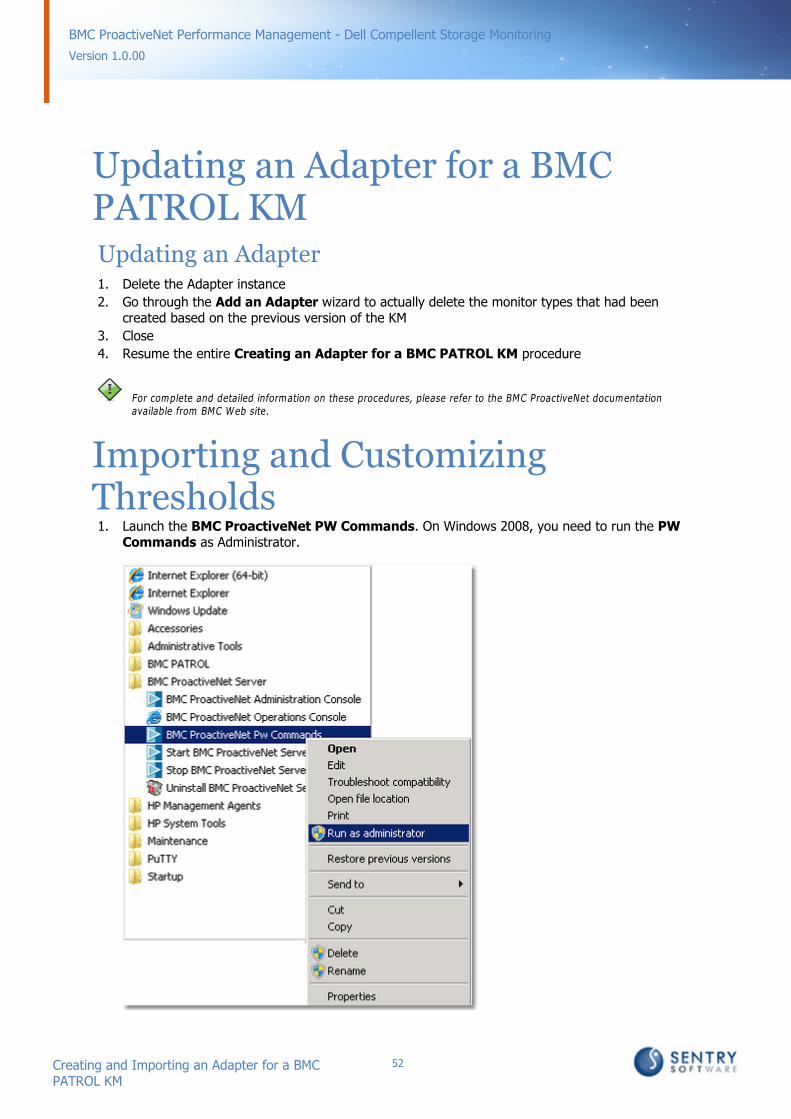
Updating an Adapter for a BMCPATROL KMUpdating an Adapter1. Delete the Adapter instance
2. Go through the Add an Adapter wizard to actually delete the monitor types that had beencreated based on the previous version of the KM
3. Close
4. Resume the entire Creating an Adapter for a BMC PATROL KM procedure
For complete and detailed information on these procedures, please refer to the BMC ProactiveNet documentationavailable from BMC Web site.
Importing and CustomizingThresholds1. Launch the BMC ProactiveNet PW Commands. On Windows 2008, you need to run the PW
Commands as Administrator.

53Importing and Customizing Thresholds
Version 1.0.00
BMC ProactiveNet Performance Management - Dell Compellent Storage Monitoring
2. Execute the following command line:pw adapter -type patrol -get_thresholds <file name> -pproxy_host <hostname|ipaddress> [-pproxy_port <port_number>] [-pproxy_user <username>] [-pproxy_passwd <password>] -i -v
where -get_thresholds <file name> = File name with absolute path at which thresholds will be imported -pproxy_host <hostname|ipaddress> = Host name or IP Address of Patrol Proxy Server -pproxy_port <port_number> = Port at which Patrol Proxy Agent communicates with Patrol Proxy Server -pproxy_user <username> = User name of Patrol Proxy user -pproxy_passwd <password> = Password to authenticate Patrol Proxy user -i -v -i = import Instance level thresholds -v = run in "verbose" mode, producing extra lines of output during extraction and conversion processes
The command has produced a text file with all the parameter threshold settings.
3. Open the file in a text editor. Check that the global thresholds have been properly interpreted.
4. Then go to the # INSTANCE LEVEL THRESHOLDS section of the file.
5. Uncomment all instance level thresholds for the _PATROL__SEN_CMPL_ prefixed instances.
Search the file for the 'NOT_IMPLEMENTED' occurrences to detect thresholds that were not properlyconverted by the PATROL Adapter.
6. Save the file.
7. Execute the following command:
pw threshold loadpatrolthreshold [<thresholdfilename> [-v]]
where: <thresholdfilename> is a thresholds file name. If no file path is specified then the default '<Installation Directory>/pw/tmp/' is used -v enables the Verbose mode
5. Check the result in the BMC ProactiveNet Operations Console. Class-level thresholds can bedisplayed using the Absolute Global Thresholds panel in the BMC ProactiveNet OperatorConsole, while instance-level thresholds are displayed in the Absolute InstanceThresholds panel:
Thresholds have been successfully imported into BMC ProactiveNet.
54Verifying the Data Collection
Version 1.0.00
BMC ProactiveNet Performance Management - Dell Compellent Storage Monitoring
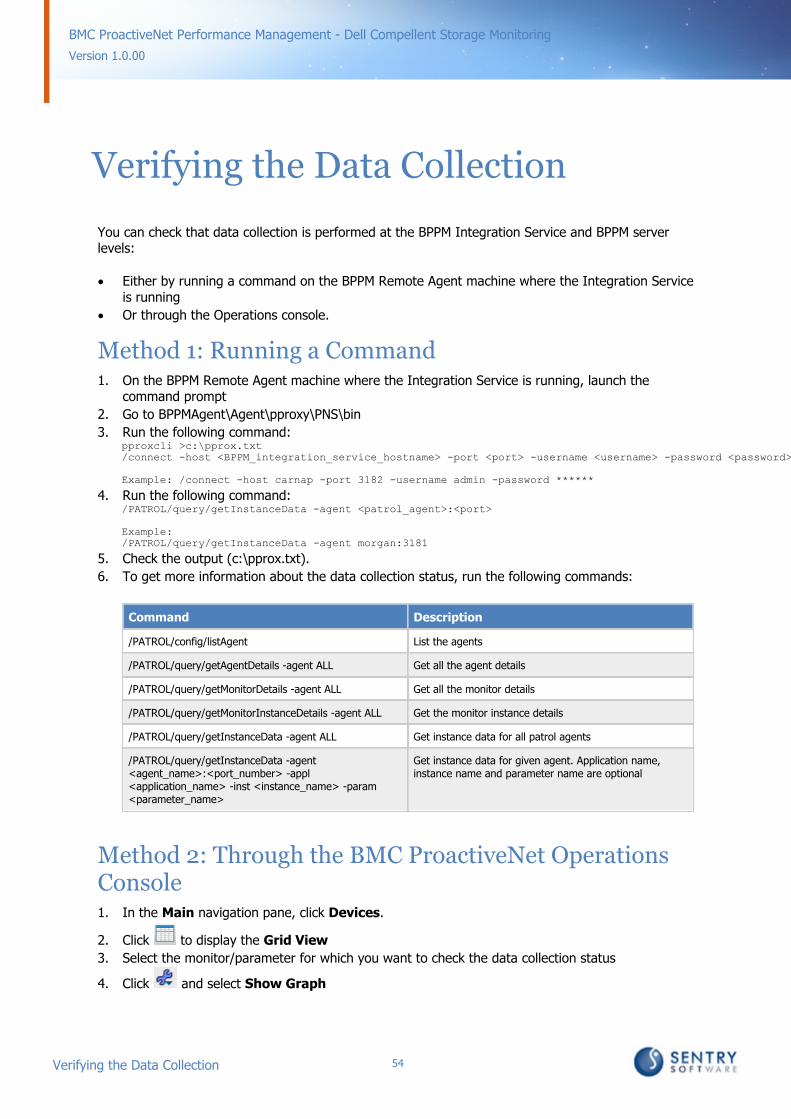
Verifying the Data Collection
You can check that data collection is performed at the BPPM Integration Service and BPPM serverlevels:
Either by running a command on the BPPM Remote Agent machine where the Integration Serviceis running
Or through the Operations console.
Method 1: Running a Command 1. On the BPPM Remote Agent machine where the Integration Service is running, launch the
command prompt
2. Go to BPPMAgent\Agent\pproxy\PNS\bin
3. Run the following command:pproxcli >c:\pprox.txt/connect -host <BPPM_integration_service_hostname> -port <port> -username <username> -password <password>
Example: /connect -host carnap -port 3182 -username admin -password ******
4. Run the following command: /PATROL/query/getInstanceData -agent <patrol_agent>:<port>
Example:/PATROL/query/getInstanceData -agent morgan:3181
5. Check the output (c:\pprox.txt).
6. To get more information about the data collection status, run the following commands:
Command Description
/PATROL/config/listAgent List the agents
/PATROL/query/getAgentDetails -agent ALL Get all the agent details
/PATROL/query/getMonitorDetails -agent ALL Get all the monitor details
/PATROL/query/getMonitorInstanceDetails -agent ALL Get the monitor instance details
/PATROL/query/getInstanceData -agent ALL Get instance data for all patrol agents
/PATROL/query/getInstanceData -agent<agent_name>:<port_number> -appl<application_name> -inst <instance_name> -param<parameter_name>
Get instance data for given agent. Application name,instance name and parameter name are optional
Method 2: Through the BMC ProactiveNet OperationsConsole1. In the Main navigation pane, click Devices.
2. Click to display the Grid View
3. Select the monitor/parameter for which you want to check the data collection status
4. Click and select Show Graph

55Verifying the Data Collection
Version 1.0.00
BMC ProactiveNet Performance Management - Dell Compellent Storage Monitoring
5. Click Export to Excel to get the list of all the data collection points between a selectedtime frame.
Managing Baselines and KeyPerformance IndicatorsIn order to facilitate the detection of abnormalities on your monitored environment, BMCProactiveNet calculates baselines per parameter (metrics or attributes) based on values collectedover a specified period of time to determine a normal operating range. When the collected values forthese parameters are out of range, an alert is triggered.
Some parameters are identified by default as Key Performance Indicators and therefore automaticallyincluded in the base lining calculation.
Managing baselines
The baseline is the expected normal operating range for a metric or attribute of a monitor.
The baseline is calculated by collecting the values for a monitor’s attributes and metrics over aspecified time period and establishing a low baseline value (consisting of the 10th percentile of all thevalues for a given time period) and a high baseline value (consisting of the 90th percentile of all thevalues for a given time period), taking a weighted average of these values over time. A higher weightis given to the latest data being factored into the baseline average. The accuracy of the baselineimproves over time.
Requirements for baseline generation
For baselines to be generated for an attribute, that abnormality threshold means that the thresholdexists and is not suppressed. Additionally, if the Key Performance Indicator (KPI) mode is active, only those attributes that have anactive abnormality threshold and are also KPI attributes will have baselines generated for them.
Absolute thresholds (with "outside baseline") or signature thresholds do not satisfy these requirements.
56Managing Baselines and Key PerformanceIndicators
Version 1.0.00
BMC ProactiveNet Performance Management - Dell Compellent Storage Monitoring
Managing Key Performance Indicators
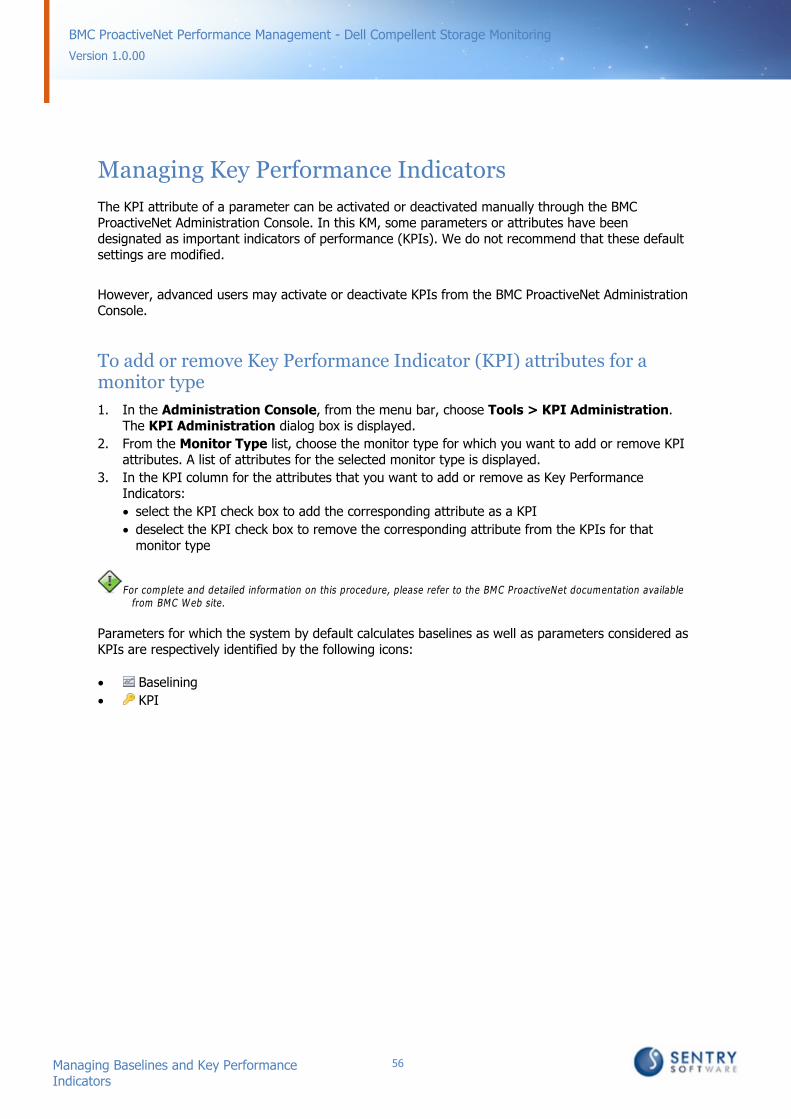
The KPI attribute of a parameter can be activated or deactivated manually through the BMCProactiveNet Administration Console. In this KM, some parameters or attributes have beendesignated as important indicators of performance (KPIs). We do not recommend that these defaultsettings are modified.
However, advanced users may activate or deactivate KPIs from the BMC ProactiveNet AdministrationConsole.
To add or remove Key Performance Indicator (KPI) attributes for amonitor type
1. In the Administration Console, from the menu bar, choose Tools > KPI Administration.The KPI Administration dialog box is displayed.
2. From the Monitor Type list, choose the monitor type for which you want to add or remove KPIattributes. A list of attributes for the selected monitor type is displayed.
3. In the KPI column for the attributes that you want to add or remove as Key PerformanceIndicators:
select the KPI check box to add the corresponding attribute as a KPI
deselect the KPI check box to remove the corresponding attribute from the KPIs for thatmonitor type
For complete and detailed information on this procedure, please refer to the BMC ProactiveNet documentation availablefrom BMC Web site.
Parameters for which the system by default calculates baselines as well as parameters considered asKPIs are respectively identified by the following icons:
Baselining
KPI
Configuring After Installation

58
Version 1.0.00
BMC ProactiveNet Performance Management - Dell Compellent Storage Monitoring
BMC ProactiveNet Performance Management - Dell Compellent Storage Monitoring is configuredwhen you create a policy. A policy is a template containing the configuration of a PATROL Agent. Apolicy can be assigned to one or more PATROL Agents using a unique tag (Central MonitoringAdministration tag), and a PATROL Agent can be assigned one or more policies with differentpriorities.
If you have not already added the Central Monitoring Administration tag to your PATROL Agentsduring the solution installation, then you must manually assign the tag after you have configured thepolicy. For details, see Adding Central Monitoring Administration Tags.
Configuring General Settings
Through the General tab of the Add Policy dialog, you can create a new policy. A policy specifies aset of actions to be taken when a specific condition on the PATROL Agent is fulfilled. First andforemost, actions include monitor configuration. Once a monitor is configured, policies can alsospecify threshold creation and the setting of baselines. A policy can also include intelligent server-sidethresholds so that IT administrators can immediately be alerted on potential problems.
Field Instructions
Name Enter a policy name. Policy names must be unique. In an environment with tenants, policy names must be unique for a single tenant
Tenant(For environments withtenants)
Select a tenant name. See Policies and tenants for details.
Global indicates a policy applicable to all tenants.
Provider indicates a policy applicable to the cloud service provider
Enable policy Select this option to enable the policy, or clear the option to disable the policy. The option isselected by default. If you clear the option, the policy and its associations remain intact, but thepolicy configuration is not applied until the policy is enabled again.
Precedence Enter a number from 0 to 999.
Description (Optional) Enter a policy description.
Tag Enter a Central Monitoring Administration tag.Policies are applied to BMC PATROL Agents with matching tags.Tags are case sensitive and cannot contain spaces or any of the following characters: /, \, {, },<, >, ‘, “, &.
Policy precedence
When more than one policy is applied to a BMC PATROL Agent and BMC ProactiveNet Child Server,configuration is a union of every attribute defined by the policies. If a conflict arises (that is, twopolicies configure the same attributes), it is resolved in one of the following ways:
Policies with the same tag: If conflicting policies have the same tag, the precedence valuedetermines the order the policies are applied. The policy with the lower number value forprecedence is the policy from which the final configuration is applied.
Policies with different tags: If conflicting policies have different tags, then the policies areapplied according to the order they are listed on the BMC PATROL Agent. The policy listed laston the agent is the policy from which the final configuration is applied.

59Configuring General Settings
Version 1.0.00
BMC ProactiveNet Performance Management - Dell Compellent Storage Monitoring
Managing PoliciesThis topic provides general instructions for the following policy management tasks: editing, deleting,enabling and disabling.
Before you begin
Enable Central Monitoring Administration and log on to Central Monitoring Administration. Refer tothe BMC documentation and more especially to the section Enabling and configuring CentralMonitoring Administration for details.
Policies with only threshold configuration or server side configuration are applicable only after a policy with monitorconfiguration is applied.
To edit a monitoring policy1. In the navigation pane of Central Monitoring Administration, click the Policies drawer and select
a policy view.
2. Select a policy and click Edit .
3. Edit the Configuring general settings of the policy.
4. Edit information on one or more of the following tabs:
Configuring monitor settings.
Configuring threshold settings.
5. Click Update.
To delete a monitoring policy
Deleting a policy deletes all monitor instances and most settings configured through the policy. Devicesremain in the User Groups to which they have been added.
1. In the navigation pane of Central Monitoring Administration, click the Policies drawer and selecta policy view.
2. Select one or more policies and click Delete .
3. Click Yes to confirm deletion.
To enable or disable a monitoring policy
Enable or disable policies for maintenance and troubleshooting. When a policy is disabled, the policyand its associations remain intact, but the policy configuration is not applied until the policy isenabled again.
1. In the navigation pane of Central Monitoring Administration, click the Policies drawer and selecta policy view.
2. Select one or more policies and click Enable or Disable.
60Configuring Monitor Settings
Version 1.0.00
BMC ProactiveNet Performance Management - Dell Compellent Storage Monitoring
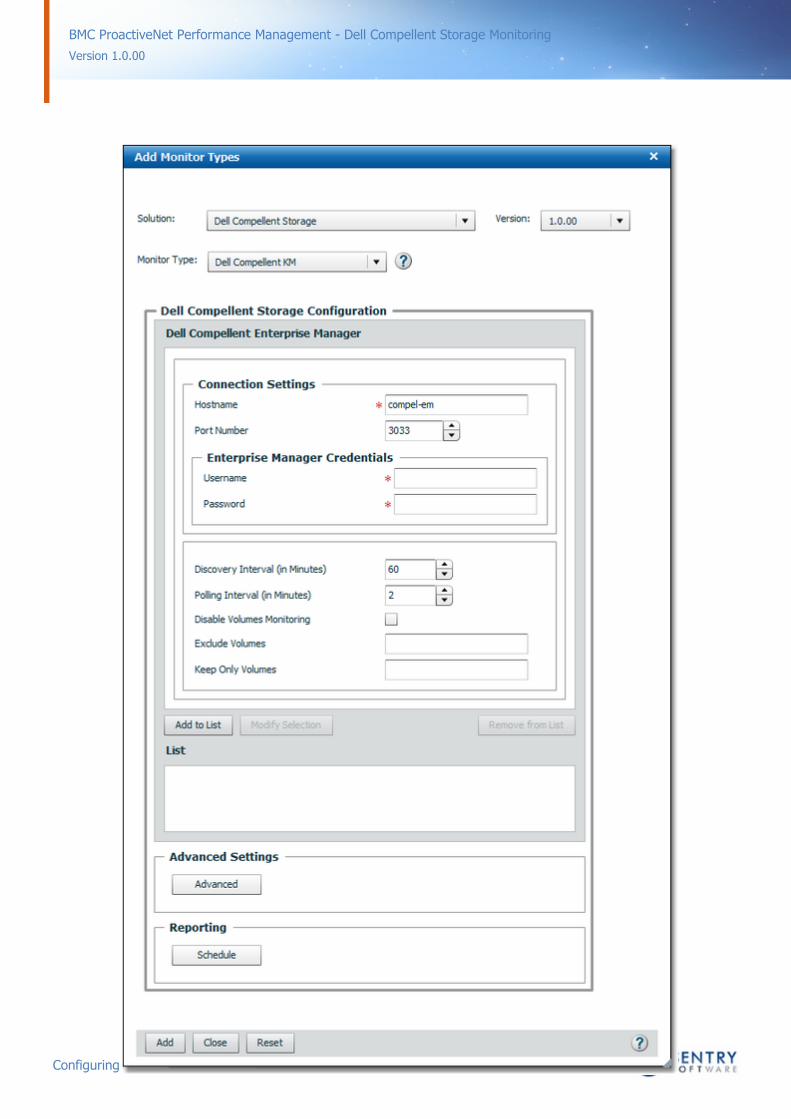
Configuring Monitor Settings
When you create or edit a policy, you can add and configure monitor types. The Add MonitorTypes dialog box presents configuration fields for compatible BMC PATROL monitoring solutions thatare located in the Central Monitoring Repository. For a list of monitoring solutions that you canconfigure through Central Monitoring Administration, see the Monitoring solutions configurablethrough Central Monitoring Administration chapter in the BPPM online documentation.
For configuration details for a specific monitor type, see the monitor documentation. To configurecustom monitoring solutions through Central Monitoring Administration, ensure the solution isstructured correctly; for details, see the Building a PATROL Knowledge Module Developers Guide onBMC Support website.
To configure the Monitor Type settings using the AddMonitor Types dialog box1. In the navigation pane of Central Monitoring Administration, click the Policies drawer and select
a policy view.
2. Click Add to display the Add Policy dialog box.
3. Click the Monitor Configuration tab.
4. Click Add.
5. From the Solution menu, select Dell Compellent Storage.
6. From the Version menu, select the required version.
7. From the Monitor Type menu, select the Monitor Type for which you want to add a policy,that is Dell Compellent KM.
8. Enter the Connection Settings to the Dell Compellent Enterprise Manager:
61Configuring Monitor Settings
Version 1.0.00
BMC ProactiveNet Performance Management - Dell Compellent Storage Monitoring

62Configuring Monitor Settings
Version 1.0.00
BMC ProactiveNet Performance Management - Dell Compellent Storage Monitoring
Hostname: Hostname of the system where the Dell Compellent Enterprise Manager is running
Port Number: By default, the Dell Compellent Enterprise Manager runs on port 3033.
Enter the Credentials that will be used to connect to the Dell Compellent Enterprise Manager.
9. Configure the monitoring settings:
Use the spin button of the Discovery Interval field to enter the frequency in minutes of thediscovery process. By default, the solution runs a discovery every 60 minutes
Use the spin button of the Polling Interval field to indicate how often new data is collected.By default, the polling interval is set to every 2 minutes.
Check the Disable Volumes Monitoring box if you want to limit the number of instancescreated and therefore reduce the system resource consumption. Discovery and collect requestsand operations will no longer be performed.
Specify the volumes to be excluded (Exclude Volumes field) or included (Keep OnlyVolumes field). If you specify a regular expression based on the volume PATROL ID, allvolumes that match with the specified regular expression will respectively be excluded orincluded.
10. Click Add to List to save the new connection to the Dell Compellent Enterprise Manager.
11. Click Add. If the monitor configuration has been successfully added, click Close.
12. Click Save to save your policy.
Enabling the Debug ModeWhen you encounter an issue and wish to report it to Sentry Software, you will be asked to enablethe Debug Mode and provide the debug output to the Sentry Software support team.
To enable the debug mode1. In the navigation pane of Central Monitoring Administration, click the Policies drawer and select
a policy view.
2. Select the policy that applies to the PATROL Agent for which you need to enable the debug
mode, and click Edit.
3. Click the Monitor Configuration tab.
4. Select the Dell Compellent KM monitor type and click Edit.
5. Click the Advanced button.

63Configuring Monitor Settings
Version 1.0.00
BMC ProactiveNet Performance Management - Dell Compellent Storage Monitoring
Enabling the Debug Mode
6. Check the Enable Debug Mode option. The solution will store debug information in a log file.By default debug files are stored in the %PATROL_HOME%\log folder
7. In the Debug End Time field, enter the date and time at which the system must stop loggingdebug information. Required format: yyyy/mm/dd hh:mm:ss.
8. Click Close to save your settings.
For the debug mode to be enabled, the Enable Debug Mode must be checked and the Debug End Time must beproperly set to a date and time in the future.
64Configuring Monitor Settings
Version 1.0.00
BMC ProactiveNet Performance Management - Dell Compellent Storage Monitoring
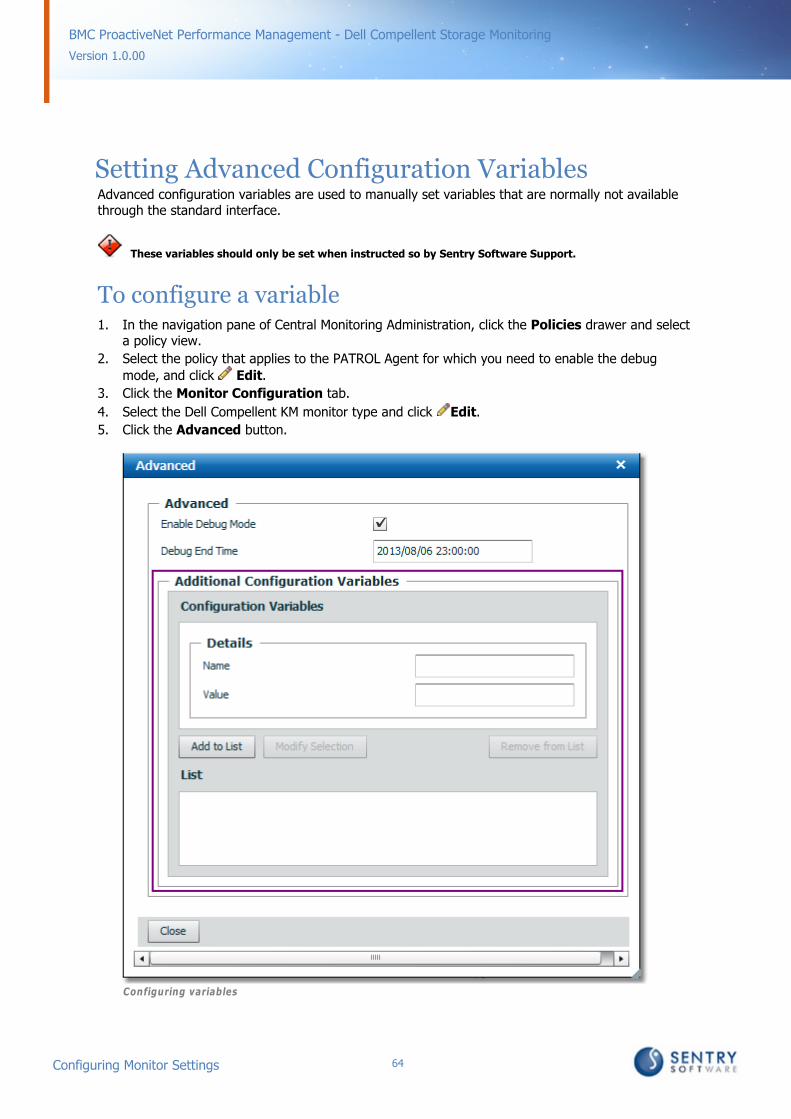
Setting Advanced Configuration VariablesAdvanced configuration variables are used to manually set variables that are normally not availablethrough the standard interface.
These variables should only be set when instructed so by Sentry Software Support.
To configure a variable1. In the navigation pane of Central Monitoring Administration, click the Policies drawer and select
a policy view.
2. Select the policy that applies to the PATROL Agent for which you need to enable the debug
mode, and click Edit.
3. Click the Monitor Configuration tab.
4. Select the Dell Compellent KM monitor type and click Edit.
5. Click the Advanced button.
Configuring variables
65Configuring Monitor Settings
Version 1.0.00
BMC ProactiveNet Performance Management - Dell Compellent Storage Monitoring
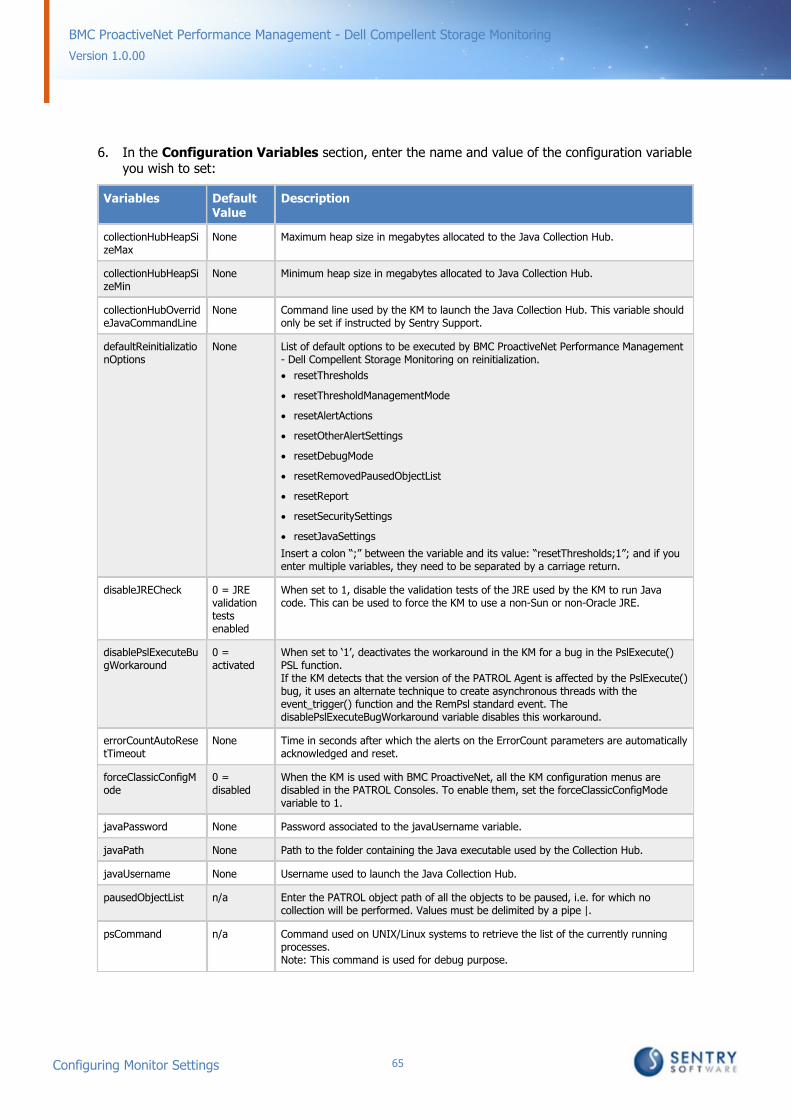
6. In the Configuration Variables section, enter the name and value of the configuration variableyou wish to set:
Variables DefaultValue
Description
collectionHubHeapSizeMax
None Maximum heap size in megabytes allocated to the Java Collection Hub.
collectionHubHeapSizeMin
None Minimum heap size in megabytes allocated to Java Collection Hub.
collectionHubOverrideJavaCommandLine
None Command line used by the KM to launch the Java Collection Hub. This variable shouldonly be set if instructed by Sentry Support.
defaultReinitializationOptions
None List of default options to be executed by BMC ProactiveNet Performance Management- Dell Compellent Storage Monitoring on reinitialization.
resetThresholds
resetThresholdManagementMode
resetAlertActions
resetOtherAlertSettings
resetDebugMode
resetRemovedPausedObjectList
resetReport
resetSecuritySettings
resetJavaSettings
Insert a colon “;” between the variable and its value: “resetThresholds;1”; and if youenter multiple variables, they need to be separated by a carriage return.
disableJRECheck 0 = JREvalidationtestsenabled
When set to 1, disable the validation tests of the JRE used by the KM to run Javacode. This can be used to force the KM to use a non-Sun or non-Oracle JRE.
disablePslExecuteBugWorkaround
0 =activated
When set to ‘1’, deactivates the workaround in the KM for a bug in the PslExecute()PSL function. If the KM detects that the version of the PATROL Agent is affected by the PslExecute()bug, it uses an alternate technique to create asynchronous threads with theevent_trigger() function and the RemPsl standard event. ThedisablePslExecuteBugWorkaround variable disables this workaround.
errorCountAutoResetTimeout
None Time in seconds after which the alerts on the ErrorCount parameters are automaticallyacknowledged and reset.
forceClassicConfigMode
0 =disabled
When the KM is used with BMC ProactiveNet, all the KM configuration menus aredisabled in the PATROL Consoles. To enable them, set the forceClassicConfigModevariable to 1.
javaPassword None Password associated to the javaUsername variable.
javaPath None Path to the folder containing the Java executable used by the Collection Hub.
javaUsername None Username used to launch the Java Collection Hub.
pausedObjectList n/a Enter the PATROL object path of all the objects to be paused, i.e. for which nocollection will be performed. Values must be delimited by a pipe |.
psCommand n/a Command used on UNIX/Linux systems to retrieve the list of the currently runningprocesses.Note: This command is used for debug purpose.
66Configuring Monitor Settings
Version 1.0.00
BMC ProactiveNet Performance Management - Dell Compellent Storage Monitoring
removedObjectList n/a Enter the PATROL object path of all the objects to be removed from the monitoringenvironment. Values must be delimited by a pipe |.
startupDelay 0 second To specify the number of seconds that Dell Compellent KM for PATROL will waitbefore starting its discovery.
7. Click Add to List.
8. Click Close to save your settings.
You can easily modify or remove a variable by selecting it in the list and clicking either the ModifySelection or the Remove from List buttons.
Scheduling Automatic ReportsBMC ProactiveNet Performance Management - Dell Compellent Storage Monitoring can automaticallyproduce text reports about the monitored storage systems.
To schedule automatic reports1. In the navigation pane of Central Monitoring Administration, click the Policies drawer and select
a policy view.
2. Select the policy that applies to the PATROL Agent for which you need to enable the debug
mode, and click Edit.
3. Click the Monitor Configuration tab.
4. Select the Dell Compellent KM monitor type and click Edit.
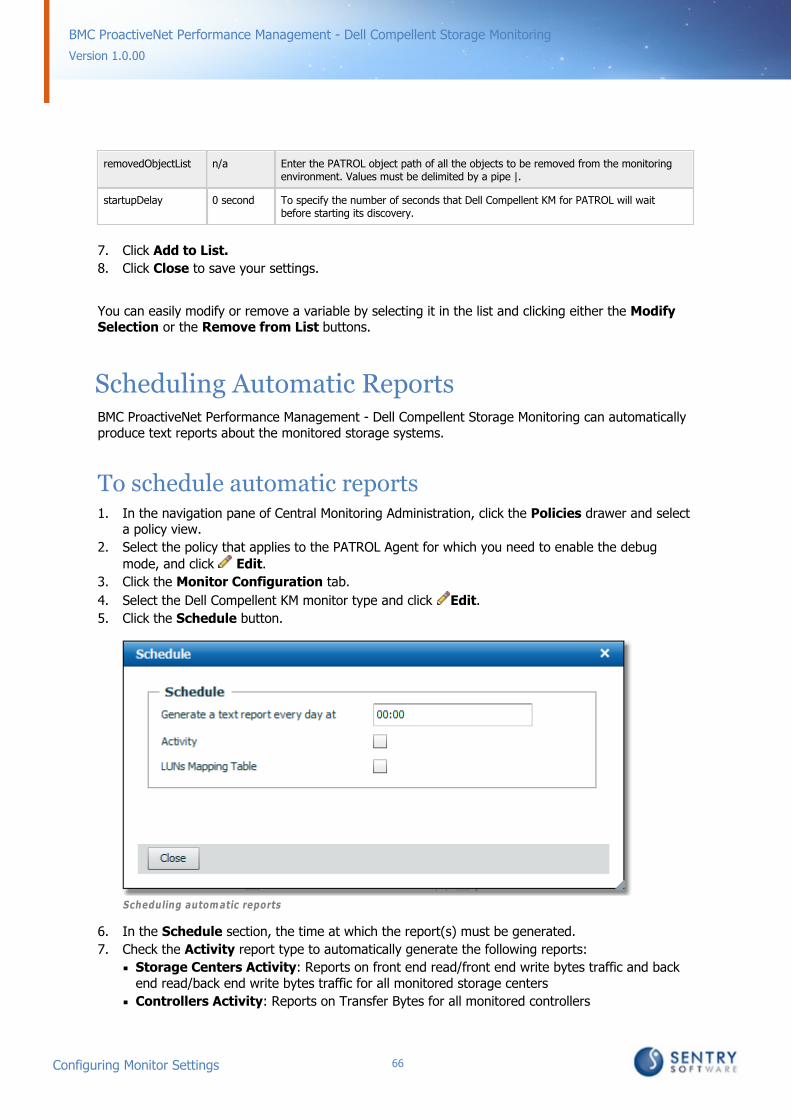
5. Click the Schedule button.
Scheduling automatic reports
6. In the Schedule section, the time at which the report(s) must be generated.
7. Check the Activity report type to automatically generate the following reports:
Storage Centers Activity: Reports on front end read/front end write bytes traffic and backend read/back end write bytes traffic for all monitored storage centers
Controllers Activity: Reports on Transfer Bytes for all monitored controllers

67Configuring Monitor Settings
Version 1.0.00
BMC ProactiveNet Performance Management - Dell Compellent Storage Monitoring
Disk Folders Activity: Reports on Read and Write Bytes for all monitored disk folders
Disks Activity: Reports on Read and Write Bytes for all monitored disks
Ports Activity: Reports on Transfer Bytes for all monitored ports
Volumes Activity: Reports on Read and Write Bytes for all monitored volumes
8. Check LUNs Mapping Table to automatically generate a text report of the LUNs-to-hostsmapping table.
9. Click Close to save your settings.
The history retention period can be set from the PATROL Console or from the PATROL Agent using a configurationvariable. The default collection (retention) period is one day. Whenever a stored parameter value exceeds its retentionperiod, it is automatically deleted from the parameter history file. Refer to BMC documentation for details.
Configuring Thresholds
Thresholds can be set from BMC ProactiveNet Central Monitoring Administration for all themonitors that have been configured with this platform. If you have not done so already, please referto the section Configuring Monitor Settings.
To add and configure monitor thresholds1. Open the Add Policy dialog box. Click for steps:
In the navigation pane of Central Monitoring Administration, click the Policies drawer andselect a policy view.
Click Add , or select an existing policy and click Edit .
2. Select the Threshold Configuration tab and click Add.
Adding a Threshold
3. In the Add Thresholds dialog box, select an item from each of the following lists: Solution,Version, and Monitor Type. Configuration fields are displayed.
4. In the Scope list, the Instance option is automatically selected. Type an Instance Name string or

68Configuring Thresholds
Version 1.0.00
BMC ProactiveNet Performance Management - Dell Compellent Storage Monitoring
regular expression to apply threshold configuration to instances with matching patterns. Select Match Device Name to include the associated device and use the entire <deviceName>\<instanceName> string for pattern matching. Instance thresholds are applied to the matchedmonitor instance names or instance names patterns.You can use the following regular expression patterns for the instance name: ?, +, *, ( ), |, [ ],{ }, ,̂ $, .If the instance name contains one of the pattern characters (except for *), use a backslash ( \ )before the pattern character. For example, to enter the instance name Storage1 (1), enterStorage1 \(1\).
5. From the Attribute list, select a monitor attribute.
In the Attribute list, some attributes are designated as key performance indicators (KPIs). Depending on the monitoredenvironment and version, the list of KPIs might appear differently in the BMC ProactiveNet Operations Console.
6. From the Type of Threshold list, select the threshold type.
7. Select and enter values for the threshold parameters.
8. To continue configuration, perform one or more of the following actions in the Add Thresholdsdialog box, and then select a different monitor type, version, or solution:
To add the configuration details for the threshold to the Threshold Configuration tab, clickthe Add button at the bottom of the window.
To return the settings in the current window to default values, click the Reset button at thebottom of the window. The values on the current window are reset. Be sure to click the Addbutton to save the configuration on the Threshold Configuration tab.
9. When you finish configuration, click Close. The configuration details are displayed in the table onthe Threshold Configuration tab.
10. When you finish configuring thresholds, click Save at the bottom of the Add Policy dialog box,or Update at the bottom of the Edit Policy dialog box.
After you save or update the policy, new threshold configurations are pushed to BMC PATROL Agentswith matching Central Monitoring Configuration tags.
To edit a threshold configuration1. On the Threshold Configuration tab, select a threshold definition, and click Edit.
2. Edit the configuration values and click Update.
3. When you finish editing the threshold configuration, click Close.
4. To save changes to the policy, click Update at the bottom of the Edit Policy dialog box.
After you update the policy, updated threshold configurations are pushed to BMC PATROL Agentswith matching Central Monitoring Configuration tags.
To delete a threshold configuration1. On the Threshold Configuration tab, select attributes, monitor types, versions, or solutions.
2. Click Delete.
3. After you delete one or more threshold configurations, click Close.
4. To save changes to the policy, click Update at the bottom of the Edit Policy dialog box.
After you update the policy, deleted threshold configurations are removed from BMC PATROL Agentswith matching Central Monitoring Configuration tags.
69Configuring Thresholds
Version 1.0.00
BMC ProactiveNet Performance Management - Dell Compellent Storage Monitoring
Recommended Thresholds
Thresholds define acceptable high and/or low values for the data collected. Thresholds can becreated as part of a policy that can be applied to multiple monitors types on multiple BMC PATROLAgents. The Reference Guide provides a list of monitor types with their respective attributes and,when meaningful, a recommended threshold.
For details about baselines and Key Performance Indicators (KPI), see BMC ProactiveNet CentralMonitoring Administration or BMC ProactiveNet documentation or refer to the "Managing Baselinesand Key Performance Indicators" section.
Using BMC ProactiveNetPerformance ManagementThis section provides a brief overview of how to navigate and use the product in the BMCProactiveNet Operations Console.
Navigating the BMC ProactiveNet Operations Console
Adding attributes to the graph
Viewing and manipulating attribute graphs
Viewing monitors for a device
Changing Thresholds
For more detailed information, see BMC ProactiveNet User Guide in the PDF product guides.
Navigating the BMC ProactiveNet OperationsConsoleThe BMC ProactiveNet Operations Console is a Web-based application that provides options tonavigate through BMC ProactiveNet and view all of the information collected and computed by theBMC ProactiveNet Server related to events, views, and graphs.
Navigation tree
The navigation tree shows an at-a-glance synopsis of events and views. Event and componentfolders are displayed hierarchically and are divided into the following categories, or nodes.
Object Definition
Global node The Global node contains the following default collectors:All Event Collectors—displays the entire event collector hierarchyAll Abnormalities—displays all the abnormality eventsAll Services—displays all the servicesAll Groups—displays all the groups

70Using BMC ProactiveNet PerformanceManagement
Version 1.0.00
BMC ProactiveNet Performance Management - Dell Compellent Storage Monitoring
Object Definition
All Devices—displays all the devicesBased on permissions, users can create event and component folders under this node to organize theevent view.
My Foldernode
Based on permissions, users can create event and component folders under this node to organize theevent view.
To further organize your display, beneath these top-level folders you can add event and componentfolders, including folders for Component Instances (CIs) associated with a service model. Your abilityto add event and component folders depends on your permissions.
The severity icons for a collector dynamically change depending on the severity level of the eventsfor that collector.
For example, if there is a Critical event on one of the devices, the green icon changes to a red icon,indicating a Critical event. The icons enable you to see the status of devices on your systemimmediately.
For complete details, see the BMC ProactiveNet Getting Started Guide on the BMC Support website.
Navigation drawers
The navigation pane in the Operations Console contains a series of drawers that enable you tonavigate through BMC ProactiveNet functions and views. You can select which drawers to display inthe navigation pane.
The following table describes the available drawers in the navigation pane and describes theirfunctions.
Drawer Description
Main Provides access to event lists and displays event information and status.
Other cells Lists available remote cells connected to the BMC ProactiveNet Server and monitored by BMCProactiveNet.
Reports Enables you to generate and manage reports based on data collected by BMC ProactiveNet.Note: You must have permission to view this drawer.
Views & graphs Provides options for the management of views and graphs in the Operations Console
Bookmarks Enables you to view, rename, and delete bookmarks of objects and their related views that youcreate in the navigation tree.
Find CI Provides a search mechanism so that you can search for Component Instances that meet thespecified search criteria.Note: You must have permission to view this drawer.

71Using BMC ProactiveNet PerformanceManagement
Version 1.0.00
BMC ProactiveNet Performance Management - Dell Compellent Storage Monitoring
Event and component folders
Event and component folders enable you to organize cells and collectors to make event displaysmeaningful for operators. For example, you might create an event folder for collectors that gatherdatabase warning events and allow only operators who are database administrators access to thatevent folder. You can drag components from one existing folder to another within the top-levelfolders in the navigation tree. You also can drag and drop CIs from the Tile or Graph view to anexisting folder in the All Services folder.
Event folders
An event folder is a grouping of collectors that shows the relationship of events or abnormalitiesthrough the hierarchy of the navigation tree. Administrators define event folders and associate themwith one or more collectors. Each level of the collector is shown as a node under the event folder. Anevent list is associated with the lowest level nodes of an event folder. The parent level of an eventfolder represents all of the events or abnormalities associated with the collectors.
Event collectors
Event collectors gather events for display in an event list to provide operators with meaningfulgroups of events or abnormalities and to show relationship through the hierarchy of the nodes in thenavigation tree. To access the event list for a collector, operators click the collector node in thenavigation tree. Event collectors are dynamic or static. Nodes for dynamic collectors appear ordisappear from the navigation tree based on whether or not events are present that meet the criteriafor those collectors. Nodes for static collectors remain in the navigation tree regardless of whetherevents are present or not.
Component folders
A component folder is a grouping of groups, services, or devices from several different event lists(collectors) that shows the relationship of groups, services, or devices through the hierarchy of thenavigation tree. Administrators define component folders and associate them with one or moregroups, services, or devices. Each level of the component folder is shown as a node under the parentcomponent folder. An event list is associated with the lowest level nodes of a component folder. Theparent level of a component folder represents all of the events associated with the groups, services,or devices. Component folders are static or dynamic. You populate static component folders byselecting from a list of objects. You populate dynamic component folders by creating a query. Staticfolders always contain only the objects that you manually select. Dynamic folders contain the objectsthat match the query, so the contents of these folders can change without further editing.
Operations Console views
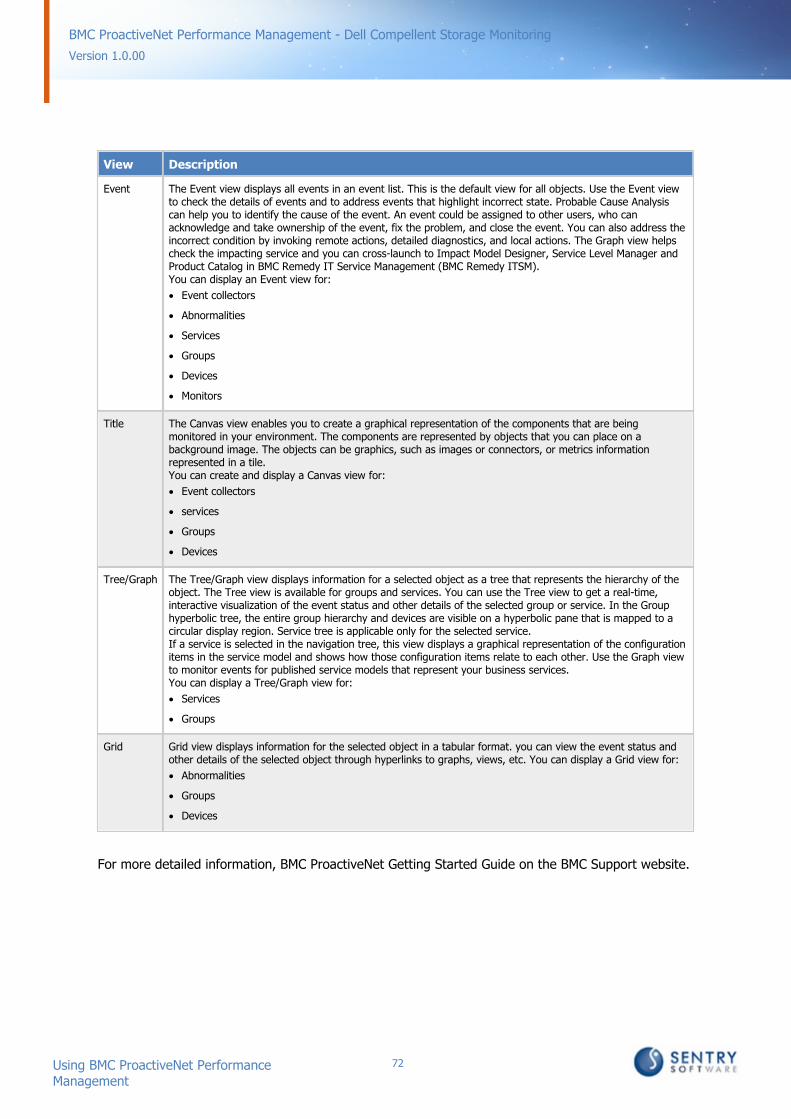
The following table shows the different views that are available, depending on what object you selectin the navigation tree. Each view is accessed by clicking the associated Console view icon. If a view isnot available for the object that is selected in the navigation tree, the icon for that view is notdisplayed in the toolbar.
72Using BMC ProactiveNet PerformanceManagement
Version 1.0.00
BMC ProactiveNet Performance Management - Dell Compellent Storage Monitoring
View Description
Event The Event view displays all events in an event list. This is the default view for all objects. Use the Event viewto check the details of events and to address events that highlight incorrect state. Probable Cause Analysiscan help you to identify the cause of the event. An event could be assigned to other users, who canacknowledge and take ownership of the event, fix the problem, and close the event. You can also address theincorrect condition by invoking remote actions, detailed diagnostics, and local actions. The Graph view helpscheck the impacting service and you can cross-launch to Impact Model Designer, Service Level Manager andProduct Catalog in BMC Remedy IT Service Management (BMC Remedy ITSM).You can display an Event view for:
Event collectors
Abnormalities
Services
Groups
Devices
Monitors
Title The Canvas view enables you to create a graphical representation of the components that are beingmonitored in your environment. The components are represented by objects that you can place on abackground image. The objects can be graphics, such as images or connectors, or metrics informationrepresented in a tile.You can create and display a Canvas view for:
Event collectors
services
Groups
Devices
Tree/Graph The Tree/Graph view displays information for a selected object as a tree that represents the hierarchy of theobject. The Tree view is available for groups and services. You can use the Tree view to get a real-time,interactive visualization of the event status and other details of the selected group or service. In the Grouphyperbolic tree, the entire group hierarchy and devices are visible on a hyperbolic pane that is mapped to acircular display region. Service tree is applicable only for the selected service.If a service is selected in the navigation tree, this view displays a graphical representation of the configurationitems in the service model and shows how those configuration items relate to each other. Use the Graph viewto monitor events for published service models that represent your business services.You can display a Tree/Graph view for:
Services
Groups
Grid Grid view displays information for the selected object in a tabular format. you can view the event status andother details of the selected object through hyperlinks to graphs, views, etc. You can display a Grid view for:
Abnormalities
Groups
Devices
For more detailed information, BMC ProactiveNet Getting Started Guide on the BMC Support website.

73Using BMC ProactiveNet PerformanceManagement
Version 1.0.00
BMC ProactiveNet Performance Management - Dell Compellent Storage Monitoring
Adding attributes to the graphFollowing configuration, only one attribute is enabled for the graph of each monitor. You might wantto add additional attributes to the monitor graph.
1. In the BMC ProactiveNet Operations console, select the Navigation drawer.
2. Select Global > Devices.
3. Select the Grid view.All the monitored devices are displayed in table format.
4. Select a device from the displayed table.
5. Select a monitor.
6. Click Tools >Show Graph
7. Select the Attributes & Indicators tab.
8. Select one or more attributes.Up to 12 attributes of a monitor can be displayed on a single graph. Though only two units ofmeasurement can be used.
Viewing and manipulating attribute graphsThe graph provides a visual display of the attributes of a monitor. Up to 12 attributes of a monitorcan be displayed on a single graph.
1. In the BMC ProactiveNet Operations console, select the Navigation drawer.
2. Select Global > Devices.
3. Select the Grid view. All the monitored devices are displayed in table format.
4. Select a device from the table.
5. Select a monitor.
6. Click Tools > Show Graph
If Collect Data is not enabled then no data is available.
The Graph Display window opens, displaying a graph displaying the values of the selected attributesfor this monitor.You can use the options available on this tab to manipulate the graph. For complete details, refer toBMC ProactiveNet User Guide on the BMC Support website.
Viewing monitors for a deviceThis section provides a brief overview of how to view the monitors for a selected device. Forcomplete details, refer to BMC ProactiveNet User Guide on the BMC Support website.
To view the Monitor types for a device1. In the BMC ProactiveNet Operations console, select the Navigation drawer.
2. Select Global > Devices.
3. Select the Grid view. All the monitored devices are displayed in table format.
4. Select a device from the table. A hierarchical tree listing the monitors for that device is displayed.
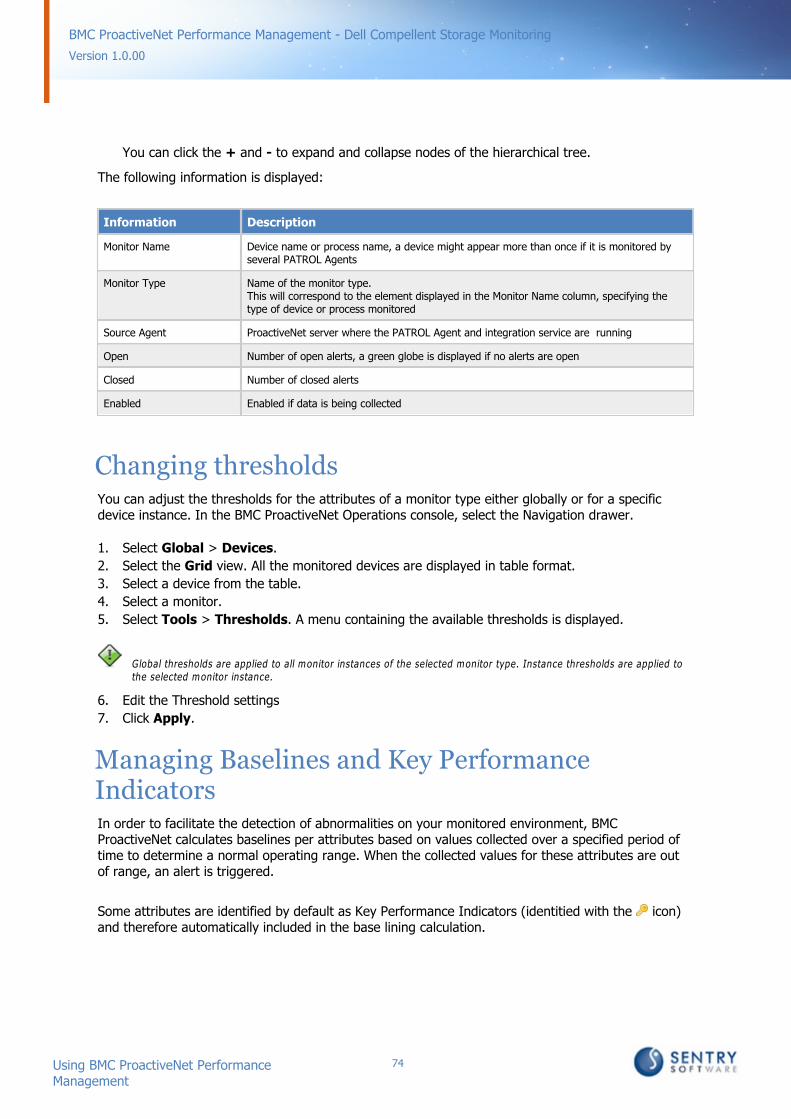
74Using BMC ProactiveNet PerformanceManagement
Version 1.0.00
BMC ProactiveNet Performance Management - Dell Compellent Storage Monitoring
You can click the + and - to expand and collapse nodes of the hierarchical tree.
The following information is displayed:
Information Description
Monitor Name Device name or process name, a device might appear more than once if it is monitored byseveral PATROL Agents
Monitor Type Name of the monitor type.This will correspond to the element displayed in the Monitor Name column, specifying thetype of device or process monitored
Source Agent ProactiveNet server where the PATROL Agent and integration service are running
Open Number of open alerts, a green globe is displayed if no alerts are open
Closed Number of closed alerts
Enabled Enabled if data is being collected
Changing thresholdsYou can adjust the thresholds for the attributes of a monitor type either globally or for a specificdevice instance. In the BMC ProactiveNet Operations console, select the Navigation drawer.
1. Select Global > Devices.
2. Select the Grid view. All the monitored devices are displayed in table format.
3. Select a device from the table.
4. Select a monitor.
5. Select Tools > Thresholds. A menu containing the available thresholds is displayed.
Global thresholds are applied to all monitor instances of the selected monitor type. Instance thresholds are applied tothe selected monitor instance.
6. Edit the Threshold settings
7. Click Apply.
Managing Baselines and Key PerformanceIndicatorsIn order to facilitate the detection of abnormalities on your monitored environment, BMCProactiveNet calculates baselines per attributes based on values collected over a specified period oftime to determine a normal operating range. When the collected values for these attributes are outof range, an alert is triggered.
Some attributes are identified by default as Key Performance Indicators (identitied with the icon)and therefore automatically included in the base lining calculation.

75Using BMC ProactiveNet PerformanceManagement
Version 1.0.00
BMC ProactiveNet Performance Management - Dell Compellent Storage Monitoring
Managing baselines
The baseline is the expected normal operating range for a metric or attribute of a monitor.
The baseline is calculated by collecting the values for a monitor’s attributes and metrics over aspecified time period and establishing a low baseline value (consisting of the 10th percentile of all thevalues for a given time period) and a high baseline value (consisting of the 90th percentile of all thevalues for a given time period), taking a weighted average of these values over time. A higher weightis given to the latest data being factored into the baseline average. The accuracy of the baselineimproves over time.
Requirements for baseline generation
For baselines to be generated for an attribute, that abnormality threshold means that the thresholdexists and is not suppressed. Additionally, if the Key Performance Indicator (KPI) mode is active, only those attributes that have anactive abnormality threshold and are also KPI attributes will have baselines generated for them.
Absolute thresholds (with "outside baseline") or signature thresholds do not satisfy these requirements.
Managing Key Performance Indicators
The KPI attribute of an attribute can be activated or deactivated manually through the BMCProactiveNet Administration Console. In this KM, some attributes have been designated as importantindicators of performance (KPIs). We do not recommend that these default settings are modified.
However, advanced users may activate or deactivate KPIs from the BMC ProactiveNet AdministrationConsole.
To add or remove Key Performance Indicator (KPI) attributes for amonitor type
1. In the Administration Console, from the menu bar, choose Tools > KPI Administration.The KPI Administration dialog box is displayed.
2. From the Monitor Type list, choose the monitor type for which you want to add or remove KPIattributes. A list of attributes for the selected monitor type is displayed.
3. In the KPI column for the attributes that you want to add or remove as Key PerformanceIndicators:
select the KPI check box to add the corresponding attribute as a KPI
deselect the KPI check box to remove the corresponding attribute from the KPIs for thatmonitor type
For complete and detailed information on this procedure, please refer to the BMC ProactiveNet documentation availablefrom BMC Web site.
Reference Guide
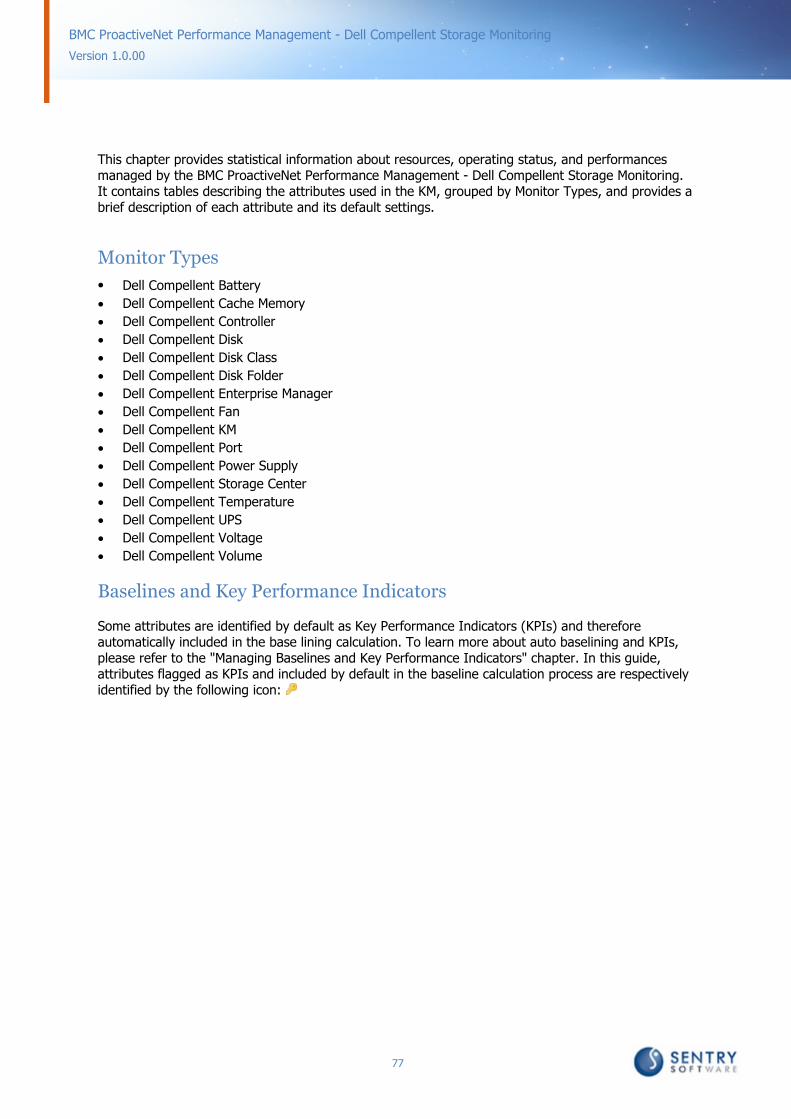
77
Version 1.0.00
BMC ProactiveNet Performance Management - Dell Compellent Storage Monitoring
This chapter provides statistical information about resources, operating status, and performancesmanaged by the BMC ProactiveNet Performance Management - Dell Compellent Storage Monitoring.It contains tables describing the attributes used in the KM, grouped by Monitor Types, and provides abrief description of each attribute and its default settings.
Monitor Types
Dell Compellent Battery
Dell Compellent Cache Memory
Dell Compellent Controller
Dell Compellent Disk
Dell Compellent Disk Class
Dell Compellent Disk Folder
Dell Compellent Enterprise Manager
Dell Compellent Fan
Dell Compellent KM
Dell Compellent Port
Dell Compellent Power Supply
Dell Compellent Storage Center
Dell Compellent Temperature
Dell Compellent UPS
Dell Compellent Voltage
Dell Compellent Volume
Baselines and Key Performance Indicators
Some attributes are identified by default as Key Performance Indicators (KPIs) and thereforeautomatically included in the base lining calculation. To learn more about auto baselining and KPIs,please refer to the "Managing Baselines and Key Performance Indicators" chapter. In this guide,attributes flagged as KPIs and included by default in the baseline calculation process are respectivelyidentified by the following icon:
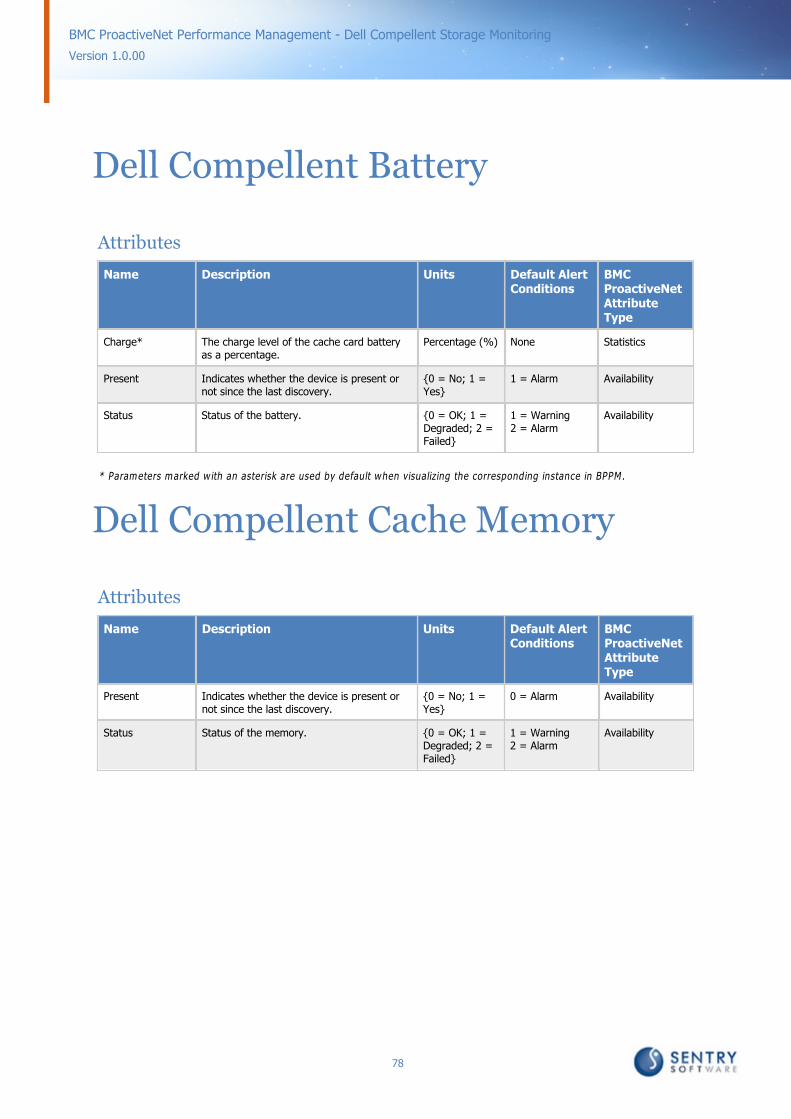
78
Version 1.0.00
BMC ProactiveNet Performance Management - Dell Compellent Storage Monitoring
Dell Compellent Battery
Attributes
Name Description Units Default AlertConditions
BMCProactiveNetAttributeType
Charge* The charge level of the cache card batteryas a percentage.
Percentage (%) None Statistics
Present Indicates whether the device is present ornot since the last discovery.
{0 = No; 1 =Yes}
1 = Alarm Availability
Status Status of the battery. {0 = OK; 1 =Degraded; 2 =Failed}
1 = Warning2 = Alarm
Availability
* Parameters marked with an asterisk are used by default when visualizing the corresponding instance in BPPM.
Dell Compellent Cache Memory
Attributes
Name Description Units Default AlertConditions
BMCProactiveNetAttributeType
Present Indicates whether the device is present ornot since the last discovery.
{0 = No; 1 =Yes}
0 = Alarm Availability
Status Status of the memory. {0 = OK; 1 =Degraded; 2 =Failed}
1 = Warning2 = Alarm
Availability

79Dell Compellent Cache Memory
Version 1.0.00
BMC ProactiveNet Performance Management - Dell Compellent Storage Monitoring
Dell Compellent Controller
Attributes
Name Description Units Default AlertConditions
BMCProactiveNetAttributeType
ConsumedMemoryPercentage*
Percentage of used memory. Percentage (%) Warning ≥ 80%Alarm ≥ 90%
Statistics
ProcessorUtilization*
Utilization percentage of processor time. Percentage (%) Warning ≥ 80%Alarm ≥ 90%
Statistics
Read Byte Rate Read data traffic through the controller. Megabytes perseconds (MB/s)
None Statistics
Read Bytes Amount of data read by the controller sincethe last collect.
Megabytes perseconds (MB/s)
None Statistics
Read OperationRate
Rate of read operations through thecontroller.
Operations/s None Statistics
Read ResponseTime
Average time taken by the controller tocomplete read operations during the pollingperiod.
Milliseconds(ms)
Warning ≥ 30 msAlarm ≥ 100 ms
Response Time
Response Time Average time taken by the controller tocomplete read and write operations duringthe polling period.
Milliseconds(ms)
Warning ≥ 30 msAlarm ≥ 100 ms
Response Time
Status Status of the controller. {0 = OK; 1 =Degraded; 2 =Failed}
1 = Warning2 = Alarm
Availability
Transfer Byte
Rate
Read and written data traffic. Megabytes perseconds (MB/s)
None Statistics
Transfer Bytes Amount of read and written data since thelast collect.
Gigabytes (GB) None Statistics
Write Byte Rate Amount of read and written data since thelast collect.
Megabytes perseconds (MB/s)
None Statistics
Write Bytes Amount of data written by the controllersince the last collect.
Gigabytes (GB) None Statistics
Write OperationRate
Rate of write operations through thecontroller.
Operations/s None Statistics
Write ResponseTime
Average time taken by the controller tocomplete write operations during the pollingperiod.
Milliseconds(ms)
Warning ≥ 30 msAlarm ≥ 100 ms
Response Time
For detailed information about KPI, see Managing Baselines and Key Performance Indicators.
* Parameters marked with an asterisk are used by default when visualizing the corresponding instance in BPPM.

80Dell Compellent Controller
Version 1.0.00
BMC ProactiveNet Performance Management - Dell Compellent Storage Monitoring
Dell Compellent Disk
Attributes
Name Description Units Default AlertConditions
BMCProactiveNetAttributeType
Present Indicates whether the device is present ornot since the last discovery.
{0 = No; 1 =Yes}
0 = Alarm Availability
Read Byte Rate Data traffic read on the disk. Megabytes perseconds (MB/s)
None Statistics
Read Bytes Amount of data read on the disk since thelast collect.
Gigabytes (GB) None Statistics
Read Error Count Number of read errors on the disk. errors None Statistics
Read OperationRate
Rate of read operations on the disk. operations/s None Statistics
Read ResponseTime
Average time taken by the disk to completeread operations during the polling period.
Milliseconds(ms)
Warning ≥ 30 msAlarm ≥ 100 ms
Response Time
Response Time* Average time taken by the disk to completeread and write operations during the pollingperiod.
Milliseconds(ms)
Warning ≥ 30 msAlarm ≥ 100 ms
Response Time
Status Status of the disk (combination of the diskstatus and the disk health).
{0 = OK; 1 =Degraded; 2 =Failed}
1 = Warning2 = Alarm
Availability
Transfer Byte Rate*
Read and written data traffic. Megabytes perseconds (MB/s)
None Statistics
Transfer Bytes Amount of read and written data since thelast collect (front end).
Gigabytes (GB) None Statistics
Write Byte Rate Data traffic written on the disk. Megabytes perseconds (MB/s)
None Statistics
Write Bytes Amount of data written on the disk sincethe last collect.
Gigabytes (GB) None Statistics
Write Error Count Number of write errors on the disk. Errors None Statistics
Write OperationRate
Rate of write operations on the disk. Operations/s None Statistics
Write ResponseTime
Average time taken by the disk to completewrite operations during the polling period.
Milliseconds(ms)
Warning ≥ 30 msAlarm ≥ 100 ms
Response Time
For detailed information about KPI, see Managing Baselines and Key Performance Indicators.
* Parameters marked with an asterisk are used by default when visualizing the corresponding instance in BPPM.
81Dell Compellent Disk Class
Version 1.0.00
BMC ProactiveNet Performance Management - Dell Compellent Storage Monitoring
Dell Compellent Disk Class
Attributes
Name Description Units Default AlertConditions
BMCProactiveNetAttributeType
Spare Disk Count Number of spare disks in the disk class. Disks None Statistics
Total Size Total space of all the disks in the disk class. Terabytes (TB) None Statistics
Unhealthy DiskCount
Number of unhealthy disks in the disk class. disks None Statistics
For detailed information about KPI, see Managing Baselines and Key Performance Indicators.
Dell Compellent Disk Folder
Attributes
Name Description Units Default AlertConditions
BMCProactiveNetAttributeType
ConsumedCapacity Percentage*
Percentage of space actually consumed inthe disk folder.
Percentage (%) Warning ≥ 80%Alarm ≥ 90%
Statistics
ConsumedCapacity
Space actually consumed in the disk folder. Terabytes (TB) None Statistics
OversubscriptionSituation**
This metric reports an oversubscriptionsituation, that is when:1.The storage pool is configured for thinprovisioning (“thin storage pool”)2.The storage pool is oversubscribed, i.e.the total disk space visible to the hosts(subscribers) is greater than its actualcapacity (this situation is normal for a thinpool since it is its very purpose)3.The storage pool actual consumedcapacity is nearing 100%Such situation is highly critical because theinability to allocate additional space to aLUN when requested by the subscriber hostwill lead to catastrophic data loss andcorruption.
{0 = No; 1 =Yes}
1 = AlarmAn alarm istriggered whentheoversubscriptionconditions aremet.
Availability
Read Byte Rate Data traffic read on the disk folder. Megabytes perseconds (MB/s)
None Statistics
Read Bytes Amount of data read on the disk folder sincethe last collect.
Gigabytes (GB) None Statistics
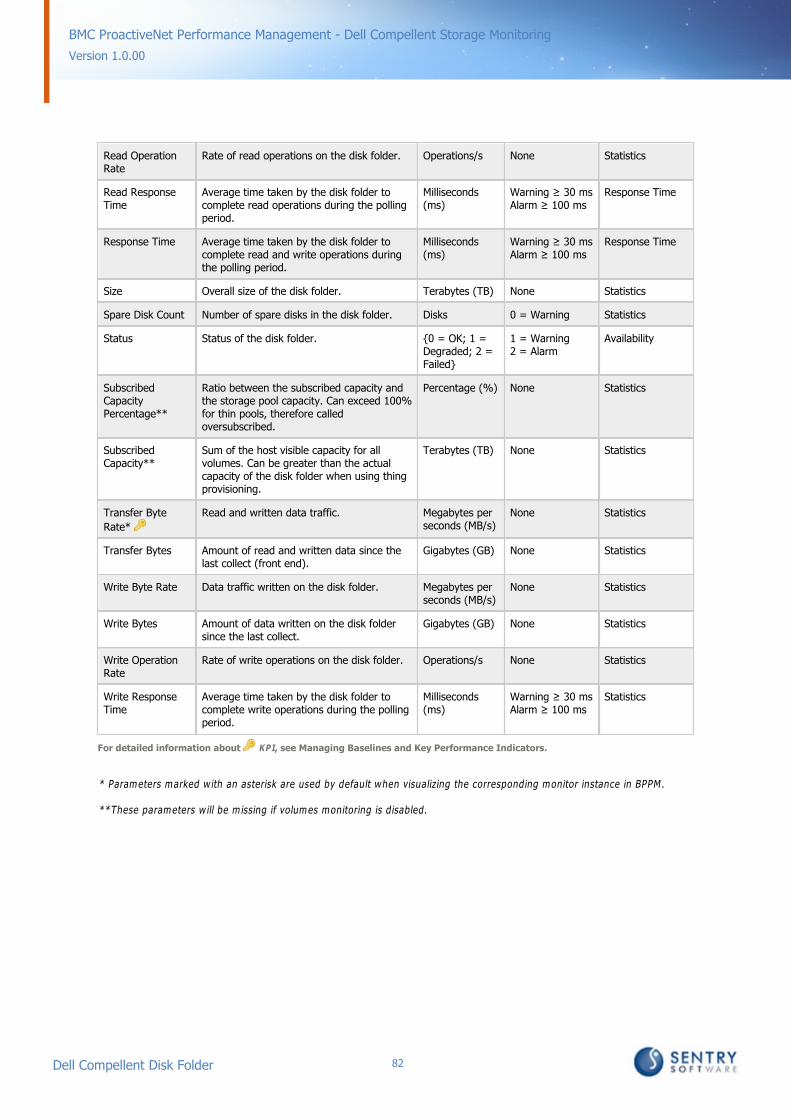
82Dell Compellent Disk Folder
Version 1.0.00
BMC ProactiveNet Performance Management - Dell Compellent Storage Monitoring
Read OperationRate
Rate of read operations on the disk folder. Operations/s None Statistics
Read ResponseTime
Average time taken by the disk folder tocomplete read operations during the pollingperiod.
Milliseconds(ms)
Warning ≥ 30 msAlarm ≥ 100 ms
Response Time
Response Time Average time taken by the disk folder tocomplete read and write operations duringthe polling period.
Milliseconds(ms)
Warning ≥ 30 msAlarm ≥ 100 ms
Response Time
Size Overall size of the disk folder. Terabytes (TB) None Statistics
Spare Disk Count Number of spare disks in the disk folder. Disks 0 = Warning Statistics
Status Status of the disk folder. {0 = OK; 1 =Degraded; 2 =Failed}
1 = Warning2 = Alarm
Availability
SubscribedCapacityPercentage**
Ratio between the subscribed capacity andthe storage pool capacity. Can exceed 100%for thin pools, therefore calledoversubscribed.
Percentage (%) None Statistics
SubscribedCapacity**
Sum of the host visible capacity for allvolumes. Can be greater than the actualcapacity of the disk folder when using thingprovisioning.
Terabytes (TB) None Statistics
Transfer Byte
Rate*
Read and written data traffic. Megabytes perseconds (MB/s)
None Statistics
Transfer Bytes Amount of read and written data since thelast collect (front end).
Gigabytes (GB) None Statistics
Write Byte Rate Data traffic written on the disk folder. Megabytes perseconds (MB/s)
None Statistics
Write Bytes Amount of data written on the disk foldersince the last collect.
Gigabytes (GB) None Statistics
Write OperationRate
Rate of write operations on the disk folder. Operations/s None Statistics
Write ResponseTime
Average time taken by the disk folder tocomplete write operations during the pollingperiod.
Milliseconds(ms)
Warning ≥ 30 msAlarm ≥ 100 ms
Statistics
For detailed information about KPI, see Managing Baselines and Key Performance Indicators.
* Parameters marked with an asterisk are used by default when visualizing the corresponding monitor instance in BPPM.
**These parameters will be missing if volumes monitoring is disabled.
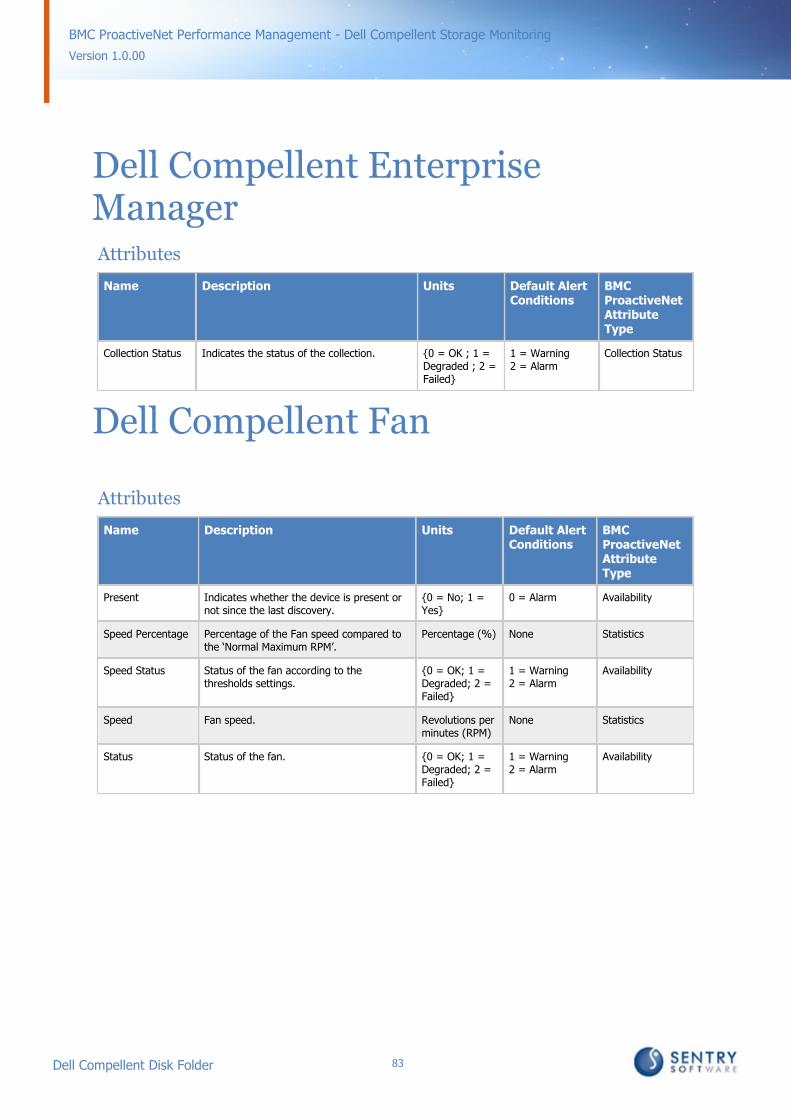
83Dell Compellent Disk Folder
Version 1.0.00
BMC ProactiveNet Performance Management - Dell Compellent Storage Monitoring
Dell Compellent EnterpriseManagerAttributes
Name Description Units Default AlertConditions
BMCProactiveNetAttributeType
Collection Status Indicates the status of the collection. {0 = OK ; 1 =Degraded ; 2 =Failed}
1 = Warning2 = Alarm
Collection Status
Dell Compellent Fan
Attributes
Name Description Units Default AlertConditions
BMCProactiveNetAttributeType
Present Indicates whether the device is present ornot since the last discovery.
{0 = No; 1 =Yes}
0 = Alarm Availability
Speed Percentage Percentage of the Fan speed compared tothe ‘Normal Maximum RPM’.
Percentage (%) None Statistics
Speed Status Status of the fan according to thethresholds settings.
{0 = OK; 1 =Degraded; 2 =Failed}
1 = Warning2 = Alarm
Availability
Speed Fan speed. Revolutions perminutes (RPM)
None Statistics
Status Status of the fan. {0 = OK; 1 =Degraded; 2 =Failed}
1 = Warning2 = Alarm
Availability

84Dell Compellent Fan
Version 1.0.00
BMC ProactiveNet Performance Management - Dell Compellent Storage Monitoring
Dell Compellent KM
Attributes
Name Description Units Default AlertConditions
BMCProactiveNetAttributeType
Collection Status Indicates the status of the collection. {0 = OK ; 1 =Degraded ; 2 =Failed}
1 = Warning2 = Alarm
Collection Status
Dell Compellent Port
Attributes
Name Description Units Default AlertConditions
BMCProactiveNetAttributeType
Present Indicates whether the device is present ornot since the last discovery.
{0 = No; 1 =Yes}
0 = Alarm Availability
Received ByteRate
Amount of bytes received by seconds. Megabytes perseconds (MB/s)
n/a Statistics
Received Bytes Amount of received bytes. Gigabytes (GB) n/a Statistics
ReceivedOperation Rate
Amount of operations received by seconds. Operations/s n/a Statistics
ReceivedResponse Time
Received network traffic latency. Milliseconds(ms)
Warning ≥ 30 msAlarm ≥ 100 ms
Response Time
Response Time Average time taken to write/read data. Milliseconds(ms)
Warning ≥ 30 msAlarm ≥ 100 ms
Response Time
Sent Byte Rate Amount of bytes sent by seconds. Megabytes perseconds (MB/s)
n/a Statistics
Sent OperationRate
Amount of operations sent by seconds. Operations/s n/a Statistics
Sent ResponseTime
Sent network traffic latency. Milliseconds(ms)
Warning ≥ 30 msAlarm ≥ 100 ms
Response Time
Status Status of the port. {0 = OK; 1 =Degraded; 2 =Failed}
1 = Warning2 = Alarm
Availability
Transfer Byte Rate Amount of data transferred per second bythe Port.
Megabytes perseconds (MB/s)
n/a Statistics
Transfer Bytes Amount of write/read accumulated data forthe port.
Gigabytes (GB) n/a Statistics

85Dell Compellent Port
Version 1.0.00
BMC ProactiveNet Performance Management - Dell Compellent Storage Monitoring
Dell Compellent Power Supply
Attributes
Name Description Units Default AlertConditions
BMCProactiveNetAttributeType
Present Indicates whether the device is present ornot since the last discovery.
{0 = No; 1 =Yes}
0 = Alarm Availability
Status Status of the power supply. {0 = OK; 1 =Degraded; 2 =Failed}
1 = Warning2 = Alarm
Availability
Dell Compellent Storage Center
Attributes
Name Description Units Default AlertConditions
BMCProactiveNetAttributeType
AvailableCapacity*
Total capacity not consumed in the storagesystem (unused raw space plus availablecapacity in storage pools).
Terabytes (TB) None Statistics
Back End ReadByte Rate
Read data traffic through the back-end. Megabytes perseconds (MB/s)
None Statistics
Back End ReadOperation Rate
Rate of read operations through the back-end.
Operations/s None Statistics
Back End WriteByte Rate
Written data traffic through the back-end. Megabytes perseconds (MB/s)
None Statistics
Back End WriteOperation Rate
Rate of write operations through the back-end.
Operations/s None Statistics
ConsumedCapacityPercentage
Percentage of the volume subscribedcapacity that has been actually consumedby the host. Will be typically less than 100%for thin volumes. Will be exactly 100% forall traditional volumes.
Percentage (%) None Statistics
ConsumedCapacity
Space actually consumed. Terabytes (TB) None Statistics
Front End ReadByte Rate
Read data traffic through the front-end. Megabytes perseconds (MB/s)
None Statistics
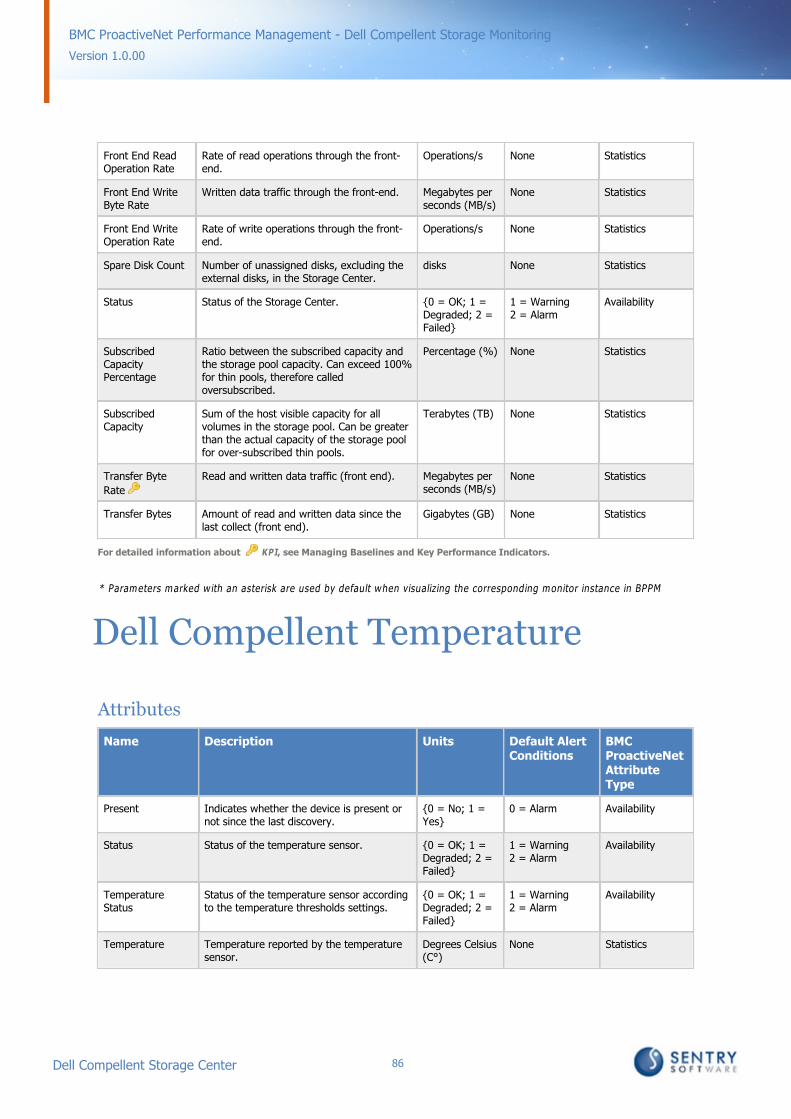
86Dell Compellent Storage Center
Version 1.0.00
BMC ProactiveNet Performance Management - Dell Compellent Storage Monitoring
Front End ReadOperation Rate
Rate of read operations through the front-end.
Operations/s None Statistics
Front End WriteByte Rate
Written data traffic through the front-end. Megabytes perseconds (MB/s)
None Statistics
Front End WriteOperation Rate
Rate of write operations through the front-end.
Operations/s None Statistics
Spare Disk Count Number of unassigned disks, excluding theexternal disks, in the Storage Center.
disks None Statistics
Status Status of the Storage Center. {0 = OK; 1 =Degraded; 2 =Failed}
1 = Warning2 = Alarm
Availability
SubscribedCapacityPercentage
Ratio between the subscribed capacity andthe storage pool capacity. Can exceed 100%for thin pools, therefore calledoversubscribed.
Percentage (%) None Statistics
SubscribedCapacity
Sum of the host visible capacity for allvolumes in the storage pool. Can be greaterthan the actual capacity of the storage poolfor over-subscribed thin pools.
Terabytes (TB) None Statistics
Transfer Byte
Rate
Read and written data traffic (front end). Megabytes perseconds (MB/s)
None Statistics
Transfer Bytes Amount of read and written data since thelast collect (front end).
Gigabytes (GB) None Statistics
For detailed information about KPI, see Managing Baselines and Key Performance Indicators.
* Parameters marked with an asterisk are used by default when visualizing the corresponding monitor instance in BPPM
Dell Compellent Temperature
Attributes
Name Description Units Default AlertConditions
BMCProactiveNetAttributeType
Present Indicates whether the device is present ornot since the last discovery.
{0 = No; 1 =Yes}
0 = Alarm Availability
Status Status of the temperature sensor. {0 = OK; 1 =Degraded; 2 =Failed}
1 = Warning2 = Alarm
Availability
TemperatureStatus
Status of the temperature sensor accordingto the temperature thresholds settings.
{0 = OK; 1 =Degraded; 2 =Failed}
1 = Warning2 = Alarm
Availability
Temperature Temperature reported by the temperaturesensor.
Degrees Celsius(C°)
None Statistics
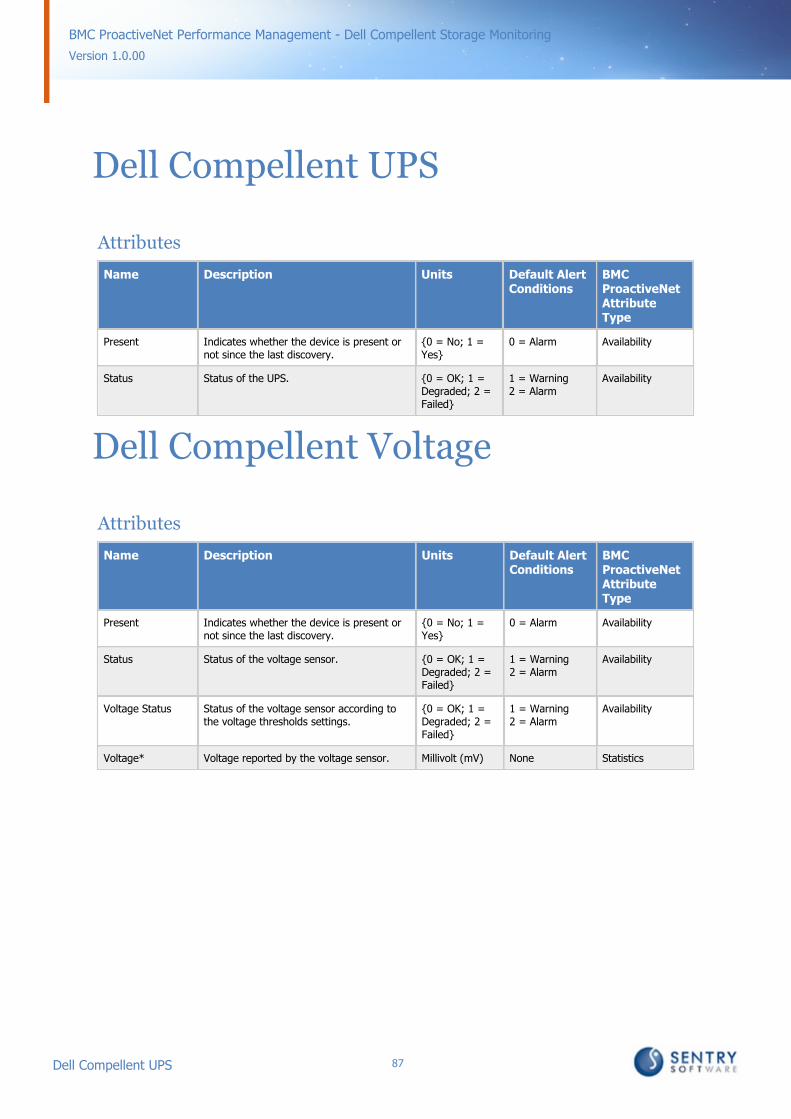
87Dell Compellent UPS
Version 1.0.00
BMC ProactiveNet Performance Management - Dell Compellent Storage Monitoring
Dell Compellent UPS
Attributes
Name Description Units Default AlertConditions
BMCProactiveNetAttributeType
Present Indicates whether the device is present ornot since the last discovery.
{0 = No; 1 =Yes}
0 = Alarm Availability
Status Status of the UPS. {0 = OK; 1 =Degraded; 2 =Failed}
1 = Warning2 = Alarm
Availability
Dell Compellent Voltage
Attributes
Name Description Units Default AlertConditions
BMCProactiveNetAttributeType
Present Indicates whether the device is present ornot since the last discovery.
{0 = No; 1 =Yes}
0 = Alarm Availability
Status Status of the voltage sensor. {0 = OK; 1 =Degraded; 2 =Failed}
1 = Warning2 = Alarm
Availability
Voltage Status Status of the voltage sensor according tothe voltage thresholds settings.
{0 = OK; 1 =Degraded; 2 =Failed}
1 = Warning2 = Alarm
Availability
Voltage* Voltage reported by the voltage sensor. Millivolt (mV) None Statistics
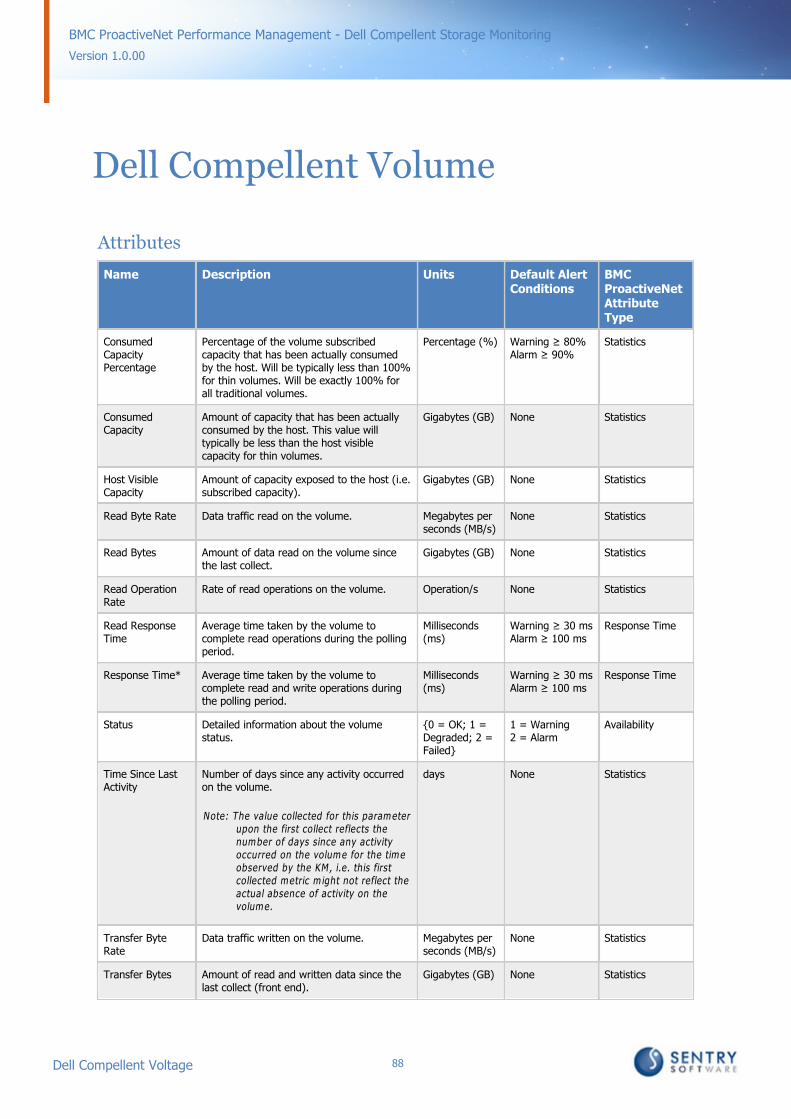
88Dell Compellent Voltage
Version 1.0.00
BMC ProactiveNet Performance Management - Dell Compellent Storage Monitoring
Dell Compellent Volume
Attributes
Name Description Units Default AlertConditions
BMCProactiveNetAttributeType
ConsumedCapacityPercentage
Percentage of the volume subscribedcapacity that has been actually consumedby the host. Will be typically less than 100%for thin volumes. Will be exactly 100% forall traditional volumes.
Percentage (%) Warning ≥ 80%Alarm ≥ 90%
Statistics
ConsumedCapacity
Amount of capacity that has been actuallyconsumed by the host. This value willtypically be less than the host visiblecapacity for thin volumes.
Gigabytes (GB) None Statistics
Host VisibleCapacity
Amount of capacity exposed to the host (i.e.subscribed capacity).
Gigabytes (GB) None Statistics
Read Byte Rate Data traffic read on the volume. Megabytes perseconds (MB/s)
None Statistics
Read Bytes Amount of data read on the volume sincethe last collect.
Gigabytes (GB) None Statistics
Read OperationRate
Rate of read operations on the volume. Operation/s None Statistics
Read ResponseTime
Average time taken by the volume tocomplete read operations during the pollingperiod.
Milliseconds(ms)
Warning ≥ 30 msAlarm ≥ 100 ms
Response Time
Response Time* Average time taken by the volume tocomplete read and write operations duringthe polling period.
Milliseconds(ms)
Warning ≥ 30 msAlarm ≥ 100 ms
Response Time
Status Detailed information about the volumestatus.
{0 = OK; 1 =Degraded; 2 =Failed}
1 = Warning2 = Alarm
Availability
Time Since LastActivity
Number of days since any activity occurredon the volume.
Note: The value collected for this parameterupon the first collect reflects thenumber of days since any activityoccurred on the volume for the timeobserved by the KM, i.e. this firstcollected metric might not reflect theactual absence of activity on thevolume.
days None Statistics
Transfer ByteRate
Data traffic written on the volume. Megabytes perseconds (MB/s)
None Statistics
Transfer Bytes Amount of read and written data since thelast collect (front end).
Gigabytes (GB) None Statistics

89Dell Compellent Volume
Version 1.0.00
BMC ProactiveNet Performance Management - Dell Compellent Storage Monitoring
Write Byte Rate Data traffic written on the volume. Megabytes perseconds (MB/s)
None Statistics
Write Bytes Amount of data written on the disk foldersince the last collect.
Gigabytes (GB) None Statistics
Write OperationRate
Rate of write operations on the volume. Operation/s None Statistics
Write ResponseTime
Average time taken by the volume tocomplete write operations during the pollingperiod.
Milliseconds(ms)
Warning ≥ 30 msAlarm ≥ 100 ms
ResponseTime
* Parameters marked with an asterisk are used by default when visualizing the corresponding monitor instance in BPPM.
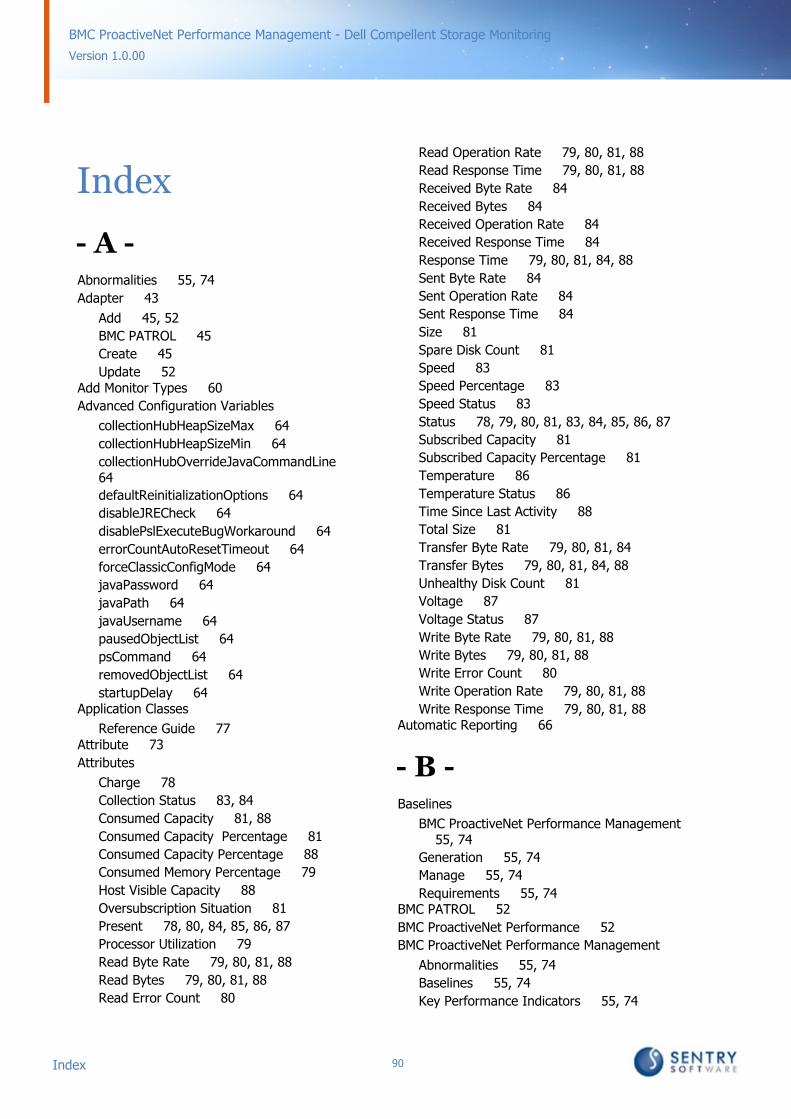
Index 90
Version 1.0.00
BMC ProactiveNet Performance Management - Dell Compellent Storage Monitoring
Index
- A -Abnormalities 55, 74
Adapter 43
Add 45, 52
BMC PATROL 45
Create 45
Update 52Add Monitor Types 60
Advanced Configuration Variables
collectionHubHeapSizeMax 64
collectionHubHeapSizeMin 64
collectionHubOverrideJavaCommandLine 64
defaultReinitializationOptions 64
disableJRECheck 64
disablePslExecuteBugWorkaround 64
errorCountAutoResetTimeout 64
forceClassicConfigMode 64
javaPassword 64
javaPath 64
javaUsername 64
pausedObjectList 64
psCommand 64
removedObjectList 64
startupDelay 64Application Classes
Reference Guide 77Attribute 73
Attributes
Charge 78
Collection Status 83, 84
Consumed Capacity 81, 88
Consumed Capacity Percentage 81
Consumed Capacity Percentage 88
Consumed Memory Percentage 79
Host Visible Capacity 88
Oversubscription Situation 81
Present 78, 80, 84, 85, 86, 87
Processor Utilization 79
Read Byte Rate 79, 80, 81, 88
Read Bytes 79, 80, 81, 88
Read Error Count 80
Read Operation Rate 79, 80, 81, 88
Read Response Time 79, 80, 81, 88
Received Byte Rate 84
Received Bytes 84
Received Operation Rate 84
Received Response Time 84
Response Time 79, 80, 81, 84, 88
Sent Byte Rate 84
Sent Operation Rate 84
Sent Response Time 84
Size 81
Spare Disk Count 81
Speed 83
Speed Percentage 83
Speed Status 83
Status 78, 79, 80, 81, 83, 84, 85, 86, 87
Subscribed Capacity 81
Subscribed Capacity Percentage 81
Temperature 86
Temperature Status 86
Time Since Last Activity 88
Total Size 81
Transfer Byte Rate 79, 80, 81, 84
Transfer Bytes 79, 80, 81, 84, 88
Unhealthy Disk Count 81
Voltage 87
Voltage Status 87
Write Byte Rate 79, 80, 81, 88
Write Bytes 79, 80, 81, 88
Write Error Count 80
Write Operation Rate 79, 80, 81, 88
Write Response Time 79, 80, 81, 88Automatic Reporting 66
- B -Baselines
BMC ProactiveNet Performance Management 55, 74
Generation 55, 74
Manage 55, 74
Requirements 55, 74BMC PATROL 52
BMC ProactiveNet Performance 52
BMC ProactiveNet Performance Management
Abnormalities 55, 74
Baselines 55, 74
Key Performance Indicators 55, 74

Index 91
Version 1.0.00
BMC ProactiveNet Performance Management - Dell Compellent Storage Monitoring
BMC ProactiveNet Performance Management
KPI 55, 74BPPM
Data Collection 54
- C -Component
folders 69Component Installation package
creating 36
downloading 41Configuration Variables
collectionHubHeapSizeMax 64
collectionHubHeapSizeMin 64
collectionHubOverrideJavaCommandLine 64
defaultReinitializationOptions 64
disableJRECheck 64
disablePslExecuteBugWorkaround 64
errorCountAutoResetTimeout 64
forceClassicConfigMode 64
javaPassword 64
javaPath 64
javaUsername 64
pausedObjectList 64
psCommand 64
removedObjectList 64
startupDelay 64Configuring
monitor settings 60
thresholds 67
- D -Data Collection
BPPM 54
Verify 54Debug Mode
enabling 62Dell Compellent Disk 77
Downloading 41
- E -Event
collectors 69
folders 69Exclude
Volume 60
- F -Features 9
- G -Generate
Baselines 55, 74Goals 9
Graphs 73
- H -Hitachi Disk Array 77
- I -Information
Closed 73
Enabled 73
Open 73
Source Agent 73Installation
configuring 58Installing 41
Integration
BMC ProactiveNet Performance Management 43
Integration Service Agent 45
- K -Keep
Volume 60Key Concepts 9
Key Performance Indicators
BMC ProactiveNet Performance Management 55, 74
Manage 55, 74KPI
BMC ProactiveNet Performance Management 55, 74
Manage 55, 74
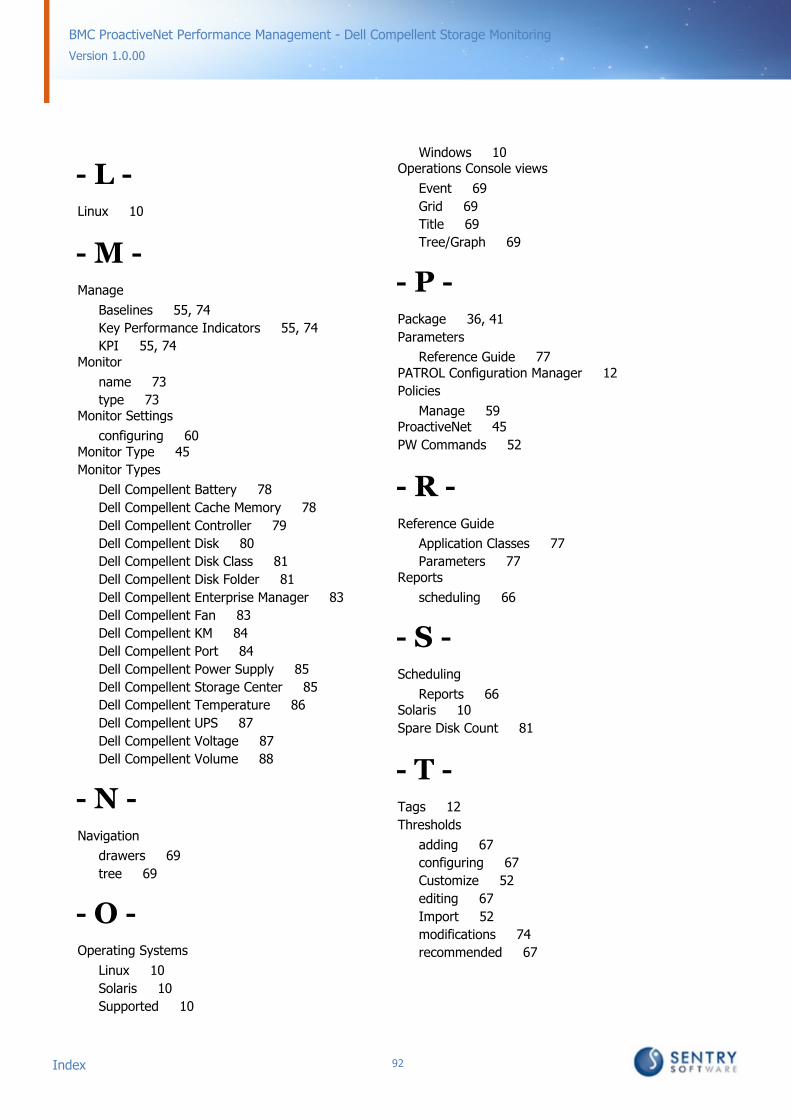
Index 92
Version 1.0.00
BMC ProactiveNet Performance Management - Dell Compellent Storage Monitoring
- L -Linux 10
- M -Manage
Baselines 55, 74
Key Performance Indicators 55, 74
KPI 55, 74Monitor
name 73
type 73Monitor Settings
configuring 60Monitor Type 45
Monitor Types
Dell Compellent Battery 78
Dell Compellent Cache Memory 78
Dell Compellent Controller 79
Dell Compellent Disk 80
Dell Compellent Disk Class 81
Dell Compellent Disk Folder 81
Dell Compellent Enterprise Manager 83
Dell Compellent Fan 83
Dell Compellent KM 84
Dell Compellent Port 84
Dell Compellent Power Supply 85
Dell Compellent Storage Center 85
Dell Compellent Temperature 86
Dell Compellent UPS 87
Dell Compellent Voltage 87
Dell Compellent Volume 88
- N -Navigation
drawers 69
tree 69
- O -Operating Systems
Linux 10
Solaris 10
Supported 10
Windows 10Operations Console views
Event 69
Grid 69
Title 69
Tree/Graph 69
- P -Package 36, 41
Parameters
Reference Guide 77PATROL Configuration Manager 12
Policies
Manage 59ProactiveNet 45
PW Commands 52
- R -Reference Guide
Application Classes 77
Parameters 77Reports
scheduling 66
- S -Scheduling
Reports 66Solaris 10
Spare Disk Count 81
- T -Tags 12
Thresholds
adding 67
configuring 67
Customize 52
editing 67
Import 52
modifications 74
recommended 67
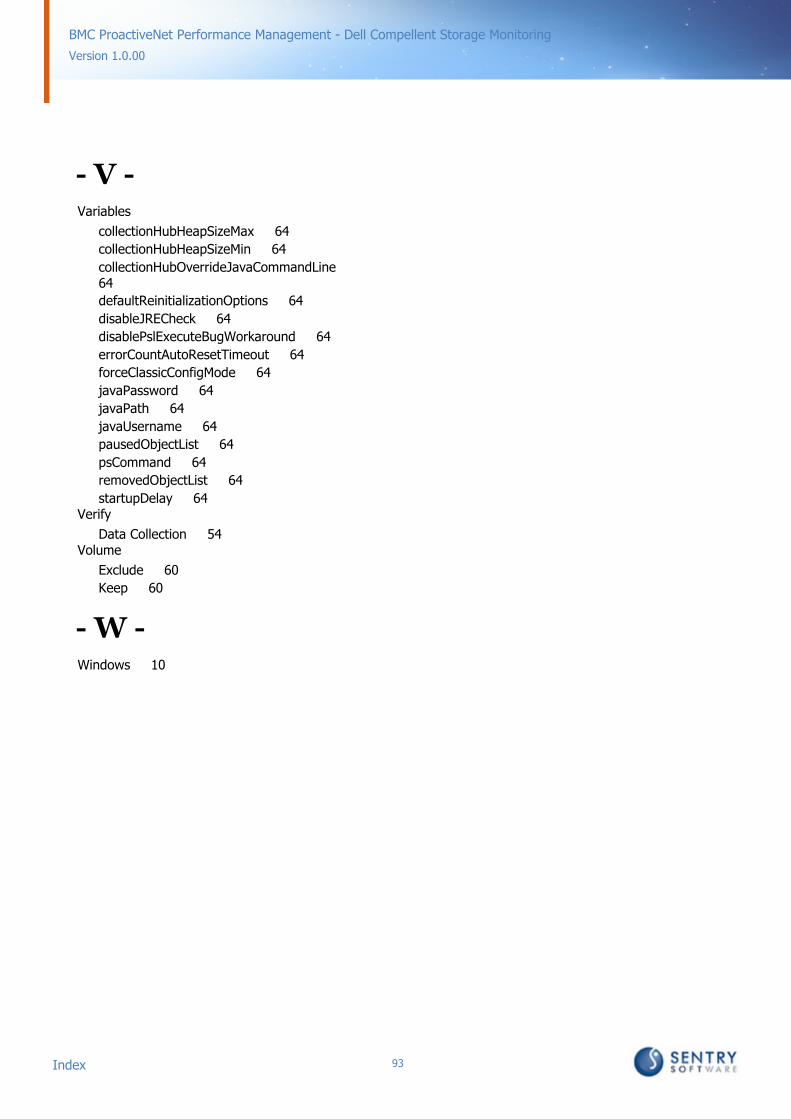
Index 93
Version 1.0.00
BMC ProactiveNet Performance Management - Dell Compellent Storage Monitoring
- V -Variables
collectionHubHeapSizeMax 64
collectionHubHeapSizeMin 64
collectionHubOverrideJavaCommandLine 64
defaultReinitializationOptions 64
disableJRECheck 64
disablePslExecuteBugWorkaround 64
errorCountAutoResetTimeout 64
forceClassicConfigMode 64
javaPassword 64
javaPath 64
javaUsername 64
pausedObjectList 64
psCommand 64
removedObjectList 64
startupDelay 64Verify
Data Collection 54Volume
Exclude 60
Keep 60
- W -Windows 10

About BMC® SoftwareBMC Software, Inc. NYSE:BMC, is a leading provider of enterprise management solutionsthat empower companies to manage their IT infrastructure from a business perspective.Delivering Business Service Management, BMC Software solutions span enterprisesystems, applications, databases, and service management. Founded in 1980, BMCSoftware has offices worldwide and fiscal 2004 revenues of more than $1.4 billion. For
more information about BMC Software, visit www.bmc.com.
About Sentry Software™Sentry Software, a strategic Technology Alliance Partner of BMC Software, provides keymonitoring solutions specifically designed to expand the capabilities of BMCPerformance Manager, thus enabling up to 100% coverage of any infrastructure. SentrySoftware specializes in single solutions for multi-platform monitoring of hardware,custom applications or any IT component, and blackout windows. Sentry Softwareproducts are deployed in 45 countries across the globe and lead the list of BMCSoftware’s third-party product sales. For more information about Sentry Software,
please visit www.sentrysoftware.net.


