35
www.bsfng.com 0 www.bsfng.com
| Date post: | 06-Aug-2015 |
| Category: |
Presentations & Public Speaking |
| Upload: | absmartkarma |
| View: | 95 times |
| Download: | 3 times |
www.bsfng.com 0
www.bsfng.com
www.bsfng.com
1.
2.
3.
Highlights – Profitability, Growth
Highlights – Asset Quality, Capital Adequacy
Group Structure
3
4
5
1.
2.
3.
4.
5.
Group Earning Results
Subsidiaries Earning Results
Banks Earning Results
Banks NIM & NIS
SG&A
7
8
9
10
11
1
1.
2.
3.
4.
Group Asset Quality
Banks Asset Quality
Provisioning
Banks Write-Offs and NPL Sales
19
20
22
23
The financial information presented herein is prepared on the basis of pre-audited financial of BS Financial Group and is based upon the plans, strategies and expectations of the
FG’s management. All information described in this presentation should be treated as forward looking statements that are subject to risks and uncertainties. Actual results could
vary materially from the expectations reflected in this presentation, thus the statements presented herein do not purport to be a complete description of the group’s operations
or future developments. Readers are cautioned not to place under reliance on these statements, which speak only as of the date of this presentation BS Financial Group does not
undertake any obligation to publicly release any revisions to these statements to reflect any future events.
ㆍKyongnam Bank has been added October 10, 2014, and earnings will be consolidated starting from the 4Q of 2014
ㆍFiscal Year End for BS MSB is June 30
I. 2014 Group Highlights
1.
2.
3.
Banks Corporate Loan Portfolio
Non-Bank Summary
Group Networks & Major Industries
28
29
34
II. Profitability
IV. Asset Quality
VI. Appendix
1.
2.
Group Capital Adequacy
Banks Capital Adequacy
25
26
V. Capital Adequacy
1.
2.
3.
Group Assets, B/S Summary
Banks B/S
Banks Low-Cost Deposits
13
14
16
III. Growth
Contents
DISCLAIMER

www.bsfng.com
1. Highlights – Profitability, Growth 3
2. Highlights – Asset Quality, Capital Adequacy 4
3. Group Structure 5
2
Ⅰ. 2014 Group Highlights

www.bsfng.com
Growth – Group, Bank, Non-Bank Total Assets, Total KRW Loans by Bank
Busan
22.9
Busan
26.0
Busan
28.5
Busan
31.9
Kyongnam
17.3
Kyongnam
20.0
Kyongnam
23.1
Kyongnam
24.7
5.0
15.0
25.0
35.0
2011 2012 2013 2014
Group
42.0
Group
46.3
Group
51.1
Group
93.3
Busan
40.6
Busan
43.2
Busan
47.1
Busan
51.3
Kyongnam
28.2
Kyongnam
31.3
Kyongnam
35.7
Kyongnam
37.2
Non-Bank
1.4
Non-Bank
3.1
Non-Bank
4.1
Non-Bank
4.8
-
25.0
50.0
75.0
100.0
2011 2012 2013 2014
FY Group Total Assets
93.3 KRW tn, up by 82.5% YoY
FY Busan Bank Total Assets
51.3 KRW tn, up by 8.9% YoY
FY Kyongnam Bank Total Assets
37.2 KRW tn, up by 4.3% YoY
▪KRW Loans
(KRW tn) (KRW tn)
14.34
11.65
9.01
20.50
1.10 0.88 0.67 1.47
0
5
10
15
20
2011 2012 2013 2014
(%)
[ ] ROA, ROE Excluding NGW
▪Group ROA, ROE (ROE)
(ROA)
2.45 2.47 2.46 2.46 2.55 2.50 2.45
2.38
2.27 2.21 2.17
2.11 2.07 2.08 1.99
1.93
1.50
2.50
13.1Q 13.2Q 13.3Q 13.4Q 14.1Q 14.2Q 14.3Q 14.4Q
(%)
(Busan)
(Kyongnam)
128.5 111.6 94.4 100.2
97.3 88.5 92.8 100.7
95.2 115.1 96.9 116.4
79.3 50.7 20.4
492.5
-
200.0
400.0
600.0
800.0
2011 2012 2013 2014
▪Group Net Income
(4Q)
(3Q)
(2Q)
(1Q)
(4Q)
(3Q)
(2Q)
(1Q)
(4Q)
(3Q)
(2Q)
(1Q)
[ ] FY Net Income
Profitability – Group Net Income, Group & Banks ROA, ROE, NIM
(KRW bn)
FY Group Net Income
809.8 KRW bn, up by 166.0% YoY
Busan Bank FY Net Income
355.2 KRW bn, up by 11.5% YoY
Kyongnam Bank FY Net Income
92.2 KRW bn, down by 29.2% YoY
Busan Bank ROA, ROE 0.75%, 9.81%
Kyongnam Bank ROA, ROE 0.11%, 1.85%
Busan Bank
4Q NIM 2.38%, Annualized NIM 2.47%
Kyongnam Bank
4Q NIM 1.93%, Annualized NIM 2.01%
(without NGW 45.8)
▪Total Assets
[400.3] [365.9]
[304.5]
[809.8]
[0.67]
[9.40]
*NGW(Negative Goodwill)
1.10 0.88
0.67 0.75
0.34 0.59
0.41 0.11 0
1
2011 2012 2013 2014
(Busan)
(Kyongnam)
14.34 11.65
9.01 9.81
4.88
9.13 6.25
1.85 0
5
10
15
20
2011 2012 2013 2014
(Busan)
(Kyongnam)
(%)
(%)
1. Highlights – Profitability, Growth
▪Bank Quarterly NIM ▪Bank ROA
▪Bank ROE
3

www.bsfng.com
Group
0.52
Group
0.55
Group
0.66
Group
0.43
Busan
0.49 Busan
0.44
Busan
0.44
Busan
0.45
Kyongnam
0.80 Kyongnam
0.71
Kyongnam
0.83 Kyongnam
0.74
-
0.20
0.40
0.60
0.80
1.00
2011 2012 2013 2014
Group
13.85
Group
11.91
Busan
14.61 Busan
13.30
Kyongnam
13.66 Kyongnam
12.74
6.00
12.00
18.00
2013 2014
Asset Quality – Credit Cost(Annualized)
Group
9.75 Group
8.17
Busan
10.76 Busan
9.68
Kyongnam
9.71 Kyongnam
8.59
3.00
8.00
13.00
2013 2014
0.61 0.69
0.77
0.83
0.59 0.55 0.55 0.51
1.33
0.77
0.55
0.94
-
0.50
1.00
1.50
2011 2012 2013 2014
(%)
(Kyongnam)
(Group)
(Busan)
(%) (%)
Group Credit Cost 43bp
Busan Bank Credit Cost 45bp
Kyongnam Bank Credit Cost 74bp
Group NPL Ratio 1.42%
Busan Bank NPL Ratio 1.06%
Kyongnam Bank NPL Ratio 1.75%
0.97
1.20 1.30 1.42
0.99 1.11 1.17
1.06
1.16
0.94
1.86 1.75
-
0.50
1.00
1.50
2.00
2011 2012 2013 2014
(%)
(Kyongnam)
(Group)
(Busan)
Asset Quality – NPL, Delinquency Ratio
Capital Adequacy – BIS, Tier I, Core Tier I Ratio
(%)
Group
9.46 Group
7.69
Busan
10.43 Busan
9.38 Kyongnam
8.35 Kyongnam
7.65
3.00
8.00
13.00
2013 2014
▪BIS ▪Core Tier I ▪Tier I
▪NPL Ratio ▪Delinquency Ratio
(%)
2. Highlights – Asset Quality, Capital Adequacy
4

www.bsfng.com
Total Shares
Owned
100%
Total Assets
3,583.3
Net Income
36.3
Establishment : 2011.03.15
Total Assets : 93,322.5
Net Income : 809.8(363.1)1)
Employees : 7,842
Establishment : 1967.10.10
Branches : 273(China &
Vietnam Office Included)
Employees : 3,870
Establishment : 1970.05.22
Bank Added : 2014.10.10
Branches : 161
Employees : 2,928
Establishement : 1997.06.02
[Securities Added : 2009.11]
Branches : 4
Employees : 167
Establishement : 2010.07.15
Branches : 22
Employees : 516
Establishement : 2011.12.13
Branches : 7
Employees : 116
Establishement : 2003.06.17
Industry : Collection
Employees : 59
Establishement : 2011.05.20
Industry : IT related
Employees : 127
(%, KRW bn, Accumulated)
BS Financial Group
Busan Bank
Kyongnam Bank
Securities Capital MSB Credit Info. Info. System
Cambodia Subsidiary
Establishment : 2014.03.07
Employees : 3
Total Shares Owned : 100%
Total Assets : 0.47
Preparing for Operations
Myanmar Subsidiary
Establishment : 2014.03.21
Employees : 13
Total Shares Owned : 99.9%
Total Assets : 0.51
2014.12 Start of Operations
Total Shares
Owned
100%
Total Assets
51,281.9
Net Income
355.2
Total Shares
Owned
56.97%
Total Assets
37,243.8
2)Net Income
92.2(3.42))
Total Shares
Owned
100%
Total Assets
512.0
Net Income
5.7
Total Shares
Owned
100%
Total Assets
736.1
Net Income
10.5
Total Shares
Owned
100%
Total Assets
7.1
Net Income
0.5
Total Shares
Owned
100%
Total Assets
6.8
Net Income
0.7
1) Net Income inside the bracket exclude the
Negative Goodwill
2) Kyongnam Bank Earnings have been
added to the Consolidated Financial
Statements as of the 4th Quarter of 2014
(3.4 KRW bn is the Net Income in Controlling Interest)
3. Group Structure
5

www.bsfng.com 6
Ⅱ. Profitability
1. Group Earning Results 7
2. Subsidiaries Earning Results 8
3. Banks Earning Results 9
4. Banks NIM & NIS 10
5. SG&A 11

www.bsfng.com
1. Group Earning Results
7
(KRW bn, %)
20141) 2013 YoY 14.4Q 13.4Q 14.4Q
vs. 13.4Q
Net Interest Income 1,427.2 1,154.4 23.6 490.9 299.2 64.1
Net Fee Income 114.2 85.2 34.0 27.2 21.4 27.1
Others2) 430.8 △24.2 - 432.2 △13.9 -
SG&A(-) 751.6 573.8 31.0 323.6 178.2 81.6
Provision Expense(-) 279.5 228.8 22.2 113.1 101.0 12.0
Non-Operating Income △22.0 △9.9 - △13.4 △0.7 -
Earnings Before Income Tax 919.1 402.9 128.1 500.2 26.8 1,766.4
Income Tax Expense(-) 99.4 97.4 2.1 2.0 5.4 △63.0
Net Income(A) 819.7 305.5 168.3 498.2 21.4 2,228.0
Net Income in Non-
Controlling Interest3)(B) 9.9 1.0 890.0 5.7 1.0 470.0
Net Income in Controlling Interest(D)
(D) = (A) - (B)
[Net Income in Controlling Interest
Excluding Negative Goodwill]
809.8
[363.1]
304.5
[304.5]
165.9
[19.2]
492.5
[45.8]
20.4
[20.4]
2,314.2
[124.5]
1) Kyongnam Bank Earnings have been added to the Consolidated Financial Statements as of the 4th Quarter of 2014 2) Negative Goodwill 447.9 KRW bn included 3) Kyongnam Bank’s Net Income in Non-Controlling Interest (2.6 KRW bn) , Hybrid Bond Interest(8.3 KRW bn), Amortization on Intangible Assets(△1.0 KRW bn) included

www.bsfng.com 8
2. Subsidiaries Earning Results
(KRW bn, %) 2014 2013 YoY 14.4Q 13.4Q
14.4Q
vs. 13.4Q
Bank(A) 363.9 318.6 14.2 58.4 44.1 32.4
Busan 355.2 318.6 11.5 49.7 44.1 12.7
Kyongnam 8.7 0.0 - 8.7 0.0 -
Non-Bank(B) 53.7 18.4 191.8 11.1 △11.1 Net Gain
Securities 5.7 0.3 1,800.0 3.2 0.1 3,100.0
Capital 36.3 28.5 27.4 8.1 8.5 △4.7
MSB 10.5 △11.9 Net Gain △0.4 △20.2 -
Credit Information 0.5 0.7 △28.6 0.1 0.2 △50.0
Information Systems 0.7 0.8 △12.5 0.1 0.3 △66.7
Financial Group & Unconsolidated
Portion(C) △43.6 △31.5 - △17.0 △11.6 -
Negative Goodwill(D) 447.9 0.0 - 447.9 0.0 -
Net Income in Non-Controlling
Interest1) (E) 12.1 1.0 1,110.0 7.9 1.0 690.0
Net Income in Controlling Interest(F)
(F=A+B+C+D-E)
[Net Income in Controlling Interest
Excluding Negative Goodwill]
809.8
[363.1]
304.5
[304.5]
165.9
[19.2]
492.5
[45.8]
20.4
[20.4]
2,314.2
[124.5]
1) Net Income in Non-Controlling Interest 9.9 KRW bn + Amortization on Intangible Assets 2.2 KRW bn

www.bsfng.com 9
3. Banks Earning Results
2014 2013 YoY 14.4Q 14.3Q QoQ
(KRW bn, %, %p)
Net Interest Income 1,087.3 1,001.9 8.5 272.1 276.8 △1.7
Net Fee Income 81.3 65.2 24.7 17.2 21.6 △20.4
Fees from Trust
Account 15.5 11.0 40.9 3.4 4.2 △19.0
Others △40.4 △41.7 - △14.2 △5.7 -
Provision Expense(-) 153.8 135.5 13.5 49.2 27.8 77.0
SG&A(-) 533.0 489.8 8.8 174.9 120.2 45.5
Net Operating Income 456.9 411.1 11.1 54.4 148.9 △63.5
Non-Operating Income △17.9 △5.1 - △8.4 △4.6 -
Earnings Before
Income Taxes 439.0 406.0 8.1 46.0 144.3 △68.1
Income Tax Expenses(-) 83.8 87.4 △4.1 △3.7 31.5 -
Net Income 355.2 318.6 11.5 49.7 112.8 △55.9
ROA 0.75 0.79 △0.04 0.75 0.90 △0.15
ROE 9.81 10.43 △0.62 9.81 11.44 △1.63
2014 2013 YoY 14.4Q 14.3Q QoQ
(KRW bn, %, %p)
Net Interest Income 694.6 693.2 0.2 173.7 174.2 △0.3
Net Fee Income 34.8 46.1 △24.5 5.0 8.8 △43.2
Fees from Trust
Account 5.7 5.6 1.8 1.0 1.3 △23.1
Others △48.8 △48.1 - △15.0 △5.8 -
Provision Expense(-) 197.7 209.0 △5.4 37.3 41.9 △11.0
SG&A(-) 363.3 327.7 10.9 113.5 87.5 29.7
Net Operating Income 125.3 160.1 △21.7 13.9 49.1 △71.7
Non-Operating Income △5.9 △7.8 - △1.8 △0.5 -
Earnings Before
Income Taxes 119.4 152.3 △21.6 12.1 48.6 △75.1
Income Tax Expenses(-) 27.2 22.0 23.6 3.4 11.7 △70.9
Net Income 92.2 130.3 △29.2 8.7 36.9 △76.4
ROA 0.11 0.41 △0.30 0.11 0.25 △0.14
ROE 1.85 6.25 △4.40 1.85 4.14 △2.29
Busan Kyongnam

www.bsfng.com
Note. Table on the top is based on quarterly numbers Table on the bottom is based on accumulated numbers
4. Banks NIM & NIS
10
(KRW bn, %, %p) 14.4Q 13.4Q YoY 14.3Q QoQ
NIM(Quarterly) 2.38 2.46 △0.08 2.45 △0.07
NIS 2.66 2.80 △0.14 2.73 △0.07
Interest Rate on KRW Loans 4.64 5.05 △0.41 4.80 △0.16
Households 3.98 4.50 △0.52 4.17 △0.19
Corporate 4.53 4.90 △0.37 4.70 △0.17
Interest Rate paid on KRW Deposits 1.98 2.25 △0.27 2.07 △0.09
Average Interest Earning Assets 40,585.0 37,623.0 7.9 40,119.9 1.2
NIM(Accumulated) 2.47 2.46 0.01 2.50 △0.03
NIS 2.76 2.83 △0.07 2.79 △0.03
Interest Rate on KRW Loans 4.85 5.22 △0.37 4.93 △0.08
Households 4.20 4.73 △0.53 4.29 △0.09
Corporate 4.72 5.02 △0.30 4.78 △0.06
Interest Rate paid on KRW Deposits 2.09 2.39 △0.30 2.14 △0.05
Average Interest Earning Assets 39,460.6 36,542.5 8.0 39,081.6 1.0
(KRW bn, %, %p) 14.4Q 13.4Q YoY 14.3Q QoQ
NIM(Quarterly) 1.93 2.11 △0.18 1.99 △0.06
NIS 2.10 2.30 △0.20 2.17 △0.07
Interest Rate on KRW Loans 4.28 4.71 △0.43 4.47 △0.19
Households 3.72 4.24 △0.52 3.91 △0.19
Corporate 4.23 4.91 △0.68 4.41 △0.18
Interest Rate paid on KRW Deposits 2.18 2.41 △0.23 2.30 △0.12
Average Interest Earning Assets 30,171.4 29,048.8 3.9 29,877.1 1.0
NIM(Accumulated) 2.01 2.19 △0.18 2.04 △0.03
NIS 2.20 2.40 △0.20 2.23 △0.03
Interest Rate on KRW Loans 4.50 4.96 △0.46 4.57 △0.07
Households 3.94 4.49 △0.55 4.02 △0.08
Corporate 4.42 4.84 △0.42 4.48 △0.06
Interest Rate paid on KRW Deposits 2.30 2.55 △0.25 2.34 △0.04
Average Interest Earning Assets 29,644.0 27,818.3 6.6 29,466.3 0.6
Busan Kyongnam

www.bsfng.com 11
5. SG&A
(KRW bn, %, %p)
2014 2013 YoY 13.4Q 14.3Q QoQ
Total SG&A 533.0 489.8 8.8 174.9 120.2 45.5
Salaries and
other expenses 427.8 412.6 3.7 138.9 96.5 43.9
Depreciation 58.2 33.0 76.4 15.7 14.2 10.6
Taxes and dues 14.3 13.8 3.6 3.9 4.1 △4.9
Retirement Allowance 21.7 19.1 13.6 5.4 5.4 0.0
Honorary Retirement 11.0 11.3 △2.7 11.0 0.0 -
Cost Income Ratio 46.63 47.28 △0.65 62.85 40.48 23.37
(KRW bn, %, %p)
2014 2013 YoY 13.4Q 14.3Q QoQ
Total SG&A 363.3 327.7 10.9 113.5 87.5 29.7
Salaries and
other expenses 308.6 292.6 5.5 93.0 72.6 28.1
Depreciation 20.6 11.6 77.6 7.1 5.9 20.3
Taxes and dues 12.1 9.6 26.0 1.9 5.5 △65.5
Retirement Allowance 14.7 12.3 19.5 4.2 3.5 20.0
Honorary Retirement 7.3 1.6 356.3 7.3 0.0 -
Cost Income Ratio 52.93 47.03 5.90 68.93 49.01 19.92
Kyongnam Busan
Group
(KRW bn, %, %p)
2014 2013 YoY 14.4Q 14.3Q QoQ
SG&A 751.6 573.8 31.0 323.7 147.0 120.2
Cost Income Ratio 1)38.11 47.21 △9.10 34.06 43.79 △9.73
1) 2014 Cost Income Ratio has come down YoY by 9.4%p by including the Negative Goodwill

www.bsfng.com 12
Ⅲ. Growth
1. Group Assets, B/S Summary 13
2. Banks B/S 14
3. Banks Low-Cost Deposits 16

www.bsfng.com
(KRW bn, %) 14.4Q 13.4Q YTD 14.3Q QoQ
Cash and Dues 3,206.4 1,860.9 72.3 1,647.0 94.7
Securities 12,226.4 7,833.8 56.1 7,738.0 58.0
Loans & Receivables 66,553.9 36,200.2 83.8 40,706.7 63.5
Derivative Assets 338.5 120.0 182.1 184.8 83.2
Fixed Assets &
Investment Assets 793.4 508.7 56.0 553.7 43.3
Intangible Assets 412.2 134.9 205.6 124.6 230.8
Others 519.3 258.4 101.0 453.1 14.6
Total Assets 84,050.1 46,916.9 79.1 51,407.9 63.5
13
1. Group Asset, B/S Summary
1) Based on the Bank’s Unconsolidated Financial Statements
(KRW bn, %) 14.4Q 13.4Q YTD 14.3Q QoQ
Bank 88,525.7 47,095.1 88.0 51,751.7 71.1
Busan 51,281.9 47,095.1 8.9 51,751.7 △0.9
Kyongnam 37,243.8 0.0 - 0.0 -
Non-Bank 4,845.3 4,060.4 19.3 4,978.2 △2.7
Securities 512.0 495.5 3.3 780.7 △34.4
Capital 3,583.3 2,809.8 27.5 3,461.5 3.5
MSB 736.1 743.4 △1.0 722.5 1.9
Credit Information 7.1 6.6 7.6 7.1 0.0
Information Systems 6.8 5.1 33.3 6.4 6.3
Financial Group &
Unconsolidated Portion △48.5 △25.5 - 85.9 △156.5
Group Total Assets 93,322.5 51,130.0 82.5 56,815.8 64.3
(KRW bn, %) 14.4Q 13.4Q YTD 14.3Q QoQ
Deposits 59,906.5 31,058.9 92.9 33,664.3 78.0
Borrowings 6,664.3 9,131.3 △27.0 9,655.2 △31.0
Derivatives 7,299.5 90.2 7992.6 184.8 3,849.9
Others 4,715.9 3,035.6 55.4 3,517.1 34.1
Total Liabilities 78,586.2 43,316.0 81.4 47,021.4 67.1
Shareholder’s Equity 5,463.9 3,600.9 51.7 4,386.5 24.6
Total Liabilities &
Shareholder’s Equity 84,050.1 46,916.9 79.1 51,407.9 63.5
Group
51.1
Group
56.8
Group
93.3
Busan
47.1
Busan
51.8 Busan
51.3
Kyongnam
35.7
Kyongnam
36.7
Kyongnam
37.2
Non-Bank
4.1
Non-Bank
5.0
Non-Bank
4.8
-
25.0
50.0
75.0
100.0
2013.4Q 2014.3Q 2014.4Q
Group Total Lending Group Total Funding
Group Total Assets Group Total Assets
(KRW tn)

www.bsfng.com 14
2. Banks B/S – Busan1)
1) Based on the Bank’s Unconsolidated Financial Statements
(KRW bn, %, Balance) 14.4Q 13.4Q YTD 14.3Q QoQ
KRW Deposits 33,320.9 29,802.5 11.8 33,069.3 0.8
Demand 2,563.6 2,251.7 13.9 3,162.2 △18.9
Savings 30,739.7 27,529.8 11.7 29,889.5 2.8
Installment 17.6 21.0 △16.2 17.6 0.0
CD 100.6 66.1 52.2 103.2 △2.5
Bills Sold 40.5 43.7 △7.3 30.4 33.2
R P 216.4 211.7 2.2 242.7 △10.8
Financial Debenture 1,799.0 1,529.2 17.6 1,699.0 5.9
Trust Account 3,579.6 3,216.7 11.3 3,486.2 2.7
Total Deposits 39,057.0 34,869.9 12.0 38,630.8 1.1
(KRW bn, %, Balance) 14.4Q 13.4Q YTD 14.3Q QoQ
KRW Loans 31,869.2 28,538.7 11.7 31,452.4 1.3
Corporate 22,674.5 20,473.3 10.8 22,614.9 0.3
(SME) 20,222.5 18,118.2 11.6 19,887.7 1.7
(Large Corps) 2,452.0 2,355.1 4.1 2,727.2 △10.1
Household 7,817.6 6,827.2 14.5 7,447.8 5.0
Public 1,377.1 1,238.2 11.2 1,389.7 △0.9
Foreign Currency 565.7 569.2 △0.6 583.0 △3.0
Trust Account 13.8 15.4 △10.4 14.1 △2.1
Others 1,395.7 1,382.6 0.9 1,619.1 △13.8
Total Credits 33,844.4 30,505.9 10.9 33,668.6 0.5
LDR (Monthly Avg. Balance, %)
96.56 95.96 0.60 97.34 △0.78
(KRW bn, %, Balance)
14.4Q 13.4Q YTD 14.3Q QoQ
Total Assets 51,281.9 47,095.1 8.9 51,751.7 △0.9
Bank Account 46,082.2 42,593.2 8.2 46,066.6 0.0
Trust Account 5,199.7 4,501.9 15.5 5,685.1 △8.5
Total Deposits 39,057.0 34,869.9 12.0 38,630.8 1.1
Bank Account 35,477.4 31,653.2 12.1 35,144.6 0.9
KRW Deposits 33,320.9 29,802.5 11.8 33,069.3 0.8
Demand 2,563.6 2,251.7 13.9 3,162.2 △18.9
Savings & Time 30,739.7 27,529.8 11.7 29,889.5 2.8
Installment 17.6 21.0 △16.2 17.6 0.0
C D 100.6 66.1 52.2 103.2 △2.5
Trust Account 3,579.6 3,216.7 11.3 3,486.2 2.7
Total Credits 33,844.4 30,505.9 10.9 33,668.6 0.5
Total Loans 32,949.1 29,665.9 11.1 32,641.8 0.9
KRW Loans 31,869.2 28,538.7 11.7 31,452.4 1.3
SMEs 20,222.5 18,118.2 11.6 19,887.7 1.7
Households 7,817.6 6,827.2 14.5 7,447.8 5.0
Guarantees 895.3 840.0 6.6 1,026.8 △12.8
Total Securities 8,777.1 8,735.3 0.5 8,612.1 1.9
Bank Account 7,192.9 7,158.5 0.5 7,040.5 2.2
Trust Account 1,584.2 1,576.8 0.5 1,571.6 0.8
Shareholders’ Equity 3,421.7 3,472.4 △1.5 3,385.0 1.1

www.bsfng.com 15
2. Banks B/S – Kyongnam1)
1) Based on the Bank’s Unconsolidated Financial Statements
(KRW bn, %, Balance) 14.4Q 13.4Q YTD 14.3Q QoQ
KRW Deposits 24,725.1 23,350.9 5.9 24,684.6 0.2
Demand 2,244.8 1,959.4 14.6 2,020.2 11.1
Savings 22,467.3 21,378.4 5.1 22,652.0 △0.8
Installment 13.0 13.1 △0.8 12.4 4.8
CD 112.3 109.2 2.8 82.5 36.1
Bills Sold 21.3 24.2 △12.0 21.3 0.0
R P 114.4 124.2 △7.9 119.1 △3.9
Financial Debenture 1,566.0 1,446.0 8.3 1,416.0 10.6
Trust Account 1,854.4 1,692.8 9.5 1,815.9 2.1
Total Deposits 28,393.5 26,747.3 6.2 28,139.4 0.9
(KRW bn, %, Balance) 14.4Q 13.4Q YTD 14.3Q QoQ
KRW Loans 24,755.5 23,081.4 7.3 24,372.8 1.6
Corporate 16,718.6 16,090.4 3.9 16,858.3 △0.8
(SME) 14,762.3 14,264.9 3.5 14,789.4 △0.2
(Large Corps) 1,956.3 1,825.5 7.2 2,068.9 △5.4
Household 7,666.6 6,653.0 15.2 7,169.1 6.9
Public 370.3 338.0 9.6 345.4 7.2
Foreign Currency 183.2 256.0 △28.4 201.8 △9.2
Trust Account 0.3 0.4 △25.0 0.3 0.0
Others 699.1 687.9 1.6 697.0 0.3
Total Credits 25,638.1 24,025.7 6.7 25,271.9 1.4
LDR (Monthly Avg. Balance, %)
97.90 99.35 △1.45 97.01 0.89
(KRW bn, %, Balance)
14.4Q 13.4Q YTD 14.3Q QoQ
Total Assets 37,243.8 35,699.7 4.3 36,743.9 1.4
Bank Account 32,806.7 31,667.0 3.6 32,274.2 1.6
Trust Account 4,437.1 4,032.7 10.0 4,469.7 △0.7
Total Deposits 28,393.5 26,747.3 6.2 28,139.4 0.9
Bank Account 26,539.1 25,054.5 5.9 26,323.5 0.8
KRW Deposits 24,725.1 23,350.9 5.9 24,684.6 0.2
Demand 2,244.8 1,959.4 14.6 2,020.2 11.1
Savings & Time 22,467.3 21,378.4 5.1 22,652.0 △0.8
Installment 13.0 13.1 △0.8 12.4 4.8
C D 112.3 109.2 2.8 82.5 36.1
Trust Account 1,854.4 1,692.8 9.5 1,815.9 2.1
Total Credits 25,638.1 24,025.7 6.7 25,271.9 1.4
Total Loans 25,225.5 23,589.3 6.9 24,876.3 1.4
KRW Loans 24,755.5 23,081.4 7.3 24,372.8 1.6
SMEs 14,762.3 14,264.9 3.5 14,789.4 △0.2
Households 7,666.6 6,653.0 15.2 7,169.1 6.9
Guarantees 412.6 436.4 △5.5 395.6 4.3
Total Securities 4,745.5 4,989.7 △4.9 4,859.5 △2.3
Bank Account 4,321.5 4,530.1 △4.6 4,463.4 △3.2
Trust Account 424.0 459.6 △7.7 396.1 7.0
Shareholders’ Equity 2,146.8 2,260.3 △5.0 2,143.3 0.2

www.bsfng.com
6,030.0 6,383.9
7,091.8 7,436.9
8,360.9 8,694.1
9,406.8
10,604.9
-
2,000.0
4,000.0
6,000.0
8,000.0
10,000.0
2007 2008 2009 2010 2011 2012 2013 2014
16
3. Banks Low-Cost Deposits - Busan
Funding Costs
(KRW bn, Average Balance)
(%, Accumulated)
14.4Q 14.3Q 13.4Q
Demand
Deposits 0.20 0.20 0.25
Savings
Deposits 0.14 0.14 0.14
Corporate
Savings Deposits 1.32 1.38 1.51
Total 0.52 0.54 0.59
Growth Records
(KRW bn, %, %p, Average Balance) 14.4Q 13.4Q YTD 14.3Q QoQ
Low-Cost Deposits (A) 10,604.9 9,406.8 12.7 1,0504.6 1.0
Demand Deposits 2,450.2 2,082.2 17.7 2,423.9 1.1
Savings Deposits 4,888.0 4,372.1 11.8 4,818.5 1.4
Corporate Savings Deposits 3,266.7 2,952.5 10.6 3,262.2 0.1
Deposits in KRW (B) 31,576.3 28,461.4 10.9 31,111.8 1.5
Total Deposits (Bank Account) (C) 33,493.7 30,764.3 8.9 32,948.2 1.7
Total Deposits (Bank + Trust Account)(D) 36,926.7 33,729.8 9.5 36,358.2 1.6
Low-Cost Deposits/Won Deposits(A/B) 33.58 33.05 0.53 33.76 △0.18
Low-Cost Deposits/Total Deposits (A/C) 31.66 30.58 1.08 31.88 △0.22
Low-Cost Deposits/Total Deposits(A/D) 28.72 27.89 0.83 28.89 △0.17
www.bsfng.com
3,625.8 3,672.2
4,285.4 4,467.8 4,930.5
5,611.9
6,439.4 6,952.8
-
2,500.0
5,000.0
7,500.0
2007 2008 2009 2010 2011 2012 2013 2014
17
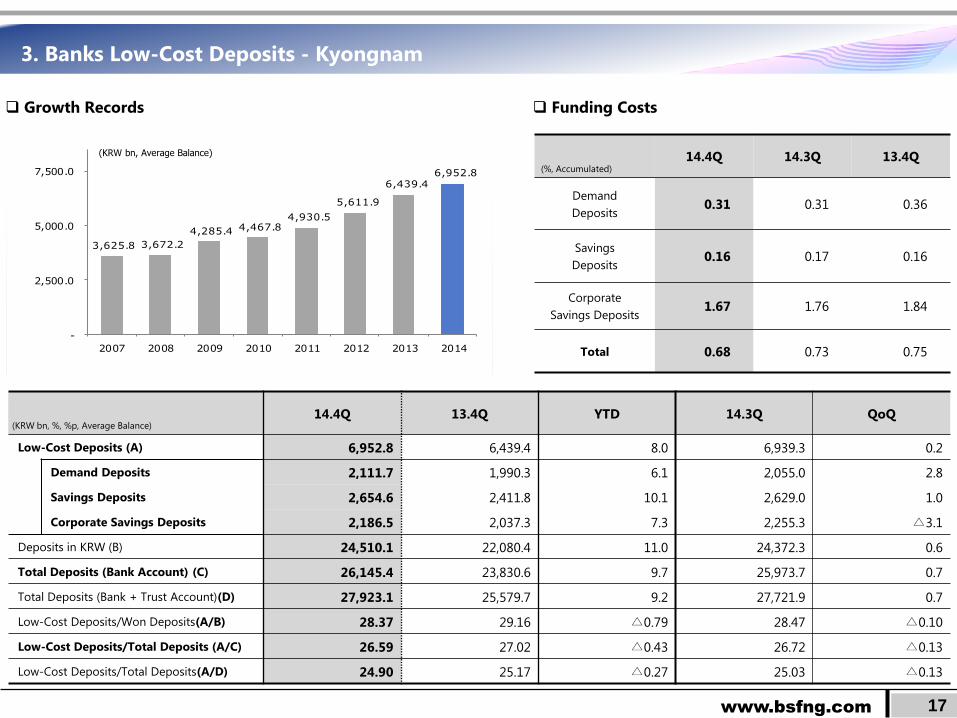
3. Banks Low-Cost Deposits - Kyongnam
Funding Costs
(KRW bn, Average Balance)
(%, Accumulated)
14.4Q 14.3Q 13.4Q
Demand
Deposits 0.31 0.31 0.36
Savings
Deposits 0.16 0.17 0.16
Corporate
Savings Deposits 1.67 1.76 1.84
Total 0.68 0.73 0.75
Growth Records
(KRW bn, %, %p, Average Balance) 14.4Q 13.4Q YTD 14.3Q QoQ
Low-Cost Deposits (A) 6,952.8 6,439.4 8.0 6,939.3 0.2
Demand Deposits 2,111.7 1,990.3 6.1 2,055.0 2.8
Savings Deposits 2,654.6 2,411.8 10.1 2,629.0 1.0
Corporate Savings Deposits 2,186.5 2,037.3 7.3 2,255.3 △3.1
Deposits in KRW (B) 24,510.1 22,080.4 11.0 24,372.3 0.6
Total Deposits (Bank Account) (C) 26,145.4 23,830.6 9.7 25,973.7 0.7
Total Deposits (Bank + Trust Account)(D) 27,923.1 25,579.7 9.2 27,721.9 0.7
Low-Cost Deposits/Won Deposits(A/B) 28.37 29.16 △0.79 28.47 △0.10
Low-Cost Deposits/Total Deposits (A/C) 26.59 27.02 △0.43 26.72 △0.13
Low-Cost Deposits/Total Deposits(A/D) 24.90 25.17 △0.27 25.03 △0.13

www.bsfng.com 18
Ⅳ. Asset Quality
1. Group Asset Quality 19
2. Banks Asset Quality 20
3. Provisioning 22
4. Banks Write-Offs and NPL Sales 23

www.bsfng.com 19
1. Group Asset Quality
SBL(NPL) Ratio Delinquency Ratio
(KRW bn, %, %p)
14.4Q 13.4Q YTD 14.3Q QoQ
Total Loans 65,274.1 34,432.3 89.6 38,190.9 70.9
Normal 63,409.4 33,253.3 90.7 36,966.5 71.5
Precautionary 939.2 731.2 28.4 720.3 30.4
Substandard 585.2 252.3 131.9 311.8 87.7
Doubtful 153.3 132.1 16.0 146.4 4.7
Expected Loss 187.0 63.3 195.4 45.9 307.4
SBL(Substandard & Below Loans) 925.5 447.7 106.7 504.1 83.6
(SBL Ratio (%)) (1.42) (1.30) 0.12 (1.32) 0.10
(SBL Coverage Ratio) (111.08) (120.90) △9.82 (112.77) △1.69
Loan Amount 63,966.2 33,593.7 90.4 37,164.1 72.1
Delinquent Amount 531.6 260.1 104.4 305.1 74.2
Delinquency Ratio 0.83 0.77 0.06 0.82 0.01
0.93
0.69
0.90 0.78 0.83 0.77
0.90 0.860.82 0.83
0.0
0.5
1.0
12.3Q 12.4Q 13.1Q 13.2Q 13.3Q 13.4Q 14.1Q 14.2Q 14.3Q 14.4Q
1.48
1.20 1.30
1.45 1.45 1.30 1.32
1.41 1.32
1.42
0.000.200.400.600.801.001.201.401.60
12.3Q 12.4Q 13.1Q 13.2Q 13.3Q 13.4Q 14.1Q 14.2Q 14.3Q 14.4Q
(%) (%)

www.bsfng.com
1.38
1.11 1.23
1.41 1.40
1.17 1.16 1.26
1.18 1.06
0.000.200.400.600.801.001.201.401.60
12.3Q 12.4Q 13.1Q 13.2Q 13.3Q 13.4Q 14.1Q 14.2Q 14.3Q 14.4Q
0.75
0.55
0.750.64 0.68
0.550.64
0.54 0.570.51
0.0
0.5
1.0
12.3Q 12.4Q 13.1Q 13.2Q 13.3Q 13.4Q 14.1Q 14.2Q 14.3Q 14.4Q
(%) (%)
20
2. Banks Asset Quality – Busan
(KRW bn, %, %p)
14.4Q 13.4Q YTD 14.3Q QoQ
Total Loans 34,500.7 31,050.7 11.1 34,244.6 0.7
Normal 33,758.2 30,345.2 11.2 33,486.8 0.8
Precautionary 376.6 342.5 10.0 354.4 6.3
Substandard 247.8 222.3 11.5 271.9 △8.9
Doubtful 41.4 104.8 △60.5 91.3 △54.7
Expected Loss 76.7 35.9 113.6 40.2 90.8
SBL(Substandard & Below Loans) 365.9 363.0 0.8 403.4 △9.3
(SBL Ratio (%)) (1.06) (1.17) △0.11 (1.18) △0.12
(SBL Coverage Ratio) (132.70) (125.14) 7.56 (118.32) 14.38
Loan Amount 33,605.4 30,210.6 11.2 33,217.9 1.2
Delinquent Amount 170.3 166.1 2.5 187.9 △9.4
Delinquency Ratio 0.51 0.55 △0.04 0.57 △0.06
SBL(NPL) Ratio Delinquency Ratio

www.bsfng.com
1.64
0.94 0.82 0.97 0.93
1.86 1.77 1.68 1.79 1.75
0.00
0.50
1.00
1.50
2.00
2.50
12.3Q 12.4Q 13.1Q 13.2Q 13.3Q 13.4Q 14.1Q 14.2Q 14.3Q 14.4Q
1.50
0.77 0.63 0.61 0.59 0.55
0.82 0.68
1.08 0.94
0.0
0.5
1.0
1.5
2.0
12.3Q 12.4Q 13.1Q 13.2Q 13.3Q 13.4Q 14.1Q 14.2Q 14.3Q 14.4Q
(%) (%)
21
(KRW bn, %, %p)
14.4Q 13.4Q YTD 14.3Q QoQ
Total Loans 26,605.3 25,034.7 6.3 26,263.1 1.3
Normal 25,964.9 24,426.0 6.3 25,583.1 1.5
Precautionary 173.6 142.6 21.7 209.1 △17.0
Substandard 301.2 257.6 16.9 278.2 8.3
Doubtful 63.5 93.2 △31.9 72.5 △12.4
Expected Loss 102.1 115.3 △11.4 120.2 △15.1
SBL(Substandard & Below Loans) 466.7 466.1 0.1 470.9 △0.9
(SBL Ratio (%)) (1.75) (1.86) △0.11 (1.79) △0.04
(SBL Coverage Ratio) (97.06) (100.44) △3.38 (100.93) △3.87
Loan Amount 26,192.7 24,598.3 6.5 25,867.4 1.3
Delinquent Amount 245.0 134.2 82.6 279.4 △12.3
Delinquency Ratio 0.94 0.55 0.39 1.08 △0.14
SBL(NPL) Ratio Delinquency Ratio
2. Banks Asset Quality – Kyongnam

www.bsfng.com 22
3. Provisioning
Group Provision Expense
(KRW bn,%)
2014 2013
2014.12 4Q 3Q 2Q 1Q 2013.12 4Q 3Q 2Q 1Q
Total Provisions(A) 279.5 113.1 51.2 53.6 61.6 228.8 101.0 48.0 36.1 43.7
Total Credit(B) 65,274.1 65,274.1 38,190.9 37,197.7 35,960.6 34,432.3 34,432.3 34,317.1 33,625.9 32,505.7
1)Credit Cost(A/B) 0.43 0.69 0.53 0.58 0.69 0.66 1.16 0.55 0.43 0.55
(KRW bn,%)
2014 2013
2014.12 4Q 3Q 2Q 1Q 2013.12 4Q 3Q 2Q 1Q
Corporate 146.3 29.3 32.7 65.5 18.8 147.0 88.6 27.9 17.6 12.9
Household 14.0 3.2 3.3 4.3 3.2 5.2 1.5 1.9 1.0 0.8
Credit Card 5.7 0.9 0.7 1.8 2.3 11.0 2.3 2.5 3.3 2.9
Trust 31.7 3.9 0.5 1.0 21.7 45.8 20.8 △9.6 8.3 26.3
Total(A) 197.7 37.3 41.8 72.6 46.0 209.0 113.2 22.7 30.2 42.9
Total Credit(B) 26,605.3 26,605.3 26,263.1 25,805.4 25,368.8 25,034.7 25,034.7 24,774.6 24,186.5 22,953.2
1)Credit Cost(A/B) 0.74 0.55 0.63 1.13 0.74 0.83 1.79 0.36 0.50 0.76
(KRW bn,%)
2014 2013
2014.12 4Q 3Q 2Q 1Q 2013.12 4Q 3Q 2Q 1Q
Corporate 132.8 24.4 30.3 43.3 34.8 119.0 47.8 28.8 18.0 24.4
Household 2.3 1.0 △1.6 1.7 1.2 2.0 △0.3 0.6 0.0 1.7
Credit Card 8.7 2.7 1.3 2.0 2.7 7.2 1.6 1.8 1.7 2.1
Trust 10.0 21.1 △2.2 △10.3 1.4 7.3 9.5 △2.9 0.2 0.5
Total(A) 153.8 49.2 27.8 36.7 40.1 135.5 58.6 28.3 19.9 28.7
Total Credit(B) 34,500.7 34,500.7 34,244.6 33,464.6 32,419.8 31,050.7 31,050.7 31,218.2 30,762.6 29,993.5
1)Credit Cost(A/B) 0.45 0.57 0.32 0.44 0.50 0.44 0.75 0.36 0.26 0.39
Busan Bank Provision Expense
Note 1). Accumulated
Kyongnam Bank Provision Expense

www.bsfng.com 23
4. Banks Write-Offs and NPL Sales
(KRW bn, %) 2014.12 14.4Q 14.3Q 14.2Q 14.1Q 2013.12 13.4Q 13.3Q 13.2Q 13.1Q YoY
Total Write-Offs 151.5 40.4 70.9 17.9 22.3 116.4 54.6 23.3 17.2 21.3 30.2
Corporate 130.1 33.6 65.3 13.2 18.0 96.9 49.1 18.3 13.5 16.0 34.3
Household 9.6 3.0 2.6 2.2 1.8 8.0 1.8 1.9 1.6 2.7 20.0
Credit Card 11.8 3.8 3.0 2.5 2.5 11.5 3.7 3.1 2.1 2.6 2.6
Total NPL Sales 64.2 0.0 0.0 36.7 27.5 159.4 62.1 23.4 48.8 25.1 △59.7
(NPL Sales for SBL Loans) (60.8) (0.0) (0.0) (36.4) (24.4) (153.3) (60.8) (21.0) (47.5) (24.0) △60.3
Corporate 62.1 0.0 0.0 35.7 26.4 146.0 60.2 20.3 40.6 24.9 △57.5
Household 1.4 0.0 0.0 0.6 0.8 12.5 1.7 3.0 7.8 0.0 △88.8
Credit Card 0.7 0.0 0.0 0.4 0.3 0.9 0.2 0.1 0.4 0.2 △22.2
Busan Bank Write-Offs & NPL Sales
Kyongnam Bank Write-Offs & NPL Sales
(KRW bn, %) 2014.12 14.4Q 14.3Q 14.2Q 14.1Q 2013.12 13.4Q 13.3Q 13.2Q 13.1Q YoY
Total Write-Offs 223.0 87.5 44.8 19.7 71.0 86.0 36.3 23.4 7.8 18.5 159.3
Corporate 208.7 82.7 40.8 16.8 68.4 74.2 32.8 19.3 5.7 16.4 181.3
Household 6.9 2.6 2.2 1.0 1.1 3.8 1.7 0.9 0.6 0.6 81.6
Credit Card 7.4 2.2 1.8 1.9 1.5 8.0 1.8 3.2 1.5 1.5 △7.5
Total NPL Sales 107.8 53.5 0.0 54.3 0.0 82.6 39.3 0.0 0.0 43.3 30.5
(NPL Sales for SBL Loans) (102.8) (51.4) (0.0) (51.4) (0.0) (81.7) (38.4) (0.0) (0.0) (43.3) (25.8)
Corporate 102.0 49.2 0.0 52.8 0.0 82.2 38.9 0.0 0.0 43.3 24.1
Household 5.7 4.2 0.0 1.5 0.0 0.3 0.3 0.0 0.0 0.0 1,800.0
Credit Card 0.1 0.1 0.0 0.0 0.0 0.1 0.1 0.0 0.0 0.0 0.0
www.bsfng.com 24
Ⅴ. Capital Adequacy
1. Group Capital Adequacy 25
2. Banks Capital Adequacy 26

www.bsfng.com 25
1. Group Capital Adequacy
Group Group, Busan, Kyongnam Bank Capital Adequacy
BIS
13.85
BIS
14.72
BIS
11.91 Tier I
9.75
Tier I
11.08
Tier I
8.17
Core Tier I
9.46
Core Tier I
10.82
Core Tier I
7.69
5.00
10.00
15.00
20.00
4Q13 3Q14 4Q14
BIS
14.61 BIS
13.23
BIS
13.30 Tier I
10.76 Tier I
9.63
Tier I
9.68
Core Tier I
10.43 Core Tier I
9.32
Core Tier I
9.38
5.00
10.00
15.00
20.00
4Q13 3Q14 4Q14
BIS
13.66 BIS
12.43
BIS
12.74
Tier I
9.71 Tier I
8.94 Tier I
8.59 Core Tier I
8.35 Core Tier I
8.00 Core Tier I
7.65
5.00
10.00
15.00
20.00
4Q13 3Q14 4Q14
(%)
(%)
(%)
(KRW bn,%, Basel III Standard)
2014
2013
4Q
4Q 3Q
Total Risk Adjusted Capital 7,337.5 5,486.8 4,684.9
Tier I Capital 5,033.2 4,127.6 3,299.3
(Core Tier I Capital) (4,736.0) (4,030.1) (3,199.3)
Tier II Capital 2,304.3 1,359.2 1,385.6
Total Risk Weighted Assets 61,614.1 37,262.2 33,822.9
Credit Risk 57,607.9 34,624.8 31,430.2
Market Risk 232.8 262.0 140.4
Operational Risk 3,773.4 2,375.4 2,252.3
BIS Capital Ratio 11.91 14.72 13.85
Tier I 8.17 11.08 9.75
(Core Tier I) (7.69) (10.82) (9.46)
*Group
*Kyongnam
*Busan

www.bsfng.com 26
2. Banks Capital Adequacy
(KRW bn,%, Basel III Standard)
2014
2013
4Q
4Q 3Q
Total Risk Adjusted Capital 4,405.6 4,391.4 4,456.1
Tier I Capital 3,205.2 3,194.7 3,281.2
(Core Tier I Capital) (3,105.4) (3,094.9) (3,181.2)
Tier II Capital 1,200.4 1,196.7 1,174.9
Total Risk Weighted Assets 33,123.3 33,191.7 30,492.7
Credit Risk 31,011.8 31,061.1 28,442.8
Market Risk 134.2 151.8 92.9
Operational Risk 1,977.3 1,978.8 1,957.0
BIS Capital Ratio 13.30 13.23 14.61
Tier I 9.68 9.63 10.76
(Core Tier I) (9.38) (9.32) (10.43)
Busan Bank Kyongnam Bank
(KRW bn,%, Basel III Internal Rating Based)
2014
2013
4Q
4Q 3Q
Total Risk Adjusted Capital 2,706.5 2,651.6 2,863.5
Tier I Capital 1,825.2 1,907.1 2,034.9
(Core Tier I Capital) (1,625.5) (1,707.4) (1,750.8)
Tier II Capital 881.4 744.5 828.6
Total Risk Weighted Assets 21,251.0 21,340.1 20,956.6
Credit Risk 19,824.3 19,867.3 19,584.4
Market Risk 59.0 104.0 70.9
Operational Risk 1,367.8 1,368.8 1,301.4
BIS Capital Ratio 12.74 12.43 13.66
Tier I 8.59 8.94 9.71
(Core Tier I) (7.65) (8.00) (8.35)

www.bsfng.com 27
Ⅵ. Appendix
1. Banks Corporate Loan Portfolio 28
2. Non-Bank Summary 29
3. Group Networks & Major Industries 34

www.bsfng.com 28
1. Banks Corporate Loan Portfolio
(KRW bn, %, Balance)
2014 4Q
Amount Ratio QoQ YTD
Manufacturing Sectors 9,574.6 39.8 △1.0 7.8
Steel Metal Products 2,870.3 11.9 0.1 9.9
Automobile Parts 2,181.8 9.1 0.5 11.3
Machinery 1,361.0 5.7 0.1 13.9
Petroleum, Rubber, etc. 1,046.0 4.3 △1.9 6.5
Fabric 211.7 0.9 △7.0 3.0
Garment & Shoes 251.2 1.0 △5.9 2.5
Kitchen Units 289.5 1.2 7.7 14.3
Electronics 635.0 2.6 △1.5 0.6
Paper, Paper Mills 106.0 0.4 △1.8 13.1
Others 622.1 2.6 △10.2 △12.0
Non-Manufacturing 14,477.0 60.2 1.0 12.9
Wholesale & Retail 2,354.7 9.8 0.3 5.7
Public 540.5 2.2 △3.3 2.8
Construction & Engineering 2,025.7 8.4 △6.5 10.1
Real Estate & Lease 4,154.2 17.3 5.6 22.1
Insurance & Financing 515.5 2.1 △3.4 △1.7
Transportation 1,420.7 5.9 1.8 6.6
Hotel & Food 745.7 3.1 4.2 32.5
Others 2,720.0 11.3 1.4 12.7
Total 24,051.6 100.0 0.2 10.8
(KRW bn, %, Balance)
2014 4Q
Amount Ratio QoQ YTD
Manufacturing Sectors 10,400.6 62.2 △1.7 2.9
Steel Metal Products 2,639.4 15.8 △0.3 5.4
Automobile Parts 2,797.1 16.7 △2.0 1.5
Machinery 2,890.4 17.3 △1.2 3.2
Petroleum, Rubber, etc. 295.5 1.8 △9.5 △2.6
Fabric 71.9 0.4 2.7 △27.4
Garment & Shoes 33.0 0.2 △16.9 17.9
Kitchen Units 169.6 1.0 △3.5 △9.8
Electronics 673.4 4.0 △4.0 △0.1
Paper, Paper Mills 85.3 0.5 2.9 27.5
Others 745.0 4.5 △1.7 7.7
Non-Manufacturing 6,318.0 37.8 0.6 5.7
Wholesale & Retail 1,345.0 8.0 △1.4 4.8
Public - 0.0 - -
Construction & Engineering 447.5 2.7 2.4 △5.7
Real Estate & Lease 1,990.4 11.9 2.0 16.0
Insurance & Financing 149.9 0.9 3.5 △11.1
Transportation 489.5 2.9 1.0 7.8
Hotel & Food 337.6 2.0 △0.2 8.0
Others 1,558.1 9.3 0.0 △0.9
Total 16,718.6 100.0 △0.8 3.9

www.bsfng.com
BS Securities B/S Summary
BS Securities I/S Summary
29
(KRW bn, %, Balance) 14.4Q 14.3Q YTD 14.3Q QoQ
Assets 512.0 495.5 3.3 780.7 △34.4
Cash and Dues 75.7 31.4 141.1 40.1 88.8
Securities 362.7 397.5 △8.8 428.3 △15.3
Loans 43.1 24.6 75.2 23.7 81.9
Fixed Assets 1.8 2.1 △14.3 1.8 0.0
Other Assets 28.7 39.9 △28.1 286.8 △90.0
Liability &
Shareholder’s Equity 512.0 495.5 3.3 780.7 △34.4
Deposits 84.7 47.6 77.9 37.8 124.1
Borrowings 287.3 306.6 △6.3 378.7 △24.1
Other Liabilities 22.4 29.4 △23.8 250.1 △91.0
Shareholder’s Equity 117.6 111.9 5.1 114.1 3.1
(KRW bn, %, Balance) 2014 2013 YoY 14.4Q 14.3Q QoQ
Net Interest Income 5.3 9.3 △43.0 1.4 1.3 7.7
Fee Income 17.4 10.6 64.2 5.0 4.9 2.0
Others 14.3 8.1 76.5 6.5 3.0 116.7
SG&A(-) 29.1 26.1 11.5 8.5 7.0 21.4
Provision Expense(-) 0.0 0.0 - 0.0 0.0 -
Non-Operating Income △0.2 △1.3 - △0.2 0.0 -
Earnings Before Income Tax 7.7 0.6 1,183.3 4.2 2.2 90.9
Income Tax Expenses(-) 2.0 0.3 566.7 1.0 0.6 66.7
Net Income 5.7 0.3 1,800.0 3.2 1.6 100.0
2. Non-Bank Summary - Securities

www.bsfng.com
BS Capital B/S Summary
BS Capital I/S Summary
30
(KRW bn, %, Balance)
14.4Q 14.3Q YTD 14.3Q QoQ
Assets 3,583.3 2,809.8 27.5 3,461.5 3.5
Cash and Dues 47.8 41.1 16.3 75.9 △37.0
Securities 0.0 0.0 - 0.0 -
Loans 1,854.6 965.1 92.2 1,378.9 34.5
Venture Capital Business 2.0 0.0 - 2.0 0.0
Durables Installment
Financing Assets 744.8 929.8 △19.9 1,071.9 △30.5
Leased Assets 878.6 826.9 6.3 885.5 △0.8
Fixed Assets 4.6 3.9 17.9 4.3 7.0
Other Assets 50.9 43.0 18.4 43.0 18.4
Liability & Shareholder’s Equity 3,583.3 2,809.8 27.5 3,461.5 3.5
Borrowings 2,871.7 2,234.5 28.5 2,814.8 2.0
Other Liabilities 288.9 268.6 7.6 282.3 2.3
Shareholder’s Equity 422.7 306.7 37.8 364.4 16.0
(KRW bn, %, Balance)
2014 2013 YoY 14.4Q 14.3Q QoQ
Net Interest Income 157.0 122.3 28.4 42.7 39.8 7.3
Fee Income 14.6 10.3 41.7 3.9 4.3 △9.3
Others 5.7 3.2 78.1 1.3 2.1 △38.1
SG&A(-) 43.9 32.1 36.8 13.5 10.9 23.9
Provision Expense(-) 86.5 65.4 32.3 24.3 22.0 10.5
Non-Operating Income 0.0 △0.8 - 0.0 0.0 -
Earnings Before Income Tax 46.9 37.5 25.1 10.1 13.3 △24.1
Income Tax Expenses(-) 10.6 9.0 17.8 2.0 3.1 △35.5
Net Income 36.3 28.5 27.4 8.1 10.2 △20.6
2. Non-Bank Summary - Capital

www.bsfng.com 31
(KRW bn, %, Balance)
4Q14 Portion QoQ 3Q14 2Q14 1Q14 4Q13
Total 3,536.0 100.0 4.6 3,380.8 3,172.7 2,966.1 2,730.5
Loans 914.9 25.9 3.9 880.5 820.6 782.9 711.8
Household 515.7 14.6 4.7 492.6 452.2 429.8 399.1
Corporate 399.2 11.3 2.9 387.9 368.4 353.1 312.7
Auto Financing 1,800.7 50.9 6.7 1,687.1 1,566.4 1,426.5 1,284.5
Commercial Vehicle 581.1 16.4 3.6 560.7 548.0 529.6 490.5
Passenger Vehicle 1,219.6 34.5 8.3 1,126.4 1,018.4 896.9 794.0
Lease/Installments 818.4 23.1 0.9 811.2 783.7 756.7 734.2
Machine Tools 259.0 7.3 △4.9 272.3 282.0 281.6 271.6
Medical Instruments 170.7 4.8 △4.0 177.9 193.4 199.7 203.0
Others 388.7 11.0 7.7 361.0 308.3 275.4 259.6
Venture Capital Business 2.0 0.1 0.0 2.0 2.0 - -
2. Non-Bank Summary - Capital Portfolio

www.bsfng.com
BS MSB B/S Summary
BS MSB I/S Summary (The Fiscal Year End is June 30)
32
(KRW bn, %, Balance) 14.4Q 14.3Q YTD 14.3Q QoQ
Total Assets 736.1 743.4 △1.0 722.5 2.9
Total Deposits 588.7 609.6 △3.4 570.7 6.8
KRW Deposits 588.7 609.6 △3.4 570.7 6.8
Others 0.0 0.0 - 0.0 -
Total Credits 584.0 627.1 △6.9 531.0 18.1
Total Loans 584.0 627.1 △6.9 531.0 18.1
KRW Loans 567.0 606.3 △6.5 517.5 17.2
Others 17.0 20.8 △18.3 13.5 54.1
Guarantees 0.0 0.0 - 0.0 -
Total Securities 4.5 4.7 △4.3 4.5 4.4
Shareholder’s Equity 118.7 108.2 9.7 119.1 △9.2
(KRW bn, %, Balance) 2014 2013 YoY 14.4Q 14.3Q QoQ
Net Interest Income 28.8 35.5 △18.9 7.4 6.4 15.6
Fee Income △0.1 △0.2 - 0.1 0.0 -
Others 0.1 △4.8 Net Gain 1.0 0.5 100.0
SG&A(-) 12.8 12.4 3.2 3.5 3.2 9.4
Provision Expense(-) 1.9 27.9 △93.2 2.3 1.4 64.3
Non-Operating Income △3.6 △1.7 - △3.1 0.0 -
Earnings Before Income Tax 10.5 △11.5 Net Gain △0.4 2.3 Net Loss
Income Tax Expenses(-) 0.0 0.4 △100.0 0.0 △0.1 -
Net Income 10.5 △11.9 Net Gain △0.4 2.4 Net Loss
2. Non-Bank Summary - MSB

www.bsfng.com
BS Credit Information I/S Summary
33
(KRW bn, %, Balance) 2014 2013 YoY 14.4Q 14.3Q QoQ
Net Interest Income 0.1 0.2 △50.0 0.0 0.0 -
Fee Income 2.8 2.8 0.0 0.7 0.7 0.0
Others 0.0 0.0 - 0.0 0.0 -
SG&A(-) 2.3 2.0 15.0 0.6 0.6 0.0
Provision Expense(-) 0.0 0.0 - 0.0 0.0 -
Non-Operating Income 0.0 0.0 - 0.0 0.0 -
Earnings Before Income Tax 0.6 1.0 △40.0 0.1 0.1 0.0
Income Tax Expenses(-) 0.1 0.3 △66.7 0.0 0.0 -
Net Income 0.5 0.7 △28.6 0.1 0.1 0.0
BS Information System I/S Summary
(KRW bn, %, Balance) 2014 2013 YoY 14.4Q 14.3Q QoQ
Net Interest Income 0.0 0.1 - 0.0 △0.1 -
Fee Income 0.0 0.0 - 0.0 0.0 -
Others 8.0 6.9 15.9 2.1 2.1 0.0
SG&A(-) 7.1 6.2 14.5 2.0 1.7 17.6
Provision Expense(-) 0.0 0.0 - 0.0 0.0 -
Non-Operating Income 0.0 0.2 - 0.0 0.0 -
Earnings Before Income Tax 0.9 1.0 △10.0 0.1 0.3 △66.7
Income Tax Expenses(-) 0.2 0.2 0.0 0.0 0.1 △100.0
Net Income 0.7 0.8 △12.5 0.1 0.2 △50.0
2. Non-Bank Summary – Credit Info., Info. System

www.bsfng.com
3. Group Networks & Major Industries
34
Population & Major Industries
- Southeastern Conurbation (7.6M, 15.6% of Total Population),
making up 16.7% of GRDP(2013)
- Exports : 158.5 USD bn(2014)
- Imports : 121.5 USD bn(2014)
1) Southeastern region includes Busan, Ulsan, and Kyongnam
Networks across Korea(as of December 2014) : 467 Locations - Busan Bank 273(Qingdao Branch, Vietnam Office included),
Kyongnam Bank 161, BS Securities 4, BS Capital 22, BS MSB 7
Daegu
Busan Bank 1
Kyongnam Bank 1
BS Capital 1
Seoul
Busan Bank 4
Kyongnam Bank 3
BS Securities 1
BS Capital 3
BS MSB 4
Chungbuk
Province
BS Capital 1
Daejeon
Busan Bank 1
Kwangju
Busan Bank 1
BS Capital 1
Jeju
BS Capital 1 Kyongnam
Province
Busan Bank 28
Kyongnam Bank 104
BS Capital 2
Chungnam
Province
BS Capital 1
Kyongbuk
Province
Busan Bank 3
Kyongnam Bank 3
BS Capital 2
Inchon
& Kyonggi
Busan Bank 1
BS Capital 5
Busan
Busan Bank 220
Kyongnam Bank 15
BS Securities 3
BS Capital 2
BS MSB 3
Jeonbuk
Province
BS Capital 1
Ulsan
Busan Bank 12
Kyongnam Bank 35
BS Capital 1
Ulsan
11.0M
Busan Metropolitan
42.0M Changwon
11.0M
Jinju
0.4M
Geoje
2.0M
Machinery & Electronics
Aerospace
Shipbuilding
Auto, Shipbuilding, Chemical
Auto & Shipbuilding Parts,
Machinery, Steel Metal Products
POSCO Steel
Pohang
5.0M
Milyang
1.0M Nano


