27
Board of Trustees Revised FY18 Spending Plan December 13, 2017 For UConn Storrs and Regionals & UConn Health

Board of TrusteesRevised FY18 Spending Plan
December 13 2017
For UConn Storrs and Regionals amp UConn Health
Agenda
1 State Budget Impact for UConn
2 UConn Storrs and Regionals - Updated Spending Plan
3 UConn Health - Updated Spending Plan
December 13 2017 2
State Budget Cuts to UConnThe negotiated State budget represents a nearly $143M cut to UConn through the biennium Additionally $214M of cuts due to lapses have been received These are dramatic reductions and will impact faculty students staff and patients at UConn
Additional Lapses Salary (7922416)$ -4 Salary (4744276)$ -4Fringe (5466467)$ Fringe (3273688)$
(13388883)$ (8017964)$ (21406847)$
December 13 2017 3
FY18 Comparison from June Budget
AppropriationFY 2017
Governor Revised FY2018
BOT (51517)
Negotiated Budget FY18
102417
AppropriationFY 2017
Governor Revised FY2018
BOT (51517)
Negotiated Budget FY18
102417
Appropriation 229917913 211242025$ 199253349$ 134539312$ 125474563$ 122427151$ Fringe Reimbursement 158643360 145756997$ 139729547$ 101283032$ 94749284$ 94734894$ TOTAL STATE SUPPORT 388561273 356999022$ 338982896$ 235822344$ 220223847$ 217162045$
Appropriation Cut (18675888)$ (30664564)$ (9064749)$ (12112161)$ Associated fringe cut (12886363)$ (18913813)$ (6533748)$ (6548138)$ TOTAL STATE SUPPORT CUT (31562251)$ (49578377)$ (15598497)$ (18660299)$
-81 -128 -66 -79Variance from FY18 BOT approved budget (18016126)$ (3061802)$ (21077928)$
UCONN UCONN HEALTH
Compared to the BOT approved budget in June the negotiated State budget is an additional overall cut of $42M representing $31M for UConn and $11M for UCH
Additional Lapses Salary (7922416)$ (4744276)$
Fringe (5466467)$ (3273688)$
(13388883)$ (8017964)$ (21406847)$
TOTAL Variance from FY18 BOT approved budget (31405009)$ (11079766)$ (42484775)$
December 13 2017 4
Balancing the Budget in FY18In order to achieve a balanced budget for FY18 the University has
bull Implemented significant University-wide spending cuts bull Enforced a prudent and strategic freeze on hiring bull Increased undergraduate enrollmentbull Enrolled more studentsbull Identified new revenue streams
bull Bookstore self-supporting programs etcbull Enhanced payments for physician servicesbull 340B retail pharmacy
bull Increased tuition (per four year plan)bull Identified and implemented efficienciesbull Deferred delayed or cancelled capital projects and deferred
maintenanceAdditional mid-year cuts would have serious implications for the entire UConn community
December 13 2017 5
Revised FY18 Spending Plan UConn and UConn Health Combined FY18 Spending Plan
Spending plan above includes $13255M for UConn Storrs and Regionals and $10895M for UConn Health
Appropriation 3090 Personal Services 8859 Fringe Benefits amp Adjustments 2415 Fringe Benefits 4835 Total State Support 5506$ Correctional Managed Health Care 804 Tuition 4184 DrugsMedical Supplies 852 Fees 1409 MedicalDental House Staff 542 Grants amp Contracts 1674 ServicesRepairMaintenance 1930 Auxiliary Enterprise Revenue 2201 Other Expenses 2214 InternsResidents 667 Student Financial Aid 1727 Net Patient Revenue 4827 Debt ServiceProjects 623 Correctional Managed Health Care 804 Total Operating Fund 22386$ Other Revenue 1135
Research Fund 1764 Total Operating Fund 22405$
Total Operating Expenditures 24150$ Research Fund 1750
Net GainLoss 06$ Total Current Funds Revenues 24156$
Expenditures ($M)Revenues ($M)
December 13 2017 6
Impact of Cuts to UConn
bull UConn has carefully and effectively managed its finances to balance the budget and maintain academic quality in the face of major reductions in State support and rising costs over the last few years The cuts in the biennium are significant and will impact every aspect of UConn
bull UConnrsquos goals are shifting from continuing to focus on protecting academic excellence delivering strong student support providing excellent patient care and supporting the research mission of the University to simply attempting to maintain our current position
bull Ongoing and mid-year cuts thwart our ability to forecast and plan effectively Continual significant cuts reduce the quality of the education UConn is able to offer and reduces the Universityrsquos ability to effectively contribute to the State and its economy
December 13 2017 7
UConn Successes At Risk
UConn successesbull Top 25 Public National University (18th) in US News and World Reportbull Opened new Downtown Hartford campus locationbull Decreased average time to degree to 42 years (4th among Peers)bull Increased number of class offerings by 33 bull Fall 2017 entering class included 81 valedictorians and 80 salutatorians
UConn Health successesbull Climbed to 56th in research and 34th in primary care categories in US News and
World Report rankingsbull ldquoArdquo rating for patient safety The Leapfrog Group 2015 2016 amp 2017bull Dental School received Geis Award for Excellencebull Increased average monthly emergency room visits to over 3000bull Expansion of programs including neurosurgery epilepsy monitoring unit sickle cell
and health disparities
The University has made significant gains and improved academic quality over the last several years These are now at risk due to the current fiscal climate and continual cuts
December 13 2017 8
Long Term Financial Challenges
UConn has carefully and effectively managed the budget despite deep cuts to the budget over the last few years Looking forward the University is facing troubling financial challenges and asks the State for stable funding
Some long term financial concerns includebull SEBAC provides a 55 increase in FY20 and FY21 which is
equivalent to $59M and $66M respectivelybull Fringe growth is projected to grow at 15 annually or $166M in
additional expenses per yearbull SEBAC provides a ldquono layoffrdquo provision Approximately 56 of
UConnrsquos costs are personnelbull Tuition Plan ends in FY20bull Patient revenues are unpredictable due to payor mix volume and
reimbursement rates
December 13 2017 9
Revised Spending PlanStorrs and Regionals
FY18 Budget Cuts
AppropriationFY 2017
Negotiated Budget FY18
102417
Negotiated Budget FY19
102417
TOTAL BIENNIUM CUT
Appropriation 229917913 199253349$ 196119593$ Fringe Reimbursement 158643360 139729547$ 135322519$ TOTAL STATE SUPPORT 388561273 338982896$ 331442112$
APPROPRIATION CUT (30664564)$ (33798320)$ (64462884)$ Associated fringe cut at 69 (in dollars) (18913813)$ $ (23320841) $ (42234654)TOTAL STATE SUPPORT CUT (49578377)$ (57119161)$ (106697538)$
TOTAL CUT (106697538)$ Cut -14
UCONN
Additional Lapses Salary (7922416)$ -4Fringe (5466467)$
(13388883)$
Storrs and Regionals
For Storrs and Regional Campuses the State budget represents a $107M cut in the biennium from the FY17 appropriation Additionally we received a $13M cut due to lapses
December 13 2017 11
Lapses = the amount of appropriation held back that is retained by OPM to achieve savings assumed in the overall State budget
Revised FY18 Spending Plan
Note Use of decimals may result in rounding differences
With a hiring freeze cost cutting new revenue streams and expense avoidance UConn projects a balanced budget for FY18 despite State cuts
Appropriation 1913 Personal Services 4947 Fringe Benefits amp Adjustments 1358 Fringe Benefits 2513 Total State Support 3272$ Other Expenses 2105 Tuition 3984 Energy 229 Fees 1365 Equipment 205 Grants amp Contracts 825 Student Financial Aid 1727 FoundationEndowment 210 Debt ServiceProjects 449 Sales amp Services 199 Total Operating Fund 12175$ Auxiliary Enterprise Revenue 2201 Other Revenue 139 Research Fund 1080
Total Operating Fund 12194$ Total Operating Expenditures 13255$
Research Fund 1066 Net GainLoss 06$
Total Current Funds Revenues 13261$
Revenues ($M) Expenditures ($M)
Storrs and Regionals
December 13 2017 12
State Appropriation
FY18 $1993
$160
$180
$200
$220
$240
$260
FY00 FY02 FY04 FY06 FY08 FY10 FY12 FY14 FY16 FY18
Allotment Appropriation $200M Baseline
(In Millions)
Allotment includes reductions due to lapses rescissions and deficit mitigation
UConnrsquos State Appropriation hasnrsquot dropped below $200M since 2004 With the lapses UConnrsquos allotment for FY18 is currently $191M
Storrs and Regionals
December 13 2017 13
UConn Growth Since 2004
Since 2004 UConn has increased
bull Enrollment by 5434 undergraduate and graduate students
bull Faculty count by 410
bull US News and World Report ranking from 25 to 18
bull Applications up to 37000 for Fall 2017 an increase of 97
bull Institutional financial aid by $902M
bull Degrees awarded annually by 2521
Storrs and Regionals
December 13 2017 14
FY18 Comparison
Note Use of decimals may result in rounding differences
Increased enrollment gains in other revenue sources hiring freeze restricted spending and reductions in capital projects and deferred maintenance helped offset State cuts
Storrs and Regionals
December 13 2017 15
FY18 Original BOT Budget
($M)
FY18 Revised Budget
($M)
Favorable (Unfavorable)
($M)Notes
Appropriation 2112 1913 (199) Revised State Appropriation Includes $79M in lapsesFringe Benefits amp Adjustments 1469 1358 (110) Fringe estimated at 71 Includes $55M in lapses Total State Support 3581$ 3272$ (309)$ Tuition 3901 3984 83 150 more students 352 additional international studentsFees 1348 1365 17 Increased enrollmentGrants amp Contracts 775 825 50 Increase in Pell funding and other scholarships from budgeted amount FoundationEndowment 195 210 15 Increased Foundation usage to offset cutsSales amp Services 183 199 16 Based on FY17 year end actuals and first quarter resultsAuxiliary Enterprise Revenue 2201 2201 - Housing Dining and Athletics are on targetOther Revenue 159 139 (20) Some shift to expense reduction revenues trending slightly downward
Total Operating Fund 12343$ 12194$ (149)$ Increase in revenue streams helps offset the State cuts
Research Fund 1066 1066 -
Total Current Funds Revenues 13410$ 13261$ (149)$
Personal Services 4962 4947 15 Additional hiring restrictions on top of budgeted personnel reductionsFringe Benefits 2483 2513 (30) Final FY18 fringe rates are higher than FY17 but lower than wo SEBACOther ExpensesEquipment 2338 2310 28 Cost cutting expense avoidance and careful spendingEnergy 249 229 20 Based on FY17 year-end actuals and first quarter resultsStudent Financial Aid 1659 1727 (67) Increase in Pell funding ($4M) and other scholarships Debt ServiceProjects 621 449 171 Reduction in capital projects and deferred maintenance
Total Operating Fund 12312$ 12175$ 137$
Research Fund 1080 1080 -
Total Current Funds Expenditures 13392$ 13255$ 137$
Net Gain(Loss) Loss 18$ 06$ (12)$
FY18 Revenue by CategoryState support is an important and significant piece of the budget however in FY18 tuition will be the largest revenue source at over 30 of total revenues
Note Use of decimals may result in rounding differences
Appropriation 1913 Fringe Benefits amp Adjustments 1358 Total State Support 3272$ Tuition 3984 Fees 1365 Grants amp Contracts 825 FoundationEndowment 210 Sales amp Services 199 Auxiliary Enterprise Revenue 2201 Other Revenue 139
Total Operating Fund 12194$
Research Fund 1066
Total Current Funds Revenues 13261$
Revenues ($M)
State Support247
Tuition300
Fees 103
Grants amp Contracts
62
Foundation 16Sales amp Services
15 Auxiliary Enterprise Revenue
166
Research Fund 78
Other Revenue
11
Storrs and Regionals
Tuition and Fees make up more than 40 of UConnrsquos budgeted revenues
December 13 2017 16
Tuition Revenue
FY17 was the first year that tuition surpassed State support as the largest revenue source The gap grows significantly in FY18 and FY19
$2461 $2599
$2698 $2904
$3197
$3534
$3775 $3984
$4220
$3290
$2824 $2885
$3081
$3507
$3845
$3740
$3272 $3314
$225
$260
$295
$330
$365
$400
$435
FY11 FY12 FY13 FY14 FY15 FY16 FY17 FY18Budget
FY19Budget
State Support and Tuition Revenue
Tuition
State Support
$91M
Storrs and Regionals
UConn enrollment growth and increased rates have resulted in overall tuition revenue increases
December 13 2017 17
FY18 Expense by Category
Note Use of decimals may result in rounding differences
Salary and Fringe Benefits are the largest expense for the University at 563 of the total with Other Expenses accounting for 158 and Financial Aid at 13
Personal Services 4947 Fringe Benefits 2513 Other Expenses 2105 Energy 229 Equipment 205 Student Financial Aid 1727 Debt ServiceProjects 449 Total Operating Fund 12175$
Research Fund 1080
Total Operating Expenditures 13255$
Expenditures ($M)
Personal Services373
Fringe Benefits
190
Other Expenses
158
Energy17
Equipment15
Student Financial Aid
130
Debt ServiceProjects
34
Research Fund 81
Storrs and Regionals
Personnel costs represent more than 56 of the overall expense budget UConn will continue to restrict hiring and closely watch any spending to help maintain the balanced budget
December 13 2017 18
Rising Costs - Salary Expenses
Between FY11 and FY18 mandated salary increases due to union agreements cost UConn about $68M or 83 of the total salary growth
Other this category includes classified non-faculty professional (UCPEA) management confidential graduate assistant student amp special payroll
The majority of the growth in FY18 is due to graduate assistant contractual increases and additional police Per the SEBAC agreement FY18 includes no facultystaff salary increases
Salary Expenses ($M)
Storrs and Regionals
December 13 2017 19
$279 $272 $285 $305 $317 $326 $321 $320
$134 $143 $141$157 $166 $171 $175 $175
$0
$100
$200
$300
$400
$500
$600
FY11 FY12 FY13 FY14 FY15 FY16 FY17 FY18
FacultyAAUP
Other
$413 $414
$496
$425$462 $483 $497 $495
Revised Spending PlanUConn Health
State Budget CutsUConn Health
Compared to the BOT approved budget in June the negotiated State budget is an overall cut of $111M
December 13 2017 21
Updated FY18 Spending Plan
(Cash Sources and Uses)
Appropriation 1177 Personal Services 3912 Fringe Benefits amp Adjustments 1057 Fringe Benefits 2322 Total State Support 2234$ Correctional Managed Health Care 804 Tuition 200 DrugsMedical Supplies 852 Fees 44 Other Expenses 2147 Grants amp Contracts 849 Debt ServiceProjects 174 InternsResidents 667 Total Operating Fund 10211$ Net Patient Revenue 4827 Correctional Managed Health Care 804 Research and Restricted Expenditures 684 Other Revenue 586
Total Operating Fund 10211$ Total Operating Expenditures 10895$
Research and Restricted Funds 684
Total Current Funds Revenues 10895$ Net Gain(Loss) -$
Revenues ($M) Expenditures ($M)
UConn Health
UConn Health has achieved a balanced budget by implementing spending cuts restricting hiring and identifying new revenue streams
December 13 2017 22
FY18 Comparison
(Cash Sources and Uses)FY18
Original BOT Budget ($M)
FY18 Revised
Budget ($M)
Favorable (Unfavorable)
($M) NotesAppropriation 1254 1177 (77) Reduction in workers compensation and lapsesFringe Benefits amp Adjustments 1006 1057 51 increase due to increase in fringe ratesTotal State Support 2260$ 2234$ (26)$ Tuition 200 200 - Fees 44 44 - Grants amp Contracts 872 849 (23) First quarter resultsInternsResidents 667 667 - Net Patient Revenue 4751 4827 76 Enhanced payments and first quarter resultsCorrectional Managed Health Care 804 804 - Other Revenue 576 586 10 First quarter results - retail pharmacy Total Operating Fund 10174$ 10211$ 37$
Research and Restricted Funds 684 684 -
Total Current Funds Revenues 10858$ 10895$ 37$
Personal Services 3896 3912 (16) Implementation of final SEBAC provisionsFringe Benefits 2288 2322 (34) Implementation of final SEBAC provisionsCorrectional Managed Health Care 804 804 - DrugsMedical Supplies 847 852 (05) First quarter resultsOther Expenses 2165 2147 18 First quarter resultsDebt ServiceProjects 174 174 (00) Total Operating Fund 10174$ 10211$ (37)$
Research and Restricted Expenditures 684 684 -
Total Operating Expenditures 10858$ 10895$ (37)$
Net Gain(Loss) -$ -$ -$
UConn Health
Reductions in personnel costs and increased patient revenue offset State cuts
December 13 2017 23
Appendix
State Support
UConn Storrs and Regionals amp UConn Health have sustained $1638M in State reductions lost fringe and fund sweeps since 2010 ($1044M for Storrs and $594M for UCH)
Reductions = lapses rescissions and deficit mitigation
Appropriation Reduction Actual Allotment
Lost Fringe due to Reduction
Fund Sweeps Total Cut
FY10 3543 (35) 3508 (17) (180) (232) FY11 3523 (06) 3517 (03) (250) (259) FY12 3174 (33) 3141 (17) - (50) FY13 3188 (144) 3044 (72) - (216) FY14 3289 (13) 3276 (07) - (20) FY15 3650 (116) 3534 (61) - (177) FY16 3875 (30) 3845 (25) (172) (227) FY17 3644 (145) 3499 (98) - (243) FY18 3217 (126) 3091 (88) - (214) TOTAL $ (648) $ (388) $ (602) $ (1638)
UConn TOTAL - Combined Reductions Fringe (lost) and Fund Sweeps ($M)
December 13 2017 25
FY18 Revenue by Category
Appropriation 1177 Fringe Benefits amp Adjustments 1057 Total State Support 2234$ Tuition 200 Fees 44 Grants amp Contracts 849 InternsResidents 667 Net Patient Revenue 4827 Correctional Managed Health Care 804 Other Revenue 586
Total Operating Fund 10211$
Research and Restricted Funds 684
Total Current Funds Revenues 10895$
Revenues ($M)
UConn Health
State support is the second largest revenue source at 22 of total revenue
December 13 2017 26
FY14FY15FY16FY17FY18-21-259-40-481-594Final Budget
FY14FY15FY16FY17FY18-11-125-159-159-18399999999999999ActualsForecast
FY14FY15FY16FY17FY18-155-29-126-197
Profit (Loss)
FY13 - FY18
UCH Profit (Loss)FY 2013FY 2014FY 2015FY 2016FY 2017 ForecastFY2018 Budget-72032769999999999-15458140999999999-28764539999999998-12564848-19688714999999998-594
State SupportTuitionFeesGrants amp ContractsInternsResidentsNet Patient RevenueCorrectional Managed Health CareOther Revenue22342044000000000000004849667482780400000000000006586
Personal ServicesFringe BenefitsCorrectional Managed Health CareDrugsMedical SuppliesOther ExpensesDebt ServiceProjectsResearch and Restricted Expenditures391223228040000000000000685221471740126000000000168400000000000006
amp8ampK00-024ampZampF
Differences in rates FY18 orig budget used 74 as a rate When estimating for medicagov relations Uconn storrs suggested we use the same rate at 69
For the revised BODBOT presentations used the 816 rate with the new appropriation
FY18 Gov $[VALUE]
FY10FY11FY12FY13FY14FY15FY16FY17FY18118972138119346347109669578112666627125542313135366969144290800134539312125474563 AllotmentFY10FY11FY12FY13FY14FY15FY16FY17FY18117734347119166814108458794108519733125018941131158966143898479130030646Democratic budget
FY18 Dem $[VALUE]
FY10FY11FY12FY13FY14FY15FY16FY17FY18134539312126820354Republican budget
FY18 Rep $[VALUE]
FY10FY11FY12FY13FY14FY15FY16FY17FY18134539312115249782
State Support and Net Patient Revenue
Net Patient Revenue
FY13FY14FY15FY16FY17 ForecastFY18 Budget358367701372814684431182934452366520457724062475098373Total State Support
FY13FY14FY15FY16FY17 ForecastFY18 Budget173192257213854874226796933235291486222513422218446953
Salary Expense ($M)
Faculty
201220132014201520162017 Forecast2018 Budget10730906310675877011258533911815635512336023712232893712468154592All Other Staff
201220132014201520162017 Forecast2018 Budget23385714823276053724060451024797392226323237126199454026494828507999998
John Dempsey Hospital vs Connecticut Hospital Association Fringe Rate
CHA rate
20052010201120122013201420152016201720180273899999999999980295403014031080000000000002030609999999999998028799999999999998028789999999999999029399999999999998029987999999999998030587759999999997JDH rate
2005201020112012201320142015201620172018038719999999999999044280000000000003044080000000000003043409999999999999046100989118483643053266397642863328054479050264180173057442497383828672059146205947123043066300000000000003
Fringe Benefit DifferentialFY 2013FY 2014FY 2015FY 2016FY 2017 ForecastFY2018 Budget135000001350000013500000135000001350000013500000Actual Hospital DifferentialFY 2013FY 2014FY 2015FY 2016FY 2017 ForecastFY2018 Budget170612883784000022559753009600000127567138709199995328022674020000063467286594704000743315787
1
2
3
4
5
6
7
8
9
A
B
C
Appropriation
1177
Fringe Benefits amp Adjustments
1057
Total State Support
2234
$
Tuition
200
Fees
44
Revenues ($M)
FY18 Expense by Category
Personal Services 3912 Fringe Benefits 2322 Correctional Managed Health Care 804 DrugsMedical Supplies 852 Other Expenses 2147 Debt ServiceProjects 174 Total Operating Fund 10211$
Research and Restricted Expenditur 684
Total Operating Expenditures 10895$
Expenditures ($M)
Personal Services
36
Fringe Benefits21Correctional
Managed Health Care7
DrugsMedical Supplies
8
Other Expenses20
Debt ServiceProjects
2
Research and Restricted
Expenditures6
UConn Health
Personnel costs make up 57 of UConn Healthrsquos overall expenditure budget
December 13 2017 27
FY14FY15FY16FY17FY18-21-259-40-481-594Final Budget
FY14FY15FY16FY17FY18-11-125-159-159-18399999999999999ActualsForecast
FY14FY15FY16FY17FY18-155-29-126-197
Profit (Loss)
FY13 - FY18
UCH Profit (Loss)FY 2013FY 2014FY 2015FY 2016FY 2017 ForecastFY2018 Budget-72032769999999999-15458140999999999-28764539999999998-12564848-19688714999999998-594
State SupportTuitionFeesGrants amp ContractsInternsResidentsNet Patient RevenueCorrectional Managed Health CareOther Revenue22342044000000000000004849667482780400000000000006586
Personal ServicesFringe BenefitsCorrectional Managed Health CareDrugsMedical SuppliesOther ExpensesDebt ServiceProjectsResearch and Restricted Expenditures391223228040000000000000685221471740126000000000168400000000000006
amp8ampK00-024ampZampF
Differences in rates FY18 orig budget used 74 as a rate When estimating for medicagov relations Uconn storrs suggested we use the same rate at 69
For the revised BODBOT presentations used the 816 rate with the new appropriation
FY18 Gov $[VALUE]
FY10FY11FY12FY13FY14FY15FY16FY17FY18118972138119346347109669578112666627125542313135366969144290800134539312125474563 AllotmentFY10FY11FY12FY13FY14FY15FY16FY17FY18117734347119166814108458794108519733125018941131158966143898479130030646Democratic budget
FY18 Dem $[VALUE]
FY10FY11FY12FY13FY14FY15FY16FY17FY18134539312126820354Republican budget
FY18 Rep $[VALUE]
FY10FY11FY12FY13FY14FY15FY16FY17FY18134539312115249782
State Support and Net Patient Revenue
Net Patient Revenue
FY13FY14FY15FY16FY17 ForecastFY18 Budget358367701372814684431182934452366520457724062475098373Total State Support
FY13FY14FY15FY16FY17 ForecastFY18 Budget173192257213854874226796933235291486222513422218446953
Salary Expense ($M)
Faculty
201220132014201520162017 Forecast2018 Budget10730906310675877011258533911815635512336023712232893712468154592All Other Staff
201220132014201520162017 Forecast2018 Budget23385714823276053724060451024797392226323237126199454026494828507999998
John Dempsey Hospital vs Connecticut Hospital Association Fringe Rate
CHA rate
20052010201120122013201420152016201720180273899999999999980295403014031080000000000002030609999999999998028799999999999998028789999999999999029399999999999998029987999999999998030587759999999997JDH rate
2005201020112012201320142015201620172018038719999999999999044280000000000003044080000000000003043409999999999999046100989118483643053266397642863328054479050264180173057442497383828672059146205947123043066300000000000003
Fringe Benefit DifferentialFY 2013FY 2014FY 2015FY 2016FY 2017 ForecastFY2018 Budget135000001350000013500000135000001350000013500000Actual Hospital DifferentialFY 2013FY 2014FY 2015FY 2016FY 2017 ForecastFY2018 Budget170612883784000022559753009600000127567138709199995328022674020000063467286594704000743315787
1
2
3
4
5
6
7
8
9
A
B
C
Personal Services
3912
Fringe Benefits
2322
Correctional Managed Health Care
804
DrugsMedical Supplies
852
Other Expenses
2147
Expenditures ($M)
| FY18 Bottom Line - Original Projection | (5940) | |||
| Other revenue | 320 | |||
| Institutional workforce | 1100 | |||
| Purchased services | 050 | |||
| Other expenses | 040 | |||
| Net patient revenue | 990 | |||
| Clinical workforce planning | 470 | |||
| Clinical non labor | 010 | |||
| Clinical revenue cycle | 090 | |||
| State support (Governors revised budget) | (240) | |||
| SEBAC (estimated savings) | 1270 | |||
| FY18 Bottom line - Proposed Budget | (1840) | |||
| 1) Comparison of Fringe rate with CHA average | ||||||||||||||||||||||||||
| 2) Fringe differential compared to actual hospital differential | ||||||||||||||||||||||||||
| note fy18 was updated to match proposed budget rate of 663 | ||||||||||||||||||||||||||
| John Dempsey Hospital vs Connecticut Hospital Association Fringe | ||||||||||||||||||||||||||
| FY | CHA rate | JDH rate | ||||||||||||||||||||||||
| 2005 | 274 | 387 | ||||||||||||||||||||||||
| 2006 | 289 | 371 | ||||||||||||||||||||||||
| 2007 | 277 | 401 | ||||||||||||||||||||||||
| 2008 | 280 | 411 | ||||||||||||||||||||||||
| 2009 | 271 | 412 | ||||||||||||||||||||||||
| 2010 | 295 | 443 | ||||||||||||||||||||||||
| 2011 | 301 | 441 | ||||||||||||||||||||||||
| 2012 | 311 | 434 | ||||||||||||||||||||||||
| 2013 | 306 | 461 | ||||||||||||||||||||||||
| 2014 | 288 | 533 | ||||||||||||||||||||||||
| 2015 | 288 | 545 | ||||||||||||||||||||||||
| 2016 | 294 | 574 | ||||||||||||||||||||||||
| 2017 | 300 | 591 | ||||||||||||||||||||||||
| 2018 | 306 | 663 | ||||||||||||||||||||||||
| Plan Description | FY2010-11 | FY2011-12 | FY2012-13 | FY2013-14 | FY2014-15 | FY2015-16 | FY2016-17 | FY2017-2018 Estimates | ||||||||||||||||||
| Alternate Retirement Program (ARP) | 1003 | 818 | 917 | 1120 | 1170 | 1199 | 1193 | 1300 | ||||||||||||||||||
| SERS Hazardous Duty | 3719 | 3687 | 4871 | 5895 | 6243 | 6251 | 6994 | 8900 | ||||||||||||||||||
| SERS Retirement Regular | 4000 | 3941 | 4601 | 5471 | 5050 | 5358 | 5499 | 6100 | ||||||||||||||||||
| Unemployment Compensation | 016 | 020 | 026 | 012 | 015 | 012 | 006 | 026 | ||||||||||||||||||
| 8738 | 8466 | 10415 | 12498 | 12478 | 12820 | 13692 | 16326 | |||||||||||||||||||
| -31 | 230 | 200 | -02 | 27 | 68 | 192 | ||||||||||||||||||||
| SERS Retirement Regular Rate Increases | 167 | 189 | -77 | 61 | 26 | 109 | ||||||||||||||||||||
| Average increase for Health insurance (approximate amounts) | 850 | 14 | 6 | 4 | 6 | |||||||||||||||||||||
| FY 2007 | FY 2008 | FY 2009 | FY 2010 | FY 2011 | FY 2012 | FY 2013 | FY 2014 | FY 2015 | FY 2016 | FY 2017 Forecast | FY2018 Budget | |||||||||||||||
| UCH Profit (Loss) | (26272245) | (23382917) | (22965602) | 3992933 | 3961289 | (2922761) | (7203277) | (15458141) | (2876454) | (12564848) | (21554857) | |||||||||||||||
| Deficiency Appropriation | 22100000 | 21900000 | 22200000 | - 0 | - 0 | - 0 | - 0 | - 0 | - 0 | - 0 | - 0 | |||||||||||||||
| Bioscience CT | - 0 | - 0 | - 0 | - 0 | - 0 | - 0 | 500000 | 11900724 | 16765958 | 12458333 | 10857600 | |||||||||||||||
| Fringe Benefit Differential | - 0 | - 0 | 3600000 | 13500000 | 13500000 | 13500000 | 13500000 | 13500000 | 13500000 | 13500000 | 13500000 | 13500000 | ||||||||||||||
| State Approp | 78614491 | 96797174 | 106012205 | 117734347 | 119166814 | 108458794 | 108019733 | 113118217 | 114393008 | 123432329 | 111649501 | |||||||||||||||
| UCH Profit (Loss)-after Deficiency Approp | (4172245) | (1482917) | (765602) | 3992933 | 3961289 | (2922761) | (7203277) | (15458141) | (2876454) | (12564848) | (21554857) | |||||||||||||||
| Actual Hospital Differential | 17061288 | 25597530 | 27567139 | 32802267 | 34672866 | 43315787 | ||||||||||||||||||||
| FY 2014 | FY 2015 | FY 2016 | FY 2017 Forecast | FY2018 Forecast | ||||||||||||||||||||||
| Debt Service (MARB and Outpatient Pavilion) | 7007001 | 12044165 | 15985039 | 15985039 | 16021543 | |||||||||||||||||||||
| includes MRI in FY18 |
| 48463620 | 142 | ||||||||||||||||
| 2012 | 2013 | 2014 | 2015 | 2016 | 2017 Forecast | 2018 Budget | |||||||||||
| All Position Codes - - Incumbant | 341166211 | 339519307 | 353189850 | 366130278 | 386592608 | 384323477 | 389629831 | 114 | |||||||||
| Faculty | 107309063 | 106758770 | 112585339 | 118156355 | 123360237 | 122328937 | 124681546 | ||||||||||
| All Other Staff | 233857148 | 232760537 | 240604510 | 247973922 | 263232371 | 261994540 | 264948285 | ||||||||||
| Proposal | Additional Information | FY17 Cost | FY18 Cost ($M) | FY19 Cost ($M) | FY20 Cost ($M) | FY21 Cost ($M) | Total Cost ($M) | ||||||||||||
| Wage Increase | Unions | 0 hard freeze FY17FY18FY19$2000 one time stipend in FY1935 + [step Increase] in FY20 FY21 | Includes Fringe Benefits | $ - 0 | $ - 0 | $ 160 | $ - 0 | $ - 0 | $ 160 | ||||||||||
| Furlough Days | Unions | 3 Furlough Days in FY18 | Includes Fringe Benefits | $ - 0 | $ (34) | $ - 0 | $ - 0 | $ - 0 | $ (34) | ||||||||||
| Delay Longevity Payment | Unions | Delay longevity payment in FY18 | Need additional confirmation but assumption is that April 2018 longevity payment delayed to FY19 | $ - 0 | $ (14) | $ 14 | $ - 0 | $ - 0 | $ - 0 | ||||||||||
| Subtotal Wage Impact (including associated fringe benefits) | $ - 0 | $ (48) | $ 174 | $ - 0 | $ - 0 | $ 126 | |||||||||||||
| Health Insurance - Increase in employee share of premium | Unions | - Increase 1 each year in FY20FY21FY22 for existing employees - New employes at 15 - Mgmt already at 23 | Uconns share of the premium will decrease by 1 Will impact fringe cost | $ - 0 | $ - 0 | $ - 0 | $ - 0 | $ - 0 | $ - 0 | ||||||||||
| Mgmt | No change Management share increasing in FY18 to 23 | $ - 0 | $ - 0 | $ - 0 | $ - 0 | $ - 0 | $ - 0 | ||||||||||||
| Fringe Rate Impact | All other Pension and Healthcare changes IMPACT UNKNOWN | This should ultimately reduce fringe costs but additional information and further analysis is required to understand full impact OPM provided an estimated reduction to SERS rate of 6 | $ - 0 | ||||||||||||||||
| Retiree Healthcare | Retiree COLA health contribution and Medicare changes | This should ultimately reduce fringe costs but additional information and further analysis is required to understand full impact | $ - 0 | ||||||||||||||||
| Pension - Contribution | FY18 FY19 = Increase pension contribution by 15FY20 FY21 = Increase pension contribution by additional 05 | This should ultimately reduce fringe costs but additional information and further analysis is required to understand full impact | $ - 0 | ||||||||||||||||
| Pension - Tier IV | Hybrid pensiondefined contribution State will match 1 | This should ultimately reduce fringe costs but additional information and further analysis is required to understand full impact | $ - 0 | ||||||||||||||||
| TOTAL COST(SAVINGS) - UNION EMPLOYEES | $ - 0 | $ (48) | $ 174 | $ - 0 | $ - 0 | $ 126 |
| FY17 Forecast ($M) | FY18 Budget ($M) | Favorable (Unfavorable) ($M) | Notes | ||||||
| Appropriation | 1218 | 1178 | (40) | Governors revised budget | |||||
| Fringe Benefits amp Adjustments | 1007 | 1006 | (01) | ||||||
| Total State Support | $ 2225 | $ 2183 | |||||||
| Tuition and Fees | 233 | 244 | 11 | Approved tuition rate increase of 45 | |||||
| Grants amp Contracts | 864 | 872 | 08 | Research grant revenue remains flat | |||||
| InternsResidents | 630 | 667 | 37 | Growth in revenue offset by increased expenses | |||||
| Net Patient Revenue | 4577 | 4751 | 174 | 38 increase | |||||
| Correctional Managed Health Care | 835 | 804 | (31) | ||||||
| Other Revenue | 517 | 576 | 60 | ||||||
| Total Operating Revenues | $ 9880 | $ 10098 | $ 259 | ||||||
| Personal Services | 3843 | 3896 | 53 | Increase is related to mid year hires in FY17 | |||||
| Fringe Benefits | 2046 | 2211 | 165 | estimated Comprollers fringe rates used | |||||
| Correctional Managed Health Care | 835 | 804 | (31) | ||||||
| DrugsMedical Supplies | 823 | 847 | 24 | increase in drugsmedicals supplies related to increase in volume | |||||
| Other Expenses | 2530 | 2165 | (365) | ||||||
| Debt ServiceProjects | - 0 | - 0 | - 0 | ||||||
| Total Operating Expenses | 10077 | 9924 | (154) | ||||||
| Net Gain(Loss) | (197) | 1740 | 4125 | ||||||
| Net Patient Revenue | Total State Support | Net Patient Revenue | Total State Support | ||||||
| FY13 | 358367701 | 173192257 | 3584 | 1732 | |||||
| FY14 | 372814684 | 213854874 | 3728 | 2139 | |||||
| FY15 | 431182934 | 226796933 | 4312 | 2231 | |||||
| FY16 | 452366520 | 235291486 | 4524 | 2353 | |||||
| FY17 Forecast | 457724062 | 222513422 | 4577 | 2225 | |||||
| FY18 Budget | 475098373 | 218446953 | 4751 | 2184 | |||||
| per TM1 | per TM |
| Fiscal Year | Appropriation | Allotment | Democratic budget | Republican budget | |||||
| FY10 | 118972138 | 117734347 | |||||||
| FY11 | 119346347 | 119166814 | |||||||
| FY12 | 109669578 | 108458794 | |||||||
| FY13 | 112666627 | 108519733 | |||||||
| FY14 | 125542313 | 125018941 | |||||||
| FY15 | 135366969 | 131158966 | |||||||
| FY16 | 144290800 | 143898479 | |||||||
| FY17 | 134539312 | 130030646 | 134539312 | 134539312 | |||||
| FY18 | 125474563 | 126820354 | 115249782 | ||||||
| FY18 Budget Target | $ (184) | ||
| SEBAC estimated costs | |||
| Three furlough day savings not in FY19 | (34) | ||
| Longevity (postponed in FY18) | (28) | ||
| Lump Sum payments (estimated $2000) | (160) | ||
| Appropriation (Governors Recommended) | 55 | ||
| Clinical revenue | 90 | ||
| FY19 Estimated Budget | $ (261) |
| Revenues ($M) | Expenditures ($M) | ||||||||||||||||||||||||
| Appropriation | 1218 | Personal Services | 3843 | Original | Forecast | variance | |||||||||||||||||||
| Fringe Benefits amp Adjustments | 1007 | Fringe Benefits | 2046 | Total Operating Revenue | 77320 | 76560 | (760) | ||||||||||||||||||
| Total State Support | $ 2225 | Correctional Managed Health Care | 835 | State Support | 22470 | 22250 | (220) | ||||||||||||||||||
| Tuition and Fees | 233 | DrugsMedical Supplies | 823 | Restricted Capital Balances | |||||||||||||||||||||
| Grants amp Contracts | 864 | Other Expenses | 2152 | Use Allowance | 560 | 200 | (360) | 1820 | |||||||||||||||||
| InternsResidents | 630 | Debt ServiceProjects | 169 | State Bond Funds | 4440 | 2640 | (1800) | use fy18 carryforward | |||||||||||||||||
| Net Patient Revenue | 4577 | Total Operating Fund | $ 9868 | Departmental Grant Funds | 100 | 100 | - 0 | ||||||||||||||||||
| Correctional Managed Health Care | 835 | ||||||||||||||||||||||||
| Other Revenue | 517 | Research and Restricted Expenditures | 294 | Total Available for Spending | 104890 | 101750 | (3140) | ||||||||||||||||||
| Total Operating Fund | $ 9881 | Total Operating Expenditures | $ 10162 | Total Operating Expenses (less depreciation) | 97640 | 96990 | (650) | ||||||||||||||||||
| Current Approved Capital Projects | 250 | 250 | - 0 | balances carried into FY18 | |||||||||||||||||||||
| Research and Restricted Funds | 294 | Working Capital Needs | 200 | 200 | - 0 | State Bond Funds-EMR | 23700000 | State Bond funds EMR (41M less spent $173) | |||||||||||||||||
| FY 2017 Capital Spending | 1200 | 690 | (510) | Comprehensive Cancer Center | 1556995 | cash balance (orig amt 25M in FY13) | |||||||||||||||||||
| Total Current Funds Revenues | $ 10175 | Net Gain(Loss) | $ 13 | State Bond Funds | 4390 | 2640 | (1750) | Health Disparity | 1166252 | cash balance (orig amt 25M in FY13) | |||||||||||||||
| Use Allowance | 560 | 200 | (360) | 26423247 | |||||||||||||||||||||
| Departmental Grant Funds | 100 | 100 | - 0 | ||||||||||||||||||||||
| Principal Payment on Debt | 550 | 550 | - 0 | ||||||||||||||||||||||
| Total Spending Plan | 104890 | 101620 | (3270) | ||||||||||||||||||||||
| Excess(Deficiency) | - 0 | 130 | 130 | ||||||||||||||||||||||
| FY17 Capital Budget Pools | |||||||||||||||||||||||||
| Dept Name | Description of Equipment or Project | Original Budget | Source of Funds | balance as of June 2017 | spent | epic | |||||||||||||||||||
| Information Tech | EPIC Project (1) | 3500000 | Operating | 2500000 | 1000000 | 2000000 | FY16 | ||||||||||||||||||
| Campus Planning | Capitalized Positions | 779619 | Operating | - 0 | 779619 | 3500000 | FY17 | ||||||||||||||||||
| Library | Library Acquisitions | 1080000 | Operating | - 0 | 1080000 | (3000000) | spent | ||||||||||||||||||
| Finance | UCH Contingency | 2603139 | Operating | 951432 | 1651707 | 2500000 | balance available | ||||||||||||||||||
| Finance | CFO - Hold | 4000000 | Operating | 3594475 | 405525 | ||||||||||||||||||||
| 11962758 | 7045907 | 4916851 | |||||||||||||||||||||||
| 2000000 | per jeff | ||||||||||||||||||||||||
| 6916851 |
| Revenues ($M) | Expenditures ($M) | ||||||||||||||||||
| Appropriation | 1218 | Personal Services | 3843 | Appropriation | 1218 | Personal Services | 3843 | ||||||||||||
| Fringe Benefits amp Adjustments | 1007 | Fringe Benefits | 2046 | Fringe Benefits amp Adjustments | 1007 | Fringe Benefits | 2046 | ||||||||||||
| Total State Support | $ 2225 | Correctional Managed Health Care | 835 | Total State Support | $ 2225 | Correctional Managed Health Care | 835 | ||||||||||||
| Tuition and Fees | 233 | DrugsMedical Supplies | 823 | Tuition and Fees | 233 | DrugsMedical Supplies | 823 | ||||||||||||
| Grants amp Contracts | 864 | Other Expenses | 2152 | Grants amp Contracts | 864 | Other Expenses | 2150 | ||||||||||||
| InternsResidents | 630 | Depreciation | 379 | InternsResidents | 630 | Depreciation | 379 | ||||||||||||
| Net Patient Revenue | 4577 | Total Operating Expenditures | $ 10078 | Net Patient Revenue | 4577 | Total Operating Expenses | 10077 | ||||||||||||
| Correctional Managed Health Care | 835 | Correctional Managed Health Care | 835 | ||||||||||||||||
| Other Revenue | 517 | Other Revenue | 517 | Net Gain(Loss) | (197) | ||||||||||||||
| Total Operating Revenues | $ 9881 | Net Gain(Loss) | $ (197) | Total Operating Revenues | $ 9880 | ||||||||||||||
| Spending plan FY18 (detail capital) | ||||||||
| Original | Revised | |||||||
| Depreciation | 35801260 | 35801260 | ||||||
| EPIC - Carryforward (orig $55M spent $30M) | (2500000) | (2500000) | ||||||
| EPIC - FY18 | (3500000) | (3500000) | ||||||
| Debt payments | (6576264) | (6576264) | ||||||
| Capital Pool - FY18 | (2453042) | (2453042) | ||||||
| Library e-resources | (500000) | - 0 | moved to operating-offset by inkind fb | |||||
| IT Pool | (1000000) | (1000000) | ||||||
| Capital Projects carryforward | (871954) | (871954) | ||||||
| CFO contingency pool | - 0 | (1000000) | ||||||
| Library e-resources - use allowance | (500000) | - 0 | moved to operating offset by inkind fb | |||||
| Use allowance (part of the $684M) | 500000 | 500000 | use allowance cash still funding Library resouces in operating | |||||
| Total Debt serviceprojects | (17401260) | (17401260) | ||||||
| Operating Loss | (18400000) | (18400000) | ||||||
| Balance | - 0 | - 0 | ||||||
| FY18 | FY19 | |||||||||||||||
| Used in FY18 Budget --Governor Recommended Rev May 15 2017 | Senate and House Approved Budget 102017 | Variance | Lapses Distribution 11172017 | Net Appropriation | Senate and House Approved Budget 102017 | Variance | ||||||||||
| Block Grant | 106767742 | 106746887 | (20855) | (4437991) | 102308896 | 106746848 | (39) | |||||||||
| AHEC | - 0 | 374566 | 374566 | (199) | 374367 | 374566 | - 0 | |||||||||
| Bioscience CT funding | 10984843 | 10984843 | - 0 | (306086) | 10678757 | 11567183 | 582340 | |||||||||
| Workers Compensation Approp | 7721978 | 4320855 | (3401123) | - 0 | 4320855 | 4324771 | 3916 | |||||||||
| 125474563 | 122427151 | (3047412) | (4744276) | 117682875 | 123013368 | 586217 | ||||||||||
| Workers Compensation claims | (7721978) | (7721978) | - 0 | (7721978) | (7721978) | - 0 | ||||||||||
| 117752585 | 114705173 | (3047412) | (4744276) | 109960897 | 115291390 | 586217 | ||||||||||
| 74 used | 69 used | |||||||||||||||
| Inkind fb | 87136913 | 81234894 | (5902019) | (3273413) | 77961481 | |||||||||||
| add fringe differential | 13500000 | 13500000 | 13500000 | |||||||||||||
| 100636913 | 94734894 | (5902019) | 91461481 | (3273413) | ||||||||||||
| total State support gross (before wc claims) | 226111476 | 217162045 | (8949431) | 209144356 | ||||||||||||
| total State support net (after wc claims) | 218389498 | 209440067 | (8949431) | 201422378 | ||||||||||||
| Inkind fb | 87121480 | 92197925 | ||||||||||||||
| add fringe differential | 13500000 | 13500000 | ||||||||||||||
| 100621480 | 105697925 | 5076445 | ||||||||||||||
| total State support gross (before wc claims) | 223048631 | 223380800 | ||||||||||||||
| total State support net (after wc claims) | 215326653 | 215658822 |
| Expenditures ($M) | |||
| Personal Services | 3912 | ||
| Fringe Benefits | 2322 | ||
| Correctional Managed Health Care | 804 | ||
| DrugsMedical Supplies | 852 | ||
| Other Expenses | 2147 | ||
| Debt ServiceProjects | 174 | ||
| Total Operating Fund | $ 10211 | ||
| Research and Restricted Expenditures | 684 | ||
| Total Operating Expenditures | $ 10895 | ||
| Personal Services | 3912 | ||
| Fringe Benefits | 2322 | ||
| Correctional Managed Health Care | 804 | ||
| DrugsMedical Supplies | 852 | ||
| Other Expenses | 2147 | ||
| Debt ServiceProjects | 174 | ||
| Research and Restricted Expenditures | 684 |
| Revenues ($M) | |||
| Appropriation | 1177 | ||
| Fringe Benefits amp Adjustments | 1057 | ||
| Total State Support | $ 2234 | ||
| Tuition | 200 | ||
| Fees | 44 | ||
| Grants amp Contracts | 849 | ||
| InternsResidents | 667 | ||
| Net Patient Revenue | 4827 | ||
| Correctional Managed Health Care | 804 | ||
| Other Revenue | 586 | ||
| Total Operating Fund | $ 10211 | ||
| Research and Restricted Funds | 684 | ||
| Total Current Funds Revenues | $ 10895 | ||
| State Support | 2234 | ||
| Tuition | 200 | ||
| Fees | 44 | ||
| Grants amp Contracts | 849 | ||
| InternsResidents | 667 | ||
| Net Patient Revenue | 4827 | ||
| Correctional Managed Health Care | 804 | ||
| Other Revenue | 586 | ||
| Research and Restricted Funds | 684 | ||
| FY18 Original BOT Budget ($M) | FY18 Revised Budget ($M) | Favorable (Unfavorable) ($M) | Notes | ||||||
| Appropriation | 1254 | 1177 | (77) | Reduction in workers compensation and lapses | |||||
| Fringe Benefits amp Adjustments | 1006 | 1057 | 51 | increase due to increase in fringe rates | |||||
| Total State Support | $ 2260 | $ 2234 | $ (26) | ||||||
| Tuition | 200 | 200 | - 0 | ||||||
| Fees | 44 | 44 | - 0 | ||||||
| Grants amp Contracts | 872 | 849 | (23) | First quarter results | |||||
| InternsResidents | 667 | 667 | - 0 | ||||||
| Net Patient Revenue | 4751 | 4827 | 76 | Enhanced payments and first quarter results | |||||
| Correctional Managed Health Care | 804 | 804 | - 0 | ||||||
| Other Revenue | 576 | 586 | 10 | First quarter results - retail pharmacy | |||||
| - 0 | |||||||||
| Total Operating Fund | $ 10174 | $ 10211 | $ 37 | ||||||
| Research and Restricted Funds | 684 | 684 | - 0 | ||||||
| Total Current Funds Revenues | $ 10858 | $ 10895 | $ 37 | ||||||
| Personal Services | 3896 | 3912 | (16) | Implementation of final SEBAC provisions | |||||
| Fringe Benefits | 2288 | 2322 | (34) | Implementation of final SEBAC provisions | |||||
| Correctional Managed Health Care | 804 | 804 | - 0 | ||||||
| DrugsMedical Supplies | 847 | 852 | (05) | First quarter results | |||||
| Other Expenses | 2165 | 2147 | 18 | First quarter results | |||||
| Debt ServiceProjects | 174 | 174 | (00) | ||||||
| Total Operating Fund | $ 10174 | $ 10211 | $ (37) | ||||||
| Research and Restricted Expenditures | 684 | 684 | - 0 | ||||||
| Total Operating Expenditures | $ 10858 | $ 10895 | $ (37) | ||||||
| Net Gain(Loss) | $ - 0 | $ (00) | $ (00) | ||||||
| UConn Health | ||||
| Spending Plan for Fiscal Year 2018 | ||||
| Revenues | ||||
| Appropriation | 117752585 | |||
| Fringe Benefits amp Adjustments | 100594368 | |||
| Total State Support | $ 218346953 | |||
| Tuition and Fees | 24402915 | |||
| Grants amp Contracts | 87178304 | |||
| InternsResidents | 66694948 | |||
| Net Patient Revenue | 475098373 | |||
| Correctional Managed Health Care | 80426658 | |||
| Other Revenue | 57635408 | |||
| Total Operating Funds | $ 1009783559 | |||
| Research and Restricted Funds | 68423247 | |||
| Total Current Funds Revenues | $ 1078206806 | |||
| Expenditures | ||||
| Personal Services | 389629832 | |||
| Fringe Benefits | 221135897 | |||
| Correctional Managed Health Care | 80426658 | |||
| DrugsMedical Supplies | 84704197 | |||
| Other Expenses | 216482470 | |||
| Debt ServiceProjects | 17401260 | |||
| Total Operating Funds | $ 1009780314 | |||
| Research and Restricted Expenditures | 68423247 | |||
| Total Operating Expenditures | $ 1078203561 | |||
| Net Gain | $ 3245 | |||
| Revenues ($M) | Expenditures ($M) | see notes below for summary of changes | |||||||||||||||||
| Appropriation | 1177 | Personal Services | 3912 | Appropriation | 1177 | Personal Services | 3912 | ||||||||||||
| Fringe Benefits amp Adjustments | 1057 | Fringe Benefits | 2322 | Fringe Benefits amp Adjustments | 1057 | Fringe Benefits | 2322 | ||||||||||||
| Total State Support | $ 2234 | Correctional Managed Health Care | 804 | Total State Support | $ 2234 | Correctional Managed Health Care | 804 | ||||||||||||
| Tuition | 200 | DrugsMedical Supplies | 852 | Tuition | 200 | DrugsMedical Supplies | 852 | ||||||||||||
| Fees | 44 | Other Expenses | 2147 | Fees | 44 | Other Expenses | 2147 | ||||||||||||
| Grants amp Contracts | 849 | Depreciation | 358 | Grants amp Contracts | 849 | Depreciation | 358 | ||||||||||||
| InternsResidents | 667 | Total Operating Expenditures | $ 10395 | InternsResidents | 667 | Total Operating Fund | 10395 | ||||||||||||
| Net Patient Revenue | 4827 | Net Patient Revenue | 4827 | ||||||||||||||||
| Correctional Managed Health Care | 804 | Correctional Managed Health Care | 804 | ||||||||||||||||
| Other Revenue | 586 | Other Revenue | 586 | ||||||||||||||||
| Total Operating Revenues | $ 10211 | Net Gain(Loss) | $ (184) | Total Operating Fund | $ 10211 | Net Gain(Loss) | (1838) | ||||||||||||
| Notes - Revisions to original budget presented June28th | |||||||||||||||||||
| Approp revised to approved budget - Oct 2017 and added back the wc - and reduced with lapses of 47M | |||||||||||||||||||
| inkind fringe updated using new approp and lapses- 816 rate used was 74 | |||||||||||||||||||
| split tuition and fees (per request of storrs) | |||||||||||||||||||
| Reduced Grants and contract - first qtr results $23M | |||||||||||||||||||
| workers comps claims of $7721978 moved to fringe exp (was netted out of approp in orig) | |||||||||||||||||||
| Net patient revenue increased by $30M (umg enhanced physician payments) and 1st quarter results $46M | |||||||||||||||||||
| Other revenue - first qtr results - Retail pharmacy | |||||||||||||||||||
| salary cost added 16M (SEBAC provisions longevity and clean up of furlough) | |||||||||||||||||||
| fb cost added $33M (half of Sebac reallocations) offset with addl inkind fringe | |||||||||||||||||||
| rounding issue $100k added to inkind fringe | |||||||||||||||||||
| Drugs and Med supplies $500K added - first quarter results | |||||||||||||||||||
| other expenses $500K added for eresources (maintenance and subscription fees) and first qtr results research decrease $23M |
| Revenues ($M) | Expenditures ($M) | see notes below for summary of changes | |||||||||||||||||
| Appropriation | 1177 | Personal Services | 3912 | Appropriation | 1177 | Personal Services | 3912 | ||||||||||||
| Fringe Benefits amp Adjustments | 1057 | Fringe Benefits | 2322 | Fringe Benefits amp Adjustments | 1057 | Fringe Benefits | 2322 | ||||||||||||
| Total State Support | $ 2234 | Correctional Managed Health Care | 804 | Total State Support | $ 2234 | Correctional Managed Health Care | 804 | ||||||||||||
| Tuition | 200 | DrugsMedical Supplies | 852 | Tuition | 200 | DrugsMedical Supplies | 852 | ||||||||||||
| Fees | 44 | Other Expenses | 2147 | Fees | 44 | Other Expenses | 2147 | ||||||||||||
| Grants amp Contracts | 849 | Debt ServiceProjects | 174 | Grants amp Contracts | 849 | Debt ServiceProjects | 174 | ||||||||||||
| InternsResidents | 667 | Total Operating Fund | $ 10211 | InternsResidents | 667 | Total Operating Fund | 10211 | ||||||||||||
| Net Patient Revenue | 4827 | Net Patient Revenue | 4827 | ||||||||||||||||
| Correctional Managed Health Care | 804 | Research and Restricted Expenditures | 684 | Correctional Managed Health Care | 804 | Research and Restricted Expenditures | 684 | ||||||||||||
| Other Revenue | 586 | Other Revenue | 586 | ||||||||||||||||
| Total Operating Fund | $ 10211 | Total Operating Expenditures | $ 10895 | Total Operating Fund | $ 10211 | Total Operating Expenditures | $ 10895 | ||||||||||||
| Research and Restricted Funds | 684 | Research and Restricted Funds | 684 | ||||||||||||||||
| Total Current Funds Revenues | $ 10895 | Net Gain(Loss) | $ (00) | Total Current Funds Revenues | $ 10895 | Net Gain(Loss) | 00 | ||||||||||||
| Research and Restricted Funds - detail | |||||||||||||||||||
| Use Allowance | 7000000 | per Julie | |||||||||||||||||
| State Bond Funds-EMR | 23700000 | State Bond funds EMR (41M less spent $173) | storrs funds for EMR $48M | ||||||||||||||||
| Storrs Funds - EMR | 35000000 | per storrs agreement | FY18 | 35000000 | |||||||||||||||
| Comprehensive Cancer Center | 1556995 | cash balance (orig amt 25M in FY13) | FY19 | 13000000 | |||||||||||||||
| Health Disparity | 1166252 | cash balance (orig amt 25M in FY13) | 48000000 | ||||||||||||||||
| 68423247 | |||||||||||||||||||
| Notes - Revisions to original budget presented June28th | |||||||||||||||||||
| Approp revised to approved budget - Oct 2017 and added back the wc - and reduced with lapses of 47M | |||||||||||||||||||
| inkind fringe updated using new approp and lapses- 816 rate used was 74 | |||||||||||||||||||
| split tuition and fees (per request of storrs) | |||||||||||||||||||
| Reduced Grants and contract - first qtr results $23M | |||||||||||||||||||
| workers comps claims of $7721978 moved to fringe exp (was netted out of approp in orig) | |||||||||||||||||||
| Net patient revenue increased by $30M (umg enhanced physician payments) and 1st quarter results $46M | |||||||||||||||||||
| Other revenue - first qtr results - Retail pharmacy | |||||||||||||||||||
| salary cost added 16M (SEBAC provisions longevity and clean up of furlough) | |||||||||||||||||||
| fb cost added $33M (half of Sebac reallocations) offset with addl inkind fringe | |||||||||||||||||||
| rounding issue $100k added to inkind fringe | |||||||||||||||||||
| Drugs and Med supplies $500K added - first quarter results | |||||||||||||||||||
| other expenses $500K added for eresources (maintenance and subscription fees) and first qtr results research decrease $23M |
| FY18 Budget Target | |||||||
| FY18 Bottom line - Preliminary Projection | $ (5940) | ||||||
| Financial interventions posted to budget | 1270 | ||||||
| FY18 Bottom line - Current | $ (4670) | ||||||
| Not Posted to Budget | |||||||
| SEBAC (Estimated Savings) | 1270 | ||||||
| UMG | |||||||
| Revenue increase (Adding an additional Patient per week would be approximately $13M) | 400 | need broad categories of these savings | |||||
| Expense reduction | 350 | Annes will provide summary | |||||
| JDH | |||||||
| Revenue increase | 400 | ||||||
| Expense reduction | 410 | ||||||
| FY18 Bottom line Target | $ (1840) | ||||||
| FY18 Preliminary Forecast and Assumptions | ||||
| Bottom line | ||||
| FY2017 Budget | $ (197) | |||
| Estimated additional clinical revenue (2 increase) | 90 | |||
| State Support reduction (Gov Rec compared to Allotment Amount - includes Block Grant In-kind Fringes Bioscience and Workers Compensation) | (118) | |||
| NICU Rental Income decrease (Per contract) | (10) | |||
| Research Grants | (19) | |||
| Fringe Benefit - retirement rates per comptrollers estimates (Net of in-kind fb) | (68) | |||
| Fringe Benefit - estimates of Insurance increases (Net of in-kind fb) | (40) | |||
| FY2018 Original Projection (without Health One) | $ (361) | |||
| Health One - revenue reduction | (113) | |||
| Health One - training and back fill | (120) | |||
| Total FY18 Preliminary Forecast | $ (594) | |||
| FY17 Forecast vs FY17 Budget | ||||||||||
| FY17 Budget | FY17 Forecast | Variance | ||||||||
| Revenues | ||||||||||
| Net Patient Care | $ 4715 | $ 4567 | $ (148) | |||||||
| Other Revenue | 2241 | 2243 | 02 | |||||||
| Correctional Managed Health Care | 833 | 824 | (09) | |||||||
| State Support | 1236 | 1218 | (18) | |||||||
| In-kind Fringe Benefits and Differential | 976 | 1007 | 31 | |||||||
| Total Revenue | $ 10001 | $ 9860 | $ (141) | |||||||
| Expenses | ||||||||||
| Salary | $ 3857 | $ 3843 | $ (14) | |||||||
| Fringe Benefits | 2066 | 2037 | (29) | |||||||
| Correctional Managed Health Care | 833 | 824 | (09) | |||||||
| Other Expenses | 3404 | 3352 | (52) | |||||||
| Total Expenses | $ 10160 | $ 10056 | $ (104) | |||||||
| Excess(Deficiency) of Revenues over Expenses | $ (159) | $ (197) | $ (38) | |||||||
| notes for Jeff | ||||||||||
| summary of forecast changes | (21554857) | |||||||||
| Third Party updated thru April YTD | (3000000) | |||||||||
| IT review | 183120 | |||||||||
| Core Reconciliation | 1800000 | |||||||||
| Interns amp Res | 823000 | |||||||||
| Hemophilia clinic340B pharmacy | 1360329 | |||||||||
| Library (moved to capital) | 108000 | |||||||||
| Facilities Mgmt | 223012 | |||||||||
| Creative Child Care | 23000 | |||||||||
| Fire Dept | 76780 | |||||||||
| ResearchAcademic review of spend | 1258000 | |||||||||
| 2855241 | ||||||||||
| (18699616) | ||||||||||
| FY18 Budget Assumptions | ||
| The following presentation assumes | ||
| Tuition and Fees - overall 45 rate increase | ||
| Research revenue - slight increase offset by additional expenses | ||
| Salaries - no increase related to bargaining units due to no settled contracts as of budget preparation | ||
| Fringes - State Comptrollers estimated state retirement rates used | ||
| Appropriation - Governors Recommended Revised budget as of May 15 2017 | ||
| FY 2013 | FY 2014 | FY 2015 | FY 2016 | FY 2017 Forecast | FY2018 Budget | ||||||||
| UCH Profit (Loss) | (7203277) | (15458141) | (2876454) | (12564848) | (19688715) | (59400000) | |||||||
| UCH Profit (Loss) | (72) | (155) | (29) | (126) | (197) | (594) | |||||||
| Orig Projection | Final Budget | ActualsForecast | ||||||||||||||||||||
| FY14 | (210) | (110) | (155) | |||||||||||||||||||
| FY15 | (259) | (125) | (29) | |||||||||||||||||||
| FY16 | (400) | (159) | (126) | |||||||||||||||||||
| FY17 | (481) | (159) | (197) | |||||||||||||||||||
| FY18 | (594) | (184) | ||||||||||||||||||||
| Note | ||||||||||||||||||||||
| Financial Improvement Project began in FY2014 - Total savings of $103M |
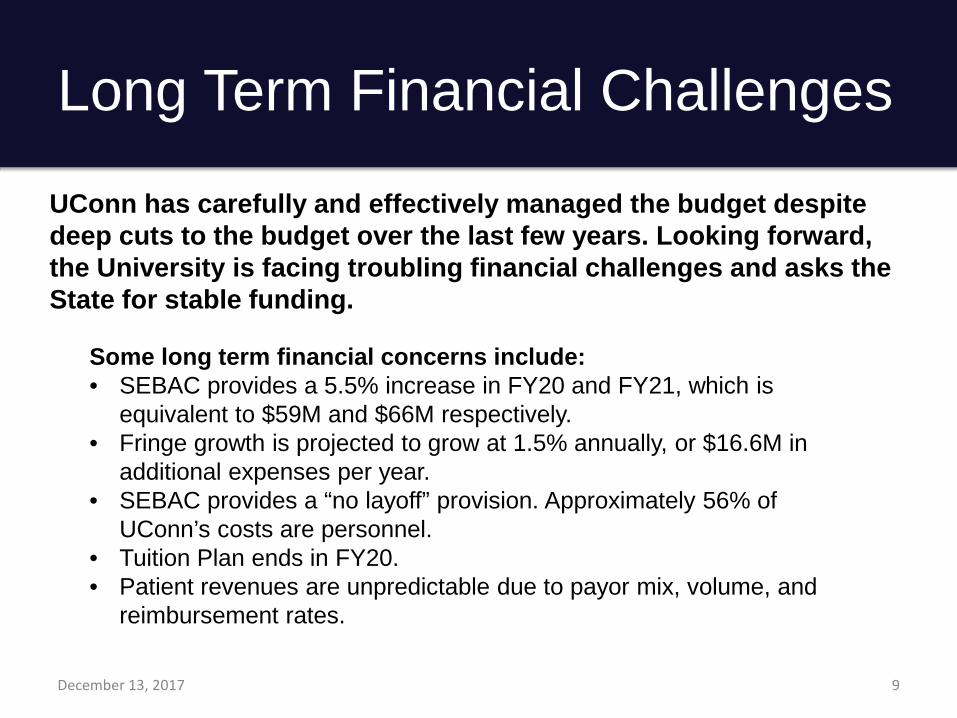

FY18 Comparison
Note Use of decimals may result in rounding differences
Increased enrollment gains in other revenue sources hiring freeze restricted spending and reductions in capital projects and deferred maintenance helped offset State cuts
Storrs and Regionals
December 13 2017 15
FY18 Original BOT Budget
($M)
FY18 Revised Budget
($M)
Favorable (Unfavorable)
($M)Notes
Appropriation 2112 1913 (199) Revised State Appropriation Includes $79M in lapsesFringe Benefits amp Adjustments 1469 1358 (110) Fringe estimated at 71 Includes $55M in lapses Total State Support 3581$ 3272$ (309)$ Tuition 3901 3984 83 150 more students 352 additional international studentsFees 1348 1365 17 Increased enrollmentGrants amp Contracts 775 825 50 Increase in Pell funding and other scholarships from budgeted amount FoundationEndowment 195 210 15 Increased Foundation usage to offset cutsSales amp Services 183 199 16 Based on FY17 year end actuals and first quarter resultsAuxiliary Enterprise Revenue 2201 2201 - Housing Dining and Athletics are on targetOther Revenue 159 139 (20) Some shift to expense reduction revenues trending slightly downward
Total Operating Fund 12343$ 12194$ (149)$ Increase in revenue streams helps offset the State cuts
Research Fund 1066 1066 -
Total Current Funds Revenues 13410$ 13261$ (149)$
Personal Services 4962 4947 15 Additional hiring restrictions on top of budgeted personnel reductionsFringe Benefits 2483 2513 (30) Final FY18 fringe rates are higher than FY17 but lower than wo SEBACOther ExpensesEquipment 2338 2310 28 Cost cutting expense avoidance and careful spendingEnergy 249 229 20 Based on FY17 year-end actuals and first quarter resultsStudent Financial Aid 1659 1727 (67) Increase in Pell funding ($4M) and other scholarships Debt ServiceProjects 621 449 171 Reduction in capital projects and deferred maintenance
Total Operating Fund 12312$ 12175$ 137$
Research Fund 1080 1080 -
Total Current Funds Expenditures 13392$ 13255$ 137$
Net Gain(Loss) Loss 18$ 06$ (12)$
FY18 Revenue by CategoryState support is an important and significant piece of the budget however in FY18 tuition will be the largest revenue source at over 30 of total revenues
Note Use of decimals may result in rounding differences
Appropriation 1913 Fringe Benefits amp Adjustments 1358 Total State Support 3272$ Tuition 3984 Fees 1365 Grants amp Contracts 825 FoundationEndowment 210 Sales amp Services 199 Auxiliary Enterprise Revenue 2201 Other Revenue 139
Total Operating Fund 12194$
Research Fund 1066
Total Current Funds Revenues 13261$
Revenues ($M)
State Support247
Tuition300
Fees 103
Grants amp Contracts
62
Foundation 16Sales amp Services
15 Auxiliary Enterprise Revenue
166
Research Fund 78
Other Revenue
11
Storrs and Regionals
Tuition and Fees make up more than 40 of UConnrsquos budgeted revenues
December 13 2017 16
Tuition Revenue
FY17 was the first year that tuition surpassed State support as the largest revenue source The gap grows significantly in FY18 and FY19
$2461 $2599
$2698 $2904
$3197
$3534
$3775 $3984
$4220
$3290
$2824 $2885
$3081
$3507
$3845
$3740
$3272 $3314
$225
$260
$295
$330
$365
$400
$435
FY11 FY12 FY13 FY14 FY15 FY16 FY17 FY18Budget
FY19Budget
State Support and Tuition Revenue
Tuition
State Support
$91M
Storrs and Regionals
UConn enrollment growth and increased rates have resulted in overall tuition revenue increases
December 13 2017 17
FY18 Expense by Category
Note Use of decimals may result in rounding differences
Salary and Fringe Benefits are the largest expense for the University at 563 of the total with Other Expenses accounting for 158 and Financial Aid at 13
Personal Services 4947 Fringe Benefits 2513 Other Expenses 2105 Energy 229 Equipment 205 Student Financial Aid 1727 Debt ServiceProjects 449 Total Operating Fund 12175$
Research Fund 1080
Total Operating Expenditures 13255$
Expenditures ($M)
Personal Services373
Fringe Benefits
190
Other Expenses
158
Energy17
Equipment15
Student Financial Aid
130
Debt ServiceProjects
34
Research Fund 81
Storrs and Regionals
Personnel costs represent more than 56 of the overall expense budget UConn will continue to restrict hiring and closely watch any spending to help maintain the balanced budget
December 13 2017 18
Rising Costs - Salary Expenses
Between FY11 and FY18 mandated salary increases due to union agreements cost UConn about $68M or 83 of the total salary growth
Other this category includes classified non-faculty professional (UCPEA) management confidential graduate assistant student amp special payroll
The majority of the growth in FY18 is due to graduate assistant contractual increases and additional police Per the SEBAC agreement FY18 includes no facultystaff salary increases
Salary Expenses ($M)
Storrs and Regionals
December 13 2017 19
$279 $272 $285 $305 $317 $326 $321 $320
$134 $143 $141$157 $166 $171 $175 $175
$0
$100
$200
$300
$400
$500
$600
FY11 FY12 FY13 FY14 FY15 FY16 FY17 FY18
FacultyAAUP
Other
$413 $414
$496
$425$462 $483 $497 $495
Revised Spending PlanUConn Health
State Budget CutsUConn Health
Compared to the BOT approved budget in June the negotiated State budget is an overall cut of $111M
December 13 2017 21
Updated FY18 Spending Plan
(Cash Sources and Uses)
Appropriation 1177 Personal Services 3912 Fringe Benefits amp Adjustments 1057 Fringe Benefits 2322 Total State Support 2234$ Correctional Managed Health Care 804 Tuition 200 DrugsMedical Supplies 852 Fees 44 Other Expenses 2147 Grants amp Contracts 849 Debt ServiceProjects 174 InternsResidents 667 Total Operating Fund 10211$ Net Patient Revenue 4827 Correctional Managed Health Care 804 Research and Restricted Expenditures 684 Other Revenue 586
Total Operating Fund 10211$ Total Operating Expenditures 10895$
Research and Restricted Funds 684
Total Current Funds Revenues 10895$ Net Gain(Loss) -$
Revenues ($M) Expenditures ($M)
UConn Health
UConn Health has achieved a balanced budget by implementing spending cuts restricting hiring and identifying new revenue streams
December 13 2017 22
FY18 Comparison
(Cash Sources and Uses)FY18
Original BOT Budget ($M)
FY18 Revised
Budget ($M)
Favorable (Unfavorable)
($M) NotesAppropriation 1254 1177 (77) Reduction in workers compensation and lapsesFringe Benefits amp Adjustments 1006 1057 51 increase due to increase in fringe ratesTotal State Support 2260$ 2234$ (26)$ Tuition 200 200 - Fees 44 44 - Grants amp Contracts 872 849 (23) First quarter resultsInternsResidents 667 667 - Net Patient Revenue 4751 4827 76 Enhanced payments and first quarter resultsCorrectional Managed Health Care 804 804 - Other Revenue 576 586 10 First quarter results - retail pharmacy Total Operating Fund 10174$ 10211$ 37$
Research and Restricted Funds 684 684 -
Total Current Funds Revenues 10858$ 10895$ 37$
Personal Services 3896 3912 (16) Implementation of final SEBAC provisionsFringe Benefits 2288 2322 (34) Implementation of final SEBAC provisionsCorrectional Managed Health Care 804 804 - DrugsMedical Supplies 847 852 (05) First quarter resultsOther Expenses 2165 2147 18 First quarter resultsDebt ServiceProjects 174 174 (00) Total Operating Fund 10174$ 10211$ (37)$
Research and Restricted Expenditures 684 684 -
Total Operating Expenditures 10858$ 10895$ (37)$
Net Gain(Loss) -$ -$ -$
UConn Health
Reductions in personnel costs and increased patient revenue offset State cuts
December 13 2017 23
Appendix
State Support
UConn Storrs and Regionals amp UConn Health have sustained $1638M in State reductions lost fringe and fund sweeps since 2010 ($1044M for Storrs and $594M for UCH)
Reductions = lapses rescissions and deficit mitigation
Appropriation Reduction Actual Allotment
Lost Fringe due to Reduction
Fund Sweeps Total Cut
FY10 3543 (35) 3508 (17) (180) (232) FY11 3523 (06) 3517 (03) (250) (259) FY12 3174 (33) 3141 (17) - (50) FY13 3188 (144) 3044 (72) - (216) FY14 3289 (13) 3276 (07) - (20) FY15 3650 (116) 3534 (61) - (177) FY16 3875 (30) 3845 (25) (172) (227) FY17 3644 (145) 3499 (98) - (243) FY18 3217 (126) 3091 (88) - (214) TOTAL $ (648) $ (388) $ (602) $ (1638)
UConn TOTAL - Combined Reductions Fringe (lost) and Fund Sweeps ($M)
December 13 2017 25
FY18 Revenue by Category
Appropriation 1177 Fringe Benefits amp Adjustments 1057 Total State Support 2234$ Tuition 200 Fees 44 Grants amp Contracts 849 InternsResidents 667 Net Patient Revenue 4827 Correctional Managed Health Care 804 Other Revenue 586
Total Operating Fund 10211$
Research and Restricted Funds 684
Total Current Funds Revenues 10895$
Revenues ($M)
UConn Health
State support is the second largest revenue source at 22 of total revenue
December 13 2017 26
FY14FY15FY16FY17FY18-21-259-40-481-594Final Budget
FY14FY15FY16FY17FY18-11-125-159-159-18399999999999999ActualsForecast
FY14FY15FY16FY17FY18-155-29-126-197
Profit (Loss)
FY13 - FY18
UCH Profit (Loss)FY 2013FY 2014FY 2015FY 2016FY 2017 ForecastFY2018 Budget-72032769999999999-15458140999999999-28764539999999998-12564848-19688714999999998-594
State SupportTuitionFeesGrants amp ContractsInternsResidentsNet Patient RevenueCorrectional Managed Health CareOther Revenue22342044000000000000004849667482780400000000000006586
Personal ServicesFringe BenefitsCorrectional Managed Health CareDrugsMedical SuppliesOther ExpensesDebt ServiceProjectsResearch and Restricted Expenditures391223228040000000000000685221471740126000000000168400000000000006
amp8ampK00-024ampZampF
Differences in rates FY18 orig budget used 74 as a rate When estimating for medicagov relations Uconn storrs suggested we use the same rate at 69
For the revised BODBOT presentations used the 816 rate with the new appropriation
FY18 Gov $[VALUE]
FY10FY11FY12FY13FY14FY15FY16FY17FY18118972138119346347109669578112666627125542313135366969144290800134539312125474563 AllotmentFY10FY11FY12FY13FY14FY15FY16FY17FY18117734347119166814108458794108519733125018941131158966143898479130030646Democratic budget
FY18 Dem $[VALUE]
FY10FY11FY12FY13FY14FY15FY16FY17FY18134539312126820354Republican budget
FY18 Rep $[VALUE]
FY10FY11FY12FY13FY14FY15FY16FY17FY18134539312115249782
State Support and Net Patient Revenue
Net Patient Revenue
FY13FY14FY15FY16FY17 ForecastFY18 Budget358367701372814684431182934452366520457724062475098373Total State Support
FY13FY14FY15FY16FY17 ForecastFY18 Budget173192257213854874226796933235291486222513422218446953
Salary Expense ($M)
Faculty
201220132014201520162017 Forecast2018 Budget10730906310675877011258533911815635512336023712232893712468154592All Other Staff
201220132014201520162017 Forecast2018 Budget23385714823276053724060451024797392226323237126199454026494828507999998
John Dempsey Hospital vs Connecticut Hospital Association Fringe Rate
CHA rate
20052010201120122013201420152016201720180273899999999999980295403014031080000000000002030609999999999998028799999999999998028789999999999999029399999999999998029987999999999998030587759999999997JDH rate
2005201020112012201320142015201620172018038719999999999999044280000000000003044080000000000003043409999999999999046100989118483643053266397642863328054479050264180173057442497383828672059146205947123043066300000000000003
Fringe Benefit DifferentialFY 2013FY 2014FY 2015FY 2016FY 2017 ForecastFY2018 Budget135000001350000013500000135000001350000013500000Actual Hospital DifferentialFY 2013FY 2014FY 2015FY 2016FY 2017 ForecastFY2018 Budget170612883784000022559753009600000127567138709199995328022674020000063467286594704000743315787
1
2
3
4
5
6
7
8
9
A
B
C
Appropriation
1177
Fringe Benefits amp Adjustments
1057
Total State Support
2234
$
Tuition
200
Fees
44
Revenues ($M)
FY18 Expense by Category
Personal Services 3912 Fringe Benefits 2322 Correctional Managed Health Care 804 DrugsMedical Supplies 852 Other Expenses 2147 Debt ServiceProjects 174 Total Operating Fund 10211$
Research and Restricted Expenditur 684
Total Operating Expenditures 10895$
Expenditures ($M)
Personal Services
36
Fringe Benefits21Correctional
Managed Health Care7
DrugsMedical Supplies
8
Other Expenses20
Debt ServiceProjects
2
Research and Restricted
Expenditures6
UConn Health
Personnel costs make up 57 of UConn Healthrsquos overall expenditure budget
December 13 2017 27
FY14FY15FY16FY17FY18-21-259-40-481-594Final Budget
FY14FY15FY16FY17FY18-11-125-159-159-18399999999999999ActualsForecast
FY14FY15FY16FY17FY18-155-29-126-197
Profit (Loss)
FY13 - FY18
UCH Profit (Loss)FY 2013FY 2014FY 2015FY 2016FY 2017 ForecastFY2018 Budget-72032769999999999-15458140999999999-28764539999999998-12564848-19688714999999998-594
State SupportTuitionFeesGrants amp ContractsInternsResidentsNet Patient RevenueCorrectional Managed Health CareOther Revenue22342044000000000000004849667482780400000000000006586
Personal ServicesFringe BenefitsCorrectional Managed Health CareDrugsMedical SuppliesOther ExpensesDebt ServiceProjectsResearch and Restricted Expenditures391223228040000000000000685221471740126000000000168400000000000006
amp8ampK00-024ampZampF
Differences in rates FY18 orig budget used 74 as a rate When estimating for medicagov relations Uconn storrs suggested we use the same rate at 69
For the revised BODBOT presentations used the 816 rate with the new appropriation
FY18 Gov $[VALUE]
FY10FY11FY12FY13FY14FY15FY16FY17FY18118972138119346347109669578112666627125542313135366969144290800134539312125474563 AllotmentFY10FY11FY12FY13FY14FY15FY16FY17FY18117734347119166814108458794108519733125018941131158966143898479130030646Democratic budget
FY18 Dem $[VALUE]
FY10FY11FY12FY13FY14FY15FY16FY17FY18134539312126820354Republican budget
FY18 Rep $[VALUE]
FY10FY11FY12FY13FY14FY15FY16FY17FY18134539312115249782
State Support and Net Patient Revenue
Net Patient Revenue
FY13FY14FY15FY16FY17 ForecastFY18 Budget358367701372814684431182934452366520457724062475098373Total State Support
FY13FY14FY15FY16FY17 ForecastFY18 Budget173192257213854874226796933235291486222513422218446953
Salary Expense ($M)
Faculty
201220132014201520162017 Forecast2018 Budget10730906310675877011258533911815635512336023712232893712468154592All Other Staff
201220132014201520162017 Forecast2018 Budget23385714823276053724060451024797392226323237126199454026494828507999998
John Dempsey Hospital vs Connecticut Hospital Association Fringe Rate
CHA rate
20052010201120122013201420152016201720180273899999999999980295403014031080000000000002030609999999999998028799999999999998028789999999999999029399999999999998029987999999999998030587759999999997JDH rate
2005201020112012201320142015201620172018038719999999999999044280000000000003044080000000000003043409999999999999046100989118483643053266397642863328054479050264180173057442497383828672059146205947123043066300000000000003
Fringe Benefit DifferentialFY 2013FY 2014FY 2015FY 2016FY 2017 ForecastFY2018 Budget135000001350000013500000135000001350000013500000Actual Hospital DifferentialFY 2013FY 2014FY 2015FY 2016FY 2017 ForecastFY2018 Budget170612883784000022559753009600000127567138709199995328022674020000063467286594704000743315787
1
2
3
4
5
6
7
8
9
A
B
C
Personal Services
3912
Fringe Benefits
2322
Correctional Managed Health Care
804
DrugsMedical Supplies
852
Other Expenses
2147
Expenditures ($M)
| FY18 Bottom Line - Original Projection | (5940) | |||
| Other revenue | 320 | |||
| Institutional workforce | 1100 | |||
| Purchased services | 050 | |||
| Other expenses | 040 | |||
| Net patient revenue | 990 | |||
| Clinical workforce planning | 470 | |||
| Clinical non labor | 010 | |||
| Clinical revenue cycle | 090 | |||
| State support (Governors revised budget) | (240) | |||
| SEBAC (estimated savings) | 1270 | |||
| FY18 Bottom line - Proposed Budget | (1840) | |||
| 1) Comparison of Fringe rate with CHA average | ||||||||||||||||||||||||||
| 2) Fringe differential compared to actual hospital differential | ||||||||||||||||||||||||||
| note fy18 was updated to match proposed budget rate of 663 | ||||||||||||||||||||||||||
| John Dempsey Hospital vs Connecticut Hospital Association Fringe | ||||||||||||||||||||||||||
| FY | CHA rate | JDH rate | ||||||||||||||||||||||||
| 2005 | 274 | 387 | ||||||||||||||||||||||||
| 2006 | 289 | 371 | ||||||||||||||||||||||||
| 2007 | 277 | 401 | ||||||||||||||||||||||||
| 2008 | 280 | 411 | ||||||||||||||||||||||||
| 2009 | 271 | 412 | ||||||||||||||||||||||||
| 2010 | 295 | 443 | ||||||||||||||||||||||||
| 2011 | 301 | 441 | ||||||||||||||||||||||||
| 2012 | 311 | 434 | ||||||||||||||||||||||||
| 2013 | 306 | 461 | ||||||||||||||||||||||||
| 2014 | 288 | 533 | ||||||||||||||||||||||||
| 2015 | 288 | 545 | ||||||||||||||||||||||||
| 2016 | 294 | 574 | ||||||||||||||||||||||||
| 2017 | 300 | 591 | ||||||||||||||||||||||||
| 2018 | 306 | 663 | ||||||||||||||||||||||||
| Plan Description | FY2010-11 | FY2011-12 | FY2012-13 | FY2013-14 | FY2014-15 | FY2015-16 | FY2016-17 | FY2017-2018 Estimates | ||||||||||||||||||
| Alternate Retirement Program (ARP) | 1003 | 818 | 917 | 1120 | 1170 | 1199 | 1193 | 1300 | ||||||||||||||||||
| SERS Hazardous Duty | 3719 | 3687 | 4871 | 5895 | 6243 | 6251 | 6994 | 8900 | ||||||||||||||||||
| SERS Retirement Regular | 4000 | 3941 | 4601 | 5471 | 5050 | 5358 | 5499 | 6100 | ||||||||||||||||||
| Unemployment Compensation | 016 | 020 | 026 | 012 | 015 | 012 | 006 | 026 | ||||||||||||||||||
| 8738 | 8466 | 10415 | 12498 | 12478 | 12820 | 13692 | 16326 | |||||||||||||||||||
| -31 | 230 | 200 | -02 | 27 | 68 | 192 | ||||||||||||||||||||
| SERS Retirement Regular Rate Increases | 167 | 189 | -77 | 61 | 26 | 109 | ||||||||||||||||||||
| Average increase for Health insurance (approximate amounts) | 850 | 14 | 6 | 4 | 6 | |||||||||||||||||||||
| FY 2007 | FY 2008 | FY 2009 | FY 2010 | FY 2011 | FY 2012 | FY 2013 | FY 2014 | FY 2015 | FY 2016 | FY 2017 Forecast | FY2018 Budget | |||||||||||||||
| UCH Profit (Loss) | (26272245) | (23382917) | (22965602) | 3992933 | 3961289 | (2922761) | (7203277) | (15458141) | (2876454) | (12564848) | (21554857) | |||||||||||||||
| Deficiency Appropriation | 22100000 | 21900000 | 22200000 | - 0 | - 0 | - 0 | - 0 | - 0 | - 0 | - 0 | - 0 | |||||||||||||||
| Bioscience CT | - 0 | - 0 | - 0 | - 0 | - 0 | - 0 | 500000 | 11900724 | 16765958 | 12458333 | 10857600 | |||||||||||||||
| Fringe Benefit Differential | - 0 | - 0 | 3600000 | 13500000 | 13500000 | 13500000 | 13500000 | 13500000 | 13500000 | 13500000 | 13500000 | 13500000 | ||||||||||||||
| State Approp | 78614491 | 96797174 | 106012205 | 117734347 | 119166814 | 108458794 | 108019733 | 113118217 | 114393008 | 123432329 | 111649501 | |||||||||||||||
| UCH Profit (Loss)-after Deficiency Approp | (4172245) | (1482917) | (765602) | 3992933 | 3961289 | (2922761) | (7203277) | (15458141) | (2876454) | (12564848) | (21554857) | |||||||||||||||
| Actual Hospital Differential | 17061288 | 25597530 | 27567139 | 32802267 | 34672866 | 43315787 | ||||||||||||||||||||
| FY 2014 | FY 2015 | FY 2016 | FY 2017 Forecast | FY2018 Forecast | ||||||||||||||||||||||
| Debt Service (MARB and Outpatient Pavilion) | 7007001 | 12044165 | 15985039 | 15985039 | 16021543 | |||||||||||||||||||||
| includes MRI in FY18 |
| 48463620 | 142 | ||||||||||||||||
| 2012 | 2013 | 2014 | 2015 | 2016 | 2017 Forecast | 2018 Budget | |||||||||||
| All Position Codes - - Incumbant | 341166211 | 339519307 | 353189850 | 366130278 | 386592608 | 384323477 | 389629831 | 114 | |||||||||
| Faculty | 107309063 | 106758770 | 112585339 | 118156355 | 123360237 | 122328937 | 124681546 | ||||||||||
| All Other Staff | 233857148 | 232760537 | 240604510 | 247973922 | 263232371 | 261994540 | 264948285 | ||||||||||
| Proposal | Additional Information | FY17 Cost | FY18 Cost ($M) | FY19 Cost ($M) | FY20 Cost ($M) | FY21 Cost ($M) | Total Cost ($M) | ||||||||||||
| Wage Increase | Unions | 0 hard freeze FY17FY18FY19$2000 one time stipend in FY1935 + [step Increase] in FY20 FY21 | Includes Fringe Benefits | $ - 0 | $ - 0 | $ 160 | $ - 0 | $ - 0 | $ 160 | ||||||||||
| Furlough Days | Unions | 3 Furlough Days in FY18 | Includes Fringe Benefits | $ - 0 | $ (34) | $ - 0 | $ - 0 | $ - 0 | $ (34) | ||||||||||
| Delay Longevity Payment | Unions | Delay longevity payment in FY18 | Need additional confirmation but assumption is that April 2018 longevity payment delayed to FY19 | $ - 0 | $ (14) | $ 14 | $ - 0 | $ - 0 | $ - 0 | ||||||||||
| Subtotal Wage Impact (including associated fringe benefits) | $ - 0 | $ (48) | $ 174 | $ - 0 | $ - 0 | $ 126 | |||||||||||||
| Health Insurance - Increase in employee share of premium | Unions | - Increase 1 each year in FY20FY21FY22 for existing employees - New employes at 15 - Mgmt already at 23 | Uconns share of the premium will decrease by 1 Will impact fringe cost | $ - 0 | $ - 0 | $ - 0 | $ - 0 | $ - 0 | $ - 0 | ||||||||||
| Mgmt | No change Management share increasing in FY18 to 23 | $ - 0 | $ - 0 | $ - 0 | $ - 0 | $ - 0 | $ - 0 | ||||||||||||
| Fringe Rate Impact | All other Pension and Healthcare changes IMPACT UNKNOWN | This should ultimately reduce fringe costs but additional information and further analysis is required to understand full impact OPM provided an estimated reduction to SERS rate of 6 | $ - 0 | ||||||||||||||||
| Retiree Healthcare | Retiree COLA health contribution and Medicare changes | This should ultimately reduce fringe costs but additional information and further analysis is required to understand full impact | $ - 0 | ||||||||||||||||
| Pension - Contribution | FY18 FY19 = Increase pension contribution by 15FY20 FY21 = Increase pension contribution by additional 05 | This should ultimately reduce fringe costs but additional information and further analysis is required to understand full impact | $ - 0 | ||||||||||||||||
| Pension - Tier IV | Hybrid pensiondefined contribution State will match 1 | This should ultimately reduce fringe costs but additional information and further analysis is required to understand full impact | $ - 0 | ||||||||||||||||
| TOTAL COST(SAVINGS) - UNION EMPLOYEES | $ - 0 | $ (48) | $ 174 | $ - 0 | $ - 0 | $ 126 |
| FY17 Forecast ($M) | FY18 Budget ($M) | Favorable (Unfavorable) ($M) | Notes | ||||||
| Appropriation | 1218 | 1178 | (40) | Governors revised budget | |||||
| Fringe Benefits amp Adjustments | 1007 | 1006 | (01) | ||||||
| Total State Support | $ 2225 | $ 2183 | |||||||
| Tuition and Fees | 233 | 244 | 11 | Approved tuition rate increase of 45 | |||||
| Grants amp Contracts | 864 | 872 | 08 | Research grant revenue remains flat | |||||
| InternsResidents | 630 | 667 | 37 | Growth in revenue offset by increased expenses | |||||
| Net Patient Revenue | 4577 | 4751 | 174 | 38 increase | |||||
| Correctional Managed Health Care | 835 | 804 | (31) | ||||||
| Other Revenue | 517 | 576 | 60 | ||||||
| Total Operating Revenues | $ 9880 | $ 10098 | $ 259 | ||||||
| Personal Services | 3843 | 3896 | 53 | Increase is related to mid year hires in FY17 | |||||
| Fringe Benefits | 2046 | 2211 | 165 | estimated Comprollers fringe rates used | |||||
| Correctional Managed Health Care | 835 | 804 | (31) | ||||||
| DrugsMedical Supplies | 823 | 847 | 24 | increase in drugsmedicals supplies related to increase in volume | |||||
| Other Expenses | 2530 | 2165 | (365) | ||||||
| Debt ServiceProjects | - 0 | - 0 | - 0 | ||||||
| Total Operating Expenses | 10077 | 9924 | (154) | ||||||
| Net Gain(Loss) | (197) | 1740 | 4125 | ||||||
| Net Patient Revenue | Total State Support | Net Patient Revenue | Total State Support | ||||||
| FY13 | 358367701 | 173192257 | 3584 | 1732 | |||||
| FY14 | 372814684 | 213854874 | 3728 | 2139 | |||||
| FY15 | 431182934 | 226796933 | 4312 | 2231 | |||||
| FY16 | 452366520 | 235291486 | 4524 | 2353 | |||||
| FY17 Forecast | 457724062 | 222513422 | 4577 | 2225 | |||||
| FY18 Budget | 475098373 | 218446953 | 4751 | 2184 | |||||
| per TM1 | per TM |
| Fiscal Year | Appropriation | Allotment | Democratic budget | Republican budget | |||||
| FY10 | 118972138 | 117734347 | |||||||
| FY11 | 119346347 | 119166814 | |||||||
| FY12 | 109669578 | 108458794 | |||||||
| FY13 | 112666627 | 108519733 | |||||||
| FY14 | 125542313 | 125018941 | |||||||
| FY15 | 135366969 | 131158966 | |||||||
| FY16 | 144290800 | 143898479 | |||||||
| FY17 | 134539312 | 130030646 | 134539312 | 134539312 | |||||
| FY18 | 125474563 | 126820354 | 115249782 | ||||||
| FY18 Budget Target | $ (184) | ||
| SEBAC estimated costs | |||
| Three furlough day savings not in FY19 | (34) | ||
| Longevity (postponed in FY18) | (28) | ||
| Lump Sum payments (estimated $2000) | (160) | ||
| Appropriation (Governors Recommended) | 55 | ||
| Clinical revenue | 90 | ||
| FY19 Estimated Budget | $ (261) |
| Revenues ($M) | Expenditures ($M) | ||||||||||||||||||||||||
| Appropriation | 1218 | Personal Services | 3843 | Original | Forecast | variance | |||||||||||||||||||
| Fringe Benefits amp Adjustments | 1007 | Fringe Benefits | 2046 | Total Operating Revenue | 77320 | 76560 | (760) | ||||||||||||||||||
| Total State Support | $ 2225 | Correctional Managed Health Care | 835 | State Support | 22470 | 22250 | (220) | ||||||||||||||||||
| Tuition and Fees | 233 | DrugsMedical Supplies | 823 | Restricted Capital Balances | |||||||||||||||||||||
| Grants amp Contracts | 864 | Other Expenses | 2152 | Use Allowance | 560 | 200 | (360) | 1820 | |||||||||||||||||
| InternsResidents | 630 | Debt ServiceProjects | 169 | State Bond Funds | 4440 | 2640 | (1800) | use fy18 carryforward | |||||||||||||||||
| Net Patient Revenue | 4577 | Total Operating Fund | $ 9868 | Departmental Grant Funds | 100 | 100 | - 0 | ||||||||||||||||||
| Correctional Managed Health Care | 835 | ||||||||||||||||||||||||
| Other Revenue | 517 | Research and Restricted Expenditures | 294 | Total Available for Spending | 104890 | 101750 | (3140) | ||||||||||||||||||
| Total Operating Fund | $ 9881 | Total Operating Expenditures | $ 10162 | Total Operating Expenses (less depreciation) | 97640 | 96990 | (650) | ||||||||||||||||||
| Current Approved Capital Projects | 250 | 250 | - 0 | balances carried into FY18 | |||||||||||||||||||||
| Research and Restricted Funds | 294 | Working Capital Needs | 200 | 200 | - 0 | State Bond Funds-EMR | 23700000 | State Bond funds EMR (41M less spent $173) | |||||||||||||||||
| FY 2017 Capital Spending | 1200 | 690 | (510) | Comprehensive Cancer Center | 1556995 | cash balance (orig amt 25M in FY13) | |||||||||||||||||||
| Total Current Funds Revenues | $ 10175 | Net Gain(Loss) | $ 13 | State Bond Funds | 4390 | 2640 | (1750) | Health Disparity | 1166252 | cash balance (orig amt 25M in FY13) | |||||||||||||||
| Use Allowance | 560 | 200 | (360) | 26423247 | |||||||||||||||||||||
| Departmental Grant Funds | 100 | 100 | - 0 | ||||||||||||||||||||||
| Principal Payment on Debt | 550 | 550 | - 0 | ||||||||||||||||||||||
| Total Spending Plan | 104890 | 101620 | (3270) | ||||||||||||||||||||||
| Excess(Deficiency) | - 0 | 130 | 130 | ||||||||||||||||||||||
| FY17 Capital Budget Pools | |||||||||||||||||||||||||
| Dept Name | Description of Equipment or Project | Original Budget | Source of Funds | balance as of June 2017 | spent | epic | |||||||||||||||||||
| Information Tech | EPIC Project (1) | 3500000 | Operating | 2500000 | 1000000 | 2000000 | FY16 | ||||||||||||||||||
| Campus Planning | Capitalized Positions | 779619 | Operating | - 0 | 779619 | 3500000 | FY17 | ||||||||||||||||||
| Library | Library Acquisitions | 1080000 | Operating | - 0 | 1080000 | (3000000) | spent | ||||||||||||||||||
| Finance | UCH Contingency | 2603139 | Operating | 951432 | 1651707 | 2500000 | balance available | ||||||||||||||||||
| Finance | CFO - Hold | 4000000 | Operating | 3594475 | 405525 | ||||||||||||||||||||
| 11962758 | 7045907 | 4916851 | |||||||||||||||||||||||
| 2000000 | per jeff | ||||||||||||||||||||||||
| 6916851 |
| Revenues ($M) | Expenditures ($M) | ||||||||||||||||||
| Appropriation | 1218 | Personal Services | 3843 | Appropriation | 1218 | Personal Services | 3843 | ||||||||||||
| Fringe Benefits amp Adjustments | 1007 | Fringe Benefits | 2046 | Fringe Benefits amp Adjustments | 1007 | Fringe Benefits | 2046 | ||||||||||||
| Total State Support | $ 2225 | Correctional Managed Health Care | 835 | Total State Support | $ 2225 | Correctional Managed Health Care | 835 | ||||||||||||
| Tuition and Fees | 233 | DrugsMedical Supplies | 823 | Tuition and Fees | 233 | DrugsMedical Supplies | 823 | ||||||||||||
| Grants amp Contracts | 864 | Other Expenses | 2152 | Grants amp Contracts | 864 | Other Expenses | 2150 | ||||||||||||
| InternsResidents | 630 | Depreciation | 379 | InternsResidents | 630 | Depreciation | 379 | ||||||||||||
| Net Patient Revenue | 4577 | Total Operating Expenditures | $ 10078 | Net Patient Revenue | 4577 | Total Operating Expenses | 10077 | ||||||||||||
| Correctional Managed Health Care | 835 | Correctional Managed Health Care | 835 | ||||||||||||||||
| Other Revenue | 517 | Other Revenue | 517 | Net Gain(Loss) | (197) | ||||||||||||||
| Total Operating Revenues | $ 9881 | Net Gain(Loss) | $ (197) | Total Operating Revenues | $ 9880 | ||||||||||||||
| Spending plan FY18 (detail capital) | ||||||||
| Original | Revised | |||||||
| Depreciation | 35801260 | 35801260 | ||||||
| EPIC - Carryforward (orig $55M spent $30M) | (2500000) | (2500000) | ||||||
| EPIC - FY18 | (3500000) | (3500000) | ||||||
| Debt payments | (6576264) | (6576264) | ||||||
| Capital Pool - FY18 | (2453042) | (2453042) | ||||||
| Library e-resources | (500000) | - 0 | moved to operating-offset by inkind fb | |||||
| IT Pool | (1000000) | (1000000) | ||||||
| Capital Projects carryforward | (871954) | (871954) | ||||||
| CFO contingency pool | - 0 | (1000000) | ||||||
| Library e-resources - use allowance | (500000) | - 0 | moved to operating offset by inkind fb | |||||
| Use allowance (part of the $684M) | 500000 | 500000 | use allowance cash still funding Library resouces in operating | |||||
| Total Debt serviceprojects | (17401260) | (17401260) | ||||||
| Operating Loss | (18400000) | (18400000) | ||||||
| Balance | - 0 | - 0 | ||||||
| FY18 | FY19 | |||||||||||||||
| Used in FY18 Budget --Governor Recommended Rev May 15 2017 | Senate and House Approved Budget 102017 | Variance | Lapses Distribution 11172017 | Net Appropriation | Senate and House Approved Budget 102017 | Variance | ||||||||||
| Block Grant | 106767742 | 106746887 | (20855) | (4437991) | 102308896 | 106746848 | (39) | |||||||||
| AHEC | - 0 | 374566 | 374566 | (199) | 374367 | 374566 | - 0 | |||||||||
| Bioscience CT funding | 10984843 | 10984843 | - 0 | (306086) | 10678757 | 11567183 | 582340 | |||||||||
| Workers Compensation Approp | 7721978 | 4320855 | (3401123) | - 0 | 4320855 | 4324771 | 3916 | |||||||||
| 125474563 | 122427151 | (3047412) | (4744276) | 117682875 | 123013368 | 586217 | ||||||||||
| Workers Compensation claims | (7721978) | (7721978) | - 0 | (7721978) | (7721978) | - 0 | ||||||||||
| 117752585 | 114705173 | (3047412) | (4744276) | 109960897 | 115291390 | 586217 | ||||||||||
| 74 used | 69 used | |||||||||||||||
| Inkind fb | 87136913 | 81234894 | (5902019) | (3273413) | 77961481 | |||||||||||
| add fringe differential | 13500000 | 13500000 | 13500000 | |||||||||||||
| 100636913 | 94734894 | (5902019) | 91461481 | (3273413) | ||||||||||||
| total State support gross (before wc claims) | 226111476 | 217162045 | (8949431) | 209144356 | ||||||||||||
| total State support net (after wc claims) | 218389498 | 209440067 | (8949431) | 201422378 | ||||||||||||
| Inkind fb | 87121480 | 92197925 | ||||||||||||||
| add fringe differential | 13500000 | 13500000 | ||||||||||||||
| 100621480 | 105697925 | 5076445 | ||||||||||||||
| total State support gross (before wc claims) | 223048631 | 223380800 | ||||||||||||||
| total State support net (after wc claims) | 215326653 | 215658822 |
| Expenditures ($M) | |||
| Personal Services | 3912 | ||
| Fringe Benefits | 2322 | ||
| Correctional Managed Health Care | 804 | ||
| DrugsMedical Supplies | 852 | ||
| Other Expenses | 2147 | ||
| Debt ServiceProjects | 174 | ||
| Total Operating Fund | $ 10211 | ||
| Research and Restricted Expenditures | 684 | ||
| Total Operating Expenditures | $ 10895 | ||
| Personal Services | 3912 | ||
| Fringe Benefits | 2322 | ||
| Correctional Managed Health Care | 804 | ||
| DrugsMedical Supplies | 852 | ||
| Other Expenses | 2147 | ||
| Debt ServiceProjects | 174 | ||
| Research and Restricted Expenditures | 684 |
| Revenues ($M) | |||
| Appropriation | 1177 | ||
| Fringe Benefits amp Adjustments | 1057 | ||
| Total State Support | $ 2234 | ||
| Tuition | 200 | ||
| Fees | 44 | ||
| Grants amp Contracts | 849 | ||
| InternsResidents | 667 | ||
| Net Patient Revenue | 4827 | ||
| Correctional Managed Health Care | 804 | ||
| Other Revenue | 586 | ||
| Total Operating Fund | $ 10211 | ||
| Research and Restricted Funds | 684 | ||
| Total Current Funds Revenues | $ 10895 | ||
| State Support | 2234 | ||
| Tuition | 200 | ||
| Fees | 44 | ||
| Grants amp Contracts | 849 | ||
| InternsResidents | 667 | ||
| Net Patient Revenue | 4827 | ||
| Correctional Managed Health Care | 804 | ||
| Other Revenue | 586 | ||
| Research and Restricted Funds | 684 | ||
| FY18 Original BOT Budget ($M) | FY18 Revised Budget ($M) | Favorable (Unfavorable) ($M) | Notes | ||||||
| Appropriation | 1254 | 1177 | (77) | Reduction in workers compensation and lapses | |||||
| Fringe Benefits amp Adjustments | 1006 | 1057 | 51 | increase due to increase in fringe rates | |||||
| Total State Support | $ 2260 | $ 2234 | $ (26) | ||||||
| Tuition | 200 | 200 | - 0 | ||||||
| Fees | 44 | 44 | - 0 | ||||||
| Grants amp Contracts | 872 | 849 | (23) | First quarter results | |||||
| InternsResidents | 667 | 667 | - 0 | ||||||
| Net Patient Revenue | 4751 | 4827 | 76 | Enhanced payments and first quarter results | |||||
| Correctional Managed Health Care | 804 | 804 | - 0 | ||||||
| Other Revenue | 576 | 586 | 10 | First quarter results - retail pharmacy | |||||
| - 0 | |||||||||
| Total Operating Fund | $ 10174 | $ 10211 | $ 37 | ||||||
| Research and Restricted Funds | 684 | 684 | - 0 | ||||||
| Total Current Funds Revenues | $ 10858 | $ 10895 | $ 37 | ||||||
| Personal Services | 3896 | 3912 | (16) | Implementation of final SEBAC provisions | |||||
| Fringe Benefits | 2288 | 2322 | (34) | Implementation of final SEBAC provisions | |||||
| Correctional Managed Health Care | 804 | 804 | - 0 | ||||||
| DrugsMedical Supplies | 847 | 852 | (05) | First quarter results | |||||
| Other Expenses | 2165 | 2147 | 18 | First quarter results | |||||
| Debt ServiceProjects | 174 | 174 | (00) | ||||||
| Total Operating Fund | $ 10174 | $ 10211 | $ (37) | ||||||
| Research and Restricted Expenditures | 684 | 684 | - 0 | ||||||
| Total Operating Expenditures | $ 10858 | $ 10895 | $ (37) | ||||||
| Net Gain(Loss) | $ - 0 | $ (00) | $ (00) | ||||||
| UConn Health | ||||
| Spending Plan for Fiscal Year 2018 | ||||
| Revenues | ||||
| Appropriation | 117752585 | |||
| Fringe Benefits amp Adjustments | 100594368 | |||
| Total State Support | $ 218346953 | |||
| Tuition and Fees | 24402915 | |||
| Grants amp Contracts | 87178304 | |||
| InternsResidents | 66694948 | |||
| Net Patient Revenue | 475098373 | |||
| Correctional Managed Health Care | 80426658 | |||
| Other Revenue | 57635408 | |||
| Total Operating Funds | $ 1009783559 | |||
| Research and Restricted Funds | 68423247 | |||
| Total Current Funds Revenues | $ 1078206806 | |||
| Expenditures | ||||
| Personal Services | 389629832 | |||
| Fringe Benefits | 221135897 | |||
| Correctional Managed Health Care | 80426658 | |||
| DrugsMedical Supplies | 84704197 | |||
| Other Expenses | 216482470 | |||
| Debt ServiceProjects | 17401260 | |||
| Total Operating Funds | $ 1009780314 | |||
| Research and Restricted Expenditures | 68423247 | |||
| Total Operating Expenditures | $ 1078203561 | |||
| Net Gain | $ 3245 | |||
| Revenues ($M) | Expenditures ($M) | see notes below for summary of changes | |||||||||||||||||
| Appropriation | 1177 | Personal Services | 3912 | Appropriation | 1177 | Personal Services | 3912 | ||||||||||||
| Fringe Benefits amp Adjustments | 1057 | Fringe Benefits | 2322 | Fringe Benefits amp Adjustments | 1057 | Fringe Benefits | 2322 | ||||||||||||
| Total State Support | $ 2234 | Correctional Managed Health Care | 804 | Total State Support | $ 2234 | Correctional Managed Health Care | 804 | ||||||||||||
| Tuition | 200 | DrugsMedical Supplies | 852 | Tuition | 200 | DrugsMedical Supplies | 852 | ||||||||||||
| Fees | 44 | Other Expenses | 2147 | Fees | 44 | Other Expenses | 2147 | ||||||||||||
| Grants amp Contracts | 849 | Depreciation | 358 | Grants amp Contracts | 849 | Depreciation | 358 | ||||||||||||
| InternsResidents | 667 | Total Operating Expenditures | $ 10395 | InternsResidents | 667 | Total Operating Fund | 10395 | ||||||||||||
| Net Patient Revenue | 4827 | Net Patient Revenue | 4827 | ||||||||||||||||
| Correctional Managed Health Care | 804 | Correctional Managed Health Care | 804 | ||||||||||||||||
| Other Revenue | 586 | Other Revenue | 586 | ||||||||||||||||
| Total Operating Revenues | $ 10211 | Net Gain(Loss) | $ (184) | Total Operating Fund | $ 10211 | Net Gain(Loss) | (1838) | ||||||||||||
| Notes - Revisions to original budget presented June28th | |||||||||||||||||||
| Approp revised to approved budget - Oct 2017 and added back the wc - and reduced with lapses of 47M | |||||||||||||||||||
| inkind fringe updated using new approp and lapses- 816 rate used was 74 | |||||||||||||||||||
| split tuition and fees (per request of storrs) | |||||||||||||||||||
| Reduced Grants and contract - first qtr results $23M | |||||||||||||||||||
| workers comps claims of $7721978 moved to fringe exp (was netted out of approp in orig) | |||||||||||||||||||
| Net patient revenue increased by $30M (umg enhanced physician payments) and 1st quarter results $46M | |||||||||||||||||||
| Other revenue - first qtr results - Retail pharmacy | |||||||||||||||||||
| salary cost added 16M (SEBAC provisions longevity and clean up of furlough) | |||||||||||||||||||
| fb cost added $33M (half of Sebac reallocations) offset with addl inkind fringe | |||||||||||||||||||
| rounding issue $100k added to inkind fringe | |||||||||||||||||||
| Drugs and Med supplies $500K added - first quarter results | |||||||||||||||||||
| other expenses $500K added for eresources (maintenance and subscription fees) and first qtr results research decrease $23M |
| Revenues ($M) | Expenditures ($M) | see notes below for summary of changes | |||||||||||||||||
| Appropriation | 1177 | Personal Services | 3912 | Appropriation | 1177 | Personal Services | 3912 | ||||||||||||
| Fringe Benefits amp Adjustments | 1057 | Fringe Benefits | 2322 | Fringe Benefits amp Adjustments | 1057 | Fringe Benefits | 2322 | ||||||||||||
| Total State Support | $ 2234 | Correctional Managed Health Care | 804 | Total State Support | $ 2234 | Correctional Managed Health Care | 804 | ||||||||||||
| Tuition | 200 | DrugsMedical Supplies | 852 | Tuition | 200 | DrugsMedical Supplies | 852 | ||||||||||||
| Fees | 44 | Other Expenses | 2147 | Fees | 44 | Other Expenses | 2147 | ||||||||||||
| Grants amp Contracts | 849 | Debt ServiceProjects | 174 | Grants amp Contracts | 849 | Debt ServiceProjects | 174 | ||||||||||||
| InternsResidents | 667 | Total Operating Fund | $ 10211 | InternsResidents | 667 | Total Operating Fund | 10211 | ||||||||||||
| Net Patient Revenue | 4827 | Net Patient Revenue | 4827 | ||||||||||||||||
| Correctional Managed Health Care | 804 | Research and Restricted Expenditures | 684 | Correctional Managed Health Care | 804 | Research and Restricted Expenditures | 684 | ||||||||||||
| Other Revenue | 586 | Other Revenue | 586 | ||||||||||||||||
| Total Operating Fund | $ 10211 | Total Operating Expenditures | $ 10895 | Total Operating Fund | $ 10211 | Total Operating Expenditures | $ 10895 | ||||||||||||
| Research and Restricted Funds | 684 | Research and Restricted Funds | 684 | ||||||||||||||||
| Total Current Funds Revenues | $ 10895 | Net Gain(Loss) | $ (00) | Total Current Funds Revenues | $ 10895 | Net Gain(Loss) | 00 | ||||||||||||
| Research and Restricted Funds - detail | |||||||||||||||||||
| Use Allowance | 7000000 | per Julie | |||||||||||||||||
| State Bond Funds-EMR | 23700000 | State Bond funds EMR (41M less spent $173) | storrs funds for EMR $48M | ||||||||||||||||
| Storrs Funds - EMR | 35000000 | per storrs agreement | FY18 | 35000000 | |||||||||||||||
| Comprehensive Cancer Center | 1556995 | cash balance (orig amt 25M in FY13) | FY19 | 13000000 | |||||||||||||||
| Health Disparity | 1166252 | cash balance (orig amt 25M in FY13) | 48000000 | ||||||||||||||||
| 68423247 | |||||||||||||||||||
| Notes - Revisions to original budget presented June28th | |||||||||||||||||||
| Approp revised to approved budget - Oct 2017 and added back the wc - and reduced with lapses of 47M | |||||||||||||||||||
| inkind fringe updated using new approp and lapses- 816 rate used was 74 | |||||||||||||||||||
| split tuition and fees (per request of storrs) | |||||||||||||||||||
| Reduced Grants and contract - first qtr results $23M | |||||||||||||||||||
| workers comps claims of $7721978 moved to fringe exp (was netted out of approp in orig) | |||||||||||||||||||
| Net patient revenue increased by $30M (umg enhanced physician payments) and 1st quarter results $46M | |||||||||||||||||||
| Other revenue - first qtr results - Retail pharmacy | |||||||||||||||||||
| salary cost added 16M (SEBAC provisions longevity and clean up of furlough) | |||||||||||||||||||
| fb cost added $33M (half of Sebac reallocations) offset with addl inkind fringe | |||||||||||||||||||
| rounding issue $100k added to inkind fringe | |||||||||||||||||||
| Drugs and Med supplies $500K added - first quarter results | |||||||||||||||||||
| other expenses $500K added for eresources (maintenance and subscription fees) and first qtr results research decrease $23M |
| FY18 Budget Target | |||||||
| FY18 Bottom line - Preliminary Projection | $ (5940) | ||||||
| Financial interventions posted to budget | 1270 | ||||||
| FY18 Bottom line - Current | $ (4670) | ||||||
| Not Posted to Budget | |||||||
| SEBAC (Estimated Savings) | 1270 | ||||||
| UMG | |||||||
| Revenue increase (Adding an additional Patient per week would be approximately $13M) | 400 | need broad categories of these savings | |||||
| Expense reduction | 350 | Annes will provide summary | |||||
| JDH | |||||||
| Revenue increase | 400 | ||||||
| Expense reduction | 410 | ||||||
| FY18 Bottom line Target | $ (1840) | ||||||
| FY18 Preliminary Forecast and Assumptions | ||||
| Bottom line | ||||
| FY2017 Budget | $ (197) | |||
| Estimated additional clinical revenue (2 increase) | 90 | |||
| State Support reduction (Gov Rec compared to Allotment Amount - includes Block Grant In-kind Fringes Bioscience and Workers Compensation) | (118) | |||
| NICU Rental Income decrease (Per contract) | (10) | |||
| Research Grants | (19) | |||
| Fringe Benefit - retirement rates per comptrollers estimates (Net of in-kind fb) | (68) | |||
| Fringe Benefit - estimates of Insurance increases (Net of in-kind fb) | (40) | |||
| FY2018 Original Projection (without Health One) | $ (361) | |||
| Health One - revenue reduction | (113) | |||
| Health One - training and back fill | (120) | |||
| Total FY18 Preliminary Forecast | $ (594) | |||
| FY17 Forecast vs FY17 Budget | ||||||||||
| FY17 Budget | FY17 Forecast | Variance | ||||||||
| Revenues | ||||||||||
| Net Patient Care | $ 4715 | $ 4567 | $ (148) | |||||||
| Other Revenue | 2241 | 2243 | 02 | |||||||
| Correctional Managed Health Care | 833 | 824 | (09) | |||||||
| State Support | 1236 | 1218 | (18) | |||||||
| In-kind Fringe Benefits and Differential | 976 | 1007 | 31 | |||||||
| Total Revenue | $ 10001 | $ 9860 | $ (141) | |||||||
| Expenses | ||||||||||
| Salary | $ 3857 | $ 3843 | $ (14) | |||||||
| Fringe Benefits | 2066 | 2037 | (29) | |||||||
| Correctional Managed Health Care | 833 | 824 | (09) | |||||||
| Other Expenses | 3404 | 3352 | (52) | |||||||
| Total Expenses | $ 10160 | $ 10056 | $ (104) | |||||||
| Excess(Deficiency) of Revenues over Expenses | $ (159) | $ (197) | $ (38) | |||||||
| notes for Jeff | ||||||||||
| summary of forecast changes | (21554857) | |||||||||
| Third Party updated thru April YTD | (3000000) | |||||||||
| IT review | 183120 | |||||||||
| Core Reconciliation | 1800000 | |||||||||
| Interns amp Res | 823000 | |||||||||
| Hemophilia clinic340B pharmacy | 1360329 | |||||||||
| Library (moved to capital) | 108000 | |||||||||
| Facilities Mgmt | 223012 | |||||||||
| Creative Child Care | 23000 | |||||||||
| Fire Dept | 76780 | |||||||||
| ResearchAcademic review of spend | 1258000 | |||||||||
| 2855241 | ||||||||||
| (18699616) | ||||||||||
| FY18 Budget Assumptions | ||
| The following presentation assumes | ||
| Tuition and Fees - overall 45 rate increase | ||
| Research revenue - slight increase offset by additional expenses | ||
| Salaries - no increase related to bargaining units due to no settled contracts as of budget preparation | ||
| Fringes - State Comptrollers estimated state retirement rates used | ||
| Appropriation - Governors Recommended Revised budget as of May 15 2017 | ||
| FY 2013 | FY 2014 | FY 2015 | FY 2016 | FY 2017 Forecast | FY2018 Budget | ||||||||
| UCH Profit (Loss) | (7203277) | (15458141) | (2876454) | (12564848) | (19688715) | (59400000) | |||||||
| UCH Profit (Loss) | (72) | (155) | (29) | (126) | (197) | (594) | |||||||
| Orig Projection | Final Budget | ActualsForecast | ||||||||||||||||||||
| FY14 | (210) | (110) | (155) | |||||||||||||||||||
| FY15 | (259) | (125) | (29) | |||||||||||||||||||
| FY16 | (400) | (159) | (126) | |||||||||||||||||||
| FY17 | (481) | (159) | (197) | |||||||||||||||||||
| FY18 | (594) | (184) | ||||||||||||||||||||
| Note | ||||||||||||||||||||||
| Financial Improvement Project began in FY2014 - Total savings of $103M |
| FY18 Bottom Line - Original Projection | (5940) | |||
| Other revenue | 320 | |||
| Institutional workforce | 1100 | |||
| Purchased services | 050 | |||
| Other expenses | 040 | |||
| Net patient revenue | 990 | |||
| Clinical workforce planning | 470 | |||
| Clinical non labor | 010 | |||
| Clinical revenue cycle | 090 | |||
| State support (Governors revised budget) | (240) | |||
| SEBAC (estimated savings) | 1270 | |||
| FY18 Bottom line - Proposed Budget | (1840) | |||
| 1) Comparison of Fringe rate with CHA average | ||||||||||||||||||||||||||
| 2) Fringe differential compared to actual hospital differential | ||||||||||||||||||||||||||
| note fy18 was updated to match proposed budget rate of 663 | ||||||||||||||||||||||||||
| John Dempsey Hospital vs Connecticut Hospital Association Fringe | ||||||||||||||||||||||||||
| FY | CHA rate | JDH rate | ||||||||||||||||||||||||
| 2005 | 274 | 387 | ||||||||||||||||||||||||
| 2006 | 289 | 371 | ||||||||||||||||||||||||
| 2007 | 277 | 401 | ||||||||||||||||||||||||
| 2008 | 280 | 411 | ||||||||||||||||||||||||
| 2009 | 271 | 412 | ||||||||||||||||||||||||
| 2010 | 295 | 443 | ||||||||||||||||||||||||
| 2011 | 301 | 441 | ||||||||||||||||||||||||
| 2012 | 311 | 434 | ||||||||||||||||||||||||
| 2013 | 306 | 461 | ||||||||||||||||||||||||
| 2014 | 288 | 533 | ||||||||||||||||||||||||
| 2015 | 288 | 545 | ||||||||||||||||||||||||
| 2016 | 294 | 574 | ||||||||||||||||||||||||
| 2017 | 300 | 591 | ||||||||||||||||||||||||
| 2018 | 306 | 663 | ||||||||||||||||||||||||
| Plan Description | FY2010-11 | FY2011-12 | FY2012-13 | FY2013-14 | FY2014-15 | FY2015-16 | FY2016-17 | FY2017-2018 Estimates | ||||||||||||||||||
| Alternate Retirement Program (ARP) | 1003 | 818 | 917 | 1120 | 1170 | 1199 | 1193 | 1300 | ||||||||||||||||||
| SERS Hazardous Duty | 3719 | 3687 | 4871 | 5895 | 6243 | 6251 | 6994 | 8900 | ||||||||||||||||||
| SERS Retirement Regular | 4000 | 3941 | 4601 | 5471 | 5050 | 5358 | 5499 | 6100 | ||||||||||||||||||
| Unemployment Compensation | 016 | 020 | 026 | 012 | 015 | 012 | 006 | 026 | ||||||||||||||||||
| 8738 | 8466 | 10415 | 12498 | 12478 | 12820 | 13692 | 16326 | |||||||||||||||||||
| -31 | 230 | 200 | -02 | 27 | 68 | 192 | ||||||||||||||||||||
| SERS Retirement Regular Rate Increases | 167 | 189 | -77 | 61 | 26 | 109 | ||||||||||||||||||||
| Average increase for Health insurance (approximate amounts) | 850 | 14 | 6 | 4 | 6 | |||||||||||||||||||||
| FY 2007 | FY 2008 | FY 2009 | FY 2010 | FY 2011 | FY 2012 | FY 2013 | FY 2014 | FY 2015 | FY 2016 | FY 2017 Forecast | FY2018 Budget | |||||||||||||||
| UCH Profit (Loss) | (26272245) | (23382917) | (22965602) | 3992933 | 3961289 | (2922761) | (7203277) | (15458141) | (2876454) | (12564848) | (21554857) | |||||||||||||||
| Deficiency Appropriation | 22100000 | 21900000 | 22200000 | - 0 | - 0 | - 0 | - 0 | - 0 | - 0 | - 0 | - 0 | |||||||||||||||
| Bioscience CT | - 0 | - 0 | - 0 | - 0 | - 0 | - 0 | 500000 | 11900724 | 16765958 | 12458333 | 10857600 | |||||||||||||||
| Fringe Benefit Differential | - 0 | - 0 | 3600000 | 13500000 | 13500000 | 13500000 | 13500000 | 13500000 | 13500000 | 13500000 | 13500000 | 13500000 | ||||||||||||||
| State Approp | 78614491 | 96797174 | 106012205 | 117734347 | 119166814 | 108458794 | 108019733 | 113118217 | 114393008 | 123432329 | 111649501 | |||||||||||||||
| UCH Profit (Loss)-after Deficiency Approp | (4172245) | (1482917) | (765602) | 3992933 | 3961289 | (2922761) | (7203277) | (15458141) | (2876454) | (12564848) | (21554857) | |||||||||||||||
| Actual Hospital Differential | 17061288 | 25597530 | 27567139 | 32802267 | 34672866 | 43315787 | ||||||||||||||||||||
| FY 2014 | FY 2015 | FY 2016 | FY 2017 Forecast | FY2018 Forecast | ||||||||||||||||||||||
| Debt Service (MARB and Outpatient Pavilion) | 7007001 | 12044165 | 15985039 | 15985039 | 16021543 | |||||||||||||||||||||
| includes MRI in FY18 |
| 48463620 | 142 | ||||||||||||||||
| 2012 | 2013 | 2014 | 2015 | 2016 | 2017 Forecast | 2018 Budget | |||||||||||
| All Position Codes - - Incumbant | 341166211 | 339519307 | 353189850 | 366130278 | 386592608 | 384323477 | 389629831 | 114 | |||||||||
| Faculty | 107309063 | 106758770 | 112585339 | 118156355 | 123360237 | 122328937 | 124681546 | ||||||||||
| All Other Staff | 233857148 | 232760537 | 240604510 | 247973922 | 263232371 | 261994540 | 264948285 | ||||||||||
| Proposal | Additional Information | FY17 Cost | FY18 Cost ($M) | FY19 Cost ($M) | FY20 Cost ($M) | FY21 Cost ($M) | Total Cost ($M) | ||||||||||||
| Wage Increase | Unions | 0 hard freeze FY17FY18FY19$2000 one time stipend in FY1935 + [step Increase] in FY20 FY21 | Includes Fringe Benefits | $ - 0 | $ - 0 | $ 160 | $ - 0 | $ - 0 | $ 160 | ||||||||||
| Furlough Days | Unions | 3 Furlough Days in FY18 | Includes Fringe Benefits | $ - 0 | $ (34) | $ - 0 | $ - 0 | $ - 0 | $ (34) | ||||||||||
| Delay Longevity Payment | Unions | Delay longevity payment in FY18 | Need additional confirmation but assumption is that April 2018 longevity payment delayed to FY19 | $ - 0 | $ (14) | $ 14 | $ - 0 | $ - 0 | $ - 0 | ||||||||||
| Subtotal Wage Impact (including associated fringe benefits) | $ - 0 | $ (48) | $ 174 | $ - 0 | $ - 0 | $ 126 | |||||||||||||
| Health Insurance - Increase in employee share of premium | Unions | - Increase 1 each year in FY20FY21FY22 for existing employees - New employes at 15 - Mgmt already at 23 | Uconns share of the premium will decrease by 1 Will impact fringe cost | $ - 0 | $ - 0 | $ - 0 | $ - 0 | $ - 0 | $ - 0 | ||||||||||
| Mgmt | No change Management share increasing in FY18 to 23 | $ - 0 | $ - 0 | $ - 0 | $ - 0 | $ - 0 | $ - 0 | ||||||||||||
| Fringe Rate Impact | All other Pension and Healthcare changes IMPACT UNKNOWN | This should ultimately reduce fringe costs but additional information and further analysis is required to understand full impact OPM provided an estimated reduction to SERS rate of 6 | $ - 0 | ||||||||||||||||
| Retiree Healthcare | Retiree COLA health contribution and Medicare changes | This should ultimately reduce fringe costs but additional information and further analysis is required to understand full impact | $ - 0 | ||||||||||||||||
| Pension - Contribution | FY18 FY19 = Increase pension contribution by 15FY20 FY21 = Increase pension contribution by additional 05 | This should ultimately reduce fringe costs but additional information and further analysis is required to understand full impact | $ - 0 | ||||||||||||||||
| Pension - Tier IV | Hybrid pensiondefined contribution State will match 1 | This should ultimately reduce fringe costs but additional information and further analysis is required to understand full impact | $ - 0 | ||||||||||||||||
| TOTAL COST(SAVINGS) - UNION EMPLOYEES | $ - 0 | $ (48) | $ 174 | $ - 0 | $ - 0 | $ 126 |
| FY17 Forecast ($M) | FY18 Budget ($M) | Favorable (Unfavorable) ($M) | Notes | ||||||
| Appropriation | 1218 | 1178 | (40) | Governors revised budget | |||||
| Fringe Benefits amp Adjustments | 1007 | 1006 | (01) | ||||||
| Total State Support | $ 2225 | $ 2183 | |||||||
| Tuition and Fees | 233 | 244 | 11 | Approved tuition rate increase of 45 | |||||
| Grants amp Contracts | 864 | 872 | 08 | Research grant revenue remains flat | |||||
| InternsResidents | 630 | 667 | 37 | Growth in revenue offset by increased expenses | |||||
| Net Patient Revenue | 4577 | 4751 | 174 | 38 increase | |||||
| Correctional Managed Health Care | 835 | 804 | (31) | ||||||
| Other Revenue | 517 | 576 | 60 | ||||||
| Total Operating Revenues | $ 9880 | $ 10098 | $ 259 | ||||||
| Personal Services | 3843 | 3896 | 53 | Increase is related to mid year hires in FY17 | |||||
| Fringe Benefits | 2046 | 2211 | 165 | estimated Comprollers fringe rates used | |||||
| Correctional Managed Health Care | 835 | 804 | (31) | ||||||
| DrugsMedical Supplies | 823 | 847 | 24 | increase in drugsmedicals supplies related to increase in volume | |||||
| Other Expenses | 2530 | 2165 | (365) | ||||||
| Debt ServiceProjects | - 0 | - 0 | - 0 | ||||||
| Total Operating Expenses | 10077 | 9924 | (154) | ||||||
| Net Gain(Loss) | (197) | 1740 | 4125 | ||||||
| Net Patient Revenue | Total State Support | Net Patient Revenue | Total State Support | ||||||
| FY13 | 358367701 | 173192257 | 3584 | 1732 | |||||
| FY14 | 372814684 | 213854874 | 3728 | 2139 | |||||
| FY15 | 431182934 | 226796933 | 4312 | 2231 | |||||
| FY16 | 452366520 | 235291486 | 4524 | 2353 | |||||
| FY17 Forecast | 457724062 | 222513422 | 4577 | 2225 | |||||
| FY18 Budget | 475098373 | 218446953 | 4751 | 2184 | |||||
| per TM1 | per TM |
| Fiscal Year | Appropriation | Allotment | Democratic budget | Republican budget | |||||
| FY10 | 118972138 | 117734347 | |||||||
| FY11 | 119346347 | 119166814 | |||||||
| FY12 | 109669578 | 108458794 | |||||||
| FY13 | 112666627 | 108519733 | |||||||
| FY14 | 125542313 | 125018941 | |||||||
| FY15 | 135366969 | 131158966 | |||||||
| FY16 | 144290800 | 143898479 | |||||||
| FY17 | 134539312 | 130030646 | 134539312 | 134539312 | |||||
| FY18 | 125474563 | 126820354 | 115249782 | ||||||
| FY18 Budget Target | $ (184) | ||
| SEBAC estimated costs | |||
| Three furlough day savings not in FY19 | (34) | ||
| Longevity (postponed in FY18) | (28) | ||
| Lump Sum payments (estimated $2000) | (160) | ||
| Appropriation (Governors Recommended) | 55 | ||
| Clinical revenue | 90 | ||
| FY19 Estimated Budget | $ (261) |
| Revenues ($M) | Expenditures ($M) | ||||||||||||||||||||||||
| Appropriation | 1218 | Personal Services | 3843 | Original | Forecast | variance | |||||||||||||||||||
| Fringe Benefits amp Adjustments | 1007 | Fringe Benefits | 2046 | Total Operating Revenue | 77320 | 76560 | (760) | ||||||||||||||||||
| Total State Support | $ 2225 | Correctional Managed Health Care | 835 | State Support | 22470 | 22250 | (220) | ||||||||||||||||||
| Tuition and Fees | 233 | DrugsMedical Supplies | 823 | Restricted Capital Balances | |||||||||||||||||||||
| Grants amp Contracts | 864 | Other Expenses | 2152 | Use Allowance | 560 | 200 | (360) | 1820 | |||||||||||||||||
| InternsResidents | 630 | Debt ServiceProjects | 169 | State Bond Funds | 4440 | 2640 | (1800) | use fy18 carryforward | |||||||||||||||||
| Net Patient Revenue | 4577 | Total Operating Fund | $ 9868 | Departmental Grant Funds | 100 | 100 | - 0 | ||||||||||||||||||
| Correctional Managed Health Care | 835 | ||||||||||||||||||||||||
| Other Revenue | 517 | Research and Restricted Expenditures | 294 | Total Available for Spending | 104890 | 101750 | (3140) | ||||||||||||||||||
| Total Operating Fund | $ 9881 | Total Operating Expenditures | $ 10162 | Total Operating Expenses (less depreciation) | 97640 | 96990 | (650) | ||||||||||||||||||
| Current Approved Capital Projects | 250 | 250 | - 0 | balances carried into FY18 | |||||||||||||||||||||
| Research and Restricted Funds | 294 | Working Capital Needs | 200 | 200 | - 0 | State Bond Funds-EMR | 23700000 | State Bond funds EMR (41M less spent $173) | |||||||||||||||||
| FY 2017 Capital Spending | 1200 | 690 | (510) | Comprehensive Cancer Center | 1556995 | cash balance (orig amt 25M in FY13) | |||||||||||||||||||
| Total Current Funds Revenues | $ 10175 | Net Gain(Loss) | $ 13 | State Bond Funds | 4390 | 2640 | (1750) | Health Disparity | 1166252 | cash balance (orig amt 25M in FY13) | |||||||||||||||
| Use Allowance | 560 | 200 | (360) | 26423247 | |||||||||||||||||||||
| Departmental Grant Funds | 100 | 100 | - 0 | ||||||||||||||||||||||
| Principal Payment on Debt | 550 | 550 | - 0 | ||||||||||||||||||||||
| Total Spending Plan | 104890 | 101620 | (3270) | ||||||||||||||||||||||
| Excess(Deficiency) | - 0 | 130 | 130 | ||||||||||||||||||||||
| FY17 Capital Budget Pools | |||||||||||||||||||||||||
| Dept Name | Description of Equipment or Project | Original Budget | Source of Funds | balance as of June 2017 | spent | epic | |||||||||||||||||||
| Information Tech | EPIC Project (1) | 3500000 | Operating | 2500000 | 1000000 | 2000000 | FY16 | ||||||||||||||||||
| Campus Planning | Capitalized Positions | 779619 | Operating | - 0 | 779619 | 3500000 | FY17 | ||||||||||||||||||
| Library | Library Acquisitions | 1080000 | Operating | - 0 | 1080000 | (3000000) | spent | ||||||||||||||||||
| Finance | UCH Contingency | 2603139 | Operating | 951432 | 1651707 | 2500000 | balance available | ||||||||||||||||||
| Finance | CFO - Hold | 4000000 | Operating | 3594475 | 405525 | ||||||||||||||||||||
| 11962758 | 7045907 | 4916851 | |||||||||||||||||||||||
| 2000000 | per jeff | ||||||||||||||||||||||||
| 6916851 |
| Revenues ($M) | Expenditures ($M) | ||||||||||||||||||
| Appropriation | 1218 | Personal Services | 3843 | Appropriation | 1218 | Personal Services | 3843 | ||||||||||||
| Fringe Benefits amp Adjustments | 1007 | Fringe Benefits | 2046 | Fringe Benefits amp Adjustments | 1007 | Fringe Benefits | 2046 | ||||||||||||
| Total State Support | $ 2225 | Correctional Managed Health Care | 835 | Total State Support | $ 2225 | Correctional Managed Health Care | 835 | ||||||||||||
| Tuition and Fees | 233 | DrugsMedical Supplies | 823 | Tuition and Fees | 233 | DrugsMedical Supplies | 823 | ||||||||||||
| Grants amp Contracts | 864 | Other Expenses | 2152 | Grants amp Contracts | 864 | Other Expenses | 2150 | ||||||||||||
| InternsResidents | 630 | Depreciation | 379 | InternsResidents | 630 | Depreciation | 379 | ||||||||||||
| Net Patient Revenue | 4577 | Total Operating Expenditures | $ 10078 | Net Patient Revenue | 4577 | Total Operating Expenses | 10077 | ||||||||||||
| Correctional Managed Health Care | 835 | Correctional Managed Health Care | 835 | ||||||||||||||||
| Other Revenue | 517 | Other Revenue | 517 | Net Gain(Loss) | (197) | ||||||||||||||
| Total Operating Revenues | $ 9881 | Net Gain(Loss) | $ (197) | Total Operating Revenues | $ 9880 | ||||||||||||||
| Spending plan FY18 (detail capital) | ||||||||
| Original | Revised | |||||||
| Depreciation | 35801260 | 35801260 | ||||||
| EPIC - Carryforward (orig $55M spent $30M) | (2500000) | (2500000) | ||||||
| EPIC - FY18 | (3500000) | (3500000) | ||||||
| Debt payments | (6576264) | (6576264) | ||||||
| Capital Pool - FY18 | (2453042) | (2453042) | ||||||
| Library e-resources | (500000) | - 0 | moved to operating-offset by inkind fb | |||||
| IT Pool | (1000000) | (1000000) | ||||||
| Capital Projects carryforward | (871954) | (871954) | ||||||
| CFO contingency pool | - 0 | (1000000) | ||||||
| Library e-resources - use allowance | (500000) | - 0 | moved to operating offset by inkind fb | |||||
| Use allowance (part of the $684M) | 500000 | 500000 | use allowance cash still funding Library resouces in operating | |||||
| Total Debt serviceprojects | (17401260) | (17401260) | ||||||
| Operating Loss | (18400000) | (18400000) | ||||||
| Balance | - 0 | - 0 | ||||||
| FY18 | FY19 | |||||||||||||||
| Used in FY18 Budget --Governor Recommended Rev May 15 2017 | Senate and House Approved Budget 102017 | Variance | Lapses Distribution 11172017 | Net Appropriation | Senate and House Approved Budget 102017 | Variance | ||||||||||
| Block Grant | 106767742 | 106746887 | (20855) | (4437991) | 102308896 | 106746848 | (39) | |||||||||
| AHEC | - 0 | 374566 | 374566 | (199) | 374367 | 374566 | - 0 | |||||||||
| Bioscience CT funding | 10984843 | 10984843 | - 0 | (306086) | 10678757 | 11567183 | 582340 | |||||||||
| Workers Compensation Approp | 7721978 | 4320855 | (3401123) | - 0 | 4320855 | 4324771 | 3916 | |||||||||
| 125474563 | 122427151 | (3047412) | (4744276) | 117682875 | 123013368 | 586217 | ||||||||||
| Workers Compensation claims | (7721978) | (7721978) | - 0 | (7721978) | (7721978) | - 0 | ||||||||||
| 117752585 | 114705173 | (3047412) | (4744276) | 109960897 | 115291390 | 586217 | ||||||||||
| 74 used | 69 used | |||||||||||||||
| Inkind fb | 87136913 | 81234894 | (5902019) | (3273413) | 77961481 | |||||||||||
| add fringe differential | 13500000 | 13500000 | 13500000 | |||||||||||||
| 100636913 | 94734894 | (5902019) | 91461481 | (3273413) | ||||||||||||
| total State support gross (before wc claims) | 226111476 | 217162045 | (8949431) | 209144356 | ||||||||||||
| total State support net (after wc claims) | 218389498 | 209440067 | (8949431) | 201422378 | ||||||||||||
| Inkind fb | 87121480 | 92197925 | ||||||||||||||
| add fringe differential | 13500000 | 13500000 | ||||||||||||||
| 100621480 | 105697925 | 5076445 | ||||||||||||||
| total State support gross (before wc claims) | 223048631 | 223380800 | ||||||||||||||
| total State support net (after wc claims) | 215326653 | 215658822 |
| Expenditures ($M) | |||
| Personal Services | 3912 | ||
| Fringe Benefits | 2322 | ||
| Correctional Managed Health Care | 804 | ||
| DrugsMedical Supplies | 852 | ||
| Other Expenses | 2147 | ||
| Debt ServiceProjects | 174 | ||
| Total Operating Fund | $ 10211 | ||
| Research and Restricted Expenditures | 684 | ||
| Total Operating Expenditures | $ 10895 | ||
| Personal Services | 3912 | ||
| Fringe Benefits | 2322 | ||
| Correctional Managed Health Care | 804 | ||
| DrugsMedical Supplies | 852 | ||
| Other Expenses | 2147 | ||
| Debt ServiceProjects | 174 | ||
| Research and Restricted Expenditures | 684 |
| Revenues ($M) | |||
| Appropriation | 1177 | ||
| Fringe Benefits amp Adjustments | 1057 | ||
| Total State Support | $ 2234 | ||
| Tuition | 200 | ||
| Fees | 44 | ||
| Grants amp Contracts | 849 | ||
| InternsResidents | 667 | ||
| Net Patient Revenue | 4827 | ||
| Correctional Managed Health Care | 804 | ||
| Other Revenue | 586 | ||
| Total Operating Fund | $ 10211 | ||
| Research and Restricted Funds | 684 | ||
| Total Current Funds Revenues | $ 10895 | ||
| State Support | 2234 | ||
| Tuition | 200 | ||
| Fees | 44 | ||
| Grants amp Contracts | 849 | ||
| InternsResidents | 667 | ||
| Net Patient Revenue | 4827 | ||
| Correctional Managed Health Care | 804 | ||
| Other Revenue | 586 | ||
| Research and Restricted Funds | 684 | ||
| FY18 Original BOT Budget ($M) | FY18 Revised Budget ($M) | Favorable (Unfavorable) ($M) | Notes | ||||||
| Appropriation | 1254 | 1177 | (77) | Reduction in workers compensation and lapses | |||||
| Fringe Benefits amp Adjustments | 1006 | 1057 | 51 | increase due to increase in fringe rates | |||||
| Total State Support | $ 2260 | $ 2234 | $ (26) | ||||||
| Tuition | 200 | 200 | - 0 | ||||||
| Fees | 44 | 44 | - 0 | ||||||
| Grants amp Contracts | 872 | 849 | (23) | First quarter results | |||||
| InternsResidents | 667 | 667 | - 0 | ||||||
| Net Patient Revenue | 4751 | 4827 | 76 | Enhanced payments and first quarter results | |||||
| Correctional Managed Health Care | 804 | 804 | - 0 | ||||||
| Other Revenue | 576 | 586 | 10 | First quarter results - retail pharmacy | |||||
| - 0 | |||||||||
| Total Operating Fund | $ 10174 | $ 10211 | $ 37 | ||||||
| Research and Restricted Funds | 684 | 684 | - 0 | ||||||
| Total Current Funds Revenues | $ 10858 | $ 10895 | $ 37 | ||||||
| Personal Services | 3896 | 3912 | (16) | Implementation of final SEBAC provisions | |||||
| Fringe Benefits | 2288 | 2322 | (34) | Implementation of final SEBAC provisions | |||||
| Correctional Managed Health Care | 804 | 804 | - 0 | ||||||
| DrugsMedical Supplies | 847 | 852 | (05) | First quarter results | |||||
| Other Expenses | 2165 | 2147 | 18 | First quarter results | |||||
| Debt ServiceProjects | 174 | 174 | (00) | ||||||
| Total Operating Fund | $ 10174 | $ 10211 | $ (37) | ||||||
| Research and Restricted Expenditures | 684 | 684 | - 0 | ||||||
| Total Operating Expenditures | $ 10858 | $ 10895 | $ (37) | ||||||
| Net Gain(Loss) | $ - 0 | $ (00) | $ (00) | ||||||
| UConn Health | ||||
| Spending Plan for Fiscal Year 2018 | ||||
| Revenues | ||||
| Appropriation | 117752585 | |||
| Fringe Benefits amp Adjustments | 100594368 | |||
| Total State Support | $ 218346953 | |||
| Tuition and Fees | 24402915 | |||
| Grants amp Contracts | 87178304 | |||
| InternsResidents | 66694948 | |||
| Net Patient Revenue | 475098373 | |||
| Correctional Managed Health Care | 80426658 | |||
| Other Revenue | 57635408 | |||
| Total Operating Funds | $ 1009783559 | |||
| Research and Restricted Funds | 68423247 | |||
| Total Current Funds Revenues | $ 1078206806 | |||
| Expenditures | ||||
| Personal Services | 389629832 | |||
| Fringe Benefits | 221135897 | |||
| Correctional Managed Health Care | 80426658 | |||
| DrugsMedical Supplies | 84704197 | |||
| Other Expenses | 216482470 | |||
| Debt ServiceProjects | 17401260 | |||
| Total Operating Funds | $ 1009780314 | |||
| Research and Restricted Expenditures | 68423247 | |||
| Total Operating Expenditures | $ 1078203561 | |||
| Net Gain | $ 3245 | |||
| Revenues ($M) | Expenditures ($M) | see notes below for summary of changes | |||||||||||||||||
| Appropriation | 1177 | Personal Services | 3912 | Appropriation | 1177 | Personal Services | 3912 | ||||||||||||
| Fringe Benefits amp Adjustments | 1057 | Fringe Benefits | 2322 | Fringe Benefits amp Adjustments | 1057 | Fringe Benefits | 2322 | ||||||||||||
| Total State Support | $ 2234 | Correctional Managed Health Care | 804 | Total State Support | $ 2234 | Correctional Managed Health Care | 804 | ||||||||||||
| Tuition | 200 | DrugsMedical Supplies | 852 | Tuition | 200 | DrugsMedical Supplies | 852 | ||||||||||||
| Fees | 44 | Other Expenses | 2147 | Fees | 44 | Other Expenses | 2147 | ||||||||||||
| Grants amp Contracts | 849 | Depreciation | 358 | Grants amp Contracts | 849 | Depreciation | 358 | ||||||||||||
| InternsResidents | 667 | Total Operating Expenditures | $ 10395 | InternsResidents | 667 | Total Operating Fund | 10395 | ||||||||||||
| Net Patient Revenue | 4827 | Net Patient Revenue | 4827 | ||||||||||||||||
| Correctional Managed Health Care | 804 | Correctional Managed Health Care | 804 | ||||||||||||||||
| Other Revenue | 586 | Other Revenue | 586 | ||||||||||||||||
| Total Operating Revenues | $ 10211 | Net Gain(Loss) | $ (184) | Total Operating Fund | $ 10211 | Net Gain(Loss) | (1838) | ||||||||||||
| Notes - Revisions to original budget presented June28th | |||||||||||||||||||
| Approp revised to approved budget - Oct 2017 and added back the wc - and reduced with lapses of 47M | |||||||||||||||||||
| inkind fringe updated using new approp and lapses- 816 rate used was 74 | |||||||||||||||||||
| split tuition and fees (per request of storrs) | |||||||||||||||||||
| Reduced Grants and contract - first qtr results $23M | |||||||||||||||||||
| workers comps claims of $7721978 moved to fringe exp (was netted out of approp in orig) | |||||||||||||||||||
| Net patient revenue increased by $30M (umg enhanced physician payments) and 1st quarter results $46M | |||||||||||||||||||
| Other revenue - first qtr results - Retail pharmacy | |||||||||||||||||||
| salary cost added 16M (SEBAC provisions longevity and clean up of furlough) | |||||||||||||||||||
| fb cost added $33M (half of Sebac reallocations) offset with addl inkind fringe | |||||||||||||||||||
| rounding issue $100k added to inkind fringe | |||||||||||||||||||
| Drugs and Med supplies $500K added - first quarter results | |||||||||||||||||||
| other expenses $500K added for eresources (maintenance and subscription fees) and first qtr results research decrease $23M |
| Revenues ($M) | Expenditures ($M) | see notes below for summary of changes | |||||||||||||||||
| Appropriation | 1177 | Personal Services | 3912 | Appropriation | 1177 | Personal Services | 3912 | ||||||||||||
| Fringe Benefits amp Adjustments | 1057 | Fringe Benefits | 2322 | Fringe Benefits amp Adjustments | 1057 | Fringe Benefits | 2322 | ||||||||||||
| Total State Support | $ 2234 | Correctional Managed Health Care | 804 | Total State Support | $ 2234 | Correctional Managed Health Care | 804 | ||||||||||||
| Tuition | 200 | DrugsMedical Supplies | 852 | Tuition | 200 | DrugsMedical Supplies | 852 | ||||||||||||
| Fees | 44 | Other Expenses | 2147 | Fees | 44 | Other Expenses | 2147 | ||||||||||||
| Grants amp Contracts | 849 | Debt ServiceProjects | 174 | Grants amp Contracts | 849 | Debt ServiceProjects | 174 | ||||||||||||
| InternsResidents | 667 | Total Operating Fund | $ 10211 | InternsResidents | 667 | Total Operating Fund | 10211 | ||||||||||||
| Net Patient Revenue | 4827 | Net Patient Revenue | 4827 | ||||||||||||||||
| Correctional Managed Health Care | 804 | Research and Restricted Expenditures | 684 | Correctional Managed Health Care | 804 | Research and Restricted Expenditures | 684 | ||||||||||||
| Other Revenue | 586 | Other Revenue | 586 | ||||||||||||||||
| Total Operating Fund | $ 10211 | Total Operating Expenditures | $ 10895 | Total Operating Fund | $ 10211 | Total Operating Expenditures | $ 10895 | ||||||||||||
| Research and Restricted Funds | 684 | Research and Restricted Funds | 684 | ||||||||||||||||
| Total Current Funds Revenues | $ 10895 | Net Gain(Loss) | $ (00) | Total Current Funds Revenues | $ 10895 | Net Gain(Loss) | 00 | ||||||||||||
| Research and Restricted Funds - detail | |||||||||||||||||||
| Use Allowance | 7000000 | per Julie | |||||||||||||||||
| State Bond Funds-EMR | 23700000 | State Bond funds EMR (41M less spent $173) | storrs funds for EMR $48M | ||||||||||||||||
| Storrs Funds - EMR | 35000000 | per storrs agreement | FY18 | 35000000 | |||||||||||||||
| Comprehensive Cancer Center | 1556995 | cash balance (orig amt 25M in FY13) | FY19 | 13000000 | |||||||||||||||
| Health Disparity | 1166252 | cash balance (orig amt 25M in FY13) | 48000000 | ||||||||||||||||
| 68423247 | |||||||||||||||||||
| Notes - Revisions to original budget presented June28th | |||||||||||||||||||
| Approp revised to approved budget - Oct 2017 and added back the wc - and reduced with lapses of 47M | |||||||||||||||||||
| inkind fringe updated using new approp and lapses- 816 rate used was 74 | |||||||||||||||||||
| split tuition and fees (per request of storrs) | |||||||||||||||||||
| Reduced Grants and contract - first qtr results $23M | |||||||||||||||||||
| workers comps claims of $7721978 moved to fringe exp (was netted out of approp in orig) | |||||||||||||||||||
| Net patient revenue increased by $30M (umg enhanced physician payments) and 1st quarter results $46M | |||||||||||||||||||
| Other revenue - first qtr results - Retail pharmacy | |||||||||||||||||||
| salary cost added 16M (SEBAC provisions longevity and clean up of furlough) | |||||||||||||||||||
| fb cost added $33M (half of Sebac reallocations) offset with addl inkind fringe | |||||||||||||||||||
| rounding issue $100k added to inkind fringe | |||||||||||||||||||
| Drugs and Med supplies $500K added - first quarter results | |||||||||||||||||||
| other expenses $500K added for eresources (maintenance and subscription fees) and first qtr results research decrease $23M |
| FY18 Budget Target | |||||||
| FY18 Bottom line - Preliminary Projection | $ (5940) | ||||||
| Financial interventions posted to budget | 1270 | ||||||
| FY18 Bottom line - Current | $ (4670) | ||||||
| Not Posted to Budget | |||||||
| SEBAC (Estimated Savings) | 1270 | ||||||
| UMG | |||||||
| Revenue increase (Adding an additional Patient per week would be approximately $13M) | 400 | need broad categories of these savings | |||||
| Expense reduction | 350 | Annes will provide summary | |||||
| JDH | |||||||
| Revenue increase | 400 | ||||||
| Expense reduction | 410 | ||||||
| FY18 Bottom line Target | $ (1840) | ||||||
| FY18 Preliminary Forecast and Assumptions | ||||
| Bottom line | ||||
| FY2017 Budget | $ (197) | |||
| Estimated additional clinical revenue (2 increase) | 90 | |||
| State Support reduction (Gov Rec compared to Allotment Amount - includes Block Grant In-kind Fringes Bioscience and Workers Compensation) | (118) | |||
| NICU Rental Income decrease (Per contract) | (10) | |||
| Research Grants | (19) | |||
| Fringe Benefit - retirement rates per comptrollers estimates (Net of in-kind fb) | (68) | |||
| Fringe Benefit - estimates of Insurance increases (Net of in-kind fb) | (40) | |||
| FY2018 Original Projection (without Health One) | $ (361) | |||
| Health One - revenue reduction | (113) | |||
| Health One - training and back fill | (120) | |||
| Total FY18 Preliminary Forecast | $ (594) | |||
| FY17 Forecast vs FY17 Budget | ||||||||||
| FY17 Budget | FY17 Forecast | Variance | ||||||||
| Revenues | ||||||||||
| Net Patient Care | $ 4715 | $ 4567 | $ (148) | |||||||
| Other Revenue | 2241 | 2243 | 02 | |||||||
| Correctional Managed Health Care | 833 | 824 | (09) | |||||||
| State Support | 1236 | 1218 | (18) | |||||||
| In-kind Fringe Benefits and Differential | 976 | 1007 | 31 | |||||||
| Total Revenue | $ 10001 | $ 9860 | $ (141) | |||||||
| Expenses | ||||||||||
| Salary | $ 3857 | $ 3843 | $ (14) | |||||||
| Fringe Benefits | 2066 | 2037 | (29) | |||||||
| Correctional Managed Health Care | 833 | 824 | (09) | |||||||
| Other Expenses | 3404 | 3352 | (52) | |||||||
| Total Expenses | $ 10160 | $ 10056 | $ (104) | |||||||
| Excess(Deficiency) of Revenues over Expenses | $ (159) | $ (197) | $ (38) | |||||||
| notes for Jeff | ||||||||||
| summary of forecast changes | (21554857) | |||||||||
| Third Party updated thru April YTD | (3000000) | |||||||||
| IT review | 183120 | |||||||||
| Core Reconciliation | 1800000 | |||||||||
| Interns amp Res | 823000 | |||||||||
| Hemophilia clinic340B pharmacy | 1360329 | |||||||||
| Library (moved to capital) | 108000 | |||||||||
| Facilities Mgmt | 223012 | |||||||||
| Creative Child Care | 23000 | |||||||||
| Fire Dept | 76780 | |||||||||
| ResearchAcademic review of spend | 1258000 | |||||||||
| 2855241 | ||||||||||
| (18699616) | ||||||||||
| FY18 Budget Assumptions | ||
| The following presentation assumes | ||
| Tuition and Fees - overall 45 rate increase | ||
| Research revenue - slight increase offset by additional expenses | ||
| Salaries - no increase related to bargaining units due to no settled contracts as of budget preparation | ||
| Fringes - State Comptrollers estimated state retirement rates used | ||
| Appropriation - Governors Recommended Revised budget as of May 15 2017 | ||
| FY 2013 | FY 2014 | FY 2015 | FY 2016 | FY 2017 Forecast | FY2018 Budget | ||||||||
| UCH Profit (Loss) | (7203277) | (15458141) | (2876454) | (12564848) | (19688715) | (59400000) | |||||||
| UCH Profit (Loss) | (72) | (155) | (29) | (126) | (197) | (594) | |||||||
| Orig Projection | Final Budget | ActualsForecast | ||||||||||||||||||||
| FY14 | (210) | (110) | (155) | |||||||||||||||||||
| FY15 | (259) | (125) | (29) | |||||||||||||||||||
| FY16 | (400) | (159) | (126) | |||||||||||||||||||
| FY17 | (481) | (159) | (197) | |||||||||||||||||||
| FY18 | (594) | (184) | ||||||||||||||||||||
| Note | ||||||||||||||||||||||
| Financial Improvement Project began in FY2014 - Total savings of $103M |

FY18 Expense by Category
Note Use of decimals may result in rounding differences
Salary and Fringe Benefits are the largest expense for the University at 563 of the total with Other Expenses accounting for 158 and Financial Aid at 13
Personal Services 4947 Fringe Benefits 2513 Other Expenses 2105 Energy 229 Equipment 205 Student Financial Aid 1727 Debt ServiceProjects 449 Total Operating Fund 12175$
Research Fund 1080
Total Operating Expenditures 13255$
Expenditures ($M)
Personal Services373
Fringe Benefits
190
Other Expenses
158
Energy17
Equipment15
Student Financial Aid
130
Debt ServiceProjects
34
Research Fund 81
Storrs and Regionals
Personnel costs represent more than 56 of the overall expense budget UConn will continue to restrict hiring and closely watch any spending to help maintain the balanced budget
December 13 2017 18
Rising Costs - Salary Expenses
Between FY11 and FY18 mandated salary increases due to union agreements cost UConn about $68M or 83 of the total salary growth
Other this category includes classified non-faculty professional (UCPEA) management confidential graduate assistant student amp special payroll
The majority of the growth in FY18 is due to graduate assistant contractual increases and additional police Per the SEBAC agreement FY18 includes no facultystaff salary increases
Salary Expenses ($M)
Storrs and Regionals
December 13 2017 19
$279 $272 $285 $305 $317 $326 $321 $320
$134 $143 $141$157 $166 $171 $175 $175
$0
$100
$200
$300
$400
$500
$600
FY11 FY12 FY13 FY14 FY15 FY16 FY17 FY18
FacultyAAUP
Other
$413 $414
$496
$425$462 $483 $497 $495
Revised Spending PlanUConn Health
State Budget CutsUConn Health
Compared to the BOT approved budget in June the negotiated State budget is an overall cut of $111M
December 13 2017 21
Updated FY18 Spending Plan
(Cash Sources and Uses)
Appropriation 1177 Personal Services 3912 Fringe Benefits amp Adjustments 1057 Fringe Benefits 2322 Total State Support 2234$ Correctional Managed Health Care 804 Tuition 200 DrugsMedical Supplies 852 Fees 44 Other Expenses 2147 Grants amp Contracts 849 Debt ServiceProjects 174 InternsResidents 667 Total Operating Fund 10211$ Net Patient Revenue 4827 Correctional Managed Health Care 804 Research and Restricted Expenditures 684 Other Revenue 586
Total Operating Fund 10211$ Total Operating Expenditures 10895$
Research and Restricted Funds 684
Total Current Funds Revenues 10895$ Net Gain(Loss) -$
Revenues ($M) Expenditures ($M)
UConn Health
UConn Health has achieved a balanced budget by implementing spending cuts restricting hiring and identifying new revenue streams
December 13 2017 22
FY18 Comparison
(Cash Sources and Uses)FY18
Original BOT Budget ($M)
FY18 Revised
Budget ($M)
Favorable (Unfavorable)
($M) NotesAppropriation 1254 1177 (77) Reduction in workers compensation and lapsesFringe Benefits amp Adjustments 1006 1057 51 increase due to increase in fringe ratesTotal State Support 2260$ 2234$ (26)$ Tuition 200 200 - Fees 44 44 - Grants amp Contracts 872 849 (23) First quarter resultsInternsResidents 667 667 - Net Patient Revenue 4751 4827 76 Enhanced payments and first quarter resultsCorrectional Managed Health Care 804 804 - Other Revenue 576 586 10 First quarter results - retail pharmacy Total Operating Fund 10174$ 10211$ 37$
Research and Restricted Funds 684 684 -
Total Current Funds Revenues 10858$ 10895$ 37$
Personal Services 3896 3912 (16) Implementation of final SEBAC provisionsFringe Benefits 2288 2322 (34) Implementation of final SEBAC provisionsCorrectional Managed Health Care 804 804 - DrugsMedical Supplies 847 852 (05) First quarter resultsOther Expenses 2165 2147 18 First quarter resultsDebt ServiceProjects 174 174 (00) Total Operating Fund 10174$ 10211$ (37)$
Research and Restricted Expenditures 684 684 -
Total Operating Expenditures 10858$ 10895$ (37)$
Net Gain(Loss) -$ -$ -$
UConn Health
Reductions in personnel costs and increased patient revenue offset State cuts
December 13 2017 23
Appendix
State Support
UConn Storrs and Regionals amp UConn Health have sustained $1638M in State reductions lost fringe and fund sweeps since 2010 ($1044M for Storrs and $594M for UCH)
Reductions = lapses rescissions and deficit mitigation
Appropriation Reduction Actual Allotment
Lost Fringe due to Reduction
Fund Sweeps Total Cut
FY10 3543 (35) 3508 (17) (180) (232) FY11 3523 (06) 3517 (03) (250) (259) FY12 3174 (33) 3141 (17) - (50) FY13 3188 (144) 3044 (72) - (216) FY14 3289 (13) 3276 (07) - (20) FY15 3650 (116) 3534 (61) - (177) FY16 3875 (30) 3845 (25) (172) (227) FY17 3644 (145) 3499 (98) - (243) FY18 3217 (126) 3091 (88) - (214) TOTAL $ (648) $ (388) $ (602) $ (1638)
UConn TOTAL - Combined Reductions Fringe (lost) and Fund Sweeps ($M)
December 13 2017 25
FY18 Revenue by Category
Appropriation 1177 Fringe Benefits amp Adjustments 1057 Total State Support 2234$ Tuition 200 Fees 44 Grants amp Contracts 849 InternsResidents 667 Net Patient Revenue 4827 Correctional Managed Health Care 804 Other Revenue 586
Total Operating Fund 10211$
Research and Restricted Funds 684
Total Current Funds Revenues 10895$
Revenues ($M)
UConn Health
State support is the second largest revenue source at 22 of total revenue
December 13 2017 26
FY14FY15FY16FY17FY18-21-259-40-481-594Final Budget
FY14FY15FY16FY17FY18-11-125-159-159-18399999999999999ActualsForecast
FY14FY15FY16FY17FY18-155-29-126-197
Profit (Loss)
FY13 - FY18
UCH Profit (Loss)FY 2013FY 2014FY 2015FY 2016FY 2017 ForecastFY2018 Budget-72032769999999999-15458140999999999-28764539999999998-12564848-19688714999999998-594
State SupportTuitionFeesGrants amp ContractsInternsResidentsNet Patient RevenueCorrectional Managed Health CareOther Revenue22342044000000000000004849667482780400000000000006586
Personal ServicesFringe BenefitsCorrectional Managed Health CareDrugsMedical SuppliesOther ExpensesDebt ServiceProjectsResearch and Restricted Expenditures391223228040000000000000685221471740126000000000168400000000000006
amp8ampK00-024ampZampF
Differences in rates FY18 orig budget used 74 as a rate When estimating for medicagov relations Uconn storrs suggested we use the same rate at 69
For the revised BODBOT presentations used the 816 rate with the new appropriation
FY18 Gov $[VALUE]
FY10FY11FY12FY13FY14FY15FY16FY17FY18118972138119346347109669578112666627125542313135366969144290800134539312125474563 AllotmentFY10FY11FY12FY13FY14FY15FY16FY17FY18117734347119166814108458794108519733125018941131158966143898479130030646Democratic budget
FY18 Dem $[VALUE]
FY10FY11FY12FY13FY14FY15FY16FY17FY18134539312126820354Republican budget
FY18 Rep $[VALUE]
FY10FY11FY12FY13FY14FY15FY16FY17FY18134539312115249782
State Support and Net Patient Revenue
Net Patient Revenue
FY13FY14FY15FY16FY17 ForecastFY18 Budget358367701372814684431182934452366520457724062475098373Total State Support
FY13FY14FY15FY16FY17 ForecastFY18 Budget173192257213854874226796933235291486222513422218446953
Salary Expense ($M)
Faculty
201220132014201520162017 Forecast2018 Budget10730906310675877011258533911815635512336023712232893712468154592All Other Staff
201220132014201520162017 Forecast2018 Budget23385714823276053724060451024797392226323237126199454026494828507999998
John Dempsey Hospital vs Connecticut Hospital Association Fringe Rate
CHA rate
20052010201120122013201420152016201720180273899999999999980295403014031080000000000002030609999999999998028799999999999998028789999999999999029399999999999998029987999999999998030587759999999997JDH rate
2005201020112012201320142015201620172018038719999999999999044280000000000003044080000000000003043409999999999999046100989118483643053266397642863328054479050264180173057442497383828672059146205947123043066300000000000003
Fringe Benefit DifferentialFY 2013FY 2014FY 2015FY 2016FY 2017 ForecastFY2018 Budget135000001350000013500000135000001350000013500000Actual Hospital DifferentialFY 2013FY 2014FY 2015FY 2016FY 2017 ForecastFY2018 Budget170612883784000022559753009600000127567138709199995328022674020000063467286594704000743315787
1
2
3
4
5
6
7
8
9
A
B
C
Appropriation
1177
Fringe Benefits amp Adjustments
1057
Total State Support
2234
$
Tuition
200
Fees
44
Revenues ($M)
FY18 Expense by Category
Personal Services 3912 Fringe Benefits 2322 Correctional Managed Health Care 804 DrugsMedical Supplies 852 Other Expenses 2147 Debt ServiceProjects 174 Total Operating Fund 10211$
Research and Restricted Expenditur 684
Total Operating Expenditures 10895$
Expenditures ($M)
Personal Services
36
Fringe Benefits21Correctional
Managed Health Care7
DrugsMedical Supplies
8
Other Expenses20
Debt ServiceProjects
2
Research and Restricted
Expenditures6
UConn Health
Personnel costs make up 57 of UConn Healthrsquos overall expenditure budget
December 13 2017 27
FY14FY15FY16FY17FY18-21-259-40-481-594Final Budget
FY14FY15FY16FY17FY18-11-125-159-159-18399999999999999ActualsForecast
FY14FY15FY16FY17FY18-155-29-126-197
Profit (Loss)
FY13 - FY18
UCH Profit (Loss)FY 2013FY 2014FY 2015FY 2016FY 2017 ForecastFY2018 Budget-72032769999999999-15458140999999999-28764539999999998-12564848-19688714999999998-594
State SupportTuitionFeesGrants amp ContractsInternsResidentsNet Patient RevenueCorrectional Managed Health CareOther Revenue22342044000000000000004849667482780400000000000006586
Personal ServicesFringe BenefitsCorrectional Managed Health CareDrugsMedical SuppliesOther ExpensesDebt ServiceProjectsResearch and Restricted Expenditures391223228040000000000000685221471740126000000000168400000000000006
amp8ampK00-024ampZampF
Differences in rates FY18 orig budget used 74 as a rate When estimating for medicagov relations Uconn storrs suggested we use the same rate at 69
For the revised BODBOT presentations used the 816 rate with the new appropriation
FY18 Gov $[VALUE]
FY10FY11FY12FY13FY14FY15FY16FY17FY18118972138119346347109669578112666627125542313135366969144290800134539312125474563 AllotmentFY10FY11FY12FY13FY14FY15FY16FY17FY18117734347119166814108458794108519733125018941131158966143898479130030646Democratic budget
FY18 Dem $[VALUE]
FY10FY11FY12FY13FY14FY15FY16FY17FY18134539312126820354Republican budget
FY18 Rep $[VALUE]
FY10FY11FY12FY13FY14FY15FY16FY17FY18134539312115249782
State Support and Net Patient Revenue
Net Patient Revenue
FY13FY14FY15FY16FY17 ForecastFY18 Budget358367701372814684431182934452366520457724062475098373Total State Support
FY13FY14FY15FY16FY17 ForecastFY18 Budget173192257213854874226796933235291486222513422218446953
Salary Expense ($M)
Faculty
201220132014201520162017 Forecast2018 Budget10730906310675877011258533911815635512336023712232893712468154592All Other Staff
201220132014201520162017 Forecast2018 Budget23385714823276053724060451024797392226323237126199454026494828507999998
John Dempsey Hospital vs Connecticut Hospital Association Fringe Rate
CHA rate
20052010201120122013201420152016201720180273899999999999980295403014031080000000000002030609999999999998028799999999999998028789999999999999029399999999999998029987999999999998030587759999999997JDH rate
2005201020112012201320142015201620172018038719999999999999044280000000000003044080000000000003043409999999999999046100989118483643053266397642863328054479050264180173057442497383828672059146205947123043066300000000000003
Fringe Benefit DifferentialFY 2013FY 2014FY 2015FY 2016FY 2017 ForecastFY2018 Budget135000001350000013500000135000001350000013500000Actual Hospital DifferentialFY 2013FY 2014FY 2015FY 2016FY 2017 ForecastFY2018 Budget170612883784000022559753009600000127567138709199995328022674020000063467286594704000743315787
1
2
3
4
5
6
7
8
9
A
B
C
Personal Services
3912
Fringe Benefits
2322
Correctional Managed Health Care
804
DrugsMedical Supplies
852
Other Expenses
2147
Expenditures ($M)
| FY18 Bottom Line - Original Projection | (5940) | |||
| Other revenue | 320 | |||
| Institutional workforce | 1100 | |||
| Purchased services | 050 | |||
| Other expenses | 040 | |||
| Net patient revenue | 990 | |||
| Clinical workforce planning | 470 | |||
| Clinical non labor | 010 | |||
| Clinical revenue cycle | 090 | |||
| State support (Governors revised budget) | (240) | |||
| SEBAC (estimated savings) | 1270 | |||
| FY18 Bottom line - Proposed Budget | (1840) | |||
| 1) Comparison of Fringe rate with CHA average | ||||||||||||||||||||||||||
| 2) Fringe differential compared to actual hospital differential | ||||||||||||||||||||||||||
| note fy18 was updated to match proposed budget rate of 663 | ||||||||||||||||||||||||||
| John Dempsey Hospital vs Connecticut Hospital Association Fringe | ||||||||||||||||||||||||||
| FY | CHA rate | JDH rate | ||||||||||||||||||||||||
| 2005 | 274 | 387 | ||||||||||||||||||||||||
| 2006 | 289 | 371 | ||||||||||||||||||||||||
| 2007 | 277 | 401 | ||||||||||||||||||||||||
| 2008 | 280 | 411 | ||||||||||||||||||||||||
| 2009 | 271 | 412 | ||||||||||||||||||||||||
| 2010 | 295 | 443 | ||||||||||||||||||||||||
| 2011 | 301 | 441 | ||||||||||||||||||||||||
| 2012 | 311 | 434 | ||||||||||||||||||||||||
| 2013 | 306 | 461 | ||||||||||||||||||||||||
| 2014 | 288 | 533 | ||||||||||||||||||||||||
| 2015 | 288 | 545 | ||||||||||||||||||||||||
| 2016 | 294 | 574 | ||||||||||||||||||||||||
| 2017 | 300 | 591 | ||||||||||||||||||||||||
| 2018 | 306 | 663 | ||||||||||||||||||||||||
| Plan Description | FY2010-11 | FY2011-12 | FY2012-13 | FY2013-14 | FY2014-15 | FY2015-16 | FY2016-17 | FY2017-2018 Estimates | ||||||||||||||||||
| Alternate Retirement Program (ARP) | 1003 | 818 | 917 | 1120 | 1170 | 1199 | 1193 | 1300 | ||||||||||||||||||
| SERS Hazardous Duty | 3719 | 3687 | 4871 | 5895 | 6243 | 6251 | 6994 | 8900 | ||||||||||||||||||
| SERS Retirement Regular | 4000 | 3941 | 4601 | 5471 | 5050 | 5358 | 5499 | 6100 | ||||||||||||||||||
| Unemployment Compensation | 016 | 020 | 026 | 012 | 015 | 012 | 006 | 026 | ||||||||||||||||||
| 8738 | 8466 | 10415 | 12498 | 12478 | 12820 | 13692 | 16326 | |||||||||||||||||||
| -31 | 230 | 200 | -02 | 27 | 68 | 192 | ||||||||||||||||||||
| SERS Retirement Regular Rate Increases | 167 | 189 | -77 | 61 | 26 | 109 | ||||||||||||||||||||
| Average increase for Health insurance (approximate amounts) | 850 | 14 | 6 | 4 | 6 | |||||||||||||||||||||
| FY 2007 | FY 2008 | FY 2009 | FY 2010 | FY 2011 | FY 2012 | FY 2013 | FY 2014 | FY 2015 | FY 2016 | FY 2017 Forecast | FY2018 Budget | |||||||||||||||
| UCH Profit (Loss) | (26272245) | (23382917) | (22965602) | 3992933 | 3961289 | (2922761) | (7203277) | (15458141) | (2876454) | (12564848) | (21554857) | |||||||||||||||
| Deficiency Appropriation | 22100000 | 21900000 | 22200000 | - 0 | - 0 | - 0 | - 0 | - 0 | - 0 | - 0 | - 0 | |||||||||||||||
| Bioscience CT | - 0 | - 0 | - 0 | - 0 | - 0 | - 0 | 500000 | 11900724 | 16765958 | 12458333 | 10857600 | |||||||||||||||
| Fringe Benefit Differential | - 0 | - 0 | 3600000 | 13500000 | 13500000 | 13500000 | 13500000 | 13500000 | 13500000 | 13500000 | 13500000 | 13500000 | ||||||||||||||
| State Approp | 78614491 | 96797174 | 106012205 | 117734347 | 119166814 | 108458794 | 108019733 | 113118217 | 114393008 | 123432329 | 111649501 | |||||||||||||||
| UCH Profit (Loss)-after Deficiency Approp | (4172245) | (1482917) | (765602) | 3992933 | 3961289 | (2922761) | (7203277) | (15458141) | (2876454) | (12564848) | (21554857) | |||||||||||||||
| Actual Hospital Differential | 17061288 | 25597530 | 27567139 | 32802267 | 34672866 | 43315787 | ||||||||||||||||||||
| FY 2014 | FY 2015 | FY 2016 | FY 2017 Forecast | FY2018 Forecast | ||||||||||||||||||||||
| Debt Service (MARB and Outpatient Pavilion) | 7007001 | 12044165 | 15985039 | 15985039 | 16021543 | |||||||||||||||||||||
| includes MRI in FY18 |
| 48463620 | 142 | ||||||||||||||||
| 2012 | 2013 | 2014 | 2015 | 2016 | 2017 Forecast | 2018 Budget | |||||||||||
| All Position Codes - - Incumbant | 341166211 | 339519307 | 353189850 | 366130278 | 386592608 | 384323477 | 389629831 | 114 | |||||||||
| Faculty | 107309063 | 106758770 | 112585339 | 118156355 | 123360237 | 122328937 | 124681546 | ||||||||||
| All Other Staff | 233857148 | 232760537 | 240604510 | 247973922 | 263232371 | 261994540 | 264948285 | ||||||||||
| Proposal | Additional Information | FY17 Cost | FY18 Cost ($M) | FY19 Cost ($M) | FY20 Cost ($M) | FY21 Cost ($M) | Total Cost ($M) | ||||||||||||
| Wage Increase | Unions | 0 hard freeze FY17FY18FY19$2000 one time stipend in FY1935 + [step Increase] in FY20 FY21 | Includes Fringe Benefits | $ - 0 | $ - 0 | $ 160 | $ - 0 | $ - 0 | $ 160 | ||||||||||
| Furlough Days | Unions | 3 Furlough Days in FY18 | Includes Fringe Benefits | $ - 0 | $ (34) | $ - 0 | $ - 0 | $ - 0 | $ (34) | ||||||||||
| Delay Longevity Payment | Unions | Delay longevity payment in FY18 | Need additional confirmation but assumption is that April 2018 longevity payment delayed to FY19 | $ - 0 | $ (14) | $ 14 | $ - 0 | $ - 0 | $ - 0 | ||||||||||
| Subtotal Wage Impact (including associated fringe benefits) | $ - 0 | $ (48) | $ 174 | $ - 0 | $ - 0 | $ 126 | |||||||||||||
| Health Insurance - Increase in employee share of premium | Unions | - Increase 1 each year in FY20FY21FY22 for existing employees - New employes at 15 - Mgmt already at 23 | Uconns share of the premium will decrease by 1 Will impact fringe cost | $ - 0 | $ - 0 | $ - 0 | $ - 0 | $ - 0 | $ - 0 | ||||||||||
| Mgmt | No change Management share increasing in FY18 to 23 | $ - 0 | $ - 0 | $ - 0 | $ - 0 | $ - 0 | $ - 0 | ||||||||||||
| Fringe Rate Impact | All other Pension and Healthcare changes IMPACT UNKNOWN | This should ultimately reduce fringe costs but additional information and further analysis is required to understand full impact OPM provided an estimated reduction to SERS rate of 6 | $ - 0 | ||||||||||||||||
| Retiree Healthcare | Retiree COLA health contribution and Medicare changes | This should ultimately reduce fringe costs but additional information and further analysis is required to understand full impact | $ - 0 | ||||||||||||||||
| Pension - Contribution | FY18 FY19 = Increase pension contribution by 15FY20 FY21 = Increase pension contribution by additional 05 | This should ultimately reduce fringe costs but additional information and further analysis is required to understand full impact | $ - 0 | ||||||||||||||||
| Pension - Tier IV | Hybrid pensiondefined contribution State will match 1 | This should ultimately reduce fringe costs but additional information and further analysis is required to understand full impact | $ - 0 | ||||||||||||||||
| TOTAL COST(SAVINGS) - UNION EMPLOYEES | $ - 0 | $ (48) | $ 174 | $ - 0 | $ - 0 | $ 126 |
| FY17 Forecast ($M) | FY18 Budget ($M) | Favorable (Unfavorable) ($M) | Notes | ||||||
| Appropriation | 1218 | 1178 | (40) | Governors revised budget | |||||
| Fringe Benefits amp Adjustments | 1007 | 1006 | (01) | ||||||
| Total State Support | $ 2225 | $ 2183 | |||||||
| Tuition and Fees | 233 | 244 | 11 | Approved tuition rate increase of 45 | |||||
| Grants amp Contracts | 864 | 872 | 08 | Research grant revenue remains flat | |||||
| InternsResidents | 630 | 667 | 37 | Growth in revenue offset by increased expenses | |||||
| Net Patient Revenue | 4577 | 4751 | 174 | 38 increase | |||||
| Correctional Managed Health Care | 835 | 804 | (31) | ||||||
| Other Revenue | 517 | 576 | 60 | ||||||
| Total Operating Revenues | $ 9880 | $ 10098 | $ 259 | ||||||
| Personal Services | 3843 | 3896 | 53 | Increase is related to mid year hires in FY17 | |||||
| Fringe Benefits | 2046 | 2211 | 165 | estimated Comprollers fringe rates used | |||||
| Correctional Managed Health Care | 835 | 804 | (31) | ||||||
| DrugsMedical Supplies | 823 | 847 | 24 | increase in drugsmedicals supplies related to increase in volume | |||||
| Other Expenses | 2530 | 2165 | (365) | ||||||
| Debt ServiceProjects | - 0 | - 0 | - 0 | ||||||
| Total Operating Expenses | 10077 | 9924 | (154) | ||||||
| Net Gain(Loss) | (197) | 1740 | 4125 | ||||||
| Net Patient Revenue | Total State Support | Net Patient Revenue | Total State Support | ||||||
| FY13 | 358367701 | 173192257 | 3584 | 1732 | |||||
| FY14 | 372814684 | 213854874 | 3728 | 2139 | |||||
| FY15 | 431182934 | 226796933 | 4312 | 2231 | |||||
| FY16 | 452366520 | 235291486 | 4524 | 2353 | |||||
| FY17 Forecast | 457724062 | 222513422 | 4577 | 2225 | |||||
| FY18 Budget | 475098373 | 218446953 | 4751 | 2184 | |||||
| per TM1 | per TM |
| Fiscal Year | Appropriation | Allotment | Democratic budget | Republican budget | |||||
| FY10 | 118972138 | 117734347 | |||||||
| FY11 | 119346347 | 119166814 | |||||||
| FY12 | 109669578 | 108458794 | |||||||
| FY13 | 112666627 | 108519733 | |||||||
| FY14 | 125542313 | 125018941 | |||||||
| FY15 | 135366969 | 131158966 | |||||||
| FY16 | 144290800 | 143898479 | |||||||
| FY17 | 134539312 | 130030646 | 134539312 | 134539312 | |||||
| FY18 | 125474563 | 126820354 | 115249782 | ||||||
| FY18 Budget Target | $ (184) | ||
| SEBAC estimated costs | |||
| Three furlough day savings not in FY19 | (34) | ||
| Longevity (postponed in FY18) | (28) | ||
| Lump Sum payments (estimated $2000) | (160) | ||
| Appropriation (Governors Recommended) | 55 | ||
| Clinical revenue | 90 | ||
| FY19 Estimated Budget | $ (261) |
| Revenues ($M) | Expenditures ($M) | ||||||||||||||||||||||||
| Appropriation | 1218 | Personal Services | 3843 | Original | Forecast | variance | |||||||||||||||||||
| Fringe Benefits amp Adjustments | 1007 | Fringe Benefits | 2046 | Total Operating Revenue | 77320 | 76560 | (760) | ||||||||||||||||||
| Total State Support | $ 2225 | Correctional Managed Health Care | 835 | State Support | 22470 | 22250 | (220) | ||||||||||||||||||
| Tuition and Fees | 233 | DrugsMedical Supplies | 823 | Restricted Capital Balances | |||||||||||||||||||||
| Grants amp Contracts | 864 | Other Expenses | 2152 | Use Allowance | 560 | 200 | (360) | 1820 | |||||||||||||||||
| InternsResidents | 630 | Debt ServiceProjects | 169 | State Bond Funds | 4440 | 2640 | (1800) | use fy18 carryforward | |||||||||||||||||
| Net Patient Revenue | 4577 | Total Operating Fund | $ 9868 | Departmental Grant Funds | 100 | 100 | - 0 | ||||||||||||||||||
| Correctional Managed Health Care | 835 | ||||||||||||||||||||||||
| Other Revenue | 517 | Research and Restricted Expenditures | 294 | Total Available for Spending | 104890 | 101750 | (3140) | ||||||||||||||||||
| Total Operating Fund | $ 9881 | Total Operating Expenditures | $ 10162 | Total Operating Expenses (less depreciation) | 97640 | 96990 | (650) | ||||||||||||||||||
| Current Approved Capital Projects | 250 | 250 | - 0 | balances carried into FY18 | |||||||||||||||||||||
| Research and Restricted Funds | 294 | Working Capital Needs | 200 | 200 | - 0 | State Bond Funds-EMR | 23700000 | State Bond funds EMR (41M less spent $173) | |||||||||||||||||
| FY 2017 Capital Spending | 1200 | 690 | (510) | Comprehensive Cancer Center | 1556995 | cash balance (orig amt 25M in FY13) | |||||||||||||||||||
| Total Current Funds Revenues | $ 10175 | Net Gain(Loss) | $ 13 | State Bond Funds | 4390 | 2640 | (1750) | Health Disparity | 1166252 | cash balance (orig amt 25M in FY13) | |||||||||||||||
| Use Allowance | 560 | 200 | (360) | 26423247 | |||||||||||||||||||||
| Departmental Grant Funds | 100 | 100 | - 0 | ||||||||||||||||||||||
| Principal Payment on Debt | 550 | 550 | - 0 | ||||||||||||||||||||||
| Total Spending Plan | 104890 | 101620 | (3270) | ||||||||||||||||||||||
| Excess(Deficiency) | - 0 | 130 | 130 | ||||||||||||||||||||||
| FY17 Capital Budget Pools | |||||||||||||||||||||||||
| Dept Name | Description of Equipment or Project | Original Budget | Source of Funds | balance as of June 2017 | spent | epic | |||||||||||||||||||
| Information Tech | EPIC Project (1) | 3500000 | Operating | 2500000 | 1000000 | 2000000 | FY16 | ||||||||||||||||||
| Campus Planning | Capitalized Positions | 779619 | Operating | - 0 | 779619 | 3500000 | FY17 | ||||||||||||||||||
| Library | Library Acquisitions | 1080000 | Operating | - 0 | 1080000 | (3000000) | spent | ||||||||||||||||||
| Finance | UCH Contingency | 2603139 | Operating | 951432 | 1651707 | 2500000 | balance available | ||||||||||||||||||
| Finance | CFO - Hold | 4000000 | Operating | 3594475 | 405525 | ||||||||||||||||||||
| 11962758 | 7045907 | 4916851 | |||||||||||||||||||||||
| 2000000 | per jeff | ||||||||||||||||||||||||
| 6916851 |
| Revenues ($M) | Expenditures ($M) | ||||||||||||||||||
| Appropriation | 1218 | Personal Services | 3843 | Appropriation | 1218 | Personal Services | 3843 | ||||||||||||
| Fringe Benefits amp Adjustments | 1007 | Fringe Benefits | 2046 | Fringe Benefits amp Adjustments | 1007 | Fringe Benefits | 2046 | ||||||||||||
| Total State Support | $ 2225 | Correctional Managed Health Care | 835 | Total State Support | $ 2225 | Correctional Managed Health Care | 835 | ||||||||||||
| Tuition and Fees | 233 | DrugsMedical Supplies | 823 | Tuition and Fees | 233 | DrugsMedical Supplies | 823 | ||||||||||||
| Grants amp Contracts | 864 | Other Expenses | 2152 | Grants amp Contracts | 864 | Other Expenses | 2150 | ||||||||||||
| InternsResidents | 630 | Depreciation | 379 | InternsResidents | 630 | Depreciation | 379 | ||||||||||||
| Net Patient Revenue | 4577 | Total Operating Expenditures | $ 10078 | Net Patient Revenue | 4577 | Total Operating Expenses | 10077 | ||||||||||||
| Correctional Managed Health Care | 835 | Correctional Managed Health Care | 835 | ||||||||||||||||
| Other Revenue | 517 | Other Revenue | 517 | Net Gain(Loss) | (197) | ||||||||||||||
| Total Operating Revenues | $ 9881 | Net Gain(Loss) | $ (197) | Total Operating Revenues | $ 9880 | ||||||||||||||
| Spending plan FY18 (detail capital) | ||||||||
| Original | Revised | |||||||
| Depreciation | 35801260 | 35801260 | ||||||
| EPIC - Carryforward (orig $55M spent $30M) | (2500000) | (2500000) | ||||||
| EPIC - FY18 | (3500000) | (3500000) | ||||||
| Debt payments | (6576264) | (6576264) | ||||||
| Capital Pool - FY18 | (2453042) | (2453042) | ||||||
| Library e-resources | (500000) | - 0 | moved to operating-offset by inkind fb | |||||
| IT Pool | (1000000) | (1000000) | ||||||
| Capital Projects carryforward | (871954) | (871954) | ||||||
| CFO contingency pool | - 0 | (1000000) | ||||||
| Library e-resources - use allowance | (500000) | - 0 | moved to operating offset by inkind fb | |||||
| Use allowance (part of the $684M) | 500000 | 500000 | use allowance cash still funding Library resouces in operating | |||||
| Total Debt serviceprojects | (17401260) | (17401260) | ||||||
| Operating Loss | (18400000) | (18400000) | ||||||
| Balance | - 0 | - 0 | ||||||
| FY18 | FY19 | |||||||||||||||
| Used in FY18 Budget --Governor Recommended Rev May 15 2017 | Senate and House Approved Budget 102017 | Variance | Lapses Distribution 11172017 | Net Appropriation | Senate and House Approved Budget 102017 | Variance | ||||||||||
| Block Grant | 106767742 | 106746887 | (20855) | (4437991) | 102308896 | 106746848 | (39) | |||||||||
| AHEC | - 0 | 374566 | 374566 | (199) | 374367 | 374566 | - 0 | |||||||||
| Bioscience CT funding | 10984843 | 10984843 | - 0 | (306086) | 10678757 | 11567183 | 582340 | |||||||||
| Workers Compensation Approp | 7721978 | 4320855 | (3401123) | - 0 | 4320855 | 4324771 | 3916 | |||||||||
| 125474563 | 122427151 | (3047412) | (4744276) | 117682875 | 123013368 | 586217 | ||||||||||
| Workers Compensation claims | (7721978) | (7721978) | - 0 | (7721978) | (7721978) | - 0 | ||||||||||
| 117752585 | 114705173 | (3047412) | (4744276) | 109960897 | 115291390 | 586217 | ||||||||||
| 74 used | 69 used | |||||||||||||||
| Inkind fb | 87136913 | 81234894 | (5902019) | (3273413) | 77961481 | |||||||||||
| add fringe differential | 13500000 | 13500000 | 13500000 | |||||||||||||
| 100636913 | 94734894 | (5902019) | 91461481 | (3273413) | ||||||||||||
| total State support gross (before wc claims) | 226111476 | 217162045 | (8949431) | 209144356 | ||||||||||||
| total State support net (after wc claims) | 218389498 | 209440067 | (8949431) | 201422378 | ||||||||||||
| Inkind fb | 87121480 | 92197925 | ||||||||||||||
| add fringe differential | 13500000 | 13500000 | ||||||||||||||
| 100621480 | 105697925 | 5076445 | ||||||||||||||
| total State support gross (before wc claims) | 223048631 | 223380800 | ||||||||||||||
| total State support net (after wc claims) | 215326653 | 215658822 |
| Expenditures ($M) | |||
| Personal Services | 3912 | ||
| Fringe Benefits | 2322 | ||
| Correctional Managed Health Care | 804 | ||
| DrugsMedical Supplies | 852 | ||
| Other Expenses | 2147 | ||
| Debt ServiceProjects | 174 | ||
| Total Operating Fund | $ 10211 | ||
| Research and Restricted Expenditures | 684 | ||
| Total Operating Expenditures | $ 10895 | ||
| Personal Services | 3912 | ||
| Fringe Benefits | 2322 | ||
| Correctional Managed Health Care | 804 | ||
| DrugsMedical Supplies | 852 | ||
| Other Expenses | 2147 | ||
| Debt ServiceProjects | 174 | ||
| Research and Restricted Expenditures | 684 |
| Revenues ($M) | |||
| Appropriation | 1177 | ||
| Fringe Benefits amp Adjustments | 1057 | ||
| Total State Support | $ 2234 | ||
| Tuition | 200 | ||
| Fees | 44 | ||
| Grants amp Contracts | 849 | ||
| InternsResidents | 667 | ||
| Net Patient Revenue | 4827 | ||
| Correctional Managed Health Care | 804 | ||
| Other Revenue | 586 | ||
| Total Operating Fund | $ 10211 | ||
| Research and Restricted Funds | 684 | ||
| Total Current Funds Revenues | $ 10895 | ||
| State Support | 2234 | ||
| Tuition | 200 | ||
| Fees | 44 | ||
| Grants amp Contracts | 849 | ||
| InternsResidents | 667 | ||
| Net Patient Revenue | 4827 | ||
| Correctional Managed Health Care | 804 | ||
| Other Revenue | 586 | ||
| Research and Restricted Funds | 684 | ||
| FY18 Original BOT Budget ($M) | FY18 Revised Budget ($M) | Favorable (Unfavorable) ($M) | Notes | ||||||
| Appropriation | 1254 | 1177 | (77) | Reduction in workers compensation and lapses | |||||
| Fringe Benefits amp Adjustments | 1006 | 1057 | 51 | increase due to increase in fringe rates | |||||
| Total State Support | $ 2260 | $ 2234 | $ (26) | ||||||
| Tuition | 200 | 200 | - 0 | ||||||
| Fees | 44 | 44 | - 0 | ||||||
| Grants amp Contracts | 872 | 849 | (23) | First quarter results | |||||
| InternsResidents | 667 | 667 | - 0 | ||||||
| Net Patient Revenue | 4751 | 4827 | 76 | Enhanced payments and first quarter results | |||||
| Correctional Managed Health Care | 804 | 804 | - 0 | ||||||
| Other Revenue | 576 | 586 | 10 | First quarter results - retail pharmacy | |||||
| - 0 | |||||||||
| Total Operating Fund | $ 10174 | $ 10211 | $ 37 | ||||||
| Research and Restricted Funds | 684 | 684 | - 0 | ||||||
| Total Current Funds Revenues | $ 10858 | $ 10895 | $ 37 | ||||||
| Personal Services | 3896 | 3912 | (16) | Implementation of final SEBAC provisions | |||||
| Fringe Benefits | 2288 | 2322 | (34) | Implementation of final SEBAC provisions | |||||
| Correctional Managed Health Care | 804 | 804 | - 0 | ||||||
| DrugsMedical Supplies | 847 | 852 | (05) | First quarter results | |||||
| Other Expenses | 2165 | 2147 | 18 | First quarter results | |||||
| Debt ServiceProjects | 174 | 174 | (00) | ||||||
| Total Operating Fund | $ 10174 | $ 10211 | $ (37) | ||||||
| Research and Restricted Expenditures | 684 | 684 | - 0 | ||||||
| Total Operating Expenditures | $ 10858 | $ 10895 | $ (37) | ||||||
| Net Gain(Loss) | $ - 0 | $ (00) | $ (00) | ||||||
| UConn Health | ||||
| Spending Plan for Fiscal Year 2018 | ||||
| Revenues | ||||
| Appropriation | 117752585 | |||
| Fringe Benefits amp Adjustments | 100594368 | |||
| Total State Support | $ 218346953 | |||
| Tuition and Fees | 24402915 | |||
| Grants amp Contracts | 87178304 | |||
| InternsResidents | 66694948 | |||
| Net Patient Revenue | 475098373 | |||
| Correctional Managed Health Care | 80426658 | |||
| Other Revenue | 57635408 | |||
| Total Operating Funds | $ 1009783559 | |||
| Research and Restricted Funds | 68423247 | |||
| Total Current Funds Revenues | $ 1078206806 | |||
| Expenditures | ||||
| Personal Services | 389629832 | |||
| Fringe Benefits | 221135897 | |||
| Correctional Managed Health Care | 80426658 | |||
| DrugsMedical Supplies | 84704197 | |||
| Other Expenses | 216482470 | |||
| Debt ServiceProjects | 17401260 | |||
| Total Operating Funds | $ 1009780314 | |||
| Research and Restricted Expenditures | 68423247 | |||
| Total Operating Expenditures | $ 1078203561 | |||
| Net Gain | $ 3245 | |||
| Revenues ($M) | Expenditures ($M) | see notes below for summary of changes | |||||||||||||||||
| Appropriation | 1177 | Personal Services | 3912 | Appropriation | 1177 | Personal Services | 3912 | ||||||||||||
| Fringe Benefits amp Adjustments | 1057 | Fringe Benefits | 2322 | Fringe Benefits amp Adjustments | 1057 | Fringe Benefits | 2322 | ||||||||||||
| Total State Support | $ 2234 | Correctional Managed Health Care | 804 | Total State Support | $ 2234 | Correctional Managed Health Care | 804 | ||||||||||||
| Tuition | 200 | DrugsMedical Supplies | 852 | Tuition | 200 | DrugsMedical Supplies | 852 | ||||||||||||
| Fees | 44 | Other Expenses | 2147 | Fees | 44 | Other Expenses | 2147 | ||||||||||||
| Grants amp Contracts | 849 | Depreciation | 358 | Grants amp Contracts | 849 | Depreciation | 358 | ||||||||||||
| InternsResidents | 667 | Total Operating Expenditures | $ 10395 | InternsResidents | 667 | Total Operating Fund | 10395 | ||||||||||||
| Net Patient Revenue | 4827 | Net Patient Revenue | 4827 | ||||||||||||||||
| Correctional Managed Health Care | 804 | Correctional Managed Health Care | 804 | ||||||||||||||||
| Other Revenue | 586 | Other Revenue | 586 | ||||||||||||||||
| Total Operating Revenues | $ 10211 | Net Gain(Loss) | $ (184) | Total Operating Fund | $ 10211 | Net Gain(Loss) | (1838) | ||||||||||||
| Notes - Revisions to original budget presented June28th | |||||||||||||||||||
| Approp revised to approved budget - Oct 2017 and added back the wc - and reduced with lapses of 47M | |||||||||||||||||||
| inkind fringe updated using new approp and lapses- 816 rate used was 74 | |||||||||||||||||||
| split tuition and fees (per request of storrs) | |||||||||||||||||||
| Reduced Grants and contract - first qtr results $23M | |||||||||||||||||||
| workers comps claims of $7721978 moved to fringe exp (was netted out of approp in orig) | |||||||||||||||||||
| Net patient revenue increased by $30M (umg enhanced physician payments) and 1st quarter results $46M | |||||||||||||||||||
| Other revenue - first qtr results - Retail pharmacy | |||||||||||||||||||
| salary cost added 16M (SEBAC provisions longevity and clean up of furlough) | |||||||||||||||||||
| fb cost added $33M (half of Sebac reallocations) offset with addl inkind fringe | |||||||||||||||||||
| rounding issue $100k added to inkind fringe | |||||||||||||||||||
| Drugs and Med supplies $500K added - first quarter results | |||||||||||||||||||
| other expenses $500K added for eresources (maintenance and subscription fees) and first qtr results research decrease $23M |
| Revenues ($M) | Expenditures ($M) | see notes below for summary of changes | |||||||||||||||||
| Appropriation | 1177 | Personal Services | 3912 | Appropriation | 1177 | Personal Services | 3912 | ||||||||||||
| Fringe Benefits amp Adjustments | 1057 | Fringe Benefits | 2322 | Fringe Benefits amp Adjustments | 1057 | Fringe Benefits | 2322 | ||||||||||||
| Total State Support | $ 2234 | Correctional Managed Health Care | 804 | Total State Support | $ 2234 | Correctional Managed Health Care | 804 | ||||||||||||
| Tuition | 200 | DrugsMedical Supplies | 852 | Tuition | 200 | DrugsMedical Supplies | 852 | ||||||||||||
| Fees | 44 | Other Expenses | 2147 | Fees | 44 | Other Expenses | 2147 | ||||||||||||
| Grants amp Contracts | 849 | Debt ServiceProjects | 174 | Grants amp Contracts | 849 | Debt ServiceProjects | 174 | ||||||||||||
| InternsResidents | 667 | Total Operating Fund | $ 10211 | InternsResidents | 667 | Total Operating Fund | 10211 | ||||||||||||
| Net Patient Revenue | 4827 | Net Patient Revenue | 4827 | ||||||||||||||||
| Correctional Managed Health Care | 804 | Research and Restricted Expenditures | 684 | Correctional Managed Health Care | 804 | Research and Restricted Expenditures | 684 | ||||||||||||
| Other Revenue | 586 | Other Revenue | 586 | ||||||||||||||||
| Total Operating Fund | $ 10211 | Total Operating Expenditures | $ 10895 | Total Operating Fund | $ 10211 | Total Operating Expenditures | $ 10895 | ||||||||||||
| Research and Restricted Funds | 684 | Research and Restricted Funds | 684 | ||||||||||||||||
| Total Current Funds Revenues | $ 10895 | Net Gain(Loss) | $ (00) | Total Current Funds Revenues | $ 10895 | Net Gain(Loss) | 00 | ||||||||||||
| Research and Restricted Funds - detail | |||||||||||||||||||
| Use Allowance | 7000000 | per Julie | |||||||||||||||||
| State Bond Funds-EMR | 23700000 | State Bond funds EMR (41M less spent $173) | storrs funds for EMR $48M | ||||||||||||||||
| Storrs Funds - EMR | 35000000 | per storrs agreement | FY18 | 35000000 | |||||||||||||||
| Comprehensive Cancer Center | 1556995 | cash balance (orig amt 25M in FY13) | FY19 | 13000000 | |||||||||||||||
| Health Disparity | 1166252 | cash balance (orig amt 25M in FY13) | 48000000 | ||||||||||||||||
| 68423247 | |||||||||||||||||||
| Notes - Revisions to original budget presented June28th | |||||||||||||||||||
| Approp revised to approved budget - Oct 2017 and added back the wc - and reduced with lapses of 47M | |||||||||||||||||||
| inkind fringe updated using new approp and lapses- 816 rate used was 74 | |||||||||||||||||||
| split tuition and fees (per request of storrs) | |||||||||||||||||||
| Reduced Grants and contract - first qtr results $23M | |||||||||||||||||||
| workers comps claims of $7721978 moved to fringe exp (was netted out of approp in orig) | |||||||||||||||||||
| Net patient revenue increased by $30M (umg enhanced physician payments) and 1st quarter results $46M | |||||||||||||||||||
| Other revenue - first qtr results - Retail pharmacy | |||||||||||||||||||
| salary cost added 16M (SEBAC provisions longevity and clean up of furlough) | |||||||||||||||||||
| fb cost added $33M (half of Sebac reallocations) offset with addl inkind fringe | |||||||||||||||||||
| rounding issue $100k added to inkind fringe | |||||||||||||||||||
| Drugs and Med supplies $500K added - first quarter results | |||||||||||||||||||
| other expenses $500K added for eresources (maintenance and subscription fees) and first qtr results research decrease $23M |
| FY18 Budget Target | |||||||
| FY18 Bottom line - Preliminary Projection | $ (5940) | ||||||
| Financial interventions posted to budget | 1270 | ||||||
| FY18 Bottom line - Current | $ (4670) | ||||||
| Not Posted to Budget | |||||||
| SEBAC (Estimated Savings) | 1270 | ||||||
| UMG | |||||||
| Revenue increase (Adding an additional Patient per week would be approximately $13M) | 400 | need broad categories of these savings | |||||
| Expense reduction | 350 | Annes will provide summary | |||||
| JDH | |||||||
| Revenue increase | 400 | ||||||
| Expense reduction | 410 | ||||||
| FY18 Bottom line Target | $ (1840) | ||||||
| FY18 Preliminary Forecast and Assumptions | ||||
| Bottom line | ||||
| FY2017 Budget | $ (197) | |||
| Estimated additional clinical revenue (2 increase) | 90 | |||
| State Support reduction (Gov Rec compared to Allotment Amount - includes Block Grant In-kind Fringes Bioscience and Workers Compensation) | (118) | |||
| NICU Rental Income decrease (Per contract) | (10) | |||
| Research Grants | (19) | |||
| Fringe Benefit - retirement rates per comptrollers estimates (Net of in-kind fb) | (68) | |||
| Fringe Benefit - estimates of Insurance increases (Net of in-kind fb) | (40) | |||
| FY2018 Original Projection (without Health One) | $ (361) | |||
| Health One - revenue reduction | (113) | |||
| Health One - training and back fill | (120) | |||
| Total FY18 Preliminary Forecast | $ (594) | |||
| FY17 Forecast vs FY17 Budget | ||||||||||
| FY17 Budget | FY17 Forecast | Variance | ||||||||
| Revenues | ||||||||||
| Net Patient Care | $ 4715 | $ 4567 | $ (148) | |||||||
| Other Revenue | 2241 | 2243 | 02 | |||||||
| Correctional Managed Health Care | 833 | 824 | (09) | |||||||
| State Support | 1236 | 1218 | (18) | |||||||
| In-kind Fringe Benefits and Differential | 976 | 1007 | 31 | |||||||
| Total Revenue | $ 10001 | $ 9860 | $ (141) | |||||||
| Expenses | ||||||||||
| Salary | $ 3857 | $ 3843 | $ (14) | |||||||
| Fringe Benefits | 2066 | 2037 | (29) | |||||||
| Correctional Managed Health Care | 833 | 824 | (09) | |||||||
| Other Expenses | 3404 | 3352 | (52) | |||||||
| Total Expenses | $ 10160 | $ 10056 | $ (104) | |||||||
| Excess(Deficiency) of Revenues over Expenses | $ (159) | $ (197) | $ (38) | |||||||
| notes for Jeff | ||||||||||
| summary of forecast changes | (21554857) | |||||||||
| Third Party updated thru April YTD | (3000000) | |||||||||
| IT review | 183120 | |||||||||
| Core Reconciliation | 1800000 | |||||||||
| Interns amp Res | 823000 | |||||||||
| Hemophilia clinic340B pharmacy | 1360329 | |||||||||
| Library (moved to capital) | 108000 | |||||||||
| Facilities Mgmt | 223012 | |||||||||
| Creative Child Care | 23000 | |||||||||
| Fire Dept | 76780 | |||||||||
| ResearchAcademic review of spend | 1258000 | |||||||||
| 2855241 | ||||||||||
| (18699616) | ||||||||||
| FY18 Budget Assumptions | ||
| The following presentation assumes | ||
| Tuition and Fees - overall 45 rate increase | ||
| Research revenue - slight increase offset by additional expenses | ||
| Salaries - no increase related to bargaining units due to no settled contracts as of budget preparation | ||
| Fringes - State Comptrollers estimated state retirement rates used | ||
| Appropriation - Governors Recommended Revised budget as of May 15 2017 | ||
| FY 2013 | FY 2014 | FY 2015 | FY 2016 | FY 2017 Forecast | FY2018 Budget | ||||||||
| UCH Profit (Loss) | (7203277) | (15458141) | (2876454) | (12564848) | (19688715) | (59400000) | |||||||
| UCH Profit (Loss) | (72) | (155) | (29) | (126) | (197) | (594) | |||||||
| Orig Projection | Final Budget | ActualsForecast | ||||||||||||||||||||
| FY14 | (210) | (110) | (155) | |||||||||||||||||||
| FY15 | (259) | (125) | (29) | |||||||||||||||||||
| FY16 | (400) | (159) | (126) | |||||||||||||||||||
| FY17 | (481) | (159) | (197) | |||||||||||||||||||
| FY18 | (594) | (184) | ||||||||||||||||||||
| Note | ||||||||||||||||||||||
| Financial Improvement Project began in FY2014 - Total savings of $103M |
| FY18 Bottom Line - Original Projection | (5940) | |||
| Other revenue | 320 | |||
| Institutional workforce | 1100 | |||
| Purchased services | 050 | |||
| Other expenses | 040 | |||
| Net patient revenue | 990 | |||
| Clinical workforce planning | 470 | |||
| Clinical non labor | 010 | |||
| Clinical revenue cycle | 090 | |||
| State support (Governors revised budget) | (240) | |||
| SEBAC (estimated savings) | 1270 | |||
| FY18 Bottom line - Proposed Budget | (1840) | |||
| 1) Comparison of Fringe rate with CHA average | ||||||||||||||||||||||||||
| 2) Fringe differential compared to actual hospital differential | ||||||||||||||||||||||||||
| note fy18 was updated to match proposed budget rate of 663 | ||||||||||||||||||||||||||
| John Dempsey Hospital vs Connecticut Hospital Association Fringe | ||||||||||||||||||||||||||
| FY | CHA rate | JDH rate | ||||||||||||||||||||||||
| 2005 | 274 | 387 | ||||||||||||||||||||||||
| 2006 | 289 | 371 | ||||||||||||||||||||||||
| 2007 | 277 | 401 | ||||||||||||||||||||||||
| 2008 | 280 | 411 | ||||||||||||||||||||||||
| 2009 | 271 | 412 | ||||||||||||||||||||||||
| 2010 | 295 | 443 | ||||||||||||||||||||||||
| 2011 | 301 | 441 | ||||||||||||||||||||||||
| 2012 | 311 | 434 | ||||||||||||||||||||||||
| 2013 | 306 | 461 | ||||||||||||||||||||||||
| 2014 | 288 | 533 | ||||||||||||||||||||||||
| 2015 | 288 | 545 | ||||||||||||||||||||||||
| 2016 | 294 | 574 | ||||||||||||||||||||||||
| 2017 | 300 | 591 | ||||||||||||||||||||||||
| 2018 | 306 | 663 | ||||||||||||||||||||||||
| Plan Description | FY2010-11 | FY2011-12 | FY2012-13 | FY2013-14 | FY2014-15 | FY2015-16 | FY2016-17 | FY2017-2018 Estimates | ||||||||||||||||||
| Alternate Retirement Program (ARP) | 1003 | 818 | 917 | 1120 | 1170 | 1199 | 1193 | 1300 | ||||||||||||||||||
| SERS Hazardous Duty | 3719 | 3687 | 4871 | 5895 | 6243 | 6251 | 6994 | 8900 | ||||||||||||||||||
| SERS Retirement Regular | 4000 | 3941 | 4601 | 5471 | 5050 | 5358 | 5499 | 6100 | ||||||||||||||||||
| Unemployment Compensation | 016 | 020 | 026 | 012 | 015 | 012 | 006 | 026 | ||||||||||||||||||
| 8738 | 8466 | 10415 | 12498 | 12478 | 12820 | 13692 | 16326 | |||||||||||||||||||
| -31 | 230 | 200 | -02 | 27 | 68 | 192 | ||||||||||||||||||||
| SERS Retirement Regular Rate Increases | 167 | 189 | -77 | 61 | 26 | 109 | ||||||||||||||||||||
| Average increase for Health insurance (approximate amounts) | 850 | 14 | 6 | 4 | 6 | |||||||||||||||||||||
| FY 2007 | FY 2008 | FY 2009 | FY 2010 | FY 2011 | FY 2012 | FY 2013 | FY 2014 | FY 2015 | FY 2016 | FY 2017 Forecast | FY2018 Budget | |||||||||||||||
| UCH Profit (Loss) | (26272245) | (23382917) | (22965602) | 3992933 | 3961289 | (2922761) | (7203277) | (15458141) | (2876454) | (12564848) | (21554857) | |||||||||||||||
| Deficiency Appropriation | 22100000 | 21900000 | 22200000 | - 0 | - 0 | - 0 | - 0 | - 0 | - 0 | - 0 | - 0 | |||||||||||||||
| Bioscience CT | - 0 | - 0 | - 0 | - 0 | - 0 | - 0 | 500000 | 11900724 | 16765958 | 12458333 | 10857600 | |||||||||||||||
| Fringe Benefit Differential | - 0 | - 0 | 3600000 | 13500000 | 13500000 | 13500000 | 13500000 | 13500000 | 13500000 | 13500000 | 13500000 | 13500000 | ||||||||||||||
| State Approp | 78614491 | 96797174 | 106012205 | 117734347 | 119166814 | 108458794 | 108019733 | 113118217 | 114393008 | 123432329 | 111649501 | |||||||||||||||
| UCH Profit (Loss)-after Deficiency Approp | (4172245) | (1482917) | (765602) | 3992933 | 3961289 | (2922761) | (7203277) | (15458141) | (2876454) | (12564848) | (21554857) | |||||||||||||||
| Actual Hospital Differential | 17061288 | 25597530 | 27567139 | 32802267 | 34672866 | 43315787 | ||||||||||||||||||||
| FY 2014 | FY 2015 | FY 2016 | FY 2017 Forecast | FY2018 Forecast | ||||||||||||||||||||||
| Debt Service (MARB and Outpatient Pavilion) | 7007001 | 12044165 | 15985039 | 15985039 | 16021543 | |||||||||||||||||||||
| includes MRI in FY18 |
| 48463620 | 142 | ||||||||||||||||
| 2012 | 2013 | 2014 | 2015 | 2016 | 2017 Forecast | 2018 Budget | |||||||||||
| All Position Codes - - Incumbant | 341166211 | 339519307 | 353189850 | 366130278 | 386592608 | 384323477 | 389629831 | 114 | |||||||||
| Faculty | 107309063 | 106758770 | 112585339 | 118156355 | 123360237 | 122328937 | 124681546 | ||||||||||
| All Other Staff | 233857148 | 232760537 | 240604510 | 247973922 | 263232371 | 261994540 | 264948285 | ||||||||||
| Proposal | Additional Information | FY17 Cost | FY18 Cost ($M) | FY19 Cost ($M) | FY20 Cost ($M) | FY21 Cost ($M) | Total Cost ($M) | ||||||||||||
| Wage Increase | Unions | 0 hard freeze FY17FY18FY19$2000 one time stipend in FY1935 + [step Increase] in FY20 FY21 | Includes Fringe Benefits | $ - 0 | $ - 0 | $ 160 | $ - 0 | $ - 0 | $ 160 | ||||||||||
| Furlough Days | Unions | 3 Furlough Days in FY18 | Includes Fringe Benefits | $ - 0 | $ (34) | $ - 0 | $ - 0 | $ - 0 | $ (34) | ||||||||||
| Delay Longevity Payment | Unions | Delay longevity payment in FY18 | Need additional confirmation but assumption is that April 2018 longevity payment delayed to FY19 | $ - 0 | $ (14) | $ 14 | $ - 0 | $ - 0 | $ - 0 | ||||||||||
| Subtotal Wage Impact (including associated fringe benefits) | $ - 0 | $ (48) | $ 174 | $ - 0 | $ - 0 | $ 126 | |||||||||||||
| Health Insurance - Increase in employee share of premium | Unions | - Increase 1 each year in FY20FY21FY22 for existing employees - New employes at 15 - Mgmt already at 23 | Uconns share of the premium will decrease by 1 Will impact fringe cost | $ - 0 | $ - 0 | $ - 0 | $ - 0 | $ - 0 | $ - 0 | ||||||||||
| Mgmt | No change Management share increasing in FY18 to 23 | $ - 0 | $ - 0 | $ - 0 | $ - 0 | $ - 0 | $ - 0 | ||||||||||||
| Fringe Rate Impact | All other Pension and Healthcare changes IMPACT UNKNOWN | This should ultimately reduce fringe costs but additional information and further analysis is required to understand full impact OPM provided an estimated reduction to SERS rate of 6 | $ - 0 | ||||||||||||||||
| Retiree Healthcare | Retiree COLA health contribution and Medicare changes | This should ultimately reduce fringe costs but additional information and further analysis is required to understand full impact | $ - 0 | ||||||||||||||||
| Pension - Contribution | FY18 FY19 = Increase pension contribution by 15FY20 FY21 = Increase pension contribution by additional 05 | This should ultimately reduce fringe costs but additional information and further analysis is required to understand full impact | $ - 0 | ||||||||||||||||
| Pension - Tier IV | Hybrid pensiondefined contribution State will match 1 | This should ultimately reduce fringe costs but additional information and further analysis is required to understand full impact | $ - 0 | ||||||||||||||||
| TOTAL COST(SAVINGS) - UNION EMPLOYEES | $ - 0 | $ (48) | $ 174 | $ - 0 | $ - 0 | $ 126 |
| FY17 Forecast ($M) | FY18 Budget ($M) | Favorable (Unfavorable) ($M) | Notes | ||||||
| Appropriation | 1218 | 1178 | (40) | Governors revised budget | |||||
| Fringe Benefits amp Adjustments | 1007 | 1006 | (01) | ||||||
| Total State Support | $ 2225 | $ 2183 | |||||||
| Tuition and Fees | 233 | 244 | 11 | Approved tuition rate increase of 45 | |||||
| Grants amp Contracts | 864 | 872 | 08 | Research grant revenue remains flat | |||||
| InternsResidents | 630 | 667 | 37 | Growth in revenue offset by increased expenses | |||||
| Net Patient Revenue | 4577 | 4751 | 174 | 38 increase | |||||
| Correctional Managed Health Care | 835 | 804 | (31) | ||||||
| Other Revenue | 517 | 576 | 60 | ||||||
| Total Operating Revenues | $ 9880 | $ 10098 | $ 259 | ||||||
| Personal Services | 3843 | 3896 | 53 | Increase is related to mid year hires in FY17 | |||||
| Fringe Benefits | 2046 | 2211 | 165 | estimated Comprollers fringe rates used | |||||
| Correctional Managed Health Care | 835 | 804 | (31) | ||||||
| DrugsMedical Supplies | 823 | 847 | 24 | increase in drugsmedicals supplies related to increase in volume | |||||
| Other Expenses | 2530 | 2165 | (365) | ||||||
| Debt ServiceProjects | - 0 | - 0 | - 0 | ||||||
| Total Operating Expenses | 10077 | 9924 | (154) | ||||||
| Net Gain(Loss) | (197) | 1740 | 4125 | ||||||
| Net Patient Revenue | Total State Support | Net Patient Revenue | Total State Support | ||||||
| FY13 | 358367701 | 173192257 | 3584 | 1732 | |||||
| FY14 | 372814684 | 213854874 | 3728 | 2139 | |||||
| FY15 | 431182934 | 226796933 | 4312 | 2231 | |||||
| FY16 | 452366520 | 235291486 | 4524 | 2353 | |||||
| FY17 Forecast | 457724062 | 222513422 | 4577 | 2225 | |||||
| FY18 Budget | 475098373 | 218446953 | 4751 | 2184 | |||||
| per TM1 | per TM |
| Fiscal Year | Appropriation | Allotment | Democratic budget | Republican budget | |||||
| FY10 | 118972138 | 117734347 | |||||||
| FY11 | 119346347 | 119166814 | |||||||
| FY12 | 109669578 | 108458794 | |||||||
| FY13 | 112666627 | 108519733 | |||||||
| FY14 | 125542313 | 125018941 | |||||||
| FY15 | 135366969 | 131158966 | |||||||
| FY16 | 144290800 | 143898479 | |||||||
| FY17 | 134539312 | 130030646 | 134539312 | 134539312 | |||||
| FY18 | 125474563 | 126820354 | 115249782 | ||||||
| FY18 Budget Target | $ (184) | ||
| SEBAC estimated costs | |||
| Three furlough day savings not in FY19 | (34) | ||
| Longevity (postponed in FY18) | (28) | ||
| Lump Sum payments (estimated $2000) | (160) | ||
| Appropriation (Governors Recommended) | 55 | ||
| Clinical revenue | 90 | ||
| FY19 Estimated Budget | $ (261) |
| Revenues ($M) | Expenditures ($M) | ||||||||||||||||||||||||
| Appropriation | 1218 | Personal Services | 3843 | Original | Forecast | variance | |||||||||||||||||||
| Fringe Benefits amp Adjustments | 1007 | Fringe Benefits | 2046 | Total Operating Revenue | 77320 | 76560 | (760) | ||||||||||||||||||
| Total State Support | $ 2225 | Correctional Managed Health Care | 835 | State Support | 22470 | 22250 | (220) | ||||||||||||||||||
| Tuition and Fees | 233 | DrugsMedical Supplies | 823 | Restricted Capital Balances | |||||||||||||||||||||
| Grants amp Contracts | 864 | Other Expenses | 2152 | Use Allowance | 560 | 200 | (360) | 1820 | |||||||||||||||||
| InternsResidents | 630 | Debt ServiceProjects | 169 | State Bond Funds | 4440 | 2640 | (1800) | use fy18 carryforward | |||||||||||||||||
| Net Patient Revenue | 4577 | Total Operating Fund | $ 9868 | Departmental Grant Funds | 100 | 100 | - 0 | ||||||||||||||||||
| Correctional Managed Health Care | 835 | ||||||||||||||||||||||||
| Other Revenue | 517 | Research and Restricted Expenditures | 294 | Total Available for Spending | 104890 | 101750 | (3140) | ||||||||||||||||||
| Total Operating Fund | $ 9881 | Total Operating Expenditures | $ 10162 | Total Operating Expenses (less depreciation) | 97640 | 96990 | (650) | ||||||||||||||||||
| Current Approved Capital Projects | 250 | 250 | - 0 | balances carried into FY18 | |||||||||||||||||||||
| Research and Restricted Funds | 294 | Working Capital Needs | 200 | 200 | - 0 | State Bond Funds-EMR | 23700000 | State Bond funds EMR (41M less spent $173) | |||||||||||||||||
| FY 2017 Capital Spending | 1200 | 690 | (510) | Comprehensive Cancer Center | 1556995 | cash balance (orig amt 25M in FY13) | |||||||||||||||||||
| Total Current Funds Revenues | $ 10175 | Net Gain(Loss) | $ 13 | State Bond Funds | 4390 | 2640 | (1750) | Health Disparity | 1166252 | cash balance (orig amt 25M in FY13) | |||||||||||||||
| Use Allowance | 560 | 200 | (360) | 26423247 | |||||||||||||||||||||
| Departmental Grant Funds | 100 | 100 | - 0 | ||||||||||||||||||||||
| Principal Payment on Debt | 550 | 550 | - 0 | ||||||||||||||||||||||
| Total Spending Plan | 104890 | 101620 | (3270) | ||||||||||||||||||||||
| Excess(Deficiency) | - 0 | 130 | 130 | ||||||||||||||||||||||
| FY17 Capital Budget Pools | |||||||||||||||||||||||||
| Dept Name | Description of Equipment or Project | Original Budget | Source of Funds | balance as of June 2017 | spent | epic | |||||||||||||||||||
| Information Tech | EPIC Project (1) | 3500000 | Operating | 2500000 | 1000000 | 2000000 | FY16 | ||||||||||||||||||
| Campus Planning | Capitalized Positions | 779619 | Operating | - 0 | 779619 | 3500000 | FY17 | ||||||||||||||||||
| Library | Library Acquisitions | 1080000 | Operating | - 0 | 1080000 | (3000000) | spent | ||||||||||||||||||
| Finance | UCH Contingency | 2603139 | Operating | 951432 | 1651707 | 2500000 | balance available | ||||||||||||||||||
| Finance | CFO - Hold | 4000000 | Operating | 3594475 | 405525 | ||||||||||||||||||||
| 11962758 | 7045907 | 4916851 | |||||||||||||||||||||||
| 2000000 | per jeff | ||||||||||||||||||||||||
| 6916851 |
| Revenues ($M) | Expenditures ($M) | ||||||||||||||||||
| Appropriation | 1218 | Personal Services | 3843 | Appropriation | 1218 | Personal Services | 3843 | ||||||||||||
| Fringe Benefits amp Adjustments | 1007 | Fringe Benefits | 2046 | Fringe Benefits amp Adjustments | 1007 | Fringe Benefits | 2046 | ||||||||||||
| Total State Support | $ 2225 | Correctional Managed Health Care | 835 | Total State Support | $ 2225 | Correctional Managed Health Care | 835 | ||||||||||||
| Tuition and Fees | 233 | DrugsMedical Supplies | 823 | Tuition and Fees | 233 | DrugsMedical Supplies | 823 | ||||||||||||
| Grants amp Contracts | 864 | Other Expenses | 2152 | Grants amp Contracts | 864 | Other Expenses | 2150 | ||||||||||||
| InternsResidents | 630 | Depreciation | 379 | InternsResidents | 630 | Depreciation | 379 | ||||||||||||
| Net Patient Revenue | 4577 | Total Operating Expenditures | $ 10078 | Net Patient Revenue | 4577 | Total Operating Expenses | 10077 | ||||||||||||
| Correctional Managed Health Care | 835 | Correctional Managed Health Care | 835 | ||||||||||||||||
| Other Revenue | 517 | Other Revenue | 517 | Net Gain(Loss) | (197) | ||||||||||||||
| Total Operating Revenues | $ 9881 | Net Gain(Loss) | $ (197) | Total Operating Revenues | $ 9880 | ||||||||||||||
| Spending plan FY18 (detail capital) | ||||||||
| Original | Revised | |||||||
| Depreciation | 35801260 | 35801260 | ||||||
| EPIC - Carryforward (orig $55M spent $30M) | (2500000) | (2500000) | ||||||
| EPIC - FY18 | (3500000) | (3500000) | ||||||
| Debt payments | (6576264) | (6576264) | ||||||
| Capital Pool - FY18 | (2453042) | (2453042) | ||||||
| Library e-resources | (500000) | - 0 | moved to operating-offset by inkind fb | |||||
| IT Pool | (1000000) | (1000000) | ||||||
| Capital Projects carryforward | (871954) | (871954) | ||||||
| CFO contingency pool | - 0 | (1000000) | ||||||
| Library e-resources - use allowance | (500000) | - 0 | moved to operating offset by inkind fb | |||||
| Use allowance (part of the $684M) | 500000 | 500000 | use allowance cash still funding Library resouces in operating | |||||
| Total Debt serviceprojects | (17401260) | (17401260) | ||||||
| Operating Loss | (18400000) | (18400000) | ||||||
| Balance | - 0 | - 0 | ||||||
| FY18 | FY19 | |||||||||||||||
| Used in FY18 Budget --Governor Recommended Rev May 15 2017 | Senate and House Approved Budget 102017 | Variance | Lapses Distribution 11172017 | Net Appropriation | Senate and House Approved Budget 102017 | Variance | ||||||||||
| Block Grant | 106767742 | 106746887 | (20855) | (4437991) | 102308896 | 106746848 | (39) | |||||||||
| AHEC | - 0 | 374566 | 374566 | (199) | 374367 | 374566 | - 0 | |||||||||
| Bioscience CT funding | 10984843 | 10984843 | - 0 | (306086) | 10678757 | 11567183 | 582340 | |||||||||
| Workers Compensation Approp | 7721978 | 4320855 | (3401123) | - 0 | 4320855 | 4324771 | 3916 | |||||||||
| 125474563 | 122427151 | (3047412) | (4744276) | 117682875 | 123013368 | 586217 | ||||||||||
| Workers Compensation claims | (7721978) | (7721978) | - 0 | (7721978) | (7721978) | - 0 | ||||||||||
| 117752585 | 114705173 | (3047412) | (4744276) | 109960897 | 115291390 | 586217 | ||||||||||
| 74 used | 69 used | |||||||||||||||
| Inkind fb | 87136913 | 81234894 | (5902019) | (3273413) | 77961481 | |||||||||||
| add fringe differential | 13500000 | 13500000 | 13500000 | |||||||||||||
| 100636913 | 94734894 | (5902019) | 91461481 | (3273413) | ||||||||||||
| total State support gross (before wc claims) | 226111476 | 217162045 | (8949431) | 209144356 | ||||||||||||
| total State support net (after wc claims) | 218389498 | 209440067 | (8949431) | 201422378 | ||||||||||||
| Inkind fb | 87121480 | 92197925 | ||||||||||||||
| add fringe differential | 13500000 | 13500000 | ||||||||||||||
| 100621480 | 105697925 | 5076445 | ||||||||||||||
| total State support gross (before wc claims) | 223048631 | 223380800 | ||||||||||||||
| total State support net (after wc claims) | 215326653 | 215658822 |
| Expenditures ($M) | |||
| Personal Services | 3912 | ||
| Fringe Benefits | 2322 | ||
| Correctional Managed Health Care | 804 | ||
| DrugsMedical Supplies | 852 | ||
| Other Expenses | 2147 | ||
| Debt ServiceProjects | 174 | ||
| Total Operating Fund | $ 10211 | ||
| Research and Restricted Expenditures | 684 | ||
| Total Operating Expenditures | $ 10895 | ||
| Personal Services | 3912 | ||
| Fringe Benefits | 2322 | ||
| Correctional Managed Health Care | 804 | ||
| DrugsMedical Supplies | 852 | ||
| Other Expenses | 2147 | ||
| Debt ServiceProjects | 174 | ||
| Research and Restricted Expenditures | 684 |
| Revenues ($M) | |||
| Appropriation | 1177 | ||
| Fringe Benefits amp Adjustments | 1057 | ||
| Total State Support | $ 2234 | ||
| Tuition | 200 | ||
| Fees | 44 | ||
| Grants amp Contracts | 849 | ||
| InternsResidents | 667 | ||
| Net Patient Revenue | 4827 | ||
| Correctional Managed Health Care | 804 | ||
| Other Revenue | 586 | ||
| Total Operating Fund | $ 10211 | ||
| Research and Restricted Funds | 684 | ||
| Total Current Funds Revenues | $ 10895 | ||
| State Support | 2234 | ||
| Tuition | 200 | ||
| Fees | 44 | ||
| Grants amp Contracts | 849 | ||
| InternsResidents | 667 | ||
| Net Patient Revenue | 4827 | ||
| Correctional Managed Health Care | 804 | ||
| Other Revenue | 586 | ||
| Research and Restricted Funds | 684 | ||
| FY18 Original BOT Budget ($M) | FY18 Revised Budget ($M) | Favorable (Unfavorable) ($M) | Notes | ||||||
| Appropriation | 1254 | 1177 | (77) | Reduction in workers compensation and lapses | |||||
| Fringe Benefits amp Adjustments | 1006 | 1057 | 51 | increase due to increase in fringe rates | |||||
| Total State Support | $ 2260 | $ 2234 | $ (26) | ||||||
| Tuition | 200 | 200 | - 0 | ||||||
| Fees | 44 | 44 | - 0 | ||||||
| Grants amp Contracts | 872 | 849 | (23) | First quarter results | |||||
| InternsResidents | 667 | 667 | - 0 | ||||||
| Net Patient Revenue | 4751 | 4827 | 76 | Enhanced payments and first quarter results | |||||
| Correctional Managed Health Care | 804 | 804 | - 0 | ||||||
| Other Revenue | 576 | 586 | 10 | First quarter results - retail pharmacy | |||||
| - 0 | |||||||||
| Total Operating Fund | $ 10174 | $ 10211 | $ 37 | ||||||
| Research and Restricted Funds | 684 | 684 | - 0 | ||||||
| Total Current Funds Revenues | $ 10858 | $ 10895 | $ 37 | ||||||
| Personal Services | 3896 | 3912 | (16) | Implementation of final SEBAC provisions | |||||
| Fringe Benefits | 2288 | 2322 | (34) | Implementation of final SEBAC provisions | |||||
| Correctional Managed Health Care | 804 | 804 | - 0 | ||||||
| DrugsMedical Supplies | 847 | 852 | (05) | First quarter results | |||||
| Other Expenses | 2165 | 2147 | 18 | First quarter results | |||||
| Debt ServiceProjects | 174 | 174 | (00) | ||||||
| Total Operating Fund | $ 10174 | $ 10211 | $ (37) | ||||||
| Research and Restricted Expenditures | 684 | 684 | - 0 | ||||||
| Total Operating Expenditures | $ 10858 | $ 10895 | $ (37) | ||||||
| Net Gain(Loss) | $ - 0 | $ (00) | $ (00) | ||||||
| UConn Health | ||||
| Spending Plan for Fiscal Year 2018 | ||||
| Revenues | ||||
| Appropriation | 117752585 | |||
| Fringe Benefits amp Adjustments | 100594368 | |||
| Total State Support | $ 218346953 | |||
| Tuition and Fees | 24402915 | |||
| Grants amp Contracts | 87178304 | |||
| InternsResidents | 66694948 | |||
| Net Patient Revenue | 475098373 | |||
| Correctional Managed Health Care | 80426658 | |||
| Other Revenue | 57635408 | |||
| Total Operating Funds | $ 1009783559 | |||
| Research and Restricted Funds | 68423247 | |||
| Total Current Funds Revenues | $ 1078206806 | |||
| Expenditures | ||||
| Personal Services | 389629832 | |||
| Fringe Benefits | 221135897 | |||
| Correctional Managed Health Care | 80426658 | |||
| DrugsMedical Supplies | 84704197 | |||
| Other Expenses | 216482470 | |||
| Debt ServiceProjects | 17401260 | |||
| Total Operating Funds | $ 1009780314 | |||
| Research and Restricted Expenditures | 68423247 | |||
| Total Operating Expenditures | $ 1078203561 | |||
| Net Gain | $ 3245 | |||
| Revenues ($M) | Expenditures ($M) | see notes below for summary of changes | |||||||||||||||||
| Appropriation | 1177 | Personal Services | 3912 | Appropriation | 1177 | Personal Services | 3912 | ||||||||||||
| Fringe Benefits amp Adjustments | 1057 | Fringe Benefits | 2322 | Fringe Benefits amp Adjustments | 1057 | Fringe Benefits | 2322 | ||||||||||||
| Total State Support | $ 2234 | Correctional Managed Health Care | 804 | Total State Support | $ 2234 | Correctional Managed Health Care | 804 | ||||||||||||
| Tuition | 200 | DrugsMedical Supplies | 852 | Tuition | 200 | DrugsMedical Supplies | 852 | ||||||||||||
| Fees | 44 | Other Expenses | 2147 | Fees | 44 | Other Expenses | 2147 | ||||||||||||
| Grants amp Contracts | 849 | Depreciation | 358 | Grants amp Contracts | 849 | Depreciation | 358 | ||||||||||||
| InternsResidents | 667 | Total Operating Expenditures | $ 10395 | InternsResidents | 667 | Total Operating Fund | 10395 | ||||||||||||
| Net Patient Revenue | 4827 | Net Patient Revenue | 4827 | ||||||||||||||||
| Correctional Managed Health Care | 804 | Correctional Managed Health Care | 804 | ||||||||||||||||
| Other Revenue | 586 | Other Revenue | 586 | ||||||||||||||||
| Total Operating Revenues | $ 10211 | Net Gain(Loss) | $ (184) | Total Operating Fund | $ 10211 | Net Gain(Loss) | (1838) | ||||||||||||
| Notes - Revisions to original budget presented June28th | |||||||||||||||||||
| Approp revised to approved budget - Oct 2017 and added back the wc - and reduced with lapses of 47M | |||||||||||||||||||
| inkind fringe updated using new approp and lapses- 816 rate used was 74 | |||||||||||||||||||
| split tuition and fees (per request of storrs) | |||||||||||||||||||
| Reduced Grants and contract - first qtr results $23M | |||||||||||||||||||
| workers comps claims of $7721978 moved to fringe exp (was netted out of approp in orig) | |||||||||||||||||||
| Net patient revenue increased by $30M (umg enhanced physician payments) and 1st quarter results $46M | |||||||||||||||||||
| Other revenue - first qtr results - Retail pharmacy | |||||||||||||||||||
| salary cost added 16M (SEBAC provisions longevity and clean up of furlough) | |||||||||||||||||||
| fb cost added $33M (half of Sebac reallocations) offset with addl inkind fringe | |||||||||||||||||||
| rounding issue $100k added to inkind fringe | |||||||||||||||||||
| Drugs and Med supplies $500K added - first quarter results | |||||||||||||||||||
| other expenses $500K added for eresources (maintenance and subscription fees) and first qtr results research decrease $23M |
| Revenues ($M) | Expenditures ($M) | see notes below for summary of changes | |||||||||||||||||
| Appropriation | 1177 | Personal Services | 3912 | Appropriation | 1177 | Personal Services | 3912 | ||||||||||||
| Fringe Benefits amp Adjustments | 1057 | Fringe Benefits | 2322 | Fringe Benefits amp Adjustments | 1057 | Fringe Benefits | 2322 | ||||||||||||
| Total State Support | $ 2234 | Correctional Managed Health Care | 804 | Total State Support | $ 2234 | Correctional Managed Health Care | 804 | ||||||||||||
| Tuition | 200 | DrugsMedical Supplies | 852 | Tuition | 200 | DrugsMedical Supplies | 852 | ||||||||||||
| Fees | 44 | Other Expenses | 2147 | Fees | 44 | Other Expenses | 2147 | ||||||||||||
| Grants amp Contracts | 849 | Debt ServiceProjects | 174 | Grants amp Contracts | 849 | Debt ServiceProjects | 174 | ||||||||||||
| InternsResidents | 667 | Total Operating Fund | $ 10211 | InternsResidents | 667 | Total Operating Fund | 10211 | ||||||||||||
| Net Patient Revenue | 4827 | Net Patient Revenue | 4827 | ||||||||||||||||
| Correctional Managed Health Care | 804 | Research and Restricted Expenditures | 684 | Correctional Managed Health Care | 804 | Research and Restricted Expenditures | 684 | ||||||||||||
| Other Revenue | 586 | Other Revenue | 586 | ||||||||||||||||
| Total Operating Fund | $ 10211 | Total Operating Expenditures | $ 10895 | Total Operating Fund | $ 10211 | Total Operating Expenditures | $ 10895 | ||||||||||||
| Research and Restricted Funds | 684 | Research and Restricted Funds | 684 | ||||||||||||||||
| Total Current Funds Revenues | $ 10895 | Net Gain(Loss) | $ (00) | Total Current Funds Revenues | $ 10895 | Net Gain(Loss) | 00 | ||||||||||||
| Research and Restricted Funds - detail | |||||||||||||||||||
| Use Allowance | 7000000 | per Julie | |||||||||||||||||
| State Bond Funds-EMR | 23700000 | State Bond funds EMR (41M less spent $173) | storrs funds for EMR $48M | ||||||||||||||||
| Storrs Funds - EMR | 35000000 | per storrs agreement | FY18 | 35000000 | |||||||||||||||
| Comprehensive Cancer Center | 1556995 | cash balance (orig amt 25M in FY13) | FY19 | 13000000 | |||||||||||||||
| Health Disparity | 1166252 | cash balance (orig amt 25M in FY13) | 48000000 | ||||||||||||||||
| 68423247 | |||||||||||||||||||
| Notes - Revisions to original budget presented June28th | |||||||||||||||||||
| Approp revised to approved budget - Oct 2017 and added back the wc - and reduced with lapses of 47M | |||||||||||||||||||
| inkind fringe updated using new approp and lapses- 816 rate used was 74 | |||||||||||||||||||
| split tuition and fees (per request of storrs) | |||||||||||||||||||
| Reduced Grants and contract - first qtr results $23M | |||||||||||||||||||
| workers comps claims of $7721978 moved to fringe exp (was netted out of approp in orig) | |||||||||||||||||||
| Net patient revenue increased by $30M (umg enhanced physician payments) and 1st quarter results $46M | |||||||||||||||||||
| Other revenue - first qtr results - Retail pharmacy | |||||||||||||||||||
| salary cost added 16M (SEBAC provisions longevity and clean up of furlough) | |||||||||||||||||||
| fb cost added $33M (half of Sebac reallocations) offset with addl inkind fringe | |||||||||||||||||||
| rounding issue $100k added to inkind fringe | |||||||||||||||||||
| Drugs and Med supplies $500K added - first quarter results | |||||||||||||||||||
| other expenses $500K added for eresources (maintenance and subscription fees) and first qtr results research decrease $23M |
| FY18 Budget Target | |||||||
| FY18 Bottom line - Preliminary Projection | $ (5940) | ||||||
| Financial interventions posted to budget | 1270 | ||||||
| FY18 Bottom line - Current | $ (4670) | ||||||
| Not Posted to Budget | |||||||
| SEBAC (Estimated Savings) | 1270 | ||||||
| UMG | |||||||
| Revenue increase (Adding an additional Patient per week would be approximately $13M) | 400 | need broad categories of these savings | |||||
| Expense reduction | 350 | Annes will provide summary | |||||
| JDH | |||||||
| Revenue increase | 400 | ||||||
| Expense reduction | 410 | ||||||
| FY18 Bottom line Target | $ (1840) | ||||||
| FY18 Preliminary Forecast and Assumptions | ||||
| Bottom line | ||||
| FY2017 Budget | $ (197) | |||
| Estimated additional clinical revenue (2 increase) | 90 | |||
| State Support reduction (Gov Rec compared to Allotment Amount - includes Block Grant In-kind Fringes Bioscience and Workers Compensation) | (118) | |||
| NICU Rental Income decrease (Per contract) | (10) | |||
| Research Grants | (19) | |||
| Fringe Benefit - retirement rates per comptrollers estimates (Net of in-kind fb) | (68) | |||
| Fringe Benefit - estimates of Insurance increases (Net of in-kind fb) | (40) | |||
| FY2018 Original Projection (without Health One) | $ (361) | |||
| Health One - revenue reduction | (113) | |||
| Health One - training and back fill | (120) | |||
| Total FY18 Preliminary Forecast | $ (594) | |||
| FY17 Forecast vs FY17 Budget | ||||||||||
| FY17 Budget | FY17 Forecast | Variance | ||||||||
| Revenues | ||||||||||
| Net Patient Care | $ 4715 | $ 4567 | $ (148) | |||||||
| Other Revenue | 2241 | 2243 | 02 | |||||||
| Correctional Managed Health Care | 833 | 824 | (09) | |||||||
| State Support | 1236 | 1218 | (18) | |||||||
| In-kind Fringe Benefits and Differential | 976 | 1007 | 31 | |||||||
| Total Revenue | $ 10001 | $ 9860 | $ (141) | |||||||
| Expenses | ||||||||||
| Salary | $ 3857 | $ 3843 | $ (14) | |||||||
| Fringe Benefits | 2066 | 2037 | (29) | |||||||
| Correctional Managed Health Care | 833 | 824 | (09) | |||||||
| Other Expenses | 3404 | 3352 | (52) | |||||||
| Total Expenses | $ 10160 | $ 10056 | $ (104) | |||||||
| Excess(Deficiency) of Revenues over Expenses | $ (159) | $ (197) | $ (38) | |||||||
| notes for Jeff | ||||||||||
| summary of forecast changes | (21554857) | |||||||||
| Third Party updated thru April YTD | (3000000) | |||||||||
| IT review | 183120 | |||||||||
| Core Reconciliation | 1800000 | |||||||||
| Interns amp Res | 823000 | |||||||||
| Hemophilia clinic340B pharmacy | 1360329 | |||||||||
| Library (moved to capital) | 108000 | |||||||||
| Facilities Mgmt | 223012 | |||||||||
| Creative Child Care | 23000 | |||||||||
| Fire Dept | 76780 | |||||||||
| ResearchAcademic review of spend | 1258000 | |||||||||
| 2855241 | ||||||||||
| (18699616) | ||||||||||
| FY18 Budget Assumptions | ||
| The following presentation assumes | ||
| Tuition and Fees - overall 45 rate increase | ||
| Research revenue - slight increase offset by additional expenses | ||
| Salaries - no increase related to bargaining units due to no settled contracts as of budget preparation | ||
| Fringes - State Comptrollers estimated state retirement rates used | ||
| Appropriation - Governors Recommended Revised budget as of May 15 2017 | ||
| FY 2013 | FY 2014 | FY 2015 | FY 2016 | FY 2017 Forecast | FY2018 Budget | ||||||||
| UCH Profit (Loss) | (7203277) | (15458141) | (2876454) | (12564848) | (19688715) | (59400000) | |||||||
| UCH Profit (Loss) | (72) | (155) | (29) | (126) | (197) | (594) | |||||||
| Orig Projection | Final Budget | ActualsForecast | ||||||||||||||||||||
| FY14 | (210) | (110) | (155) | |||||||||||||||||||
| FY15 | (259) | (125) | (29) | |||||||||||||||||||
| FY16 | (400) | (159) | (126) | |||||||||||||||||||
| FY17 | (481) | (159) | (197) | |||||||||||||||||||
| FY18 | (594) | (184) | ||||||||||||||||||||
| Note | ||||||||||||||||||||||
| Financial Improvement Project began in FY2014 - Total savings of $103M |
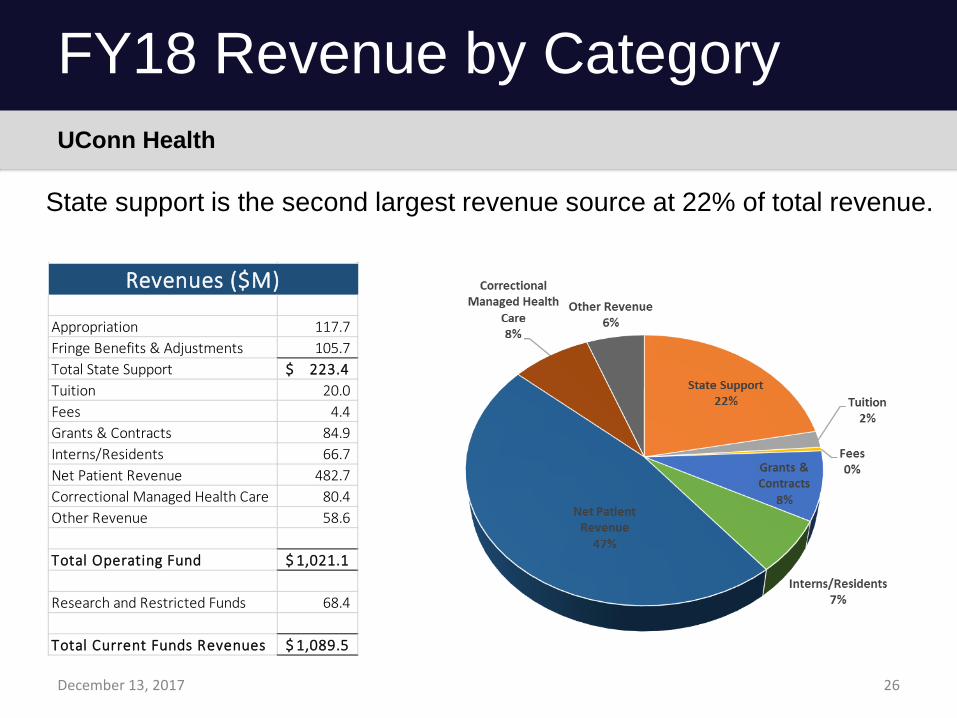

FY18 Expense by Category
Personal Services 3912 Fringe Benefits 2322 Correctional Managed Health Care 804 DrugsMedical Supplies 852 Other Expenses 2147 Debt ServiceProjects 174 Total Operating Fund 10211$
Research and Restricted Expenditur 684
Total Operating Expenditures 10895$
Expenditures ($M)
Personal Services
36
Fringe Benefits21Correctional
Managed Health Care7
DrugsMedical Supplies
8
Other Expenses20
Debt ServiceProjects
2
Research and Restricted
Expenditures6
UConn Health
Personnel costs make up 57 of UConn Healthrsquos overall expenditure budget
December 13 2017 27
FY14FY15FY16FY17FY18-21-259-40-481-594Final Budget
FY14FY15FY16FY17FY18-11-125-159-159-18399999999999999ActualsForecast
FY14FY15FY16FY17FY18-155-29-126-197
Profit (Loss)
FY13 - FY18
UCH Profit (Loss)FY 2013FY 2014FY 2015FY 2016FY 2017 ForecastFY2018 Budget-72032769999999999-15458140999999999-28764539999999998-12564848-19688714999999998-594
State SupportTuitionFeesGrants amp ContractsInternsResidentsNet Patient RevenueCorrectional Managed Health CareOther Revenue22342044000000000000004849667482780400000000000006586
Personal ServicesFringe BenefitsCorrectional Managed Health CareDrugsMedical SuppliesOther ExpensesDebt ServiceProjectsResearch and Restricted Expenditures391223228040000000000000685221471740126000000000168400000000000006
amp8ampK00-024ampZampF
Differences in rates FY18 orig budget used 74 as a rate When estimating for medicagov relations Uconn storrs suggested we use the same rate at 69
For the revised BODBOT presentations used the 816 rate with the new appropriation
FY18 Gov $[VALUE]
FY10FY11FY12FY13FY14FY15FY16FY17FY18118972138119346347109669578112666627125542313135366969144290800134539312125474563 AllotmentFY10FY11FY12FY13FY14FY15FY16FY17FY18117734347119166814108458794108519733125018941131158966143898479130030646Democratic budget
FY18 Dem $[VALUE]
FY10FY11FY12FY13FY14FY15FY16FY17FY18134539312126820354Republican budget
FY18 Rep $[VALUE]
FY10FY11FY12FY13FY14FY15FY16FY17FY18134539312115249782
State Support and Net Patient Revenue
Net Patient Revenue
FY13FY14FY15FY16FY17 ForecastFY18 Budget358367701372814684431182934452366520457724062475098373Total State Support
FY13FY14FY15FY16FY17 ForecastFY18 Budget173192257213854874226796933235291486222513422218446953
Salary Expense ($M)
Faculty
201220132014201520162017 Forecast2018 Budget10730906310675877011258533911815635512336023712232893712468154592All Other Staff
201220132014201520162017 Forecast2018 Budget23385714823276053724060451024797392226323237126199454026494828507999998
John Dempsey Hospital vs Connecticut Hospital Association Fringe Rate
CHA rate
20052010201120122013201420152016201720180273899999999999980295403014031080000000000002030609999999999998028799999999999998028789999999999999029399999999999998029987999999999998030587759999999997JDH rate
2005201020112012201320142015201620172018038719999999999999044280000000000003044080000000000003043409999999999999046100989118483643053266397642863328054479050264180173057442497383828672059146205947123043066300000000000003
Fringe Benefit DifferentialFY 2013FY 2014FY 2015FY 2016FY 2017 ForecastFY2018 Budget135000001350000013500000135000001350000013500000Actual Hospital DifferentialFY 2013FY 2014FY 2015FY 2016FY 2017 ForecastFY2018 Budget170612883784000022559753009600000127567138709199995328022674020000063467286594704000743315787
1
2
3
4
5
6
7
8
9
A
B
C
Personal Services
3912
Fringe Benefits
2322
Correctional Managed Health Care
804
DrugsMedical Supplies
852
Other Expenses
2147
Expenditures ($M)
| FY18 Bottom Line - Original Projection | (5940) | |||
| Other revenue | 320 | |||
| Institutional workforce | 1100 | |||
| Purchased services | 050 | |||
| Other expenses | 040 | |||
| Net patient revenue | 990 | |||
| Clinical workforce planning | 470 | |||
| Clinical non labor | 010 | |||
| Clinical revenue cycle | 090 | |||
| State support (Governors revised budget) | (240) | |||
| SEBAC (estimated savings) | 1270 | |||
| FY18 Bottom line - Proposed Budget | (1840) | |||
| 1) Comparison of Fringe rate with CHA average | ||||||||||||||||||||||||||
| 2) Fringe differential compared to actual hospital differential | ||||||||||||||||||||||||||
| note fy18 was updated to match proposed budget rate of 663 | ||||||||||||||||||||||||||
| John Dempsey Hospital vs Connecticut Hospital Association Fringe | ||||||||||||||||||||||||||
| FY | CHA rate | JDH rate | ||||||||||||||||||||||||
| 2005 | 274 | 387 | ||||||||||||||||||||||||
| 2006 | 289 | 371 | ||||||||||||||||||||||||
| 2007 | 277 | 401 | ||||||||||||||||||||||||
| 2008 | 280 | 411 | ||||||||||||||||||||||||
| 2009 | 271 | 412 | ||||||||||||||||||||||||
| 2010 | 295 | 443 | ||||||||||||||||||||||||
| 2011 | 301 | 441 | ||||||||||||||||||||||||
| 2012 | 311 | 434 | ||||||||||||||||||||||||
| 2013 | 306 | 461 | ||||||||||||||||||||||||
| 2014 | 288 | 533 | ||||||||||||||||||||||||
| 2015 | 288 | 545 | ||||||||||||||||||||||||
| 2016 | 294 | 574 | ||||||||||||||||||||||||
| 2017 | 300 | 591 | ||||||||||||||||||||||||
| 2018 | 306 | 663 | ||||||||||||||||||||||||
| Plan Description | FY2010-11 | FY2011-12 | FY2012-13 | FY2013-14 | FY2014-15 | FY2015-16 | FY2016-17 | FY2017-2018 Estimates | ||||||||||||||||||
| Alternate Retirement Program (ARP) | 1003 | 818 | 917 | 1120 | 1170 | 1199 | 1193 | 1300 | ||||||||||||||||||
| SERS Hazardous Duty | 3719 | 3687 | 4871 | 5895 | 6243 | 6251 | 6994 | 8900 | ||||||||||||||||||
| SERS Retirement Regular | 4000 | 3941 | 4601 | 5471 | 5050 | 5358 | 5499 | 6100 | ||||||||||||||||||
| Unemployment Compensation | 016 | 020 | 026 | 012 | 015 | 012 | 006 | 026 | ||||||||||||||||||
| 8738 | 8466 | 10415 | 12498 | 12478 | 12820 | 13692 | 16326 | |||||||||||||||||||
| -31 | 230 | 200 | -02 | 27 | 68 | 192 | ||||||||||||||||||||
| SERS Retirement Regular Rate Increases | 167 | 189 | -77 | 61 | 26 | 109 | ||||||||||||||||||||
| Average increase for Health insurance (approximate amounts) | 850 | 14 | 6 | 4 | 6 | |||||||||||||||||||||
| FY 2007 | FY 2008 | FY 2009 | FY 2010 | FY 2011 | FY 2012 | FY 2013 | FY 2014 | FY 2015 | FY 2016 | FY 2017 Forecast | FY2018 Budget | |||||||||||||||
| UCH Profit (Loss) | (26272245) | (23382917) | (22965602) | 3992933 | 3961289 | (2922761) | (7203277) | (15458141) | (2876454) | (12564848) | (21554857) | |||||||||||||||
| Deficiency Appropriation | 22100000 | 21900000 | 22200000 | - 0 | - 0 | - 0 | - 0 | - 0 | - 0 | - 0 | - 0 | |||||||||||||||
| Bioscience CT | - 0 | - 0 | - 0 | - 0 | - 0 | - 0 | 500000 | 11900724 | 16765958 | 12458333 | 10857600 | |||||||||||||||
| Fringe Benefit Differential | - 0 | - 0 | 3600000 | 13500000 | 13500000 | 13500000 | 13500000 | 13500000 | 13500000 | 13500000 | 13500000 | 13500000 | ||||||||||||||
| State Approp | 78614491 | 96797174 | 106012205 | 117734347 | 119166814 | 108458794 | 108019733 | 113118217 | 114393008 | 123432329 | 111649501 | |||||||||||||||
| UCH Profit (Loss)-after Deficiency Approp | (4172245) | (1482917) | (765602) | 3992933 | 3961289 | (2922761) | (7203277) | (15458141) | (2876454) | (12564848) | (21554857) | |||||||||||||||
| Actual Hospital Differential | 17061288 | 25597530 | 27567139 | 32802267 | 34672866 | 43315787 | ||||||||||||||||||||
| FY 2014 | FY 2015 | FY 2016 | FY 2017 Forecast | FY2018 Forecast | ||||||||||||||||||||||
| Debt Service (MARB and Outpatient Pavilion) | 7007001 | 12044165 | 15985039 | 15985039 | 16021543 | |||||||||||||||||||||
| includes MRI in FY18 |
| 48463620 | 142 | ||||||||||||||||
| 2012 | 2013 | 2014 | 2015 | 2016 | 2017 Forecast | 2018 Budget | |||||||||||
| All Position Codes - - Incumbant | 341166211 | 339519307 | 353189850 | 366130278 | 386592608 | 384323477 | 389629831 | 114 | |||||||||
| Faculty | 107309063 | 106758770 | 112585339 | 118156355 | 123360237 | 122328937 | 124681546 | ||||||||||
| All Other Staff | 233857148 | 232760537 | 240604510 | 247973922 | 263232371 | 261994540 | 264948285 | ||||||||||
| Proposal | Additional Information | FY17 Cost | FY18 Cost ($M) | FY19 Cost ($M) | FY20 Cost ($M) | FY21 Cost ($M) | Total Cost ($M) | ||||||||||||
| Wage Increase | Unions | 0 hard freeze FY17FY18FY19$2000 one time stipend in FY1935 + [step Increase] in FY20 FY21 | Includes Fringe Benefits | $ - 0 | $ - 0 | $ 160 | $ - 0 | $ - 0 | $ 160 | ||||||||||
| Furlough Days | Unions | 3 Furlough Days in FY18 | Includes Fringe Benefits | $ - 0 | $ (34) | $ - 0 | $ - 0 | $ - 0 | $ (34) | ||||||||||
| Delay Longevity Payment | Unions | Delay longevity payment in FY18 | Need additional confirmation but assumption is that April 2018 longevity payment delayed to FY19 | $ - 0 | $ (14) | $ 14 | $ - 0 | $ - 0 | $ - 0 | ||||||||||
| Subtotal Wage Impact (including associated fringe benefits) | $ - 0 | $ (48) | $ 174 | $ - 0 | $ - 0 | $ 126 | |||||||||||||
| Health Insurance - Increase in employee share of premium | Unions | - Increase 1 each year in FY20FY21FY22 for existing employees - New employes at 15 - Mgmt already at 23 | Uconns share of the premium will decrease by 1 Will impact fringe cost | $ - 0 | $ - 0 | $ - 0 | $ - 0 | $ - 0 | $ - 0 | ||||||||||
| Mgmt | No change Management share increasing in FY18 to 23 | $ - 0 | $ - 0 | $ - 0 | $ - 0 | $ - 0 | $ - 0 | ||||||||||||
| Fringe Rate Impact | All other Pension and Healthcare changes IMPACT UNKNOWN | This should ultimately reduce fringe costs but additional information and further analysis is required to understand full impact OPM provided an estimated reduction to SERS rate of 6 | $ - 0 | ||||||||||||||||
| Retiree Healthcare | Retiree COLA health contribution and Medicare changes | This should ultimately reduce fringe costs but additional information and further analysis is required to understand full impact | $ - 0 | ||||||||||||||||
| Pension - Contribution | FY18 FY19 = Increase pension contribution by 15FY20 FY21 = Increase pension contribution by additional 05 | This should ultimately reduce fringe costs but additional information and further analysis is required to understand full impact | $ - 0 | ||||||||||||||||
| Pension - Tier IV | Hybrid pensiondefined contribution State will match 1 | This should ultimately reduce fringe costs but additional information and further analysis is required to understand full impact | $ - 0 | ||||||||||||||||
| TOTAL COST(SAVINGS) - UNION EMPLOYEES | $ - 0 | $ (48) | $ 174 | $ - 0 | $ - 0 | $ 126 |
| FY17 Forecast ($M) | FY18 Budget ($M) | Favorable (Unfavorable) ($M) | Notes | ||||||
| Appropriation | 1218 | 1178 | (40) | Governors revised budget | |||||
| Fringe Benefits amp Adjustments | 1007 | 1006 | (01) | ||||||
| Total State Support | $ 2225 | $ 2183 | |||||||
| Tuition and Fees | 233 | 244 | 11 | Approved tuition rate increase of 45 | |||||
| Grants amp Contracts | 864 | 872 | 08 | Research grant revenue remains flat | |||||
| InternsResidents | 630 | 667 | 37 | Growth in revenue offset by increased expenses | |||||
| Net Patient Revenue | 4577 | 4751 | 174 | 38 increase | |||||
| Correctional Managed Health Care | 835 | 804 | (31) | ||||||
| Other Revenue | 517 | 576 | 60 | ||||||
| Total Operating Revenues | $ 9880 | $ 10098 | $ 259 | ||||||
| Personal Services | 3843 | 3896 | 53 | Increase is related to mid year hires in FY17 | |||||
| Fringe Benefits | 2046 | 2211 | 165 | estimated Comprollers fringe rates used | |||||
| Correctional Managed Health Care | 835 | 804 | (31) | ||||||
| DrugsMedical Supplies | 823 | 847 | 24 | increase in drugsmedicals supplies related to increase in volume | |||||
| Other Expenses | 2530 | 2165 | (365) | ||||||
| Debt ServiceProjects | - 0 | - 0 | - 0 | ||||||
| Total Operating Expenses | 10077 | 9924 | (154) | ||||||
| Net Gain(Loss) | (197) | 1740 | 4125 | ||||||
| Net Patient Revenue | Total State Support | Net Patient Revenue | Total State Support | ||||||
| FY13 | 358367701 | 173192257 | 3584 | 1732 | |||||
| FY14 | 372814684 | 213854874 | 3728 | 2139 | |||||
| FY15 | 431182934 | 226796933 | 4312 | 2231 | |||||
| FY16 | 452366520 | 235291486 | 4524 | 2353 | |||||
| FY17 Forecast | 457724062 | 222513422 | 4577 | 2225 | |||||
| FY18 Budget | 475098373 | 218446953 | 4751 | 2184 | |||||
| per TM1 | per TM |
| Fiscal Year | Appropriation | Allotment | Democratic budget | Republican budget | |||||
| FY10 | 118972138 | 117734347 | |||||||
| FY11 | 119346347 | 119166814 | |||||||
| FY12 | 109669578 | 108458794 | |||||||
| FY13 | 112666627 | 108519733 | |||||||
| FY14 | 125542313 | 125018941 | |||||||
| FY15 | 135366969 | 131158966 | |||||||
| FY16 | 144290800 | 143898479 | |||||||
| FY17 | 134539312 | 130030646 | 134539312 | 134539312 | |||||
| FY18 | 125474563 | 126820354 | 115249782 | ||||||
| FY18 Budget Target | $ (184) | ||
| SEBAC estimated costs | |||
| Three furlough day savings not in FY19 | (34) | ||
| Longevity (postponed in FY18) | (28) | ||
| Lump Sum payments (estimated $2000) | (160) | ||
| Appropriation (Governors Recommended) | 55 | ||
| Clinical revenue | 90 | ||
| FY19 Estimated Budget | $ (261) |
| Revenues ($M) | Expenditures ($M) | ||||||||||||||||||||||||
| Appropriation | 1218 | Personal Services | 3843 | Original | Forecast | variance | |||||||||||||||||||
| Fringe Benefits amp Adjustments | 1007 | Fringe Benefits | 2046 | Total Operating Revenue | 77320 | 76560 | (760) | ||||||||||||||||||
| Total State Support | $ 2225 | Correctional Managed Health Care | 835 | State Support | 22470 | 22250 | (220) | ||||||||||||||||||
| Tuition and Fees | 233 | DrugsMedical Supplies | 823 | Restricted Capital Balances | |||||||||||||||||||||
| Grants amp Contracts | 864 | Other Expenses | 2152 | Use Allowance | 560 | 200 | (360) | 1820 | |||||||||||||||||
| InternsResidents | 630 | Debt ServiceProjects | 169 | State Bond Funds | 4440 | 2640 | (1800) | use fy18 carryforward | |||||||||||||||||
| Net Patient Revenue | 4577 | Total Operating Fund | $ 9868 | Departmental Grant Funds | 100 | 100 | - 0 | ||||||||||||||||||
| Correctional Managed Health Care | 835 | ||||||||||||||||||||||||
| Other Revenue | 517 | Research and Restricted Expenditures | 294 | Total Available for Spending | 104890 | 101750 | (3140) | ||||||||||||||||||
| Total Operating Fund | $ 9881 | Total Operating Expenditures | $ 10162 | Total Operating Expenses (less depreciation) | 97640 | 96990 | (650) | ||||||||||||||||||
| Current Approved Capital Projects | 250 | 250 | - 0 | balances carried into FY18 | |||||||||||||||||||||
| Research and Restricted Funds | 294 | Working Capital Needs | 200 | 200 | - 0 | State Bond Funds-EMR | 23700000 | State Bond funds EMR (41M less spent $173) | |||||||||||||||||
| FY 2017 Capital Spending | 1200 | 690 | (510) | Comprehensive Cancer Center | 1556995 | cash balance (orig amt 25M in FY13) | |||||||||||||||||||
| Total Current Funds Revenues | $ 10175 | Net Gain(Loss) | $ 13 | State Bond Funds | 4390 | 2640 | (1750) | Health Disparity | 1166252 | cash balance (orig amt 25M in FY13) | |||||||||||||||
| Use Allowance | 560 | 200 | (360) | 26423247 | |||||||||||||||||||||
| Departmental Grant Funds | 100 | 100 | - 0 | ||||||||||||||||||||||
| Principal Payment on Debt | 550 | 550 | - 0 | ||||||||||||||||||||||
| Total Spending Plan | 104890 | 101620 | (3270) | ||||||||||||||||||||||
| Excess(Deficiency) | - 0 | 130 | 130 | ||||||||||||||||||||||
| FY17 Capital Budget Pools | |||||||||||||||||||||||||
| Dept Name | Description of Equipment or Project | Original Budget | Source of Funds | balance as of June 2017 | spent | epic | |||||||||||||||||||
| Information Tech | EPIC Project (1) | 3500000 | Operating | 2500000 | 1000000 | 2000000 | FY16 | ||||||||||||||||||
| Campus Planning | Capitalized Positions | 779619 | Operating | - 0 | 779619 | 3500000 | FY17 | ||||||||||||||||||
| Library | Library Acquisitions | 1080000 | Operating | - 0 | 1080000 | (3000000) | spent | ||||||||||||||||||
| Finance | UCH Contingency | 2603139 | Operating | 951432 | 1651707 | 2500000 | balance available | ||||||||||||||||||
| Finance | CFO - Hold | 4000000 | Operating | 3594475 | 405525 | ||||||||||||||||||||
| 11962758 | 7045907 | 4916851 | |||||||||||||||||||||||
| 2000000 | per jeff | ||||||||||||||||||||||||
| 6916851 |
| Revenues ($M) | Expenditures ($M) | ||||||||||||||||||
| Appropriation | 1218 | Personal Services | 3843 | Appropriation | 1218 | Personal Services | 3843 | ||||||||||||
| Fringe Benefits amp Adjustments | 1007 | Fringe Benefits | 2046 | Fringe Benefits amp Adjustments | 1007 | Fringe Benefits | 2046 | ||||||||||||
| Total State Support | $ 2225 | Correctional Managed Health Care | 835 | Total State Support | $ 2225 | Correctional Managed Health Care | 835 | ||||||||||||
| Tuition and Fees | 233 | DrugsMedical Supplies | 823 | Tuition and Fees | 233 | DrugsMedical Supplies | 823 | ||||||||||||
| Grants amp Contracts | 864 | Other Expenses | 2152 | Grants amp Contracts | 864 | Other Expenses | 2150 | ||||||||||||
| InternsResidents | 630 | Depreciation | 379 | InternsResidents | 630 | Depreciation | 379 | ||||||||||||
| Net Patient Revenue | 4577 | Total Operating Expenditures | $ 10078 | Net Patient Revenue | 4577 | Total Operating Expenses | 10077 | ||||||||||||
| Correctional Managed Health Care | 835 | Correctional Managed Health Care | 835 | ||||||||||||||||
| Other Revenue | 517 | Other Revenue | 517 | Net Gain(Loss) | (197) | ||||||||||||||
| Total Operating Revenues | $ 9881 | Net Gain(Loss) | $ (197) | Total Operating Revenues | $ 9880 | ||||||||||||||
| Spending plan FY18 (detail capital) | ||||||||
| Original | Revised | |||||||
| Depreciation | 35801260 | 35801260 | ||||||
| EPIC - Carryforward (orig $55M spent $30M) | (2500000) | (2500000) | ||||||
| EPIC - FY18 | (3500000) | (3500000) | ||||||
| Debt payments | (6576264) | (6576264) | ||||||
| Capital Pool - FY18 | (2453042) | (2453042) | ||||||
| Library e-resources | (500000) | - 0 | moved to operating-offset by inkind fb | |||||
| IT Pool | (1000000) | (1000000) | ||||||
| Capital Projects carryforward | (871954) | (871954) | ||||||
| CFO contingency pool | - 0 | (1000000) | ||||||
| Library e-resources - use allowance | (500000) | - 0 | moved to operating offset by inkind fb | |||||
| Use allowance (part of the $684M) | 500000 | 500000 | use allowance cash still funding Library resouces in operating | |||||
| Total Debt serviceprojects | (17401260) | (17401260) | ||||||
| Operating Loss | (18400000) | (18400000) | ||||||
| Balance | - 0 | - 0 | ||||||
| FY18 | FY19 | |||||||||||||||
| Used in FY18 Budget --Governor Recommended Rev May 15 2017 | Senate and House Approved Budget 102017 | Variance | Lapses Distribution 11172017 | Net Appropriation | Senate and House Approved Budget 102017 | Variance | ||||||||||
| Block Grant | 106767742 | 106746887 | (20855) | (4437991) | 102308896 | 106746848 | (39) | |||||||||
| AHEC | - 0 | 374566 | 374566 | (199) | 374367 | 374566 | - 0 | |||||||||
| Bioscience CT funding | 10984843 | 10984843 | - 0 | (306086) | 10678757 | 11567183 | 582340 | |||||||||
| Workers Compensation Approp | 7721978 | 4320855 | (3401123) | - 0 | 4320855 | 4324771 | 3916 | |||||||||
| 125474563 | 122427151 | (3047412) | (4744276) | 117682875 | 123013368 | 586217 | ||||||||||
| Workers Compensation claims | (7721978) | (7721978) | - 0 | (7721978) | (7721978) | - 0 | ||||||||||
| 117752585 | 114705173 | (3047412) | (4744276) | 109960897 | 115291390 | 586217 | ||||||||||
| 74 used | 69 used | |||||||||||||||
| Inkind fb | 87136913 | 81234894 | (5902019) | (3273413) | 77961481 | |||||||||||
| add fringe differential | 13500000 | 13500000 | 13500000 | |||||||||||||
| 100636913 | 94734894 | (5902019) | 91461481 | (3273413) | ||||||||||||
| total State support gross (before wc claims) | 226111476 | 217162045 | (8949431) | 209144356 | ||||||||||||
| total State support net (after wc claims) | 218389498 | 209440067 | (8949431) | 201422378 | ||||||||||||
| Inkind fb | 87121480 | 92197925 | ||||||||||||||
| add fringe differential | 13500000 | 13500000 | ||||||||||||||
| 100621480 | 105697925 | 5076445 | ||||||||||||||
| total State support gross (before wc claims) | 223048631 | 223380800 | ||||||||||||||
| total State support net (after wc claims) | 215326653 | 215658822 |
| Expenditures ($M) | |||
| Personal Services | 3912 | ||
| Fringe Benefits | 2322 | ||
| Correctional Managed Health Care | 804 | ||
| DrugsMedical Supplies | 852 | ||
| Other Expenses | 2147 | ||
| Debt ServiceProjects | 174 | ||
| Total Operating Fund | $ 10211 | ||
| Research and Restricted Expenditures | 684 | ||
| Total Operating Expenditures | $ 10895 | ||
| Personal Services | 3912 | ||
| Fringe Benefits | 2322 | ||
| Correctional Managed Health Care | 804 | ||
| DrugsMedical Supplies | 852 | ||
| Other Expenses | 2147 | ||
| Debt ServiceProjects | 174 | ||
| Research and Restricted Expenditures | 684 |
| Revenues ($M) | |||
| Appropriation | 1177 | ||
| Fringe Benefits amp Adjustments | 1057 | ||
| Total State Support | $ 2234 | ||
| Tuition | 200 | ||
| Fees | 44 | ||
| Grants amp Contracts | 849 | ||
| InternsResidents | 667 | ||
| Net Patient Revenue | 4827 | ||
| Correctional Managed Health Care | 804 | ||
| Other Revenue | 586 | ||
| Total Operating Fund | $ 10211 | ||
| Research and Restricted Funds | 684 | ||
| Total Current Funds Revenues | $ 10895 | ||
| State Support | 2234 | ||
| Tuition | 200 | ||
| Fees | 44 | ||
| Grants amp Contracts | 849 | ||
| InternsResidents | 667 | ||
| Net Patient Revenue | 4827 | ||
| Correctional Managed Health Care | 804 | ||
| Other Revenue | 586 | ||
| Research and Restricted Funds | 684 | ||
| FY18 Original BOT Budget ($M) | FY18 Revised Budget ($M) | Favorable (Unfavorable) ($M) | Notes | ||||||
| Appropriation | 1254 | 1177 | (77) | Reduction in workers compensation and lapses | |||||
| Fringe Benefits amp Adjustments | 1006 | 1057 | 51 | increase due to increase in fringe rates | |||||
| Total State Support | $ 2260 | $ 2234 | $ (26) | ||||||
| Tuition | 200 | 200 | - 0 | ||||||
| Fees | 44 | 44 | - 0 | ||||||
| Grants amp Contracts | 872 | 849 | (23) | First quarter results | |||||
| InternsResidents | 667 | 667 | - 0 | ||||||
| Net Patient Revenue | 4751 | 4827 | 76 | Enhanced payments and first quarter results | |||||
| Correctional Managed Health Care | 804 | 804 | - 0 | ||||||
| Other Revenue | 576 | 586 | 10 | First quarter results - retail pharmacy | |||||
| - 0 | |||||||||
| Total Operating Fund | $ 10174 | $ 10211 | $ 37 | ||||||
| Research and Restricted Funds | 684 | 684 | - 0 | ||||||
| Total Current Funds Revenues | $ 10858 | $ 10895 | $ 37 | ||||||
| Personal Services | 3896 | 3912 | (16) | Implementation of final SEBAC provisions | |||||
| Fringe Benefits | 2288 | 2322 | (34) | Implementation of final SEBAC provisions | |||||
| Correctional Managed Health Care | 804 | 804 | - 0 | ||||||
| DrugsMedical Supplies | 847 | 852 | (05) | First quarter results | |||||
| Other Expenses | 2165 | 2147 | 18 | First quarter results | |||||
| Debt ServiceProjects | 174 | 174 | (00) | ||||||
| Total Operating Fund | $ 10174 | $ 10211 | $ (37) | ||||||
| Research and Restricted Expenditures | 684 | 684 | - 0 | ||||||
| Total Operating Expenditures | $ 10858 | $ 10895 | $ (37) | ||||||
| Net Gain(Loss) | $ - 0 | $ (00) | $ (00) | ||||||
| UConn Health | ||||
| Spending Plan for Fiscal Year 2018 | ||||
| Revenues | ||||
| Appropriation | 117752585 | |||
| Fringe Benefits amp Adjustments | 100594368 | |||
| Total State Support | $ 218346953 | |||
| Tuition and Fees | 24402915 | |||
| Grants amp Contracts | 87178304 | |||
| InternsResidents | 66694948 | |||
| Net Patient Revenue | 475098373 | |||
| Correctional Managed Health Care | 80426658 | |||
| Other Revenue | 57635408 | |||
| Total Operating Funds | $ 1009783559 | |||
| Research and Restricted Funds | 68423247 | |||
| Total Current Funds Revenues | $ 1078206806 | |||
| Expenditures | ||||
| Personal Services | 389629832 | |||
| Fringe Benefits | 221135897 | |||
| Correctional Managed Health Care | 80426658 | |||
| DrugsMedical Supplies | 84704197 | |||
| Other Expenses | 216482470 | |||
| Debt ServiceProjects | 17401260 | |||
| Total Operating Funds | $ 1009780314 | |||
| Research and Restricted Expenditures | 68423247 | |||
| Total Operating Expenditures | $ 1078203561 | |||
| Net Gain | $ 3245 | |||
| Revenues ($M) | Expenditures ($M) | see notes below for summary of changes | |||||||||||||||||
| Appropriation | 1177 | Personal Services | 3912 | Appropriation | 1177 | Personal Services | 3912 | ||||||||||||
| Fringe Benefits amp Adjustments | 1057 | Fringe Benefits | 2322 | Fringe Benefits amp Adjustments | 1057 | Fringe Benefits | 2322 | ||||||||||||
| Total State Support | $ 2234 | Correctional Managed Health Care | 804 | Total State Support | $ 2234 | Correctional Managed Health Care | 804 | ||||||||||||
| Tuition | 200 | DrugsMedical Supplies | 852 | Tuition | 200 | DrugsMedical Supplies | 852 | ||||||||||||
| Fees | 44 | Other Expenses | 2147 | Fees | 44 | Other Expenses | 2147 | ||||||||||||
| Grants amp Contracts | 849 | Depreciation | 358 | Grants amp Contracts | 849 | Depreciation | 358 | ||||||||||||
| InternsResidents | 667 | Total Operating Expenditures | $ 10395 | InternsResidents | 667 | Total Operating Fund | 10395 | ||||||||||||
| Net Patient Revenue | 4827 | Net Patient Revenue | 4827 | ||||||||||||||||
| Correctional Managed Health Care | 804 | Correctional Managed Health Care | 804 | ||||||||||||||||
| Other Revenue | 586 | Other Revenue | 586 | ||||||||||||||||
| Total Operating Revenues | $ 10211 | Net Gain(Loss) | $ (184) | Total Operating Fund | $ 10211 | Net Gain(Loss) | (1838) | ||||||||||||
| Notes - Revisions to original budget presented June28th | |||||||||||||||||||
| Approp revised to approved budget - Oct 2017 and added back the wc - and reduced with lapses of 47M | |||||||||||||||||||
| inkind fringe updated using new approp and lapses- 816 rate used was 74 | |||||||||||||||||||
| split tuition and fees (per request of storrs) | |||||||||||||||||||
| Reduced Grants and contract - first qtr results $23M | |||||||||||||||||||
| workers comps claims of $7721978 moved to fringe exp (was netted out of approp in orig) | |||||||||||||||||||
| Net patient revenue increased by $30M (umg enhanced physician payments) and 1st quarter results $46M | |||||||||||||||||||
| Other revenue - first qtr results - Retail pharmacy | |||||||||||||||||||
| salary cost added 16M (SEBAC provisions longevity and clean up of furlough) | |||||||||||||||||||
| fb cost added $33M (half of Sebac reallocations) offset with addl inkind fringe | |||||||||||||||||||
| rounding issue $100k added to inkind fringe | |||||||||||||||||||
| Drugs and Med supplies $500K added - first quarter results | |||||||||||||||||||
| other expenses $500K added for eresources (maintenance and subscription fees) and first qtr results research decrease $23M |
| Revenues ($M) | Expenditures ($M) | see notes below for summary of changes | |||||||||||||||||
| Appropriation | 1177 | Personal Services | 3912 | Appropriation | 1177 | Personal Services | 3912 | ||||||||||||
| Fringe Benefits amp Adjustments | 1057 | Fringe Benefits | 2322 | Fringe Benefits amp Adjustments | 1057 | Fringe Benefits | 2322 | ||||||||||||
| Total State Support | $ 2234 | Correctional Managed Health Care | 804 | Total State Support | $ 2234 | Correctional Managed Health Care | 804 | ||||||||||||
| Tuition | 200 | DrugsMedical Supplies | 852 | Tuition | 200 | DrugsMedical Supplies | 852 | ||||||||||||
| Fees | 44 | Other Expenses | 2147 | Fees | 44 | Other Expenses | 2147 | ||||||||||||
| Grants amp Contracts | 849 | Debt ServiceProjects | 174 | Grants amp Contracts | 849 | Debt ServiceProjects | 174 | ||||||||||||
| InternsResidents | 667 | Total Operating Fund | $ 10211 | InternsResidents | 667 | Total Operating Fund | 10211 | ||||||||||||
| Net Patient Revenue | 4827 | Net Patient Revenue | 4827 | ||||||||||||||||
| Correctional Managed Health Care | 804 | Research and Restricted Expenditures | 684 | Correctional Managed Health Care | 804 | Research and Restricted Expenditures | 684 | ||||||||||||
| Other Revenue | 586 | Other Revenue | 586 | ||||||||||||||||
| Total Operating Fund | $ 10211 | Total Operating Expenditures | $ 10895 | Total Operating Fund | $ 10211 | Total Operating Expenditures | $ 10895 | ||||||||||||
| Research and Restricted Funds | 684 | Research and Restricted Funds | 684 | ||||||||||||||||
| Total Current Funds Revenues | $ 10895 | Net Gain(Loss) | $ (00) | Total Current Funds Revenues | $ 10895 | Net Gain(Loss) | 00 | ||||||||||||
| Research and Restricted Funds - detail | |||||||||||||||||||
| Use Allowance | 7000000 | per Julie | |||||||||||||||||
| State Bond Funds-EMR | 23700000 | State Bond funds EMR (41M less spent $173) | storrs funds for EMR $48M | ||||||||||||||||
| Storrs Funds - EMR | 35000000 | per storrs agreement | FY18 | 35000000 | |||||||||||||||
| Comprehensive Cancer Center | 1556995 | cash balance (orig amt 25M in FY13) | FY19 | 13000000 | |||||||||||||||
| Health Disparity | 1166252 | cash balance (orig amt 25M in FY13) | 48000000 | ||||||||||||||||
| 68423247 | |||||||||||||||||||
| Notes - Revisions to original budget presented June28th | |||||||||||||||||||
| Approp revised to approved budget - Oct 2017 and added back the wc - and reduced with lapses of 47M | |||||||||||||||||||
| inkind fringe updated using new approp and lapses- 816 rate used was 74 | |||||||||||||||||||
| split tuition and fees (per request of storrs) | |||||||||||||||||||
| Reduced Grants and contract - first qtr results $23M | |||||||||||||||||||
| workers comps claims of $7721978 moved to fringe exp (was netted out of approp in orig) | |||||||||||||||||||
| Net patient revenue increased by $30M (umg enhanced physician payments) and 1st quarter results $46M | |||||||||||||||||||
| Other revenue - first qtr results - Retail pharmacy | |||||||||||||||||||
| salary cost added 16M (SEBAC provisions longevity and clean up of furlough) | |||||||||||||||||||
| fb cost added $33M (half of Sebac reallocations) offset with addl inkind fringe | |||||||||||||||||||
| rounding issue $100k added to inkind fringe | |||||||||||||||||||
| Drugs and Med supplies $500K added - first quarter results | |||||||||||||||||||
| other expenses $500K added for eresources (maintenance and subscription fees) and first qtr results research decrease $23M |
| FY18 Budget Target | |||||||
| FY18 Bottom line - Preliminary Projection | $ (5940) | ||||||
| Financial interventions posted to budget | 1270 | ||||||
| FY18 Bottom line - Current | $ (4670) | ||||||
| Not Posted to Budget | |||||||
| SEBAC (Estimated Savings) | 1270 | ||||||
| UMG | |||||||
| Revenue increase (Adding an additional Patient per week would be approximately $13M) | 400 | need broad categories of these savings | |||||
| Expense reduction | 350 | Annes will provide summary | |||||
| JDH | |||||||
| Revenue increase | 400 | ||||||
| Expense reduction | 410 | ||||||
| FY18 Bottom line Target | $ (1840) | ||||||
| FY18 Preliminary Forecast and Assumptions | ||||
| Bottom line | ||||
| FY2017 Budget | $ (197) | |||
| Estimated additional clinical revenue (2 increase) | 90 | |||
| State Support reduction (Gov Rec compared to Allotment Amount - includes Block Grant In-kind Fringes Bioscience and Workers Compensation) | (118) | |||
| NICU Rental Income decrease (Per contract) | (10) | |||
| Research Grants | (19) | |||
| Fringe Benefit - retirement rates per comptrollers estimates (Net of in-kind fb) | (68) | |||
| Fringe Benefit - estimates of Insurance increases (Net of in-kind fb) | (40) | |||
| FY2018 Original Projection (without Health One) | $ (361) | |||
| Health One - revenue reduction | (113) | |||
| Health One - training and back fill | (120) | |||
| Total FY18 Preliminary Forecast | $ (594) | |||
| FY17 Forecast vs FY17 Budget | ||||||||||
| FY17 Budget | FY17 Forecast | Variance | ||||||||
| Revenues | ||||||||||
| Net Patient Care | $ 4715 | $ 4567 | $ (148) | |||||||
| Other Revenue | 2241 | 2243 | 02 | |||||||
| Correctional Managed Health Care | 833 | 824 | (09) | |||||||
| State Support | 1236 | 1218 | (18) | |||||||
| In-kind Fringe Benefits and Differential | 976 | 1007 | 31 | |||||||
| Total Revenue | $ 10001 | $ 9860 | $ (141) | |||||||
| Expenses | ||||||||||
| Salary | $ 3857 | $ 3843 | $ (14) | |||||||
| Fringe Benefits | 2066 | 2037 | (29) | |||||||
| Correctional Managed Health Care | 833 | 824 | (09) | |||||||
| Other Expenses | 3404 | 3352 | (52) | |||||||
| Total Expenses | $ 10160 | $ 10056 | $ (104) | |||||||
| Excess(Deficiency) of Revenues over Expenses | $ (159) | $ (197) | $ (38) | |||||||
| notes for Jeff | ||||||||||
| summary of forecast changes | (21554857) | |||||||||
| Third Party updated thru April YTD | (3000000) | |||||||||
| IT review | 183120 | |||||||||
| Core Reconciliation | 1800000 | |||||||||
| Interns amp Res | 823000 | |||||||||
| Hemophilia clinic340B pharmacy | 1360329 | |||||||||
| Library (moved to capital) | 108000 | |||||||||
| Facilities Mgmt | 223012 | |||||||||
| Creative Child Care | 23000 | |||||||||
| Fire Dept | 76780 | |||||||||
| ResearchAcademic review of spend | 1258000 | |||||||||
| 2855241 | ||||||||||
| (18699616) | ||||||||||
| FY18 Budget Assumptions | ||
| The following presentation assumes | ||
| Tuition and Fees - overall 45 rate increase | ||
| Research revenue - slight increase offset by additional expenses | ||
| Salaries - no increase related to bargaining units due to no settled contracts as of budget preparation | ||
| Fringes - State Comptrollers estimated state retirement rates used | ||
| Appropriation - Governors Recommended Revised budget as of May 15 2017 | ||
| FY 2013 | FY 2014 | FY 2015 | FY 2016 | FY 2017 Forecast | FY2018 Budget | ||||||||
| UCH Profit (Loss) | (7203277) | (15458141) | (2876454) | (12564848) | (19688715) | (59400000) | |||||||
| UCH Profit (Loss) | (72) | (155) | (29) | (126) | (197) | (594) | |||||||
| Orig Projection | Final Budget | ActualsForecast | ||||||||||||||||||||
| FY14 | (210) | (110) | (155) | |||||||||||||||||||
| FY15 | (259) | (125) | (29) | |||||||||||||||||||
| FY16 | (400) | (159) | (126) | |||||||||||||||||||
| FY17 | (481) | (159) | (197) | |||||||||||||||||||
| FY18 | (594) | (184) | ||||||||||||||||||||
| Note | ||||||||||||||||||||||
| Financial Improvement Project began in FY2014 - Total savings of $103M |


