68
BOBLME-2011-Ecology-11
BOBLME-2011-Ecology-11
The designations employed and the presentation of material in this publication do not imply the expression of any opinion whatsoever on the part of Food and Agriculture Organization of the United Nations concerning the legal and development status of any country, territory, city or area or of its authorities, or concerning the delimitation of its frontiers or boundaries. The BOBLME Project encourages the use of this report for study, research, news reporting, criticism or review. Selected passages, tables or diagrams may be reproduced for such purposes provided acknowledgment of the source is included. Major extracts or the entire document may not be reproduced by any process without the written permission of the BOBLME Project Regional Coordinator. BOBLME contract: PSA-GCP 212/10/2010 For bibliographic purposes, please reference this publication as: BOBLME (2011) Country Report on Pollution - Malaysia BOBLME-2011-Ecology-11
BOBLME: Bay of Bengal Large Marine Ecosystem
Malaysia
National Report on
Coastal Pollution Loading and Water Quality Criteria
Zelina Z. Ibrahim, Mohd. Pauzi Zakaria, Norhayati Mohd. Tahir*, Sutarji Kasmin, Abd. Muhaimin
Amiruddin, Norliza Ismail and Khairiyah Abd. Rahim.
Faculty of Environmental Studies, Universiti Putra Malaysia
*Faculty of Science and Technology, Universiti Malaysia Terengganu
Country Report on Pollution - Malaysia
2
Contents
1. The Bay of Bengal Coast of Peninsular Malaysia ........................................................................... 8 1.1. Bio-geographical features ....................................................................................................... 8 1.2. Coastal activities ................................................................................................................... 11 1.3 Overview of Sources of Pollution .......................................................................................... 13
1.3.1 Land-based Sources ..................................................................................................... 13 1.3.2 Sea/Marine-based Sources ........................................................................................... 15 1.3.3 Priority Categories of Parameters ................................................................................. 16
2. International Instruments, Conventions, Protocols and Programmes........................................... 18 2.1 Environmental Agreements and Programmes ...................................................................... 18 2.2 Maritime Agreements and Programmes ............................................................................... 20
3. Governance ................................................................................................................................... 22 3.1 Policy, Legislation, Acts, Regulations and Orders ................................................................ 22 3.2 The Environmental Quality Act, 1974 ................................................................................... 23 3.3 Institutional Mechanisms ....................................................................................................... 26 3.4 The Department of Environment ........................................................................................... 28
4. Existing Water Quality Standards ................................................................................................. 30 4.1 Effluent Discharge Standards ............................................................................................... 30 4.2 Ambient Water Quality Standards ......................................................................................... 31 4.3 Marine Water Quality Standards ........................................................................................... 31
5 The National Water, Coastal and Marine Monitoring Programme and Current Status ................. 36 5.1 Environmental Monitoring ..................................................................................................... 36 5.2 River Water Quality Monitoring ............................................................................................. 36 5.3 Coastal and Marine Water Quality Monitoring ...................................................................... 38 5.4 Oil Pollution .......................................................................................................................... 43 5.5 Heavy Metals and Persistent Organic Pollutants (POPs) ..................................................... 46 5.6 Harmful Algal Blooms ............................................................................................................ 52
6 Gaps and Challenges .................................................................................................................... 54 6.1 Governance Infrastructure ................................................................................................... 54 6.2 Knowledge and Human Resources Management ................................................................ 56 6.3 The Way Forward .................................................................................................................. 57
Country Report on Pollution - Malaysia
3
List of Figures
Figure 1.1: The Bay of Bengal Large Marine Ecosystem ....................................................................... 8
Figure 1.2: The Strait of Malacca ............................................................................................................ 9
Figure 1.3: States and River Catchments on the West Coast of Peninsular Malaysia. ........................ 10
Figure 1.4: Percentage of Land Use According to State in West Coast Region in 2001 ..................... 11
Figure 1.5: Ports in Peninsular Malaysia. ............................................................................................. 13
Figure 1.6: Vessels Traversing the Straits of Malacca and Singapore Reporting to Klang VTS. ......... 16
Figure 1.7: Observed Exceedence of Malaysian Interim Marine Water Quality Standards ................. 17
Figure 2.1: MEH Demonstration Project Survey Area 1 ....................................................................... 21
Figure 5.1: Peninsular Malaysia River Basins Water Quality Status, 2008 .......................................... 37
Figure 5.2: State Population on West Coast of Peninsular Malaysia, 2003-2007 ................................ 38
Figure 5.3: Percentage of Coastal Water Samples Exceeding Ambient Standards on West Coast of
Peninsular Malaysia, 2008 .................................................................................................................... 39
Figure 5.4: West Coast of Peninsular Malaysia Water Pollution Point Sources by Sector .................. 40
Figure 5.5: Malaysia: Distribution of Sewage Treatment Plants by State, 2008. .................................. 41
Figure 5.6: Distribution of Industrial Water Pollution Point Sources (Agro-based and Manufacturing
Industries) by State, 2008. .................................................................................................................... 41
Figure 5.7: Marine Water Quality Nearshore and Offshore. ................................................................. 42
Figure 5.8: Oil Spill Incidents in Malaysian Seas. ................................................................................. 43
Figure 6.1: Malaysian Research and Development Expenditure .......................................................... 57
Country Report on Pollution - Malaysia
4
List of Tables
Table 1.1: Location of Major Industrial Lands on West Coast Peninsular Malaysia ............................. 12
Table 1.2: Oil Refineries on West Coast Peninsular Malaysia ............................................................. 12
Table 2.1: Progress in GPA Activities ................................................................................................... 19
Table 2.2: International Maritime Conventions Adopted by Malaysia. .................................................. 20
Table 3.1: Other Legislation Relevant for Marine Water Pollution Control ........................................... 22
Table 3.2: Environmental Quality Act 1974 and Amendments ............................................................. 24
Table 3.3: Regulations under EQA 1974 Relevant for Water Pollution ................................................ 24
Table 3.4: Orders under EQA 1974 Relevant for Water Pollution ........................................................ 26
Table 3.5: Agencies Relevant to Water Resources Management ........................................................ 27
Table 3.6: DOE EIA Report Guidelines Relevant to Coastal and Marine Projects ............................... 29
Table 4.1: Environmental Quality (Sewage and Industrial Effluents) Regulations, 1979. .................... 30
Table 4.2: National Water Quality Standards for Malaysia ................................................................... 32
Table 4.3. DOE Water Quality Classification and Class Standards for Malaysia ................................. 34
Table 4.4: Malaysia Interim Marine Water Quality Criteria and Standards ........................................... 35
Table 5.1: Oil Spill Incidents in Malaysian Waters, 1975–1997 ............................................................ 45
Table 5.2: Concentrations of Cd, Cu, Pb, and Zn in Sediments and Perna viridis ............................... 47
Table 5.3: Concentration of Heavy Metals in Cultured Fishes, Langat River Estuary .......................... 47
Table 5.4: Hydrocarbons in Malaysian waters ...................................................................................... 49
Country Report on Pollution - Malaysia
5
List of Abbreviations
AMWQC ASEAN Marine Water Quality Criteria
ASEAN Association of Southeast Asian Nations
BOD Biochemical oxygen demand
COBSEA Coordinating Body on the Seas of East Asia
COD Chemical oxygen demand
DANCED Danish Cooperation for Environment and Development
DDT Dichlorodiphenyltrichloroethane
DID Department of Irrigation and Drainage
DO Dissolved oxygen
DOE Department of Environment
EIA Environmental Impact Assessment
EPU Economic Planning Unit
EQA Environmental Quality Act
FAO Food and Agriculture Organization
FCZ Free Commercial Zones
FIZ Free Industrial Zones
GEF Global Environment Facility
GPA Global Programme of Action for the Protection of the Marine Environment from Land-
based Activities
HABs Harmful Algal Blooms
HCH Hexachlorocyclohexane
ICZM Integrated Coastal Zone Management
ICS International Chamber of Shipping
IHO International Hydrographic Organization
IST Individual Septic Tanks
IMO International Maritime Organisation
IMWQS Interim Marine Water Quality Standards
INTERTANKO International Association of Independent Tanker Owners
IWK Indah Water Konsortium Sdn Bhd
Country Report on Pollution - Malaysia
6
JPBD Jabatan Perancangan Bandar dan Desa (Town and Country Planning Department)
MARPOL International Convention for the Prevention of Pollution from Ships
MEH Marine Electronic Highway
MEHDP MEH Demonstration Programme
MIDA Malaysian Investment Development Authority
MMEA Malaysian Maritime Enforcement Agency
MyNODC Malaysian National Oceanography Data Centre
NH3-N Ammoniacal nitrogen
NH4 Ammonium
NIP National Implementation Plans
NPP National Physical Plan
NO2 Nitrite
NO3 Nitrate
NSC National Steering Committee
OCPs Organochlorine pesticides
PAHs Polycyclic aromatic hydrocarbons
PCBs Polychlorinated biphenyls
PEMSEA Partnerships in Environmental Management for the Seas of East Asia
PO4 Phosphorus
POPs Persistent organic pollutants
ppb part per billion
PSP Paralytic shellfish poisoning
SiO4 Silicate
SS Suspended solids
Sv Sverdrup, unit of measure of volume transport equivalent to 0.001 km3/s
STP Sewage Treatment Plant
t tonne
TSS Traffic Separation Scheme
UNDP United Nations Development Programme
UNEP United Nations Environmental Programme
Country Report on Pollution - Malaysia
7
UNCED United Nations Conference on Environment and Development
UNESCO United Nations Education, Scientific and Culture Organisation
WPKL Wilayah Persekutuan Kuala Lumpur (Kuala Lumpur Federal Territory)
WQI Water Quality Index
Country Report on Pollution - Malaysia
8
1. The Bay of Bengal Coast of Peninsular Malaysia
1.1. Bio-geographical features
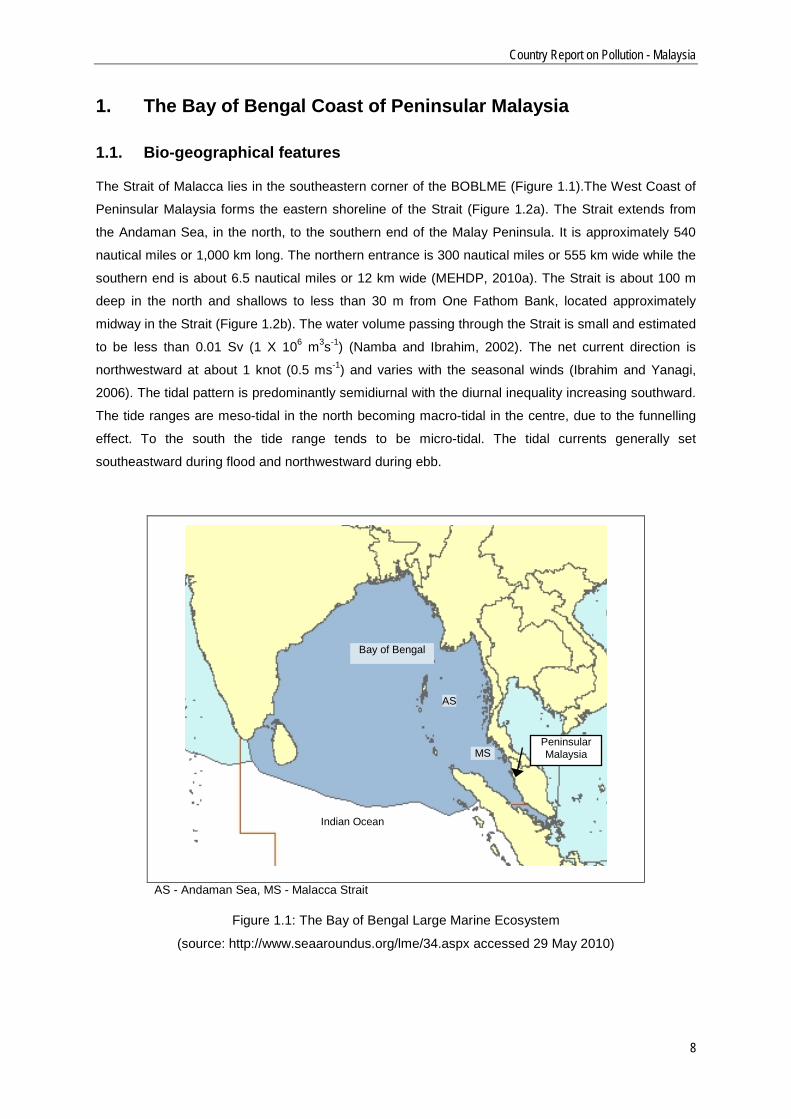
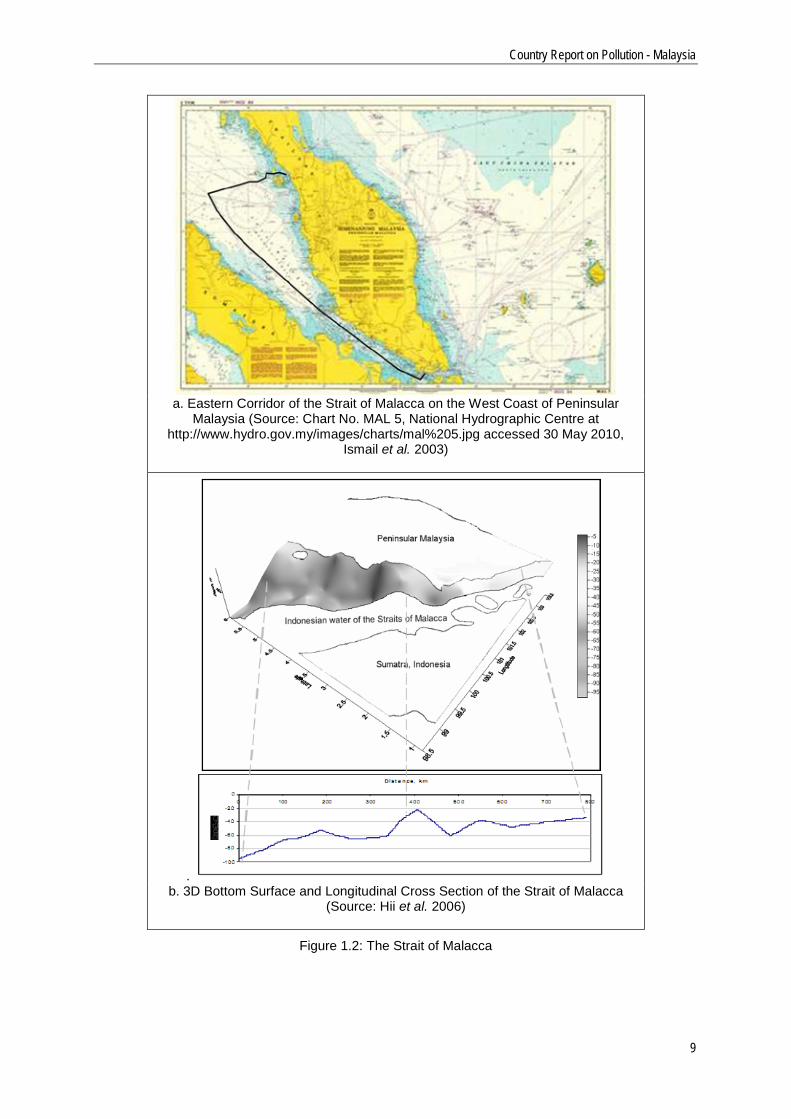
The Strait of Malacca lies in the southeastern corner of the BOBLME (Figure 1.1).The West Coast of
Peninsular Malaysia forms the eastern shoreline of the Strait (Figure 1.2a). The Strait extends from
the Andaman Sea, in the north, to the southern end of the Malay Peninsula. It is approximately 540
nautical miles or 1,000 km long. The northern entrance is 300 nautical miles or 555 km wide while the
southern end is about 6.5 nautical miles or 12 km wide (MEHDP, 2010a). The Strait is about 100 m
deep in the north and shallows to less than 30 m from One Fathom Bank, located approximately
midway in the Strait (Figure 1.2b). The water volume passing through the Strait is small and estimated
to be less than 0.01 Sv (1 X 10⁶ m3s-1) (Namba and Ibrahim, 2002). The net current direction is
northwestward at about 1 knot (0.5 ms-1) and varies with the seasonal winds (Ibrahim and Yanagi,
2006). The tidal pattern is predominantly semidiurnal with the diurnal inequality increasing southward.
The tide ranges are meso-tidal in the north becoming macro-tidal in the centre, due to the funnelling
effect. To the south the tide range tends to be micro-tidal. The tidal currents generally set
southeastward during flood and northwestward during ebb.
AS - Andaman Sea, MS - Malacca Strait
Figure 1.1: The Bay of Bengal Large Marine Ecosystem
(source: http://www.seaaroundus.org/lme/34.aspx accessed 29 May 2010)
Peninsular Malaysia
Indian Ocean
Bay of Bengal
AS
MS
Country Report on Pollution - Malaysia
9
a. Eastern Corridor of the Strait of Malacca on the West Coast of Peninsular
Malaysia (Source: Chart No. MAL 5, National Hydrographic Centre at http://www.hydro.gov.my/images/charts/mal%205.jpg accessed 30 May 2010,
Ismail et al. 2003)
. b. 3D Bottom Surface and Longitudinal Cross Section of the Strait of Malacca
(Source: Hii et al. 2006)
Figure 1.2: The Strait of Malacca
Country Report on Pollution - Malaysia
10
The area experiences uniform temperatures (22-33 oC), high humidity (70-90%) and abundant rainfall
(2400 mm) (Malaysian Meteorological Department, 2010). Four main seasons may be distinguished:
the southwest monsoon, the northeast monsoon and two inter-monsoon seasons. Maximum rainfalls
occur in October-November and April to May, during the early part of the northeast monsoon and
southwest monsoon, respectively.
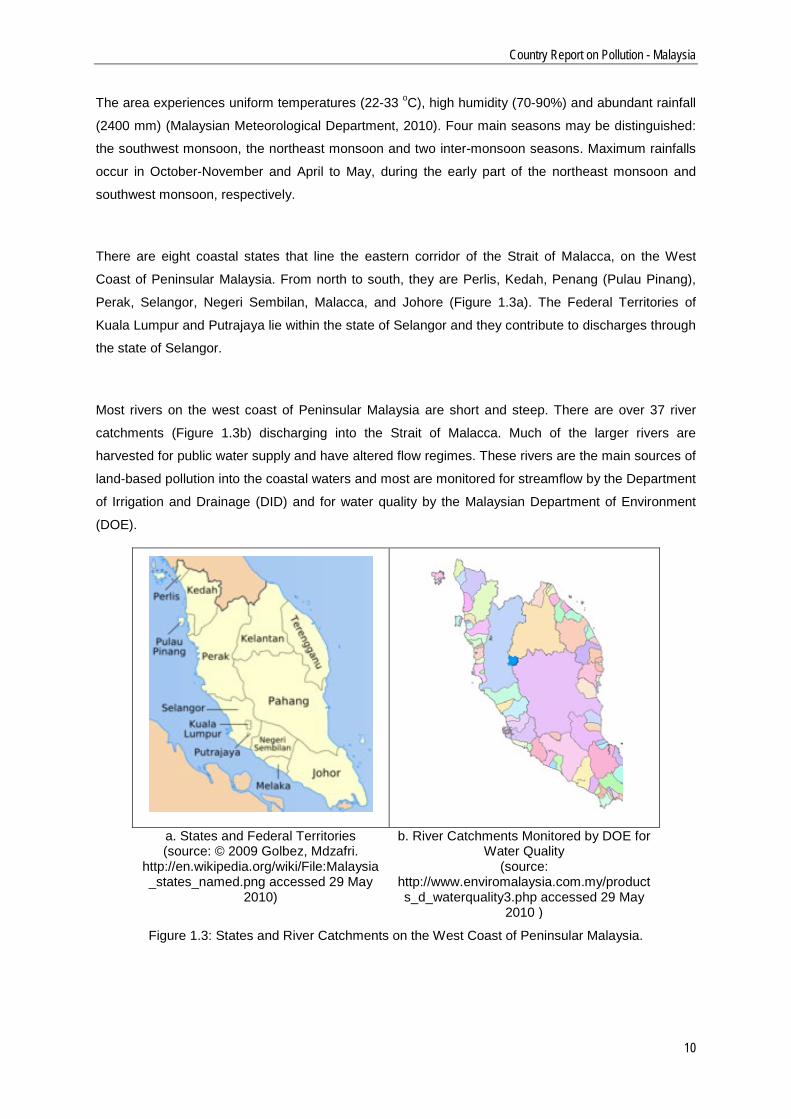
There are eight coastal states that line the eastern corridor of the Strait of Malacca, on the West
Coast of Peninsular Malaysia. From north to south, they are Perlis, Kedah, Penang (Pulau Pinang),
Perak, Selangor, Negeri Sembilan, Malacca, and Johore (Figure 1.3a). The Federal Territories of
Kuala Lumpur and Putrajaya lie within the state of Selangor and they contribute to discharges through
the state of Selangor.
Most rivers on the west coast of Peninsular Malaysia are short and steep. There are over 37 river
catchments (Figure 1.3b) discharging into the Strait of Malacca. Much of the larger rivers are
harvested for public water supply and have altered flow regimes. These rivers are the main sources of
land-based pollution into the coastal waters and most are monitored for streamflow by the Department
of Irrigation and Drainage (DID) and for water quality by the Malaysian Department of Environment
(DOE).
a. States and Federal Territories (source: © 2009 Golbez, Mdzafri.
http://en.wikipedia.org/wiki/File:Malaysia_states_named.png accessed 29 May
2010)
b. River Catchments Monitored by DOE for Water Quality
(source: http://www.enviromalaysia.com.my/products_d_waterquality3.php accessed 29 May
2010 )
Figure 1.3: States and River Catchments on the West Coast of Peninsular Malaysia.
Country Report on Pollution - Malaysia
11
The coastal landscape varies from alluvial coastal plains to hills to rocky outcrops. The natural coastal
land cover is varied, with mudflats, sandy beaches, mangroves, seagrass meadows and algal beds,
coral reefs, limestone and granite cliffs, estuaries, fine sand tidal flats and small island ecosystems.
Ismail et al. (2003) have summarised the rich biodiversity of habitats found on the West Coast.
Studies on the marine ecosystems have concentrated on mangroves (Nixon et al., 1984; Ong et al.,
1991; Othman, 1994; Chong, 2006), coral reefs (Tan and Yusoff, 2002; Toda et al. 2007) and
seagrasses (Bujang et al., 2006). The hinterland land cover is mainly paddy, plantation agriculture,
secondary jungle, and virgin rainforest. The current circulation in the Strait and surrounding waters
has been described by Wrytki (1961).
1.2. Coastal activities
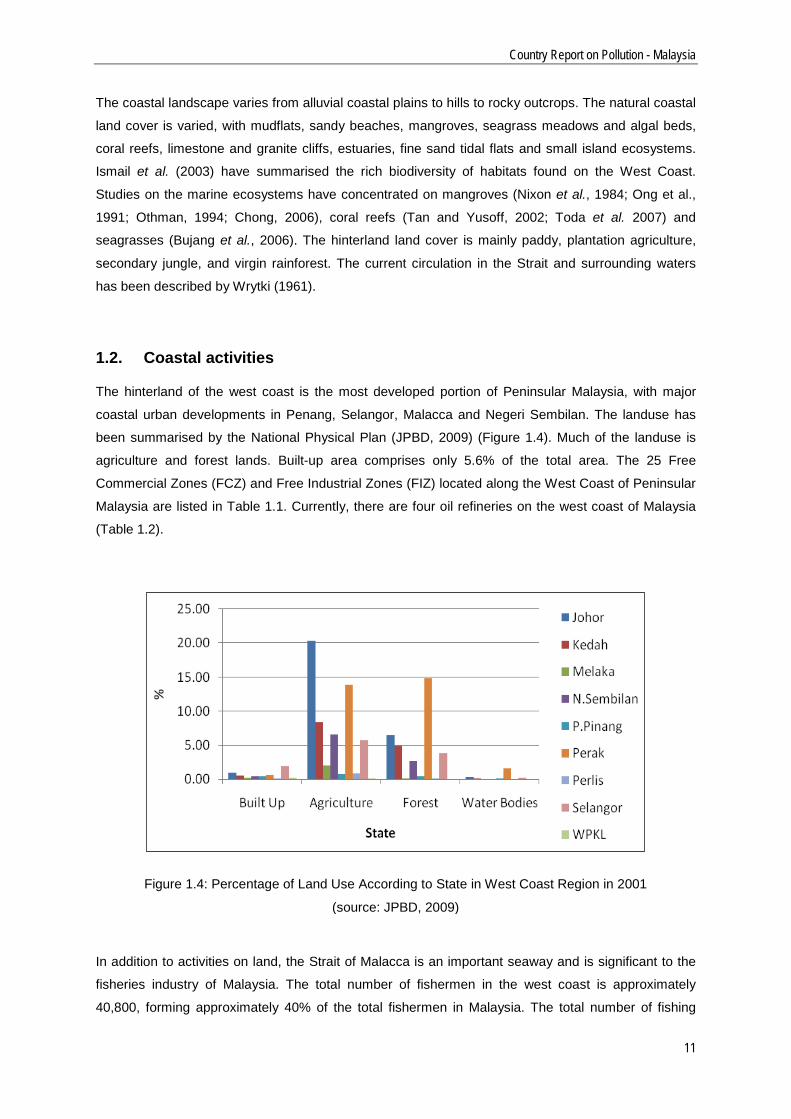
The hinterland of the west coast is the most developed portion of Peninsular Malaysia, with major
coastal urban developments in Penang, Selangor, Malacca and Negeri Sembilan. The landuse has
been summarised by the National Physical Plan (JPBD, 2009) (Figure 1.4). Much of the landuse is
agriculture and forest lands. Built-up area comprises only 5.6% of the total area. The 25 Free
Commercial Zones (FCZ) and Free Industrial Zones (FIZ) located along the West Coast of Peninsular
Malaysia are listed in Table 1.1. Currently, there are four oil refineries on the west coast of Malaysia
(Table 1.2).
Figure 1.4: Percentage of Land Use According to State in West Coast Region in 2001
(source: JPBD, 2009)
In addition to activities on land, the Strait of Malacca is an important seaway and is significant to the
fisheries industry of Malaysia. The total number of fishermen in the west coast is approximately
40,800, forming approximately 40% of the total fishermen in Malaysia. The total number of fishing
Country Report on Pollution - Malaysia
12
vessel amounts to 17,932 fishing vessels, which is higher than any other part of Malaysia
(Department of Fisheries Malaysia, 2010).
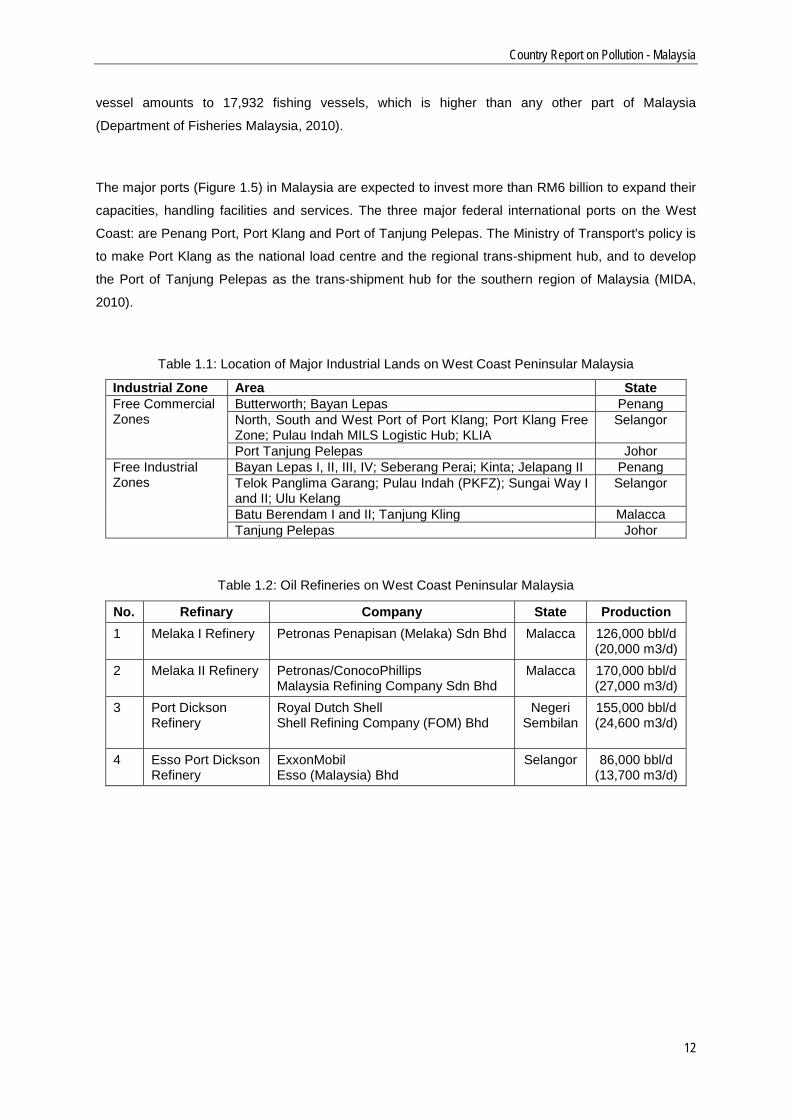
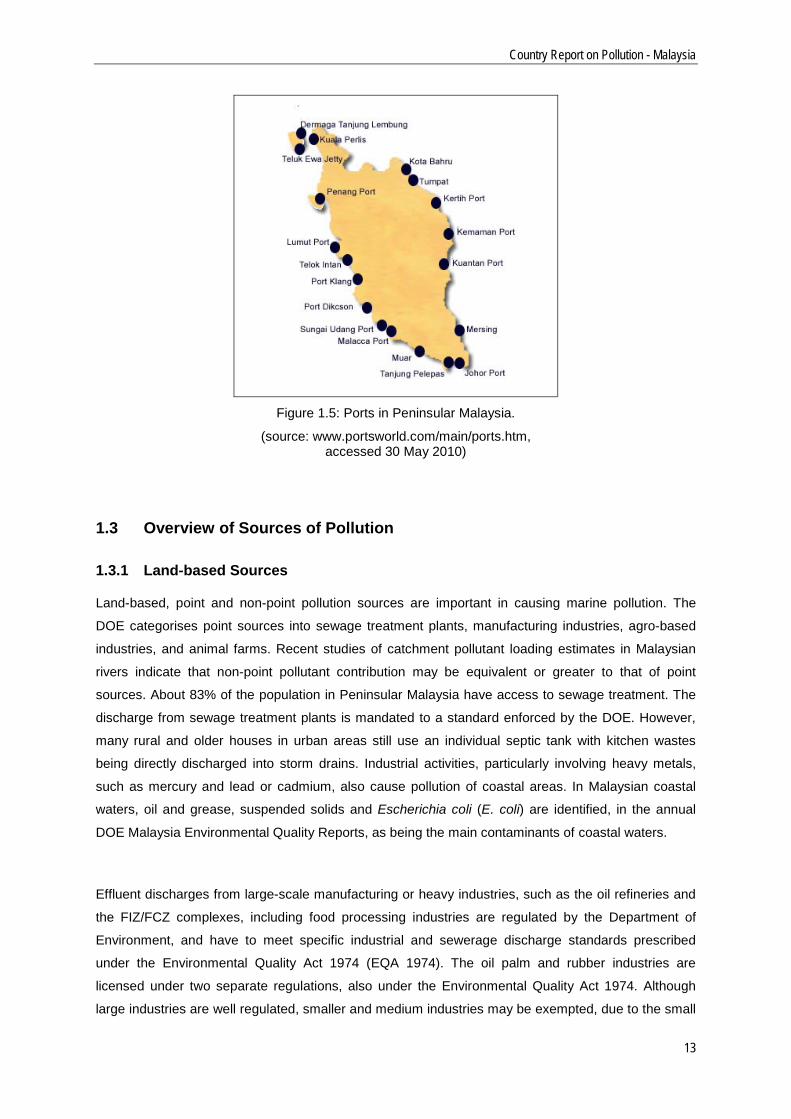
The major ports (Figure 1.5) in Malaysia are expected to invest more than RM6 billion to expand their
capacities, handling facilities and services. The three major federal international ports on the West
Coast: are Penang Port, Port Klang and Port of Tanjung Pelepas. The Ministry of Transport's policy is
to make Port Klang as the national load centre and the regional trans-shipment hub, and to develop
the Port of Tanjung Pelepas as the trans-shipment hub for the southern region of Malaysia (MIDA,
2010).
Table 1.1: Location of Major Industrial Lands on West Coast Peninsular Malaysia
Industrial Zone Area State Free Commercial Zones
Butterworth; Bayan Lepas Penang North, South and West Port of Port Klang; Port Klang Free Zone; Pulau Indah MILS Logistic Hub; KLIA
Selangor
Port Tanjung Pelepas Johor Free Industrial Zones
Bayan Lepas I, II, III, IV; Seberang Perai; Kinta; Jelapang II Penang Telok Panglima Garang; Pulau Indah (PKFZ); Sungai Way I and II; Ulu Kelang
Selangor
Batu Berendam I and II; Tanjung Kling Malacca Tanjung Pelepas Johor
Table 1.2: Oil Refineries on West Coast Peninsular Malaysia
No. Refinary Company State Production 1 Melaka I Refinery Petronas Penapisan (Melaka) Sdn Bhd Malacca 126,000 bbl/d
(20,000 m3/d) 2 Melaka II Refinery Petronas/ConocoPhillips
Malaysia Refining Company Sdn Bhd Malacca 170,000 bbl/d
(27,000 m3/d) 3 Port Dickson
Refinery Royal Dutch Shell Shell Refining Company (FOM) Bhd
Negeri Sembilan
155,000 bbl/d (24,600 m3/d)
4 Esso Port Dickson
Refinery ExxonMobil Esso (Malaysia) Bhd
Selangor 86,000 bbl/d (13,700 m3/d)
Country Report on Pollution - Malaysia
13
Figure 1.5: Ports in Peninsular Malaysia.
(source: www.portsworld.com/main/ports.htm, accessed 30 May 2010)
1.3 Overview of Sources of Pollution
1.3.1 Land-based Sources
Land-based, point and non-point pollution sources are important in causing marine pollution. The
DOE categorises point sources into sewage treatment plants, manufacturing industries, agro-based
industries, and animal farms. Recent studies of catchment pollutant loading estimates in Malaysian
rivers indicate that non-point pollutant contribution may be equivalent or greater to that of point
sources. About 83% of the population in Peninsular Malaysia have access to sewage treatment. The
discharge from sewage treatment plants is mandated to a standard enforced by the DOE. However,
many rural and older houses in urban areas still use an individual septic tank with kitchen wastes
being directly discharged into storm drains. Industrial activities, particularly involving heavy metals,
such as mercury and lead or cadmium, also cause pollution of coastal areas. In Malaysian coastal
waters, oil and grease, suspended solids and Escherichia coli (E. coli) are identified, in the annual
DOE Malaysia Environmental Quality Reports, as being the main contaminants of coastal waters.
Effluent discharges from large-scale manufacturing or heavy industries, such as the oil refineries and
the FIZ/FCZ complexes, including food processing industries are regulated by the Department of
Environment, and have to meet specific industrial and sewerage discharge standards prescribed
under the Environmental Quality Act 1974 (EQA 1974). The oil palm and rubber industries are
licensed under two separate regulations, also under the Environmental Quality Act 1974. Although
large industries are well regulated, smaller and medium industries may be exempted, due to the small
Country Report on Pollution - Malaysia
14
discharge volume for example, or given temporary contravention licenses. In addition, many agro-
based and land development activities are not classified as an "industrial plant" and are not under the
purview of the Department of Environment. Such activities can result in pollution of waterways.
Some examples of the main land-based polluting activities sources have been identified by Dato
Ahmad Fuad Embi, former Deputy Director-General Drainage and Irrigation Department (pers comm.
Dato Ahmad Fuad Embi, former Deputy Director-General Drainage and Irrigation Department, 31 May
2010), based on his knowledge of numerous studies and observations, as:
· Earth Works - Inadequate and incompetent land management practices during land
clearance, earthworks, during construction or development activities, result in substantial
surface erosion and suspended sediment pollution during high-intensity rain events;
· Wet Markets - In almost all cases, the biggest single contributor of solid waste and
biochemical oxygen demand (BOD) to urban drains and rivers (e.g., 70% in Sg Pinang in
Penang state). Almost all have waste water without treatment facilities;
· Abattoirs/Slaughterhouses - Also a big contributor of BOD, from blood and animal
entrails;
· Chicken Processing Stalls - Usually conveniently situated next to main drains or rivers, to
enable flushing of feathers and chicken remains directly to the waterways. This is a big
source of BOD;
· Landfills near Rivers - Usually the biggest source of solid wastes when situated on the
banks of the river concerned. High flows constantly erode the wastes from the site and
the toxic leachate seeps out continuously;
· Squatters on River Reserves - Big sources of solid waste, untreated sewage, together
with pest infestation, to the rivers concerned;
· Shared (‘Kongsi’) accommodation for workers at construction sites - These are big
sources of solid waste, sewage, etc., as they are not served by any public services or
facilities;
· Plastic Bags - Almost all urban rivers have beds heavily lined with plastic bags. Plastic
bags are a big source of pollution everywhere, especially at night markets locations;
· Individual Septic Tanks in old housing areas - Old housing areas use septic tank sewage
systems which, in most cases, are never or rarely desludged. These are sources of very
high BOD concentrations discharged to the drains in such areas;
· Old Sewage Treatment Plants (STPs) not under the national sewerage system
management - About 50% of existing STPs are not under the national sewerage services.
These are mostly run by private contractors commissioned by the Local Authorities. Most
are old ‘end-of-life’ facilities, and release a lot of effluent to drains and rivers;
Country Report on Pollution - Malaysia
15
· Restaurants and food stalls - Almost all restaurants, food shops, in urban areas release
substantial amounts of waste food and fats which end up rotting in the drains in urban
areas, making them stink and creating health hazards by breeding disease vectors
(mosquitoes, cockroaches, rats);
· Sand Mines in and upsteam of rivers - Sand mining in upper catchment hills cause severe
degradation of pristine headwaters, resulting in heavy sedimentation in the river channels;
· Pig Farming Areas - Present Pig Farming areas are all badly regulated, passing out
concentrated effluents to rivers, leaving them stinking and dead from the sludge lining up
the river banks;
· Aquaculture in tidal flats - Large scale clearing of mangrove areas is a typical result of
aquaculture activities, especially in the upper Perak state area. The sludge from prawn
farms are toxic and have contaminated many estuaries; and
· Logging of Permanent Forest Reserves - The threatened logging of the Ulu Muda
permanent forest reserves by the Kedah State Government can have severe
consequences to the catchment, resulting in heavy sedimentation, degradation of water
quality, depletion of aquatic and fish life, and would have a permanent effect on the water
supply to Sg Muda, especially in the dry season.
These smaller industries and activities are often under the jurisdiction of the local district or town
authorities, or even state authorities, who often have insufficient manpower to evaluate and enforce
state and local by-laws, when available.
1.3.2 Sea/Marine-based Sources
Pollution from land-based activities eventually reach the sea. Sea pollution is generated by land,
atmospheric and sea sources. Most of the sea-based pollution is due to oil or ballast water discharged
from ships (either intentionally or accidentally due to collision or grounding). Pollution from sea-based
sources are mainly oil-based although other waste trash may also come from ships. Other sources
include shipping traffic, port operations and off-shore oil and gas exploration and production rigs. Due
to the high traffic volume in the Strait, it is difficult to track ship movements, monitor activities and
enforce compliance with international rules. As a result ships may take advantage of this to illegally
dump wastes during operational activities. This contributes to marine pollution problems in the Strait.
The main component in crude oil, polycyclic aromatic hydrocarbons (PAHs), is toxic to marine life and
very difficult to clean up. It could remain for years in the sediment and marine environments. Marine
species that are constantly exposed to PAHs can exhibit physiological problems and are susceptible
to diseases.
Country Report on Pollution - Malaysia
16
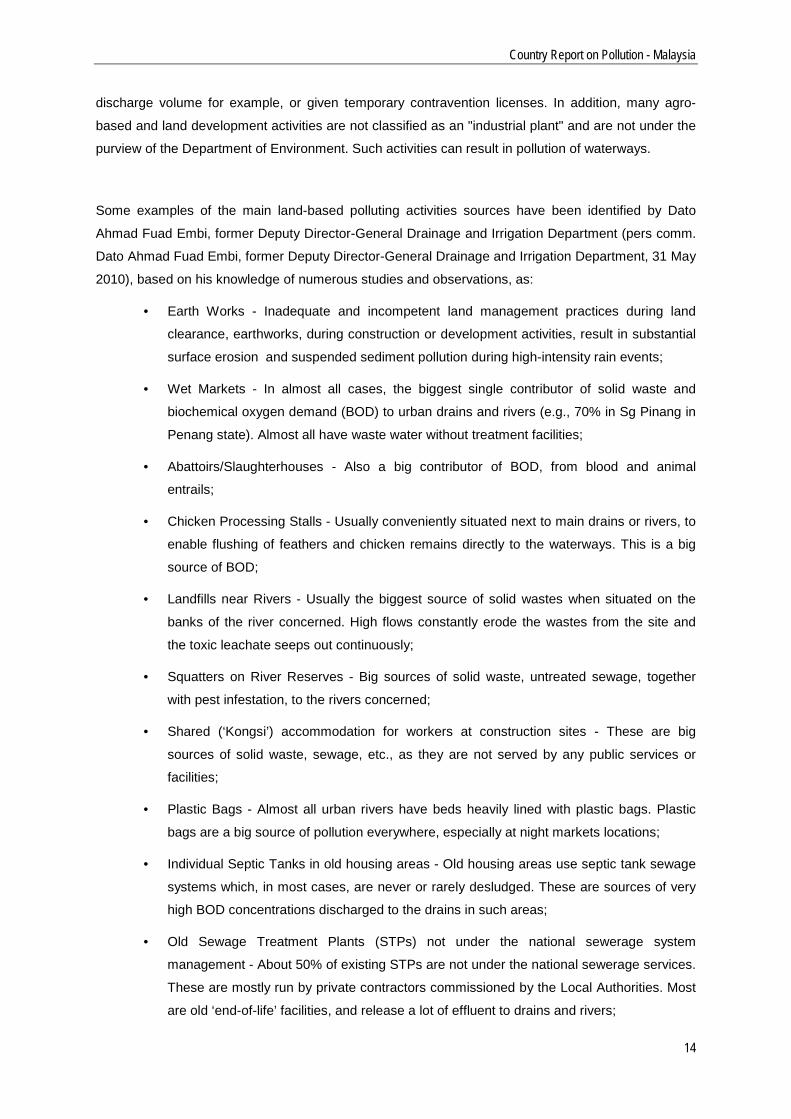
In an effort to reduce ship collisions and the resulting discharge of oil, the International Maritime
Organisation (IMO) has adopted the Mandatory Ship Reporting System in the Straits of Malacca and
Singapore, known as "STRAITREP", as proposed by Indonesia, Malaysia and Singapore. Based on
the record of reporting vessels the number of ships passing through the Strait is increasing at
approximately 7.5% per year over the last few years (Figure 1.6). About 54% of transiting vessels in
the Straits are general cargo vessels and container ships, while about 35% are crude oil and
petroleum products carriers. All these vessels are potential sources of pollution. The numbers
recorded by the STRAITREP is only that from reporting vessels. This may seriously underestimate the
total vessel traffic, as Kamaruzaman (1998) estimated a number of some 600 vessels daily, including
fishing vessels, traditional small crafts, pleasure crafts. This gives a number of 213,600 vessels over a
period of one year for 1998, which is more than five times the number of reporting vessels recorded in
1999.
Note: bars indicate number of vessels; line indicates % increase in reporting
Figure 1.6: Vessels Traversing the Straits of Malacca and Singapore Reporting to Klang VTS.
(Source: Malaysian Marine Department, http://www.marine.gov.my/ accessed 29 May 2010; MEHDP, 2010c)
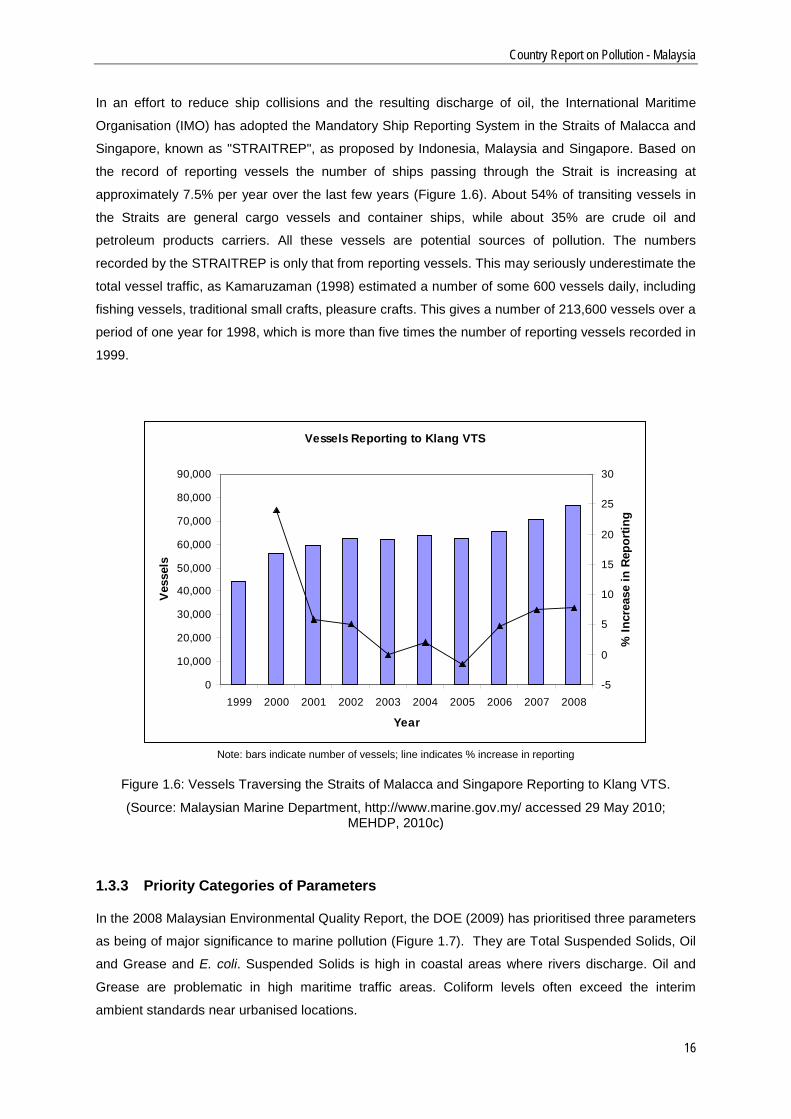
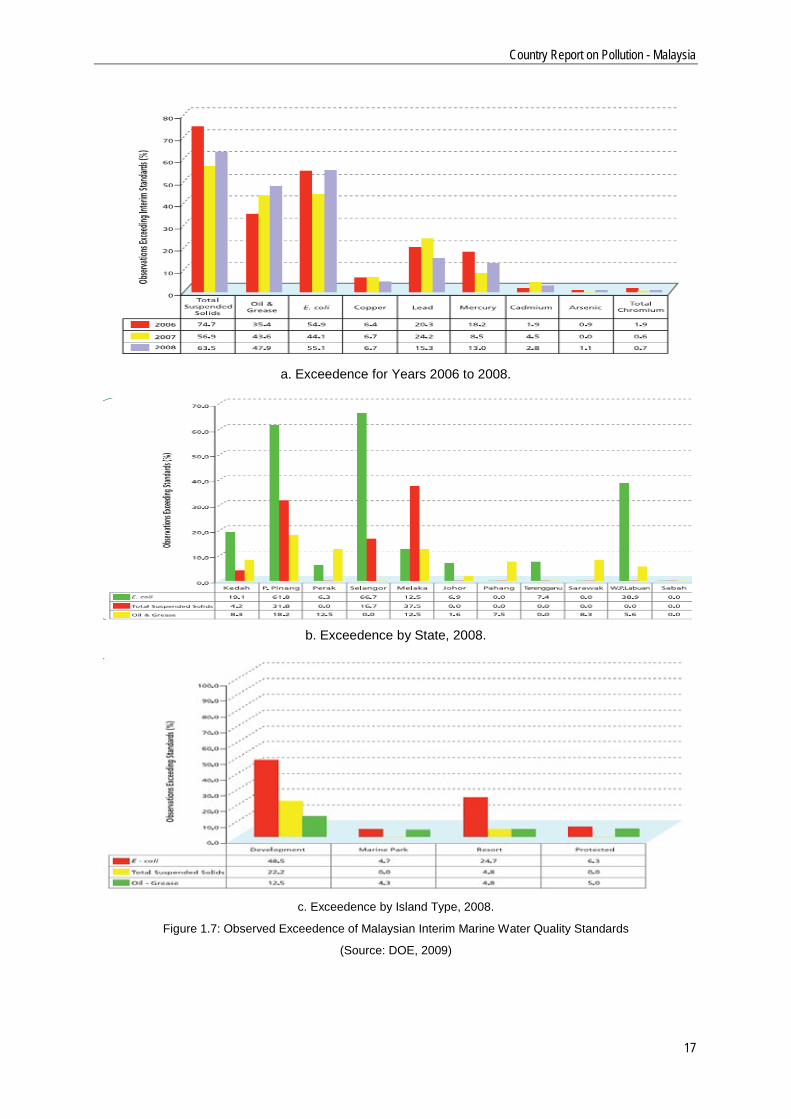
1.3.3 Priority Categories of Parameters
In the 2008 Malaysian Environmental Quality Report, the DOE (2009) has prioritised three parameters
as being of major significance to marine pollution (Figure 1.7). They are Total Suspended Solids, Oil
and Grease and E. coli. Suspended Solids is high in coastal areas where rivers discharge. Oil and
Grease are problematic in high maritime traffic areas. Coliform levels often exceed the interim
ambient standards near urbanised locations.
Vessels Reporting to Klang VTS
0
10,000
20,000
30,000
40,000
50,000
60,000
70,000
80,000
90,000
1999 2000 2001 2002 2003 2004 2005 2006 2007 2008
Year
Vess
els
-5
0
5
10
15
20
25
30
% In
crea
se in
Rep
ortin
g
Country Report on Pollution - Malaysia
17
a. Exceedence for Years 2006 to 2008.
b. Exceedence by State, 2008.
c. Exceedence by Island Type, 2008.
Figure 1.7: Observed Exceedence of Malaysian Interim Marine Water Quality Standards
(Source: DOE, 2009)
Country Report on Pollution - Malaysia
18
2. International Instruments, Conventions, Protocols and Programmes
2.1 Environmental Agreements and Programmes
Malaysia participates actively in the regional and international fora on environment and has good
working relationships with a number of international organizations, including the United Nations
Environmental Programme (UNEP), United Nations Conference on Environment and Development
(UNCED), Food and Agriculture Organization (FAO), Coordinating Body on the Seas of East Asia
(COBSEA), UNESCO, GEF/UNDP/IMO, and PEMSEA. Malaysia is a party to the following
international environmental agreements relevant for marine pollution: Convention on Biological
Diversity; United Nations Framework Convention on Climate Change; Hazardous Wastes; United
Nations Convention on the Law of the Sea; Marine Life Conservation; Ozone Layer Protection; Ship
Pollution; and Wetlands.
Most of these Multilateral Environmental Agreements are managed by the Ministry of Natural
Resources and Environment, through the DOE. For example, the DOE regulates toxic and hazardous
wastes and ozone-depleting substances in accordance with the Basel Convention on the Control of
Transboundary Movement of Hazardous Wastes and Their Disposal. For the Montreal Protocol, a
National Steering Committee was established under the DOE which serves also as the national focal
point. Trade aspects of toxic and hazardous wastes are controlled under the Customs Act, 1967, and
enforced jointly by the Royal Customs and Excise Department and the DOE. For chemicals in
general, the DOE plays the role of the Designated National Authority for industrial chemicals other
than pesticides. Pesticides are controlled by the Pesticides Board, Ministry of Agriculture and Agro-
based Industries. The DOE is designated as the Malaysian National Correspondent for the
International Register of Potentially Toxic Chemicals, the International Programme on Chemical
Safety, the implementation of the London Guidelines for the Exchange of Information on Chemicals in
International Trade (Amended), 1989, the operation of the information exchange service and the prior
informed consent procedure, and other international chemical programmes. Marine life agreements
involve the Department of Fisheries, Ministry of Agriculture and Agro-based Industries. Ship pollution
is managed by both the DOE and the Marine Department Peninsular Malaysia, Ministry of Transport.
Implementation of Agenda 21 is monitored by an Inter-Agency Planning Group (IAPG) under the
Prime Minister's Office. In line with its commitment to Agenda 21, Malaysia signed the United Nations
Framework Convention on Climate Change (UNFCCC), 1993; Convention on Biological Diversity
1992; Basel Convention on the Transboundary Movement of Toxic and Hazardous Wastes and Their
Disposal; the Ramsar Convention on Wetlands; and the Convention to Combat Desertification. In
2000 COBSEA endorsed the Regional Programme of Action for the Protection of the Marine
Country Report on Pollution - Malaysia
19
Environment of the East Asian Seas from the Effects of Land-based Activities. Malaysia participates in
the Global Programme of Action for the Protection of the Marine Environment from Land-based
Activities (GPA). Progress in the region is measured based on five indicators (Table 2.1).
Table 2.1: Progress in GPA Activities
No. Indicators Progress 1 Development and
implementation of national legislation, policies and strategies
Malaysian environmental laws have been revised and updated; new scheduled wastes regulations (2005).
2 Strengthening of institutional arrangements
Malaysia has already set up a Department of Environment
3 Development of capacity in integrated watershed and coastal management and scientific input to policymaking and decision-taking programs
River Rehabilitation Programmes for 26 rivers identified based on pollution threat and importance for the use of drinking water, fisheries and tourism. In 2006, studies had been carried out on six rivers.
4 Increased access to safe water and improved sanitation and sewage services
Malaysia has embarked on a privatization program of all sewerage services, and is committed to providing treatment facilities for 100 percent of its urban population by 2015. The private concessionaires now operate over 8,400 sewage treatment plants throughout Malaysia. The government budget allocation for pollution prevention and control (to Department of Environment) amounts to $27.4 million (2004); and the operation and maintenance costs for private sewage treatment plans amount to $55.1 million (2005).
5 Forging of partnership arrangements for sustainable development of coasts and oceans.
Malaysia hosted the East Asian Seas (EAS) Congress 2003 focused on the theme Regional Implementation of WSSD Commitments for the Seas of East Asia. There are National Environmental Awareness Campaigns for both public and rural areas; awareness campaigns for specified groups (industrial, local community, NGOs and journalists); Environmental Awareness Camps for primary and secondary school teachers; Environmental Competitions between Institutions of Higher Learning; and Sustainable Schools Programme Environment Award. There is increased collaboration with NGOs in sustainable management activities and programmes, especially in community river management and rehabilitation.
Source: http://www.unescap.org/drpad/vc/orientation/legal/3_aware_mly.htm; http://www.cobsea.org/documents/Meeting_Documents/EAS%20IGR2%20Prep/Partnership%20Opportunities.pdf
Malaysia became a signatory to the Stockholm Convention on POPs on 16 May 2002 and is one of
the 12 countries selected to implement a GEF/UNEP-funded project entitled “Development of National
Implementation Plans (NIP) for the Management of Persistent Organic Pollutants (POPs) in
Malaysia”. The Malaysian government had established a National Steering Committee (NSC)
Country Report on Pollution - Malaysia
20
structure for the management of POPs at national level (Ramachandran and Mourin, 2006). The NSC
on POPs is the main body that was established to look specifically into various aspects related to the
management of POPs. Public input in the development of the NIP is considerably lacking. Awareness
among Malaysian public regarding POPs is still low. The NIP report reports that as many as 80% of
Malaysians did not have knowledge about POPs. More than 60% did not consider POPs as
hazardous (Sangaralingam, 2005).
2.2 Maritime Agreements and Programmes
Maritime agreements are under the purview of the Marine Department, Ministry of Transport. The list
of international conventions adopted by Malaysia is given in Table 2.2. Malaysia has ratified MARPOL
73/78 Annex V and has 15 ports that have reception facilities for garbage waste. The garbage
removal and disposal services at these facilities are provided by private contractors.
Table 2.2: International Maritime Conventions Adopted by Malaysia.
No. International Shipping Conventions 1 Convention on the International Maritime Organization, 1948
2 Convention on the International Regulations for Preventing Collisions at Sea (COLREG)1972, as amended
3 International Convention for the Safety of Life at Sea (SOLAS) 1974, as amended
4 Protocol of 1978 relating to the International Convention for the Safety of Life at Sea 1974, as amended
5 International Convention on Tonnage Measurement of Ships, 1969
6 Convention on the International Mobile Satellite Organization (IMSO)1976, as amended
7 Operating Agreement on the International Mobile Satellite Organization 1976, as amended
8 International Convention on Standards of Training, Certification and Watchkeeping for Seafarers (STCW) 1978, as amended
9 International Convention on the Establishment of an International Fund for Compensation for Oil Pollution Damage (FUND) 1971
10 Protocol of 1978 relating to the International Convention for the Prevention of Pollution from Ships (MARPOL) 1973, as amended (Annex I, II & V)
11 International Convention on Oil Pollution Preparedness, Response and Co-operation (OPRC) 1990
12 Amendments Adopted in November 1991 to the Convention of the International Maritime Organization (Institutionalization of the Facilitation Committee)
13 Protocol of 1992 to amend the International Convention on Civil Liability for Oil Pollution Damage (CLC) 1969
14 Protocol of 1992 to amend the International Convention on the Establishment

Country Report on Pollution - Malaysia
21
of an International Fund for Compensation for Oil Pollution Damage 1971
15 The International Convention on Civil Liability for Bunker Oil Pollution Damage, 2001 (Bunkers Convention 2001)
16 The International Convention for the Limitation of Liability for Maritime Claims, 1976 as Amended by Protocol of 1996 (LLMC Convention 1996)
The Strait of Malacca is one of the busiest sea lanes in the world, especially for oil tanker traffic. Due
to the high volume of shipping, the Strait is highly susceptible to ship-based marine pollution, such as
oil and grease. To reduce accidents, shipping traffic in the Straits of Malacca and Singapore are
managed by an International Maritime Organisation (IMO) approved routing system since 1977. The
system comprises a Traffic Separation Scheme (TSS) and a Deep-Water Route, as well as specific
navigating rules. The TSS applies in the southern half of the Strait which is narrow and shallow,
increasing the risk of ship collision or grounding. A key hydrographic survey (Figure 2.1) within the
shallow areas of the TSS of the Strait of Malacca and Singapore is underway as part of the Marine
Electronic Highway (MEH) Demonstration Project (Sekimizu et al., 2001). This is a regional project
that IMO is executing for the Global Environment Facility (GEF) / World Bank. The purpose is to
produce an updated electronic navigation chart of the area. The MEH is a co-operative arrangement
with Indonesia, Malaysia and Singapore, as well as the Republic of Korea, the International
Hydrographic Organization (IHO), the International Chamber of Shipping (ICS) and the International
Association of Independent Tanker Owners (INTERTANKO) (MEHDP, 2010a).
Figure 2.1: MEH Demonstration Project Survey Area 1
(Source: MEHDP, 2010b)
Country Report on Pollution - Malaysia
22
3. Governance
3.1 Policy, Legislation, Acts, Regulations and Orders
In 2002 Malaysia approved a National Policy on the Environment which integrates the three elements
of sustainable development: economic, social and cultural development and environmental
conservation. Although the Environmental Policy is relatively recent, control of pollution and
environmental impacts have been legislated much earlier through the EQA 1974. In addition to the
EQA, there are other complementary regulations such as laws governing resource use, vessel
operation and conduct, land use pattern, and other local government by-laws on earthworks, earth
removal, mining, sanitation and solid waste disposal (Table 3.1).
Table 3.1: Other Legislation Relevant for Marine Water Pollution Control
No. Legislation 1 Merchant Shipping Ordinance, 1952
2 Land Conservation Act, 1960
3 National Land Code, 1965
4 Forestry Act, 1984
5 Exclusive Economic Zone Act, 1984
6 Merchant Shipping (Central Mercantile Marine Fund) Rules 1984
7 Fisheries Act, 1985
8 Sewerage Services Act, 1993
9 Sarawak Natural Resources and Environment (Prescribed Activities) Order, 1994
10 Merchant Shipping (Amendment) Act, 1998
11 Sabah Conservation of Environment (Prescribed Activities) Order, 1999
12 Exclusive Economic Zone (Appointment of Authoritized Officer) Order 2001
13 Customs (Prohibition of Import) Order 1998, (Amendment), 2006
14 Customs (Prohibition of Export) Order 1998, (Amendment), 2006
15 Solid Waste and Public Cleansing Management Act, 2006
Malaysia does not yet have a coastal management policy although there are many management
initiatives which have resulted in coastal management planning documents. Among the notable
approaches implemented on the West Coast are Integrated Shoreline Management Plans developed
for Penang, Malacca and Negeri Sembilan, under the DID which controls development on the
coastline, and the integrated coastal management strategy for Port Klang, Selangor, developed with
assistance and training under GEF/UNDP/IMO/PEMSEA Regional Programme and implemented by
the Selangor Waters Management Authority.
Country Report on Pollution - Malaysia
23
The Government has been in the process of developing a coastal management policy and studies
have been undertaken since the 1990s. A draft National Coastal Resources Management Policy was
prepared under the oversight of the Agriculture Section of the Economic Planning Unit (EPU), at the
time. According to Mokhtar (2003), this document formed the basis for an EPU-DANCED project on
Integrated Coastal Zone Management (ICZM), comprising pilot studies on coastal profiles in Penang,
Sabah and Sarawak. These studies were complemented by a federal component focusing on
institutional and legal frameworks for establishing an ICZM in Malaysia. The biggest problem in the
formulation of a national marine or coastal management policy is the very many different parties
involved - both public and private - aside from any consideration of national security issues and
transboundary concerns. The constitutional structure in Malaysia establishes that land, and waters up
to 3 nautical miles, is under State rather than Federal Government jurisdiction. Thus, any policy would
have to take into account the rights of the individual States, in addition to any concerns of agencies
responsible for resources management and enforcement at sea.
In addition to policies and administrative application of rules, some environmental instruments (EIs)
for environmental protection are applied. General tax incentives coupled with other instruments
(grants and subsidies) have been in place for the last 10 years (Khor and Obid, 2006). Only very few
recent projects, however, directly concern environmental conservation and rehabilitation in coastal
areas, in contrast with the many community-based and inland environmental projects.
3.2 The Environmental Quality Act, 1974
The most important legislation in Malaysia governing water quality management is the EQA 1974, and
its amendments (Table 3.2). The objective of the EQA is pollution prevention, abatement and control,
as well as environment enhancement. The legislation sets limits of allowable pollutant discharge
levels for both land and sea-based sources. Currently this Act has 29 regulations, 21 Orders, and 3
Rules (for compounding of offences) associated with it. Of the 29 regulations under the Act, 26 are
relevant for water pollution control (Table 3.3). The remaining three are related to air and noise. The
two air regulations are included in Table 3.3, as atmospheric fallout, through dry and wet deposition,
can contribute to water pollution. The regulations are for control of water pollution relate to licensing,
crude palm oil, raw natural rubber, scheduled (toxic) wastes, sewage and industrial effluents, halon
and refrigerants, and petroleum products. The discharge standards and procedures for handling the
various types of wastes, both from land and sea-based sources, are given in the Regulations. In
addition to the regulations there are several Orders which govern prescribed activities and prescribed
premises (Table 3.4).
Country Report on Pollution - Malaysia
24
Table 3.2: Environmental Quality Act 1974 and Amendments
No. Name
1 Environmental Quality Act 1974
2 Environmental Quality (Amendment) Act 1985
3 Environmental Quality (Amendment) Act 1996
4 Environmental Quality (Amendment) Act 1998
5 Environmental Quality (Amendment) Act 2001
6 Environmental Quality (Amendment) Act 2007
Table 3.3: Regulations under EQA 1974 Relevant for Water Pollution
No. Name 1 Environmental Quality (Appeal Board) Regulations 2003
2 Environmental Quality (Clean Air) (Amendment) Regulations 2000 3 Environmental Quality (Clean Air) Regulations 1978 - P.U.(A) 280/78 4 Environmental Quality (Control Of Emission From Diesel Engines) (Amendment)
Regulations 2000 5 Environmental Quality (Control Of Emission From Diesel Engines) Regulations
1996 6 Environmental Quality (Control Of Emission From Motorcycles) Regulations 2003 7 Environmental Quality (Control Of Emission From Petrol Engines) Regulations
1996 8 Environmental Quality (Control of Lead Concentration In Motor Gasoline)
Regulations 1985 9 Environmental Quality (Control Of Petrol And Diesel Properties) Regulations
2007 10 Environmental Quality (Control of Pollution From Solid Waste Transfer Station
And Landfill) Regulations 2009 11 Environmental Quality (Dioxin And Furan) Regulations 2004 12 Environmental Quality (Halon Management) Regulations 1999 13 Environmental Quality (Industrial Effluent) Regulations 2009 14 Environmental Quality (Licensing) Regulations 1977 15 Environmental Quality (Prescribed Premises Scheduled Wastes Treatment And
Disposal Facilities) (Amendment) Regulations 2006 16 Environmental Quality (Prescribed Premises) (Crude Palm Oil) (Amendment)
Regulations 1982 17 Environmental Quality (Prescribed Premises) (Crude Palm Oil) Regulations 1977 18 Environmental Quality (Prescribed Premises) (Raw Natural Rubber)
(Amendment) Regulations 1980 19 Environmental Quality (Prescribed Premises) (Raw Natural Rubber) Regulations
1978 20 Environmental Quality (Prescribed Premises) (Scheduled Wastes Treatment And
Disposal Facilities) Regulations 1989 21 Environmental Quality (Refrigerant Management) (Amendment) Regulations
Country Report on Pollution - Malaysia
25
2004 22 Environmental Quality (Refrigerant Management) Regulations 1999 23 Environmental Quality (Scheduled Wastes) (Amendment) Regulations 2007 24 Environmental Quality (Scheduled Wastes) Regulations 1989 (Revoked) 25 Environmental Quality (Scheduled Wastes) Regulations 2005 26 Environmental Quality (Sewage And Industrial Effluents) (Amendment)
Regulations 1997 (Revoked) 27 Environmental Quality (Sewage And Industrial Effluents) Regulations 1979 28 Environmental Quality (Sewage) Regulations 2009
Country Report on Pollution - Malaysia
26
Table 3.4: Orders under EQA 1974 Relevant for Water Pollution
No. Name 1 Environmental Quality (Declared Activities) (Open Burning) Order 2003 2 Environmental Quality (Delegation Of Powers Halon Management) Order 2000 3 Environmental Quality (Delegation Of Powers On Marine Pollution Control)
(Amendment) Order 1994 4 Environmental Quality (Delegation Of Powers On Marine Pollution Control) Order
1993 5 Environmental Quality (Delegation Of Powers On Marine Pollution Control) Order
1994 6 Environmental Quality (Delegation Of Powers) (Investigation Of Open Burning) Order
2000 7 Environmental Quality (Delegation Of Powers) (Perbadanan Putrajaya) Order 2002 8 Environmental Quality (Delegation Of Powers) Order 2005 9 Environmental Quality (Prescribed Activities) (Environmental Impact Assesment)
(Amendment) Order 1995 10 Environmental Quality (Prescribed Activities) (Environmental Impact Assesment)
(Amendment) Order 1996 11 Environmental Quality (Prescribed Activities) (Environmental Impact Assessment)
(Amendment) Order 2000 12 Environmental Quality (Prescribed Activities) (Environmental Impact Assessment)
Order 1987 13 Environmental Quality (Prescribed Conveyance) (Scheduled Wastes) Order 2005 14 Environmental Quality (Prescribed Premises) (Crude Palm Oil) Order 1977 15 Environmental Quality (Prescribed Premises) (Raw Natural Rubber) (Amendment)
Order 1978 16 Environmental Quality (Prescribed Premises) (Raw Natural Rubber) Order 1978 17 Environmental Quality (Prescribed Premises) (Scheduled Wastes Treatment And
Disposal Facilities Order) 1989 18 Environmental Quality (Prescribed Premises) (Scheduled Wastes Treatment And
Disposal Facilities) (Amendment) Order 2006 19 Environmental Quality (Prohibition On The Use Of Chlorofluorocarbons And Other
Gases As Propellants And Blowing Agents) Order 1993 20 Environmental Quality (Prohibition On The Use Of Controlled Substance In Soap,
Synthetic Detergent And Other Cleaning Agents) Order 1995
3.3 Institutional Mechanisms
In Malaysia, the administration and management of water resources is carried out by Federal and
various state government agencies. The Federal Government sets the policies and undertakes
studies at the national level for overall planning and development purposes. The National Water
Resource Council established in 1998 has the responsibility of streamlining water resource
development and management activities of all states. Recently, the Federal Government initiated the
National Water Resource Studies to evaluate availability of water resources to the year 2050.
Country Report on Pollution - Malaysia
27
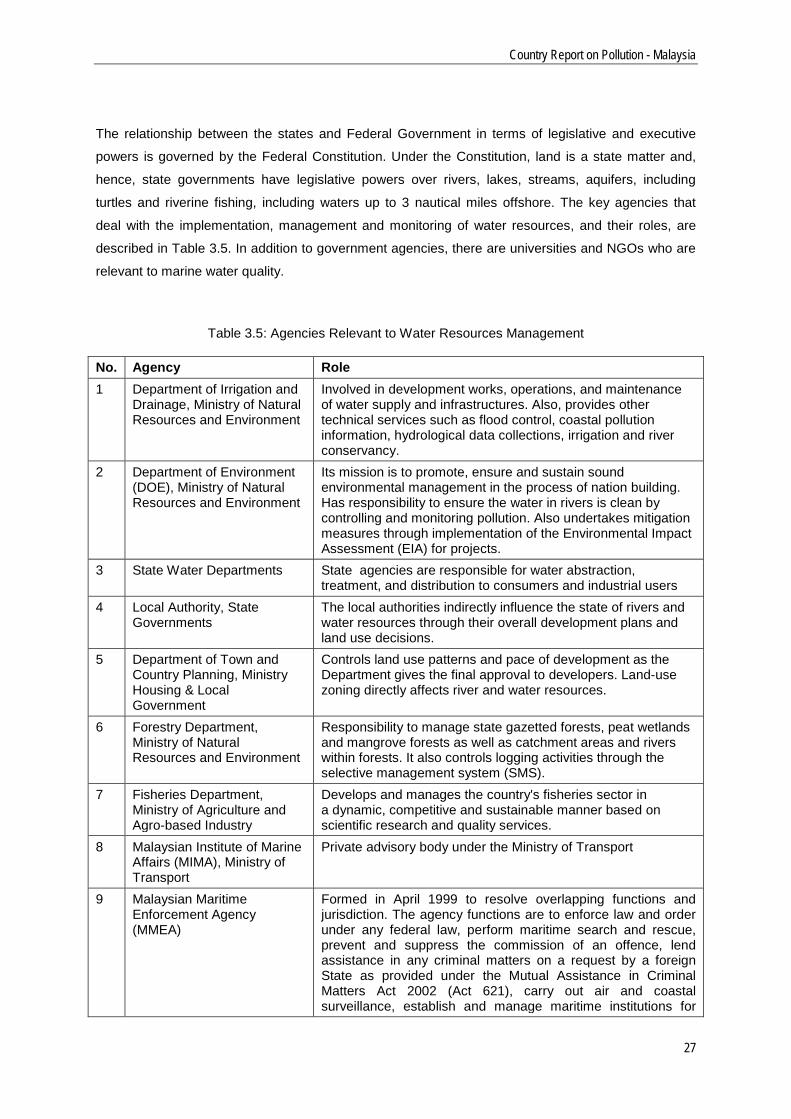
The relationship between the states and Federal Government in terms of legislative and executive
powers is governed by the Federal Constitution. Under the Constitution, land is a state matter and,
hence, state governments have legislative powers over rivers, lakes, streams, aquifers, including
turtles and riverine fishing, including waters up to 3 nautical miles offshore. The key agencies that
deal with the implementation, management and monitoring of water resources, and their roles, are
described in Table 3.5. In addition to government agencies, there are universities and NGOs who are
relevant to marine water quality.
Table 3.5: Agencies Relevant to Water Resources Management
No. Agency Role 1 Department of Irrigation and
Drainage, Ministry of Natural Resources and Environment
Involved in development works, operations, and maintenance of water supply and infrastructures. Also, provides other technical services such as flood control, coastal pollution information, hydrological data collections, irrigation and river conservancy.
2 Department of Environment (DOE), Ministry of Natural Resources and Environment
Its mission is to promote, ensure and sustain sound environmental management in the process of nation building. Has responsibility to ensure the water in rivers is clean by controlling and monitoring pollution. Also undertakes mitigation measures through implementation of the Environmental Impact Assessment (EIA) for projects.
3 State Water Departments State agencies are responsible for water abstraction, treatment, and distribution to consumers and industrial users
4 Local Authority, State Governments
The local authorities indirectly influence the state of rivers and water resources through their overall development plans and land use decisions.
5 Department of Town and Country Planning, Ministry Housing & Local Government
Controls land use patterns and pace of development as the Department gives the final approval to developers. Land-use zoning directly affects river and water resources.
6 Forestry Department, Ministry of Natural Resources and Environment
Responsibility to manage state gazetted forests, peat wetlands and mangrove forests as well as catchment areas and rivers within forests. It also controls logging activities through the selective management system (SMS).
7 Fisheries Department, Ministry of Agriculture and Agro-based Industry
Develops and manages the country's fisheries sector in a dynamic, competitive and sustainable manner based on scientific research and quality services.
8 Malaysian Institute of Marine Affairs (MIMA), Ministry of Transport
Private advisory body under the Ministry of Transport
9 Malaysian Maritime Enforcement Agency (MMEA)
Formed in April 1999 to resolve overlapping functions and jurisdiction. The agency functions are to enforce law and order under any federal law, perform maritime search and rescue, prevent and suppress the commission of an offence, lend assistance in any criminal matters on a request by a foreign State as provided under the Mutual Assistance in Criminal Matters Act 2002 (Act 621), carry out air and coastal surveillance, establish and manage maritime institutions for
Country Report on Pollution - Malaysia
28
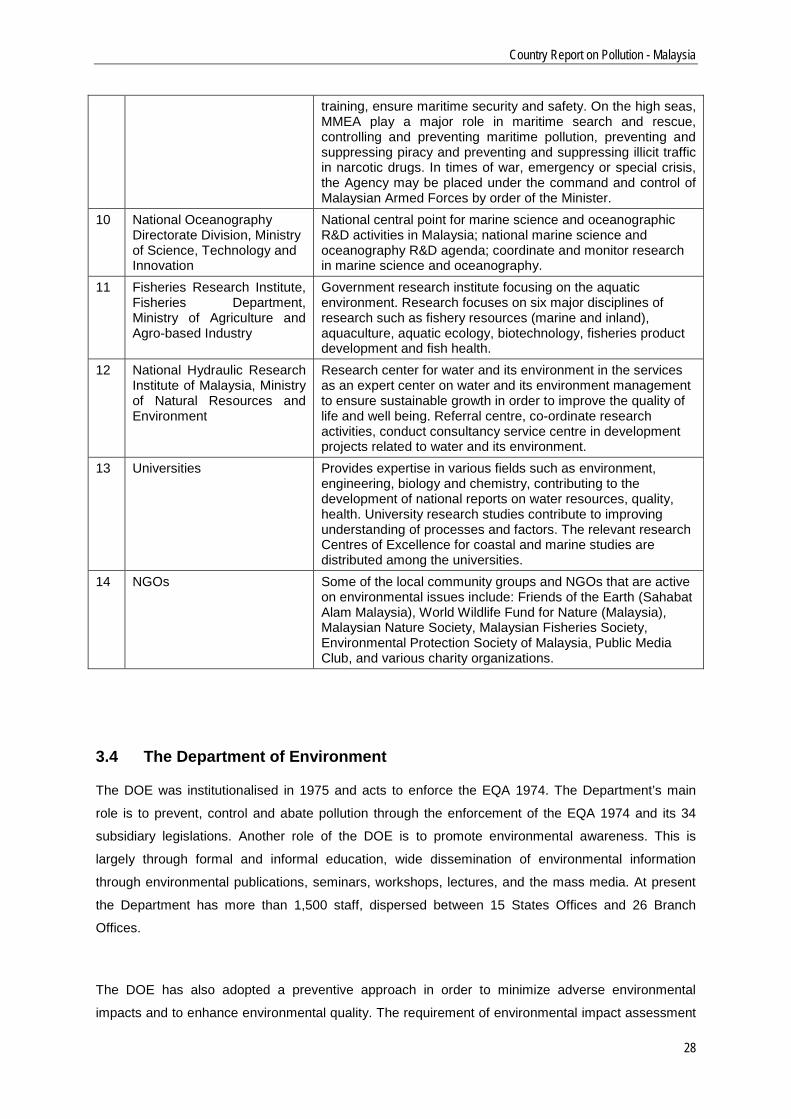
training, ensure maritime security and safety. On the high seas, MMEA play a major role in maritime search and rescue, controlling and preventing maritime pollution, preventing and suppressing piracy and preventing and suppressing illicit traffic in narcotic drugs. In times of war, emergency or special crisis, the Agency may be placed under the command and control of Malaysian Armed Forces by order of the Minister.
10 National Oceanography Directorate Division, Ministry of Science, Technology and Innovation
National central point for marine science and oceanographic R&D activities in Malaysia; national marine science and oceanography R&D agenda; coordinate and monitor research in marine science and oceanography.
11 Fisheries Research Institute, Fisheries Department, Ministry of Agriculture and Agro-based Industry
Government research institute focusing on the aquatic environment. Research focuses on six major disciplines of research such as fishery resources (marine and inland), aquaculture, aquatic ecology, biotechnology, fisheries product development and fish health.
12 National Hydraulic Research Institute of Malaysia, Ministry of Natural Resources and Environment
Research center for water and its environment in the services as an expert center on water and its environment management to ensure sustainable growth in order to improve the quality of life and well being. Referral centre, co-ordinate research activities, conduct consultancy service centre in development projects related to water and its environment.
13 Universities Provides expertise in various fields such as environment, engineering, biology and chemistry, contributing to the development of national reports on water resources, quality, health. University research studies contribute to improving understanding of processes and factors. The relevant research Centres of Excellence for coastal and marine studies are distributed among the universities.
14 NGOs Some of the local community groups and NGOs that are active on environmental issues include: Friends of the Earth (Sahabat Alam Malaysia), World Wildlife Fund for Nature (Malaysia), Malaysian Nature Society, Malaysian Fisheries Society, Environmental Protection Society of Malaysia, Public Media Club, and various charity organizations.
3.4 The Department of Environment
The DOE was institutionalised in 1975 and acts to enforce the EQA 1974. The Department’s main
role is to prevent, control and abate pollution through the enforcement of the EQA 1974 and its 34
subsidiary legislations. Another role of the DOE is to promote environmental awareness. This is
largely through formal and informal education, wide dissemination of environmental information
through environmental publications, seminars, workshops, lectures, and the mass media. At present
the Department has more than 1,500 staff, dispersed between 15 States Offices and 26 Branch
Offices.
The DOE has also adopted a preventive approach in order to minimize adverse environmental
impacts and to enhance environmental quality. The requirement of environmental impact assessment
Country Report on Pollution - Malaysia
29
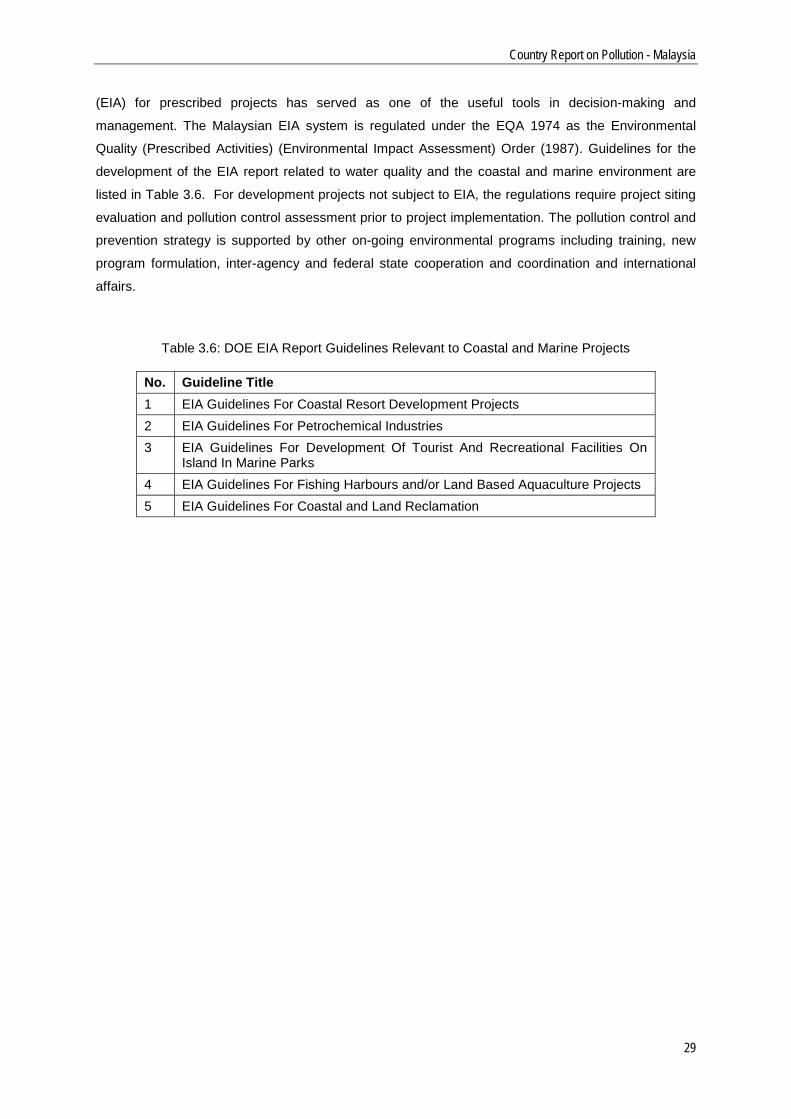
(EIA) for prescribed projects has served as one of the useful tools in decision-making and
management. The Malaysian EIA system is regulated under the EQA 1974 as the Environmental
Quality (Prescribed Activities) (Environmental Impact Assessment) Order (1987). Guidelines for the
development of the EIA report related to water quality and the coastal and marine environment are
listed in Table 3.6. For development projects not subject to EIA, the regulations require project siting
evaluation and pollution control assessment prior to project implementation. The pollution control and
prevention strategy is supported by other on-going environmental programs including training, new
program formulation, inter-agency and federal state cooperation and coordination and international
affairs.
Table 3.6: DOE EIA Report Guidelines Relevant to Coastal and Marine Projects
No. Guideline Title 1 EIA Guidelines For Coastal Resort Development Projects 2 EIA Guidelines For Petrochemical Industries 3 EIA Guidelines For Development Of Tourist And Recreational Facilities On
Island In Marine Parks 4 EIA Guidelines For Fishing Harbours and/or Land Based Aquaculture Projects 5 EIA Guidelines For Coastal and Land Reclamation
Country Report on Pollution - Malaysia
30
4. Existing Water Quality Standards
4.1 Effluent Discharge Standards
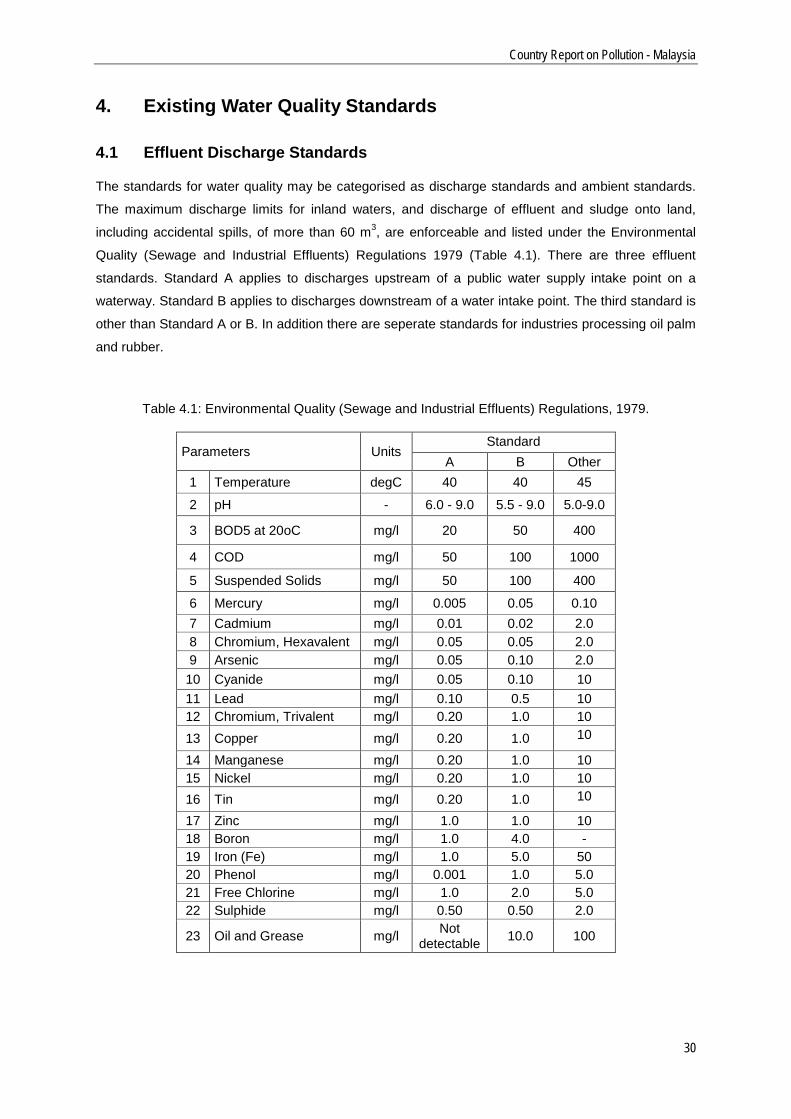
The standards for water quality may be categorised as discharge standards and ambient standards.
The maximum discharge limits for inland waters, and discharge of effluent and sludge onto land,
including accidental spills, of more than 60 m3, are enforceable and listed under the Environmental
Quality (Sewage and Industrial Effluents) Regulations 1979 (Table 4.1). There are three effluent
standards. Standard A applies to discharges upstream of a public water supply intake point on a
waterway. Standard B applies to discharges downstream of a water intake point. The third standard is
other than Standard A or B. In addition there are seperate standards for industries processing oil palm
and rubber.
Table 4.1: Environmental Quality (Sewage and Industrial Effluents) Regulations, 1979.
Parameters Units Standard
A B Other 1 Temperature degC 40 40 45
2 pH - 6.0 - 9.0 5.5 - 9.0 5.0-9.0
3 BOD5 at 20oC mg/l 20 50 400
4 COD mg/l 50 100 1000
5 Suspended Solids mg/l 50 100 400
6 Mercury mg/l 0.005 0.05 0.10 7 Cadmium mg/l 0.01 0.02 2.0 8 Chromium, Hexavalent mg/l 0.05 0.05 2.0 9 Arsenic mg/l 0.05 0.10 2.0
10 Cyanide mg/l 0.05 0.10 10 11 Lead mg/l 0.10 0.5 10 12 Chromium, Trivalent mg/l 0.20 1.0 10 13 Copper mg/l 0.20 1.0 10
14 Manganese mg/l 0.20 1.0 10 15 Nickel mg/l 0.20 1.0 10 16 Tin mg/l 0.20 1.0 10
17 Zinc mg/l 1.0 1.0 10 18 Boron mg/l 1.0 4.0 - 19 Iron (Fe) mg/l 1.0 5.0 50 20 Phenol mg/l 0.001 1.0 5.0 21 Free Chlorine mg/l 1.0 2.0 5.0 22 Sulphide mg/l 0.50 0.50 2.0
23 Oil and Grease mg/l Not detectable 10.0 100
Country Report on Pollution - Malaysia
31
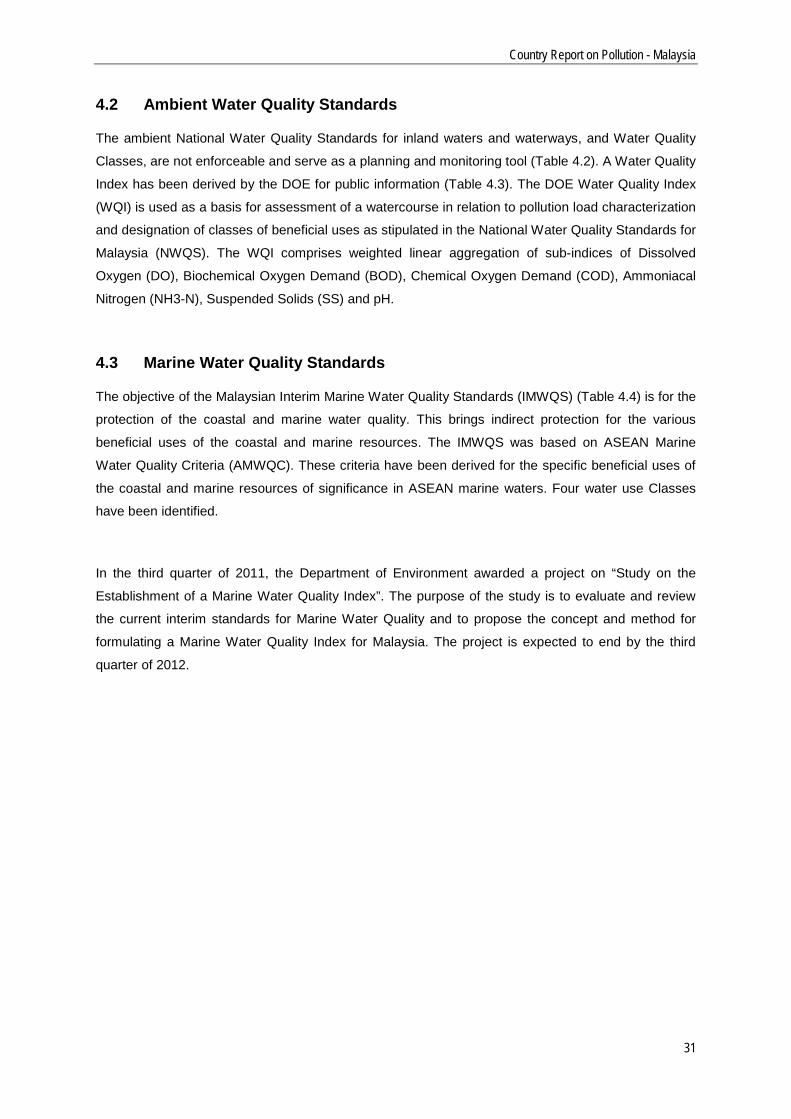
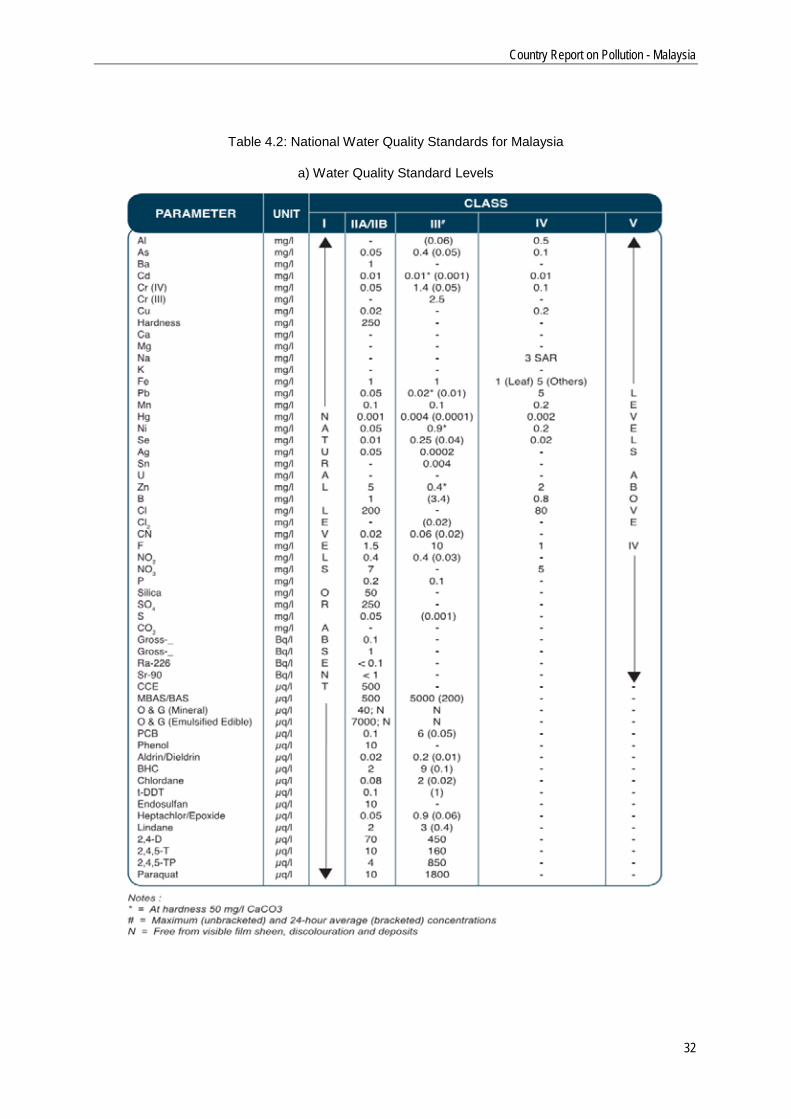
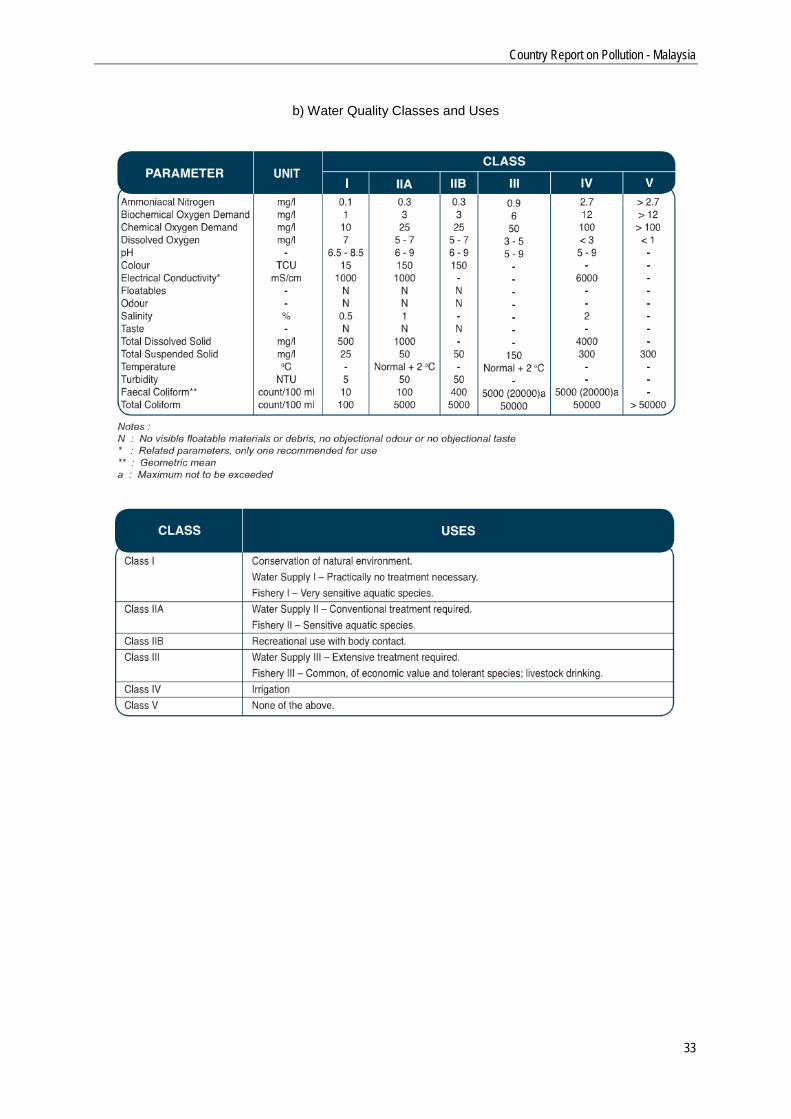
4.2 Ambient Water Quality Standards
The ambient National Water Quality Standards for inland waters and waterways, and Water Quality
Classes, are not enforceable and serve as a planning and monitoring tool (Table 4.2). A Water Quality
Index has been derived by the DOE for public information (Table 4.3). The DOE Water Quality Index
(WQI) is used as a basis for assessment of a watercourse in relation to pollution load characterization
and designation of classes of beneficial uses as stipulated in the National Water Quality Standards for
Malaysia (NWQS). The WQI comprises weighted linear aggregation of sub-indices of Dissolved
Oxygen (DO), Biochemical Oxygen Demand (BOD), Chemical Oxygen Demand (COD), Ammoniacal
Nitrogen (NH3-N), Suspended Solids (SS) and pH.
4.3 Marine Water Quality Standards
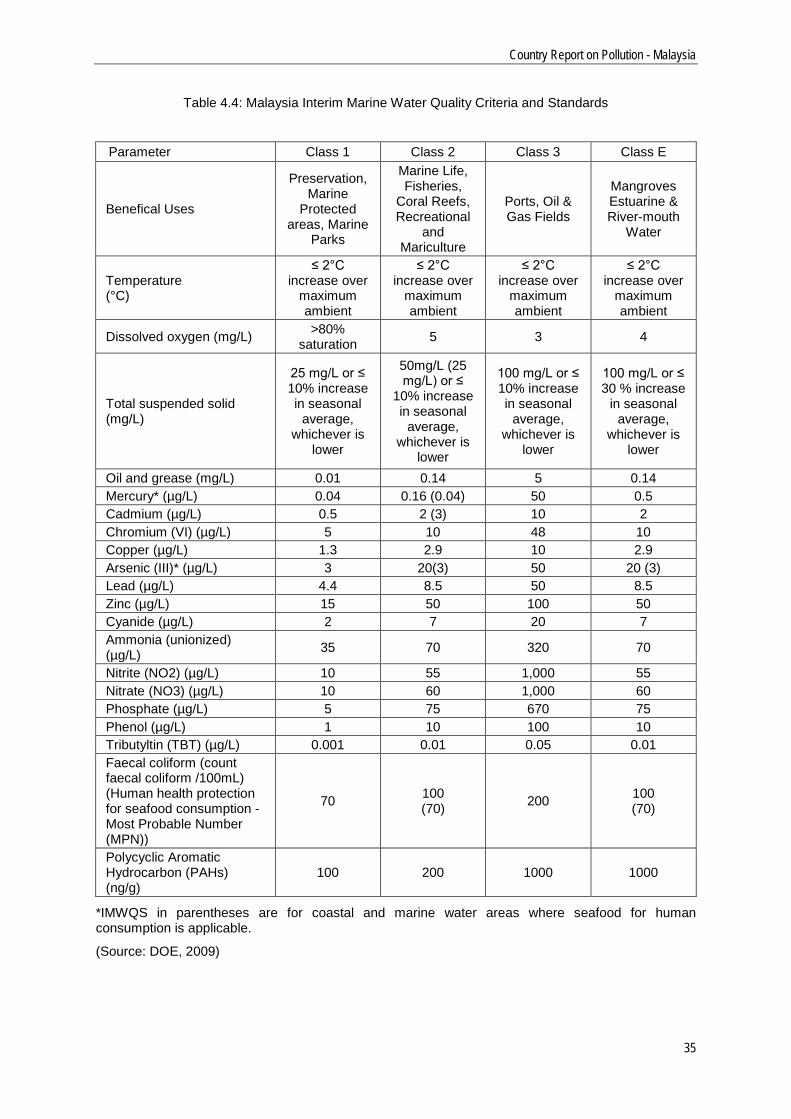
The objective of the Malaysian Interim Marine Water Quality Standards (IMWQS) (Table 4.4) is for the
protection of the coastal and marine water quality. This brings indirect protection for the various
beneficial uses of the coastal and marine resources. The IMWQS was based on ASEAN Marine
Water Quality Criteria (AMWQC). These criteria have been derived for the specific beneficial uses of
the coastal and marine resources of significance in ASEAN marine waters. Four water use Classes
have been identified.
In the third quarter of 2011, the Department of Environment awarded a project on “Study on the
Establishment of a Marine Water Quality Index”. The purpose of the study is to evaluate and review
the current interim standards for Marine Water Quality and to propose the concept and method for
formulating a Marine Water Quality Index for Malaysia. The project is expected to end by the third
quarter of 2012.
Country Report on Pollution - Malaysia
32
Table 4.2: National Water Quality Standards for Malaysia
a) Water Quality Standard Levels
Country Report on Pollution - Malaysia
33
b) Water Quality Classes and Uses
Country Report on Pollution - Malaysia
34
c) DOE-Water Quality Index and Water Quality Classification
Table 4.3. DOE Water Quality Classification and Class Standards for Malaysia
Country Report on Pollution - Malaysia
35
Table 4.4: Malaysia Interim Marine Water Quality Criteria and Standards
Parameter Class 1 Class 2 Class 3 Class E
Benefical Uses
Preservation, Marine
Protected areas, Marine
Parks
Marine Life, Fisheries,
Coral Reefs, Recreational
and Mariculture
Ports, Oil & Gas Fields
Mangroves Estuarine & River-mouth
Water
Temperature (°C)
≤ 2°C increase over
maximum ambient
≤ 2°C increase over
maximum ambient
≤ 2°C increase over
maximum ambient
≤ 2°C increase over
maximum ambient
Dissolved oxygen (mg/L) >80% saturation 5 3 4
Total suspended solid (mg/L)
25 mg/L or ≤ 10% increase in seasonal
average, whichever is
lower
50mg/L (25 mg/L) or ≤
10% increase in seasonal
average, whichever is
lower
100 mg/L or ≤ 10% increase in seasonal
average, whichever is
lower
100 mg/L or ≤ 30 % increase
in seasonal average,
whichever is lower
Oil and grease (mg/L) 0.01 0.14 5 0.14 Mercury* (µg/L) 0.04 0.16 (0.04) 50 0.5 Cadmium (µg/L) 0.5 2 (3) 10 2 Chromium (VI) (µg/L) 5 10 48 10 Copper (µg/L) 1.3 2.9 10 2.9 Arsenic (III)* (µg/L) 3 20(3) 50 20 (3) Lead (µg/L) 4.4 8.5 50 8.5 Zinc (µg/L) 15 50 100 50 Cyanide (µg/L) 2 7 20 7 Ammonia (unionized) (µg/L) 35 70 320 70
Nitrite (NO2) (µg/L) 10 55 1,000 55 Nitrate (NO3) (µg/L) 10 60 1,000 60 Phosphate (µg/L) 5 75 670 75 Phenol (µg/L) 1 10 100 10 Tributyltin (TBT) (µg/L) 0.001 0.01 0.05 0.01 Faecal coliform (count faecal coliform /100mL) (Human health protection for seafood consumption - Most Probable Number (MPN))
70 100 (70) 200 100
(70)
Polycyclic Aromatic Hydrocarbon (PAHs) (ng/g)
100 200 1000 1000
*IMWQS in parentheses are for coastal and marine water areas where seafood for human consumption is applicable.
(Source: DOE, 2009)
Country Report on Pollution - Malaysia
36
5 The National Water, Coastal and Marine Monitoring Programme and Current Status
5.1 Environmental Monitoring
The DOE conducts a national water quality monitoring programme for the whole country. The
monitoring programme covers air, river water, ground water, coastal and marine waters. The purpose
is to detect water quality changes and identify pollution sources. Each year the results of the
monitoring is summarised in an Environmental Quality Report. Monitoring of industrial effluents is also
carried out, normally by requiring industries to submit effluent quality reports. Monitoring is, in most
cases, now conducted by a designated private contractor, Alam Sekitar Malaysia Sdn. Bhd.
5.2 River Water Quality Monitoring
The DOE has been conducting river water quality monitoring since 1978. The purpose is to establish
the status of water quality and observe water quality trends. Identification of major pollution sources in
a river catchment is also carried out. A total of 1,064 manual river water quality stations are located in
a total of 143 river basins throughout the whole of Malaysia. Sampling is carried out at regular
intervals from designated stations for in situ observations and laboratory analysis to determine the
physico-chemical and biological characteristics. Depending on the level of development in the
catchment, water quality sampling is carried out at each station from 3 to 12 times a year. The more
developed the area the more frequent the sampling. A total of 10 automatic water quality monitoring
stations had been installed to monitor river quality changes on a continuous basis on the West Coast.
They are located on Sg.Perai (Seberang Perai – Pulau Pinang), Sg. Perak (Perak), Sg. Selangor
(Selangor), Sg. Jinjang (WPKL), Sg. Langat (Selangor), Sg. Linggi (Negeri Sembilan), Sg. Labu
(Negeri Sembilan), Sg. Batang Benar (Negeri Sembilan), Sg. Melaka (Malacca), and Sg. Putat
(Malacca).
Water quality status is categorized into clean, slightly polluted or polluted conditions (Table 4.3). The
DOE-WQI value is used also to classify river water quality into in Class I, II, III, IV or V. Thus, in nearly
every station the six parameters of DO, BOD, COD, NH3-N, SS and pH are always measured. Other
parameters, such as heavy metals and bacteria, may be measured according to site requirement. The
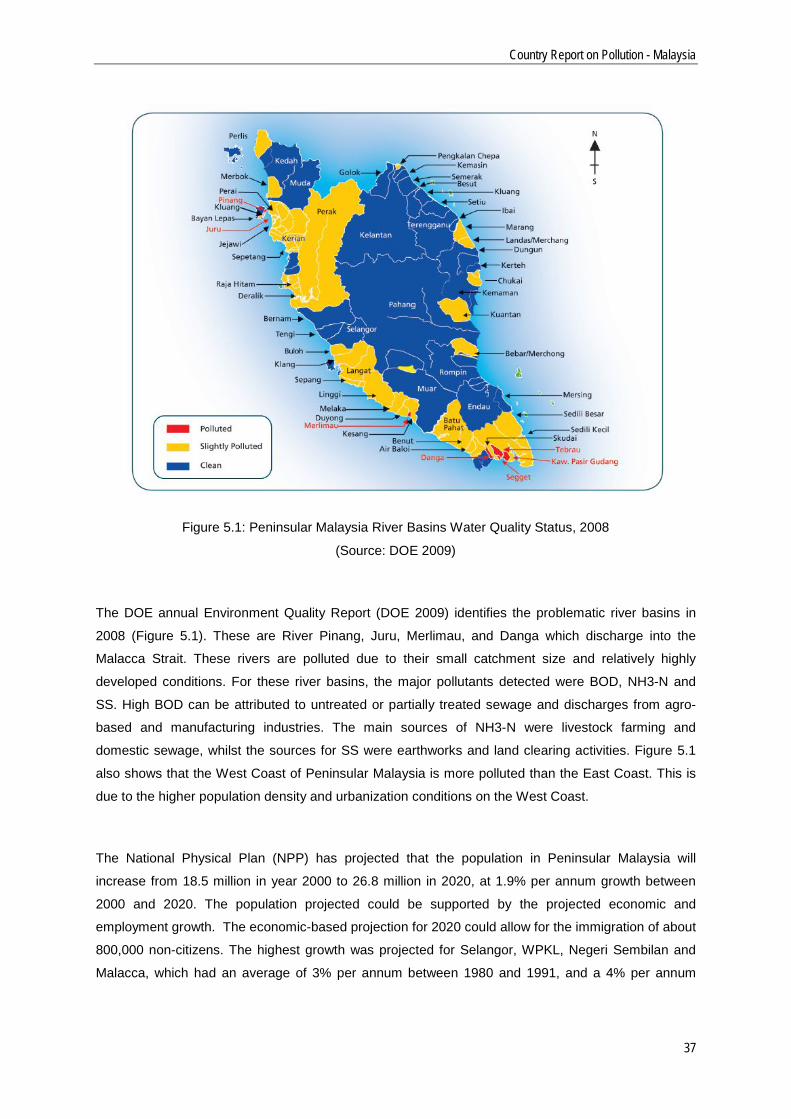
results of river water monitoring for 2008 is shown in Figure 5.1.
Country Report on Pollution - Malaysia
37
Figure 5.1: Peninsular Malaysia River Basins Water Quality Status, 2008
(Source: DOE 2009)
The DOE annual Environment Quality Report (DOE 2009) identifies the problematic river basins in
2008 (Figure 5.1). These are River Pinang, Juru, Merlimau, and Danga which discharge into the
Malacca Strait. These rivers are polluted due to their small catchment size and relatively highly
developed conditions. For these river basins, the major pollutants detected were BOD, NH3-N and
SS. High BOD can be attributed to untreated or partially treated sewage and discharges from agro-
based and manufacturing industries. The main sources of NH3-N were livestock farming and
domestic sewage, whilst the sources for SS were earthworks and land clearing activities. Figure 5.1
also shows that the West Coast of Peninsular Malaysia is more polluted than the East Coast. This is
due to the higher population density and urbanization conditions on the West Coast.
The National Physical Plan (NPP) has projected that the population in Peninsular Malaysia will
increase from 18.5 million in year 2000 to 26.8 million in 2020, at 1.9% per annum growth between
2000 and 2020. The population projected could be supported by the projected economic and
employment growth. The economic-based projection for 2020 could allow for the immigration of about
800,000 non-citizens. The highest growth was projected for Selangor, WPKL, Negeri Sembilan and
Malacca, which had an average of 3% per annum between 1980 and 1991, and a 4% per annum
Country Report on Pollution - Malaysia
38
between 1991 and 2000. This increase in population will increase the organic waste load to rivers and
the coastal waters. The increase in population can be seen in Figure 5.2 for the years 2003 to 2007.
Figure 5.2: State Population on West Coast of Peninsular Malaysia, 2003-2007
(Source: Department of Statistics)
5.3 Coastal and Marine Water Quality Monitoring
Coastal and marine water quality monitoring is carried out by the DOE to determine the degree of
pollution from land-based sources as well as from the sea. Stormwaters carry most of the pollution
from land-based sources into rivers. The pollutants are then flushed out from the river basin to the
coastal region. However, most of the pollution is diluted offshore, except for SS, E.coli and oil and
grease. They contribute to significant contamination of the coastal area, as evidenced by the amount
of coastal water samples which persistently exceed the ambient standards (Figure 5.3).
According to DOE (2009, 2010), total suspended solid was the main contaminant for the West Coast
of Peninsular Malaysia, followed by E. coli and oil and grease. Compared to the previous year, there
was an increase in total suspended solids, oil and grease, E.coli, mercury, arsenic and total chromium
levels and a decrease in copper, cadmium and lead. All samples collected from Perlis and Kedah
showed that total suspended solids remained a significant contaminant of marine water as all the
samples exceeded the IMWQS. Perak recorded the highest percentage by 97% of total samples
exceeding the IMWQS followed by Selangor with 80% of the samples were exceeding the IMWQS for
oil and grease. Perlis with 95% of samples was highest for E.coli contamination. Lead pollution was
found in Perak (73%). Perak used to be an important tin mining area. Lead (Pb) was the most
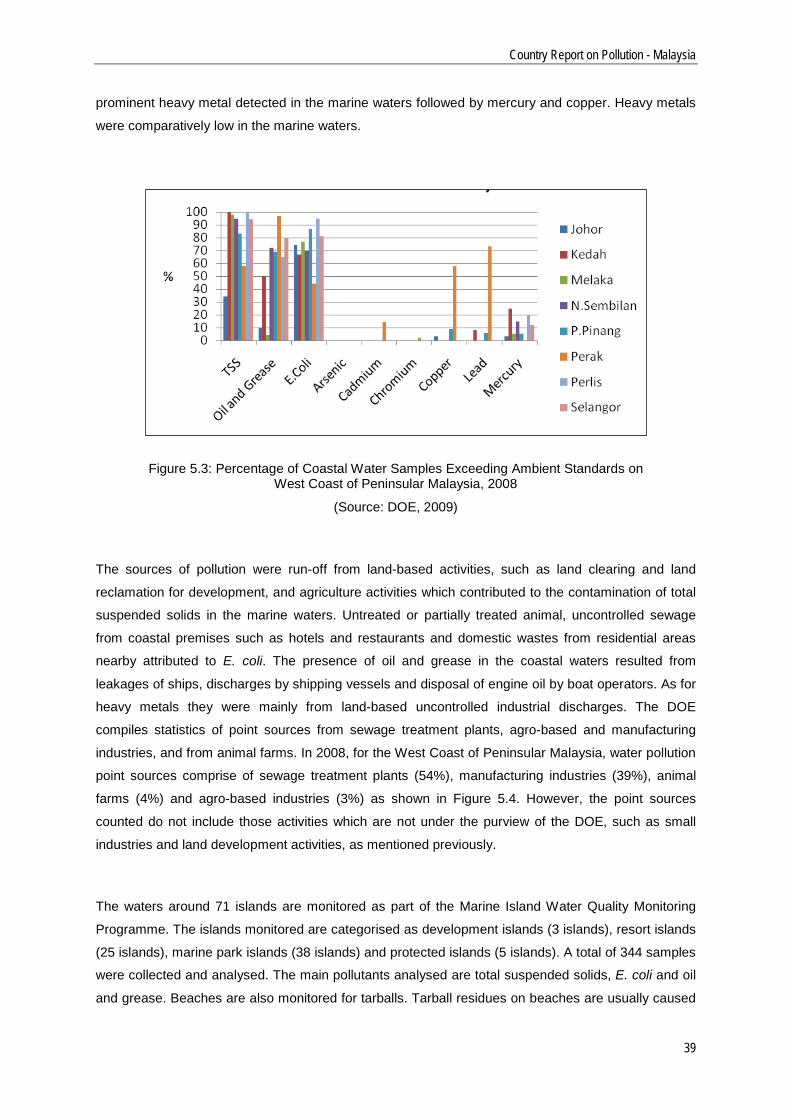
Country Report on Pollution - Malaysia
39
prominent heavy metal detected in the marine waters followed by mercury and copper. Heavy metals
were comparatively low in the marine waters.
Figure 5.3: Percentage of Coastal Water Samples Exceeding Ambient Standards on West Coast of Peninsular Malaysia, 2008
(Source: DOE, 2009)
The sources of pollution were run-off from land-based activities, such as land clearing and land
reclamation for development, and agriculture activities which contributed to the contamination of total
suspended solids in the marine waters. Untreated or partially treated animal, uncontrolled sewage
from coastal premises such as hotels and restaurants and domestic wastes from residential areas
nearby attributed to E. coli. The presence of oil and grease in the coastal waters resulted from
leakages of ships, discharges by shipping vessels and disposal of engine oil by boat operators. As for
heavy metals they were mainly from land-based uncontrolled industrial discharges. The DOE
compiles statistics of point sources from sewage treatment plants, agro-based and manufacturing
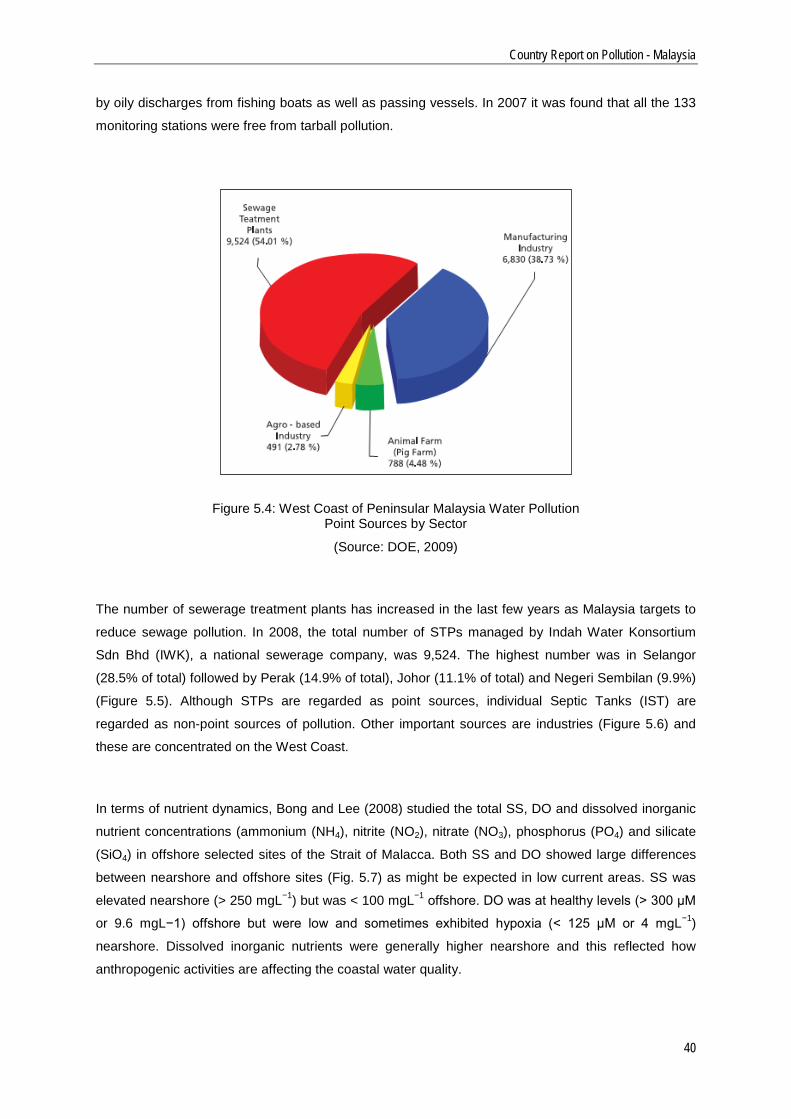
industries, and from animal farms. In 2008, for the West Coast of Peninsular Malaysia, water pollution
point sources comprise of sewage treatment plants (54%), manufacturing industries (39%), animal
farms (4%) and agro-based industries (3%) as shown in Figure 5.4. However, the point sources
counted do not include those activities which are not under the purview of the DOE, such as small
industries and land development activities, as mentioned previously.
The waters around 71 islands are monitored as part of the Marine Island Water Quality Monitoring
Programme. The islands monitored are categorised as development islands (3 islands), resort islands
(25 islands), marine park islands (38 islands) and protected islands (5 islands). A total of 344 samples
were collected and analysed. The main pollutants analysed are total suspended solids, E. coli and oil
and grease. Beaches are also monitored for tarballs. Tarball residues on beaches are usually caused
Country Report on Pollution - Malaysia
40
by oily discharges from fishing boats as well as passing vessels. In 2007 it was found that all the 133
monitoring stations were free from tarball pollution.
Figure 5.4: West Coast of Peninsular Malaysia Water Pollution Point Sources by Sector
(Source: DOE, 2009)
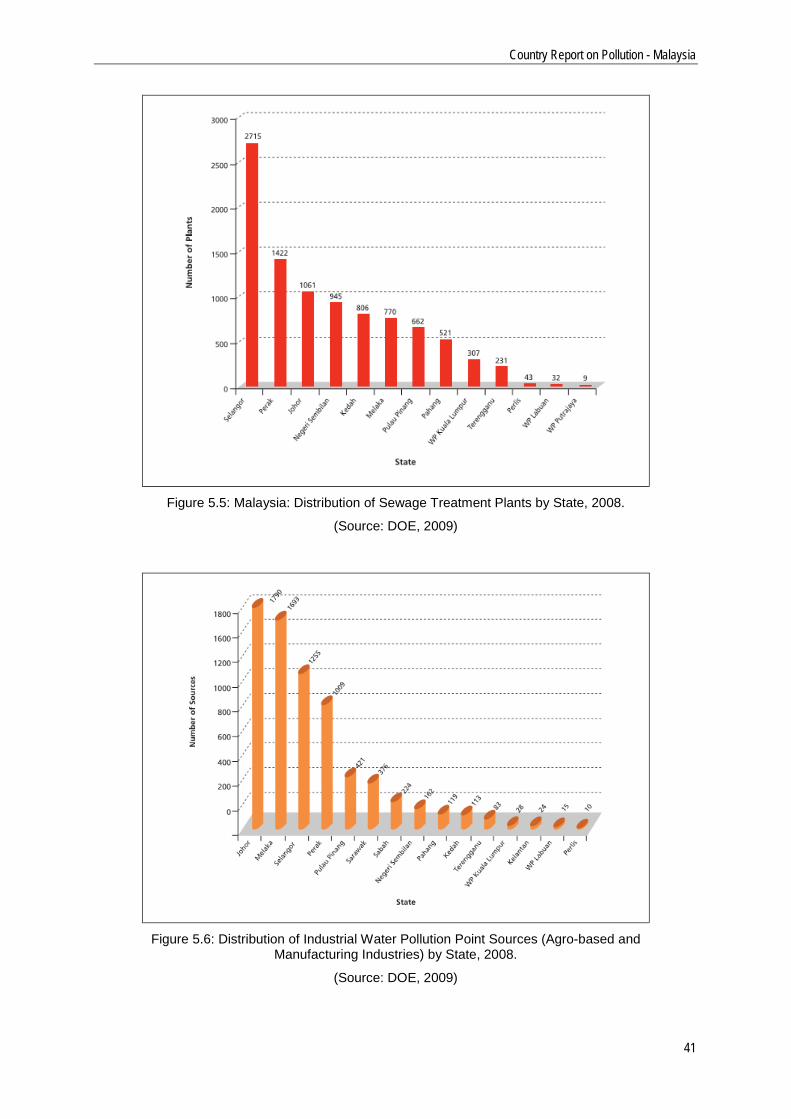
The number of sewerage treatment plants has increased in the last few years as Malaysia targets to
reduce sewage pollution. In 2008, the total number of STPs managed by Indah Water Konsortium
Sdn Bhd (IWK), a national sewerage company, was 9,524. The highest number was in Selangor
(28.5% of total) followed by Perak (14.9% of total), Johor (11.1% of total) and Negeri Sembilan (9.9%)
(Figure 5.5). Although STPs are regarded as point sources, individual Septic Tanks (IST) are
regarded as non-point sources of pollution. Other important sources are industries (Figure 5.6) and
these are concentrated on the West Coast.
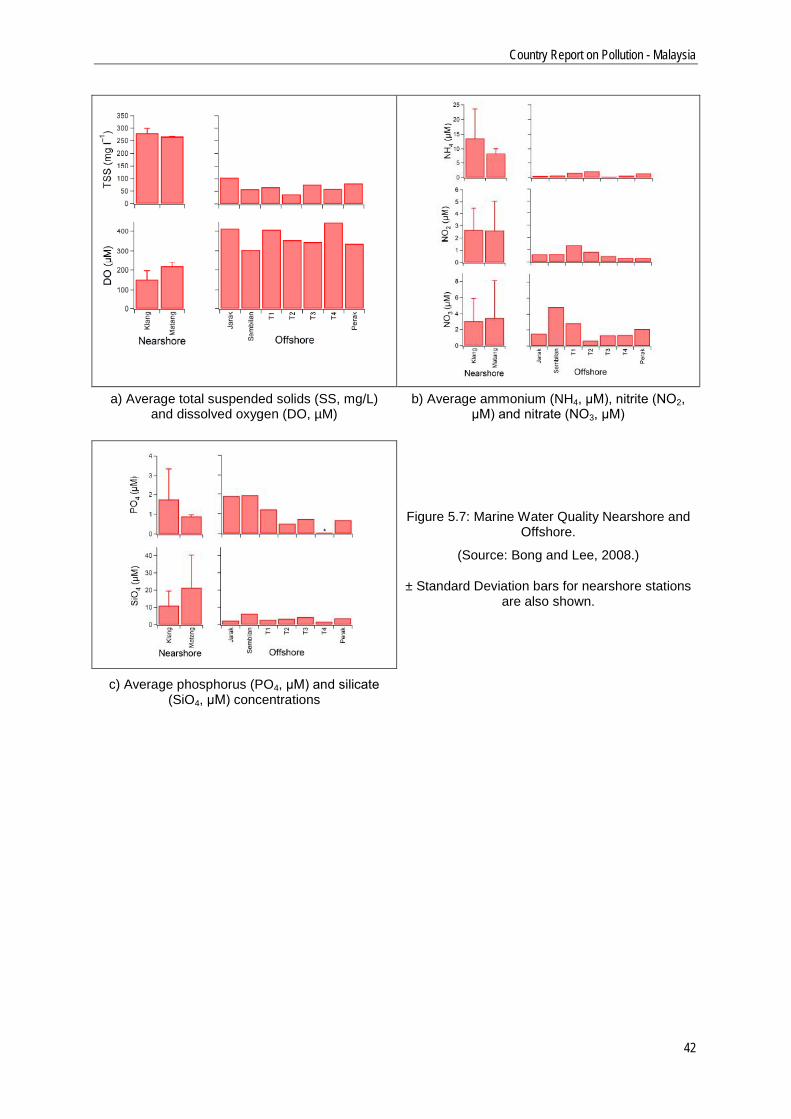
In terms of nutrient dynamics, Bong and Lee (2008) studied the total SS, DO and dissolved inorganic
nutrient concentrations (ammonium (NH4), nitrite (NO2), nitrate (NO3), phosphorus (PO4) and silicate
(SiO4) in offshore selected sites of the Strait of Malacca. Both SS and DO showed large differences
between nearshore and offshore sites (Fig. 5.7) as might be expected in low current areas. SS was
elevated nearshore (> 250 mgL−1) but was < 100 mgL−1 offshore. DO was at healthy levels (> 300 μM
or 9.6 mgL−1) offshore but were low and sometimes exhibited hypoxia (< 125 μM or 4 mgL−1)
nearshore. Dissolved inorganic nutrients were generally higher nearshore and this reflected how
anthropogenic activities are affecting the coastal water quality.
Country Report on Pollution - Malaysia
41
Figure 5.5: Malaysia: Distribution of Sewage Treatment Plants by State, 2008.
(Source: DOE, 2009)
Figure 5.6: Distribution of Industrial Water Pollution Point Sources (Agro-based and Manufacturing Industries) by State, 2008.
(Source: DOE, 2009)
Country Report on Pollution - Malaysia
42
a) Average total suspended solids (SS, mg/L)
and dissolved oxygen (DO, µM)
b) Average ammonium (NH4, μM), nitrite (NO2, μM) and nitrate (NO3, μM)
Figure 5.7: Marine Water Quality Nearshore and Offshore.
(Source: Bong and Lee, 2008.)
± Standard Deviation bars for nearshore stations are also shown.
c) Average phosphorus (PO4, μM) and silicate (SiO4, μM) concentrations
Country Report on Pollution - Malaysia
43
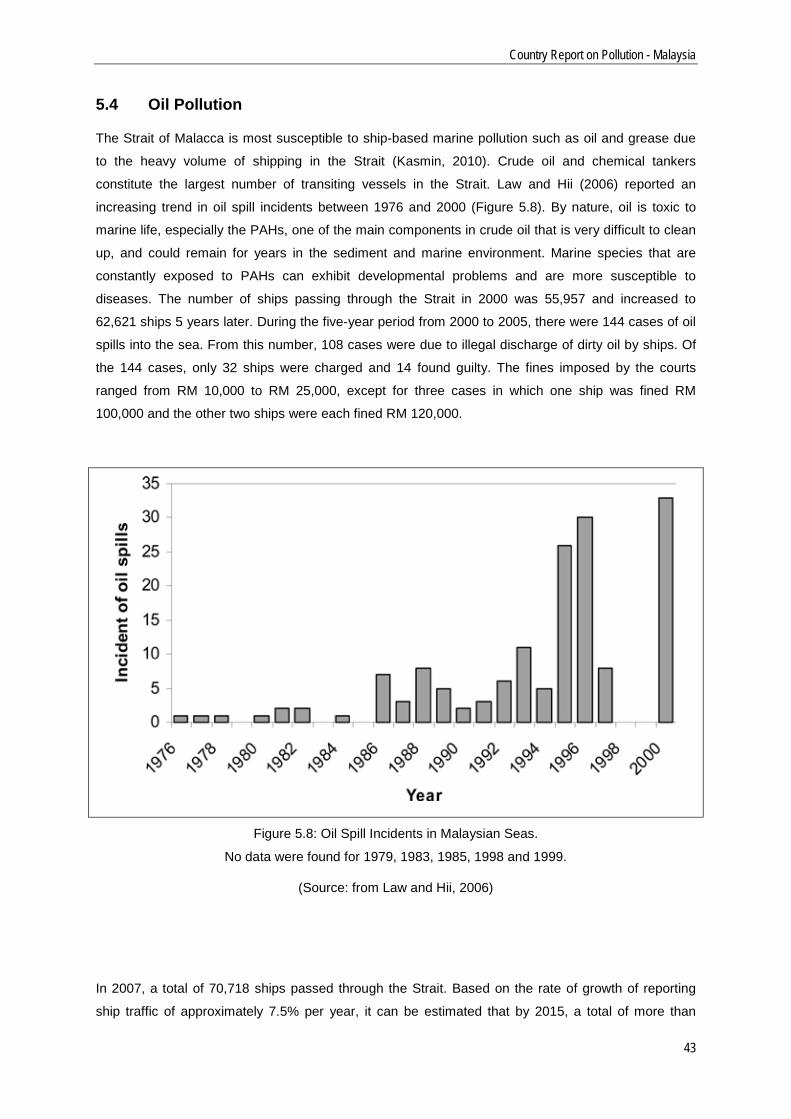
5.4 Oil Pollution
The Strait of Malacca is most susceptible to ship-based marine pollution such as oil and grease due
to the heavy volume of shipping in the Strait (Kasmin, 2010). Crude oil and chemical tankers
constitute the largest number of transiting vessels in the Strait. Law and Hii (2006) reported an
increasing trend in oil spill incidents between 1976 and 2000 (Figure 5.8). By nature, oil is toxic to
marine life, especially the PAHs, one of the main components in crude oil that is very difficult to clean
up, and could remain for years in the sediment and marine environment. Marine species that are
constantly exposed to PAHs can exhibit developmental problems and are more susceptible to
diseases. The number of ships passing through the Strait in 2000 was 55,957 and increased to
62,621 ships 5 years later. During the five-year period from 2000 to 2005, there were 144 cases of oil
spills into the sea. From this number, 108 cases were due to illegal discharge of dirty oil by ships. Of
the 144 cases, only 32 ships were charged and 14 found guilty. The fines imposed by the courts
ranged from RM 10,000 to RM 25,000, except for three cases in which one ship was fined RM
100,000 and the other two ships were each fined RM 120,000.
Figure 5.8: Oil Spill Incidents in Malaysian Seas.
No data were found for 1979, 1983, 1985, 1998 and 1999.
(Source: from Law and Hii, 2006)
In 2007, a total of 70,718 ships passed through the Strait. Based on the rate of growth of reporting
ship traffic of approximately 7.5% per year, it can be estimated that by 2015, a total of more than
Country Report on Pollution - Malaysia
44
125,000 ships can be expected to pass through the Strait. Thus, the number of cases of ships
discharging dirty oil into the sea illegally is expected to increase. Dirty oil discharged illegally by these
ships is one of the sources of marine pollution that threaten the fisheries industries in the Strait of
Malacca. Kasmin (2010) concluded that the responsible agencies monitoring maritime transport in the
Strait are inadequately equipped and trained to deal with the illegal discharge of dirty oil into the sea.
In order to overcome these weaknesses, he proposed several new initiatives.
A marine traffic simulation study by SimPlus Pte Ltd, Singapore,
(http://www.news.gov.sg/public/sgpc/en/media_releases/agencies/mpa/press_release/P-20091028-
2.html), projecting future increase in marine trafffic in the southern portion of the Straits of Malacca
and Singapore, where the TSS applies, concluded that there would be minimal impact from a
doubling of traffic in the Strait of Malacca. The study concluded that the Strait could efficiently and
safely sustain traffic up to five times the 2007 level of 126,000 transits, arrivals and departures. The
model assumed that non-ferry cross-traffic between Malaysia and Indonesia is negligible.
Nevertheless, this computer simulation result may not be in concordance with the views of ships’
captains who physically experience navigation in the Straits in all types of weather conditions and in
the dark at night using radar, with a myriad of smaller vessels traversing under the ship’s bow. Only
the navigation risk of ship to ship collision was evaluated in the study. Based on present records of
between 2000 to 2005, it can be conjectured that a doubling of traffic may result in a doubling of oil
spill incidents, from about 2.4 per month to perhaps more than 4 spills a month, or 1 a week, and
similarly, that a quintupling of traffic may result in 12 spills per month.
The threat of oil spills as a result of accidents has been recognized over the years. Law and Ravinthar
(1989), in early studies of hydrocarbon pollution off the coast of Negeri Sembilan, located about
midway along the Strait of Malacca, concluded that the source of hydrocarbon pollution was likely to
be ship-based rather than land-based. Therefore, we can deduce that there will an increasing number
of oil spill incidents in the Straits. The impacts of oil spills on marine habitats in the Strait, such as the
mangroves, coral reefs, and sea grass beds, are of major concerns (Zakaria and Takada, 2007).
Coral reefs in the straits have been largely affected by years of spills, and recovery has been slow.
There were several major oil spill incidents involving oil tankers in the straits from 1975 to 1997 (Table
5.1). More recent spills (Law and Hii, 2006) are MV Able Ensign (330 L) at Langkawai (1998),
unidentified vessels at Kedah Peir (4 mt) (1998), and Sun Vista (2100 mt) (1999). Although Malaysia
has a relatively short history of industrialization and modernization as compared to the more
established and developed countries, several factors may contribute to petroleum pollution (Zakaria
and Takada, 2007). First, the Malacca Strait is a major international tanker route transporting crude oil
from the Middle East to northeast Asia. Oil spills and tanker accidents are frequent in the straits.
Second, Malaysia itself is an oil producing country and exports crude oil to other countries. Third,
Malaysia is undergoing rapid industrialization, and petroleum is a most important source of energy.
The demand for petroleum has increased very rapidly in the past few decades with increasing
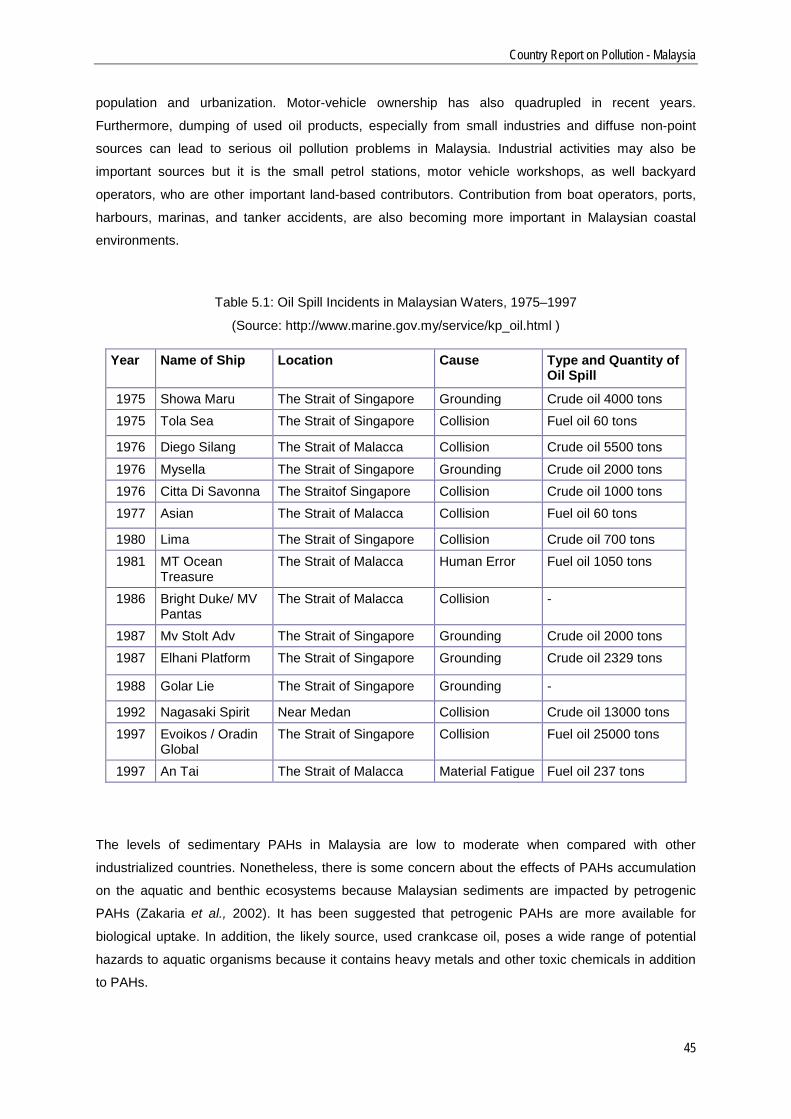
Country Report on Pollution - Malaysia
45
population and urbanization. Motor-vehicle ownership has also quadrupled in recent years.
Furthermore, dumping of used oil products, especially from small industries and diffuse non-point
sources can lead to serious oil pollution problems in Malaysia. Industrial activities may also be
important sources but it is the small petrol stations, motor vehicle workshops, as well backyard
operators, who are other important land-based contributors. Contribution from boat operators, ports,
harbours, marinas, and tanker accidents, are also becoming more important in Malaysian coastal
environments.
Table 5.1: Oil Spill Incidents in Malaysian Waters, 1975–1997
(Source: http://www.marine.gov.my/service/kp_oil.html )
Year Name of Ship Location Cause Type and Quantity of Oil Spill
1975 Showa Maru The Strait of Singapore Grounding Crude oil 4000 tons 1975 Tola Sea The Strait of Singapore Collision Fuel oil 60 tons
1976 Diego Silang The Strait of Malacca Collision Crude oil 5500 tons
1976 Mysella The Strait of Singapore Grounding Crude oil 2000 tons 1976 Citta Di Savonna The Straitof Singapore Collision Crude oil 1000 tons 1977 Asian The Strait of Malacca Collision Fuel oil 60 tons
1980 Lima The Strait of Singapore Collision Crude oil 700 tons 1981 MT Ocean
Treasure The Strait of Malacca Human Error Fuel oil 1050 tons
1986 Bright Duke/ MV Pantas
The Strait of Malacca Collision -
1987 Mv Stolt Adv The Strait of Singapore Grounding Crude oil 2000 tons 1987 Elhani Platform The Strait of Singapore Grounding Crude oil 2329 tons
1988 Golar Lie The Strait of Singapore Grounding -
1992 Nagasaki Spirit Near Medan Collision Crude oil 13000 tons 1997 Evoikos / Oradin
Global The Strait of Singapore Collision Fuel oil 25000 tons
1997 An Tai The Strait of Malacca Material Fatigue Fuel oil 237 tons
The levels of sedimentary PAHs in Malaysia are low to moderate when compared with other
industrialized countries. Nonetheless, there is some concern about the effects of PAHs accumulation
on the aquatic and benthic ecosystems because Malaysian sediments are impacted by petrogenic
PAHs (Zakaria et al., 2002). It has been suggested that petrogenic PAHs are more available for
biological uptake. In addition, the likely source, used crankcase oil, poses a wide range of potential
hazards to aquatic organisms because it contains heavy metals and other toxic chemicals in addition
to PAHs.
Country Report on Pollution - Malaysia
46
5.5 Heavy Metals and Persistent Organic Pollutants (POPs)
Yap et al. (2002) has reported the concentrations of copper (Cu) and lead (Pb) in the offshore and
intertidal sediments of the West Coast of Peninsular Malaysia (Table 5.2). For the off-shore
sediments, the higher metal levels at the islands of Pulau Langkawi and Pulau Pangkor, in the
northern part of the Strait, indicated that the offshore area had started to receive impacts from sea-
based activities. For the intertidal sediment, some elevations of heavy metal levels were found
especially in Bukit Tambun, K. Juru and Kg. Pasir Puteh. The elevated levels of metals could be due
to land-based activities in general. By using mussels (Perna viridis) as a biomonitoring agent, the
contamination of cadmium (Cd), Cu, Pb and zinc (Zn) in the West Coast of Peninsular Malaysia was
found not to be serious (Yap et al., 2004). Since P. viridis accumulates heavy metals in the soft
tissues and constitutes one of the important food-chains in the coastal environment, this information is
therefore useful for predicting any metal contamination in the coastal communities. The heavy metal
concentrations in the mussels from the west coast of Peninsular Malaysia could be attributed to
natural or anthropogenic metal sources affecting their habitats. The ranges of Cu and Pb were low in
comparison to regional data. Some intertidal areas were identified as receiving anthropogenic Cu and
Pb. Although the contamination due to Cu and Pb in the west coast, especially in the offshore areas,
were not serious, regular biomonitoring studies were recommended.
Country Report on Pollution - Malaysia
47
Table 5.2: Concentrations of Cd, Cu, Pb, and Zn in Sediments and Perna viridis
Heavy metal concentration (µg/g)
Parameters Cd Cu Pb Zn
Location of Sediments1
Offshore area, West coast, Peninsular Malaysia 0.25– 13.82 3.59– 25.36
Intertidal area, West coast, Peninsular Malaysia 0.40– 314.80 0.96– 69.80
Malaysian Food Regulation 1985 1.00 30.0 2.00 100
Location of Perna viridis2
Pulau Aman, Penang 0.60–1.42 8.88–13.3 2.50–5.99 61.7–173
Kuala Dinding, Perak 0.74–1.80 4.96–25.1 6.22–0.53 65.2–119
Bagan Lalang, Selangor 0.71–2.14 6.46–10.7 0.68–8.96 75.4–139
Pasir Panjang, Negeri Sembilan 0.63–1.61 8.85–13 4.82–11.2 74.13–135
Kuala Linggi, Negeri Sembilan 0.77–2.11 4.31–12.8 4.95–9.74 66.8–145
Sebatu, Malacca 0.61–1.65 8.89–14.8 4.77–12.3 63.1–89.7
Muar Estuary, Malacca 0.26–1.73 4.74–11.9 1.45–12.4 53.3–97.0
1 - Yap et al., 2002 2 - Yap et al., 2004
Mokhtar et al. (2009) determined and compared the concentration levels of heavy metals Pb, Cd,
nickle (Ni), Cu, iron (Fe), chromium (Cr), manganese (Mn) and Zn in samples of tiger prawns
(Penaeus monodon) and tilapia fish (Oreochromis spp.) obtained from aquaculture ponds in Bandar
and Jugra. Both areas are near the Langat estuary in the state of Selangor. Concentrations of Cd, Cu
and Zn were found to be higher in tiger prawns (Penaeus monodon) in Bandar; whilst only Fe, Mn and
Ni in tiger prawns (Penaeus monodon) was found to be higher in Jugra. Concentrations of Cu, Zn, Cr,
Fe, Mn and Ni were found to be higher in Jugra whereas those of Pb and Cd were higher in Bandar
for tilapia fish (Oreochromis spp.). Concentrations of heavy metals studied were found to be lower
(Table 5.3) than the recommended maximum levels allowed in food. However, though the
concentrations of heavy metals were below the permissible limits, these locations should be given
greater attention since the concentration of heavy metal is highly likely to increase in the future.
Continuous monitoring, of these areas in particular, was recommended. The present data on metals
in the coastal waters are important as baseline information that can be used in monitoring any future
changes of these levels.
Table 5.3: Concentration of Heavy Metals in Cultured Fishes, Langat River Estuary
Country Report on Pollution - Malaysia
48
Metal Tiger Prawn Penaeus monodon
(µg/g)
Tilapia fish Oreochromis spp.
(µg/g)
WHO (1989)
FAO max. limits for
fisha
FAO max limits for prawnb
Bandar Jugra Bandar Jugra (µg/g) Pb nd* nd* 0.418
± 0.090 0.395
± 0.024 2 0.5 - 6.0 -
Cd 0.254 ± 0.070
0.254 ± 0.125
0.015 ± 0.002
0.006 ± 0.002
1 0.05 - 5.50 0.2
Ni 0.026 ± 0.000
0.122 ± 0.000
0.053 ± 0.015
0.113 ± 0.021
0.5 - 1.0 - -
Cu 3.567 ± 0.208
2.213 ± 0.103
0.313 ± 0.0408
0.323 ± 0.022
30 10 -100 10
Fe 5.170 ± 0.297
7.210 ± 0.297
2.880 ± 0.085
5.075 ± 0.167
100 - -
Cr nd*
nd*
0.712 ± 0.083
0.813 ± 0.071
50 1 -
Mn 0.177 ± 0.001
0.193 ± 0.008
0.108 ± 0.010
0.203 ± 0.040
1 - -
Zn 13.030 ± 0.608
11.270 ± 0.099
1.915 ± 0.061
2.364 ± 0.074
100 3 -100 1000
nd*= Not Detected, a – Nauen,1998 , b - Pourang et al., 2005
Source: Mokhtar et al., 2009
The concentration of several toxic substances or POPs in marine matrices and shellfish has been
detected and their quantities evaluated by several scientists (Law and Ravinthar (1989); Wood et al.
(1999); Moradi et al.(1999); Zakaria et al., (2002); Law and Yeong (1989)) and reviewed by Somchit
et al. (2009). The compounds include PAHs, pesticides, polychlorinated biphenyls (PCBs) and dioxine
and furan. The results are summarized in Table 5.4 adapted from Somchit et al. (2009). This shows
that the main hydrocarbons detected in Malaysia waters are mainly polycyclic aromatic hydrocarbons
(PAHs). The results show there is higher concentration of PAHs in the urbanization and
industrialization locations indicating land-based oil pollution sources. For marine-based sources, Law
(1994) stated that the single largest contributor of oil spill from transportation activities has been
identified to be from tanker operation associated with ballasting the tanks for the return voyage from
ports of discharge.
Studies by Zakaria et al., (2002) on the distribution of PAHs in sediments from rivers and estuaries in
in the West Coast of Peninsular Malaysia and the Strait of Malacca found concentration of PAHs (3-7
rings) ranging between 4 to 924 ng/g. The study also identified two major routes of petrogenic PAH
pollution input into the aquatic environment. The first is through spillage and dumping of waste
crankcase oil and secondly through leakage of crankcase oils from vehicles onto road surface which
are subsequently washed out by street runoff. They concluded that petrogenic input (from used
crankcase oil and input from street dust and traffic sources) was a major control on the PAHs
contamination and that the Malaysian aquatic environments have been more heavily impacted by
petrogenic input than have those of the industrialized countries. The concentrations of hydrocarbons
Country Report on Pollution - Malaysia
49
are wide ranging from urban rivers to open ocean. The concentrations of hydrocarbons in
environmental samples (sediment, water and mussel) collected near major townships were generally
higher than those from rural samples. One may conclude that the hydrocarbon concentration - mainly
PAHs - in Malaysian waters is still low to moderate compared with other developed countries (Zakaria
et al., 2002).
Table 5.4: Hydrocarbons in Malaysian waters
Matrix (unit) Location Hydrocarbon Concentration Source in
Somchit et al., 2009
Water (mg/L)
Strait of Malacca coastal waters, off Penang 10 - 120 Phang et al., 1980
Strait of Malacca, near shore off Port Dickson 2.52 - 73.34 Law and Veelu, 1989
Strait of Malacca nearshore waters off Port Dickson 14.69 - 150.28 Law and Yeong, 1989
Sediments (mg/kg)
Rivers leading to the Strait of Malacca 20 - 924 (PAHs)
Zakaria et al., 2002 Klang River estuary 19 - 431 (PAHs)
Klang coast (inshore) 9 - 39 (PAHs)
Strait of Malacca (offshore) 4 - 73 (PAHs)
Estuarine zone for the whole Strait of Malacca
150.61 (oil and grease)
Wood et al., 1999
0.81 (total aliphatic hydrocarbons)
3.14 (PAHs)
2.5 (PCB)
Island zone for the whole Strait of Malacca
73.92 (oil and grease)
0.44 (total aliphatic hydrocarbons)
1.84 (PAHs)
0.83 (PCB)
Strait of Malacca nearshore waters, off Port Dickson 2.1 -70.4 (dry wt.) Law and Veelu, 1989
Strait of Malacca, coastal waters, off Port Dickson 21.73- 77.06 dry wt. Law and Yeong, 1989
Mussel (mg/kg)
Fish cages, Langkawi 8.46 (PAHs)
Moradi et al., 1999
Kuala Perlis 48.08 (PAHs)
Tanjung Dawai, Kedah 5.43 (PAHs)
Penang 17.74 (PAHs)
Bagan Lalang, Selangor 8.94 (PAHs)
Lukut, Negeri Sembilan 8.36 (PAHs)
Pasir Panjang 8.36 (PAHs)
Adapted from Somchit et al., 2009
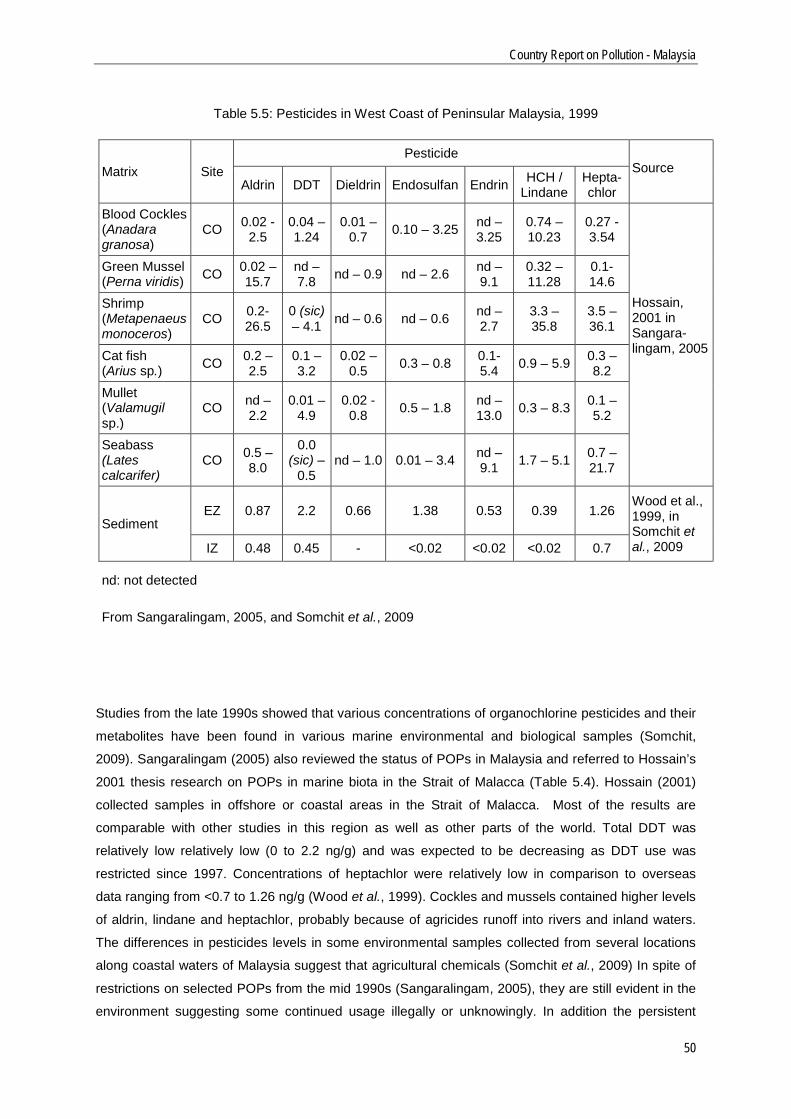
Country Report on Pollution - Malaysia
50
Table 5.5: Pesticides in West Coast of Peninsular Malaysia, 1999
Matrix Site Pesticide
Source Aldrin DDT Dieldrin Endosulfan Endrin HCH /
Lindane Hepta-chlor
Blood Cockles (Anadara granosa)
CO 0.02 - 2.5
0.04 – 1.24
0.01 – 0.7 0.10 – 3.25 nd –
3.25 0.74 – 10.23
0.27 - 3.54
Hossain, 2001 in Sangara-lingam, 2005
Green Mussel (Perna viridis) CO 0.02 –
15.7 nd – 7.8 nd – 0.9 nd – 2.6 nd –
9.1 0.32 – 11.28
0.1-14.6
Shrimp (Metapenaeus monoceros)
CO 0.2-26.5
0 (sic) – 4.1 nd – 0.6 nd – 0.6 nd –
2.7 3.3 – 35.8
3.5 – 36.1
Cat fish (Arius sp.) CO 0.2 –
2.5 0.1 – 3.2
0.02 – 0.5 0.3 – 0.8 0.1-
5.4 0.9 – 5.9 0.3 – 8.2
Mullet (Valamugil sp.)
CO nd – 2.2
0.01 – 4.9
0.02 - 0.8 0.5 – 1.8 nd –
13.0 0.3 – 8.3 0.1 – 5.2
Seabass (Lates calcarifer)
CO 0.5 – 8.0
0.0 (sic) –
0.5 nd – 1.0 0.01 – 3.4 nd –
9.1 1.7 – 5.1 0.7 – 21.7
Sediment EZ 0.87 2.2 0.66 1.38 0.53 0.39 1.26
Wood et al., 1999, in Somchit et al., 2009 IZ 0.48 0.45 - <0.02 <0.02 <0.02 0.7
nd: not detected
From Sangaralingam, 2005, and Somchit et al., 2009
Studies from the late 1990s showed that various concentrations of organochlorine pesticides and their
metabolites have been found in various marine environmental and biological samples (Somchit,
2009). Sangaralingam (2005) also reviewed the status of POPs in Malaysia and referred to Hossain’s
2001 thesis research on POPs in marine biota in the Strait of Malacca (Table 5.4). Hossain (2001)
collected samples in offshore or coastal areas in the Strait of Malacca. Most of the results are
comparable with other studies in this region as well as other parts of the world. Total DDT was
relatively low relatively low (0 to 2.2 ng/g) and was expected to be decreasing as DDT use was
restricted since 1997. Concentrations of heptachlor were relatively low in comparison to overseas
data ranging from <0.7 to 1.26 ng/g (Wood et al., 1999). Cockles and mussels contained higher levels
of aldrin, lindane and heptachlor, probably because of agricides runoff into rivers and inland waters.
The differences in pesticides levels in some environmental samples collected from several locations
along coastal waters of Malaysia suggest that agricultural chemicals (Somchit et al., 2009) In spite of
restrictions on selected POPs from the mid 1990s (Sangaralingam, 2005), they are still evident in the
environment suggesting some continued usage illegally or unknowingly. In addition the persistent
Country Report on Pollution - Malaysia
51
organochlorine pesticide, DDT, although restricted in 1997, is still remaining in the aquatic
environment.
The DOE introduced a voluntary Enironmentally Hazardous Substances Notification and Registration
Scheme in January 2009. The DOE is moving toward a Malaysian Chemicals Register and making
the scheme mandatory. The voluntary period for registration is an opportunity for industry to prepare
itself for the mandatory reporting. However, so far only 320 out of a total of 1134 identified potential
companies have registered for the scheme, indicating lack of industry awareness or preparedness.
PCBs can enter into the marine environment through waste disposal. PCB is listed as a scheduled
material and its disposal is controlled unter the EQA 1974. Sangaralingam (2005) had reviewed the
sources of PCBs and reported that the hazardous waste treatment operator, Kualiti Alam, had
received and incinerated a total of 40.21 mt of PCB wastes from 15 waste generators, between 1998
and 2003. Prior to this PCB wastes had been exported for treatment. However, PCBs could also enter
into the environment through equipment and material disposal to dumpsites. Based on analysis of the
typical solid waste composition in dumpsites, it was estimated that between 20% and 40% could be
potentially PCB-containing equipment and materials. Countrywide there are more than 170 closed
and open dumpsites that could pose potential PCB contamination sources.
There is no complete inventory of dioxins or sources and environmental levels of dioxins and furans in
Malaysia although some estimates and measurements have been made. Sangaralingam (2005)
noted that despite some of the reservations on the application of the UNEP Dioxin Toolkit for
Malaysia, it was used by Dr. Md. Sani Ibrahim, Universiti Sains Malaysia, to estimated the total
amount of dioxins and furans released in Malaysia in 2001. For waste incineration processes the
amount of dioxins and furans released was estimated to be 15.14 g TEQ, while the release estimated
for seven major cement production activities was 2.11 g TEQ/year. The amount released by transport
was estimated at 19.20 g TEQ/year.
In 2002, the Japanese Offspring Fund, in collaboration with the Consumers Association of Penang
(CAP), detected dioxin-related compunds from all soil samples collected from municipal wastes
dumping sites of (Sangaralingam, 2005). High levels of coplanar PCBs were found in more urban
areas such as Kuala Lumpur and Penang. Relatively high TEQs (2,3,7,8-TCDD toxic equivalents),
exceeding the Japanese standard, were found in soils from a dumping site in Selangor with levels at
3,100 pg/g and 50 pg/g on a dry weight basis. TEQs in soils from Kedah were 7.8 – 48 pg/g (dry
weight); Penang were 10-16 pg/g; with the lowest TEQs being found in soils from a controlled
dumping site in Kuala Lumpur. The mass formation of dioxin-related compounds was related to waste
combustion in the sites.
Country Report on Pollution - Malaysia
52
5.6 Harmful Algal Blooms
Harmful algal blooms are the result of the rapid population growth of a few dozen phytoplankton and
cyanobacteria that create potent toxins given the right conditions. These toxins can result in harm to
other organisms including illness and mortality in humans through consumption of the affected
organisms. In Malaysia only paralytic shellfish poisoning (PSP) has been recorded as a harmful algal
bloom (HAB) related shellfish poisoning. Reports of HAB have started since the mid 1970s but the
incidences had been confined to Sabah. The first report of PSP in the Strait of Malacca was in 1991,
when three people were poisoned after consuming mussels from Sebatu, Malacca. It was only in
1997 that the most likely toxin producer causing these fatalities was identified as a dinoflagellate,
Alexandrium tamiyavanchii (Usup et al., 2002). Dinoflagellates constitute only a small fraction of the
total phytoplankton population (Anton et al., 1995).
In a coastal survey at Sebatu and Sungai Rambai Malacca, Mohammad Noor (1998) identified 35
species of dinoflagellates, 10 of which could be potential HAB species. In a recent presentation at the
Kelantan Health Conference 2011, in June, Professor Gires Usup of Universiti Kebangsaan Malaysia,
identified three areas along the Strait where potential HAB species had been found (Usup, 2011)
(Table 5.6).
It has been speculated that a possible cause of algal bloom in the Strait is the introduction of harmful
toxic species through ship deballasting (Chua et al., 2000; Usup et al., 2002). With the increasing
organic and nutrient wastes discharged in to the slow moving Strait of Malacca, environmental
conditions may be suitable for algal blooms to occur in enclosed water bodies.
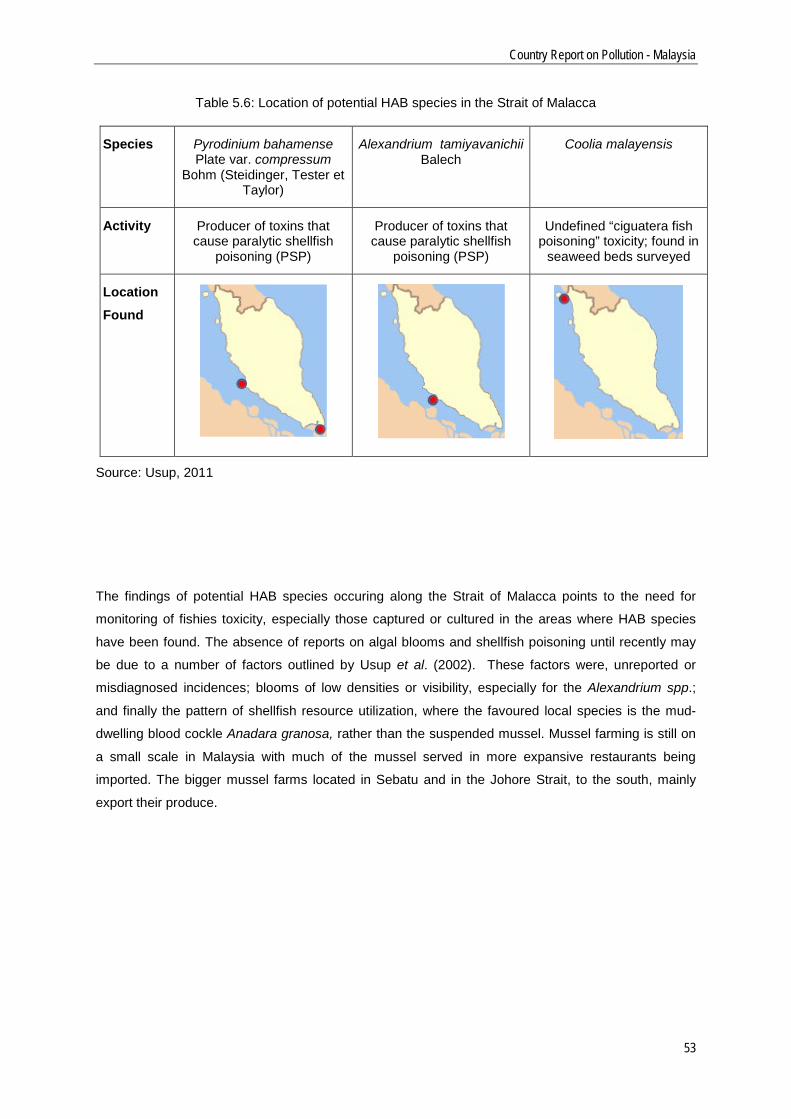
Country Report on Pollution - Malaysia
53
Table 5.6: Location of potential HAB species in the Strait of Malacca
Species Pyrodinium bahamense Plate var. compressum
Bohm (Steidinger, Tester et Taylor)
Alexandrium tamiyavanichii Balech
Coolia malayensis
Activity Producer of toxins that cause paralytic shellfish
poisoning (PSP)
Producer of toxins that cause paralytic shellfish
poisoning (PSP)
Undefined “ciguatera fish poisoning” toxicity; found in
seaweed beds surveyed
Location Found
Source: Usup, 2011
The findings of potential HAB species occuring along the Strait of Malacca points to the need for
monitoring of fishies toxicity, especially those captured or cultured in the areas where HAB species
have been found. The absence of reports on algal blooms and shellfish poisoning until recently may
be due to a number of factors outlined by Usup et al. (2002). These factors were, unreported or
misdiagnosed incidences; blooms of low densities or visibility, especially for the Alexandrium spp.;
and finally the pattern of shellfish resource utilization, where the favoured local species is the mud-
dwelling blood cockle Anadara granosa, rather than the suspended mussel. Mussel farming is still on
a small scale in Malaysia with much of the mussel served in more expansive restaurants being
imported. The bigger mussel farms located in Sebatu and in the Johore Strait, to the south, mainly
export their produce.
Country Report on Pollution - Malaysia
54
6 Gaps and Challenges
6.1 Governance Infrastructure
The formation of the Ministry of Natural Resources and Environment might have been expected to
enhance the likelihood of integration, as previously many of the agencies were under different
ministries. An important development was the formation of the MMEA which is intended to align the
powers and enforcement. The MMEA is intended to be the only authority on law enforcement at sea
(MMEA, 2010). The handover process took some time, however, due to the nature of readjustment
needed in terms of the legal and administrative structures to be put in place, not to mention
manpower development. The institutional infrastructure model needed to be improved for effective
enforcement.
Kasmin (2010) had identified five main factors which would have to be be considered for effective
enforcement. The first was the scope of responsibility and availability of assets, both human and
physical, given to the DOE in enforcement of the EQA at sea. There was a mismatch between
responsibility and assets, so the DOE had to rely on other agencies which were then delegated to
enforce the EQA 1974 at sea.
The second factor was the need for alignment and consolidation of the many different laws in the
maritime areas and the different agencies given responsibility to enforce them. For example, the
Fishery Department enforces the Fisheries Act 1985; the Royal Customs and Excise Department
enforces the Custom Act 1967; the Marine Department enforces the Merchant Shipping Ordinance
1952; the Royal Malaysian Navy is delegated to enforce the Fisheries Act 1985, the Exclusive
Economic Zone Act 1984 and the Environmental Quality Act 1986. The Marine Operation Force of the
Royal Malaysian Police has the power to enforce 19 Acts. The various agencies delegated with the
power to enforce at sea still have their own tasks to perform. Most of them have insufficient
manpower and assets to perform even their own tasks. Hence, enforcement of the EQA was not a
priority task to them, and would only be performed on an opportunity basis. The MMEA had the power
to enforce all law and order under any federal law, however, as the other agencies were still
conducting their own enforcement activities, the MMEA was perceived as being simply another law
enforcement agency. It was only in September 2011, that all the agencies finally delegated their
powers to the MMEA. All physical assets, such as ships, equipment, and bases, were also transferred
and staff were given the option to transfer to the MMEA.
The importance of this move cannot be underestimated. Previously, in terms of asset allocation, for
example, the MMEA had only about 14 vessels to monitor the Strait of Malacca, an area of about
26,534 square nautical miles. Assuming normal ship maintenance procedures, a maritime agency
would have only about 50 percent of its assets available to carry out operations at sea at any one time
Country Report on Pollution - Malaysia
55
of the year. Hence, the MMEA may only have been able to have available about 7 vessels, to perform
law enforcement in the Strait of Malacca. Considering the total area to be monitored, it was unlikely
that it would have been able perform its task effectively.
The third factor relates to pollution detection at sea. In terms of oil slick detection, it is only the aircraft
acquired by the MMEA which has the capability to do so during day and night; and to land on the
water to collect the oil samples. However, the aircraft can only land on the water safely under good
weather conditions, and it cannot stop the suspected source ship. It still has to rely on the availability
of other ships to take this action.
The fourth factor is the long and cumbersome process involved in prosecuting and apprehending
vessels. If a vessel is suspected of polluting sea water with oily discharge, a sample must be taken
immediately and the suspected vessel has to be apprehended and brought to the nearest port for
investigation. Oil samples also have to be taken from the various parts of the ship. All the samples
have to be taken immediately for analysis. Any delay could make the samples worthless. The analysis
must be by the Department of Chemistry. The process is convoluted because of the many different
steps which need to be taken. As detection of suspected illegal discharge is made by surveillance
aircraft in most cases, the pilot would first make a report on return to base. The DOE would then make
arrangements for investigating officers to go to the scene to take samples. If there is no ship
immediately available to take the officers to the scene of discharge, there could be further delay, and
this may allow the suspected ship to move away from the scene. Even if a ship is available, it may
face difficulties to apprehend the suspected ship. The worst case scenario would be that the available
ship has no trained personnel, no proper sampling facilities onboard, or could only arrive at the scene
after daylight hours.
The fifth factor is time. Time and space are the critical constraints for ships and tankers. Even a day’s
delay means additional costs. Even if the ship was apprehended, it may take days to take the
necessary oil samples and this can be unacceptable, especially if the ship is subsequently not been
proven to have violated the law. Thus, law enforcement officers can be reluctant to detain a ship
unless other corroborating evidence are available.
With all these factors in play, it really requires a focused and concerted effort, and provision of strong
leadership, to implement the measures in the time scale which might be required to affect the change
needed. As it is, there are many heads and many stakeholders, each putting forth for their respective
viewpoints. But, that is the nature of the coast - many resources, many users, and, many times,
conflict.
Country Report on Pollution - Malaysia
56
6.2 Knowledge and Human Resources Management
Currently, although there is a ready network of monitoring water quality and river discharge, as well as
of tide levels, there is still lack of data integration. Each agency has its own network of stations and
often these are not consistent with the station locations of other agencies. This is not unexpected as
each agency carries out monitoring for specific purposes related to its function. Thus, data about
water quality status in the Strait of Malacca and the processes and factors affecting them are
dispersed among these agencies, as well as among the government research institutes, university
researchers, and non-governmental bodies. There is a knowledge integration gap as there are
different agencies interested in different aspects of the coastal and marine environment. This creates
a challenge for effective planning and management of Malaysia’s ocean resources.
There had been discussion of forming a central repository of marine data since the early 1990s. The
National Oceanographic Directorate had officially proposed the establishment of a National Institute of
Oceanography under the 10th Malaysia Plan (2011-2015). As part of the early steps toward data
integration the Directorate had established the Malaysian National Oceanography Data Centre
(MyNODC) (http://sdi.mynodc.gov.my) in July 2010. The development model of the Institute is in the
planning stage is expected to form part of the national agenda on ocean research. This institute is
expected to link together the university marine research centres of excellence with international ocean
data agencies.
The issue of knowledge management is related with human resources development. In his New Year
ministerial address, 2012, the Malaysian Minister of Higher Education lamented the declining interest
among high school students for science and mathematics, which continued into university. This could
hamper the government’s Science and Technology Human Capital Direction Plan 2020 target for at
least 60% of high school student participation in science. Malaysia's position in R&D compared to
Australia and Hong Kong for example is not encouraging (Figure 6.1). Malaysia has lagged behind
neighbouring countries in this area in recent years. This affects the outlook for capacity development
for marine resources management.
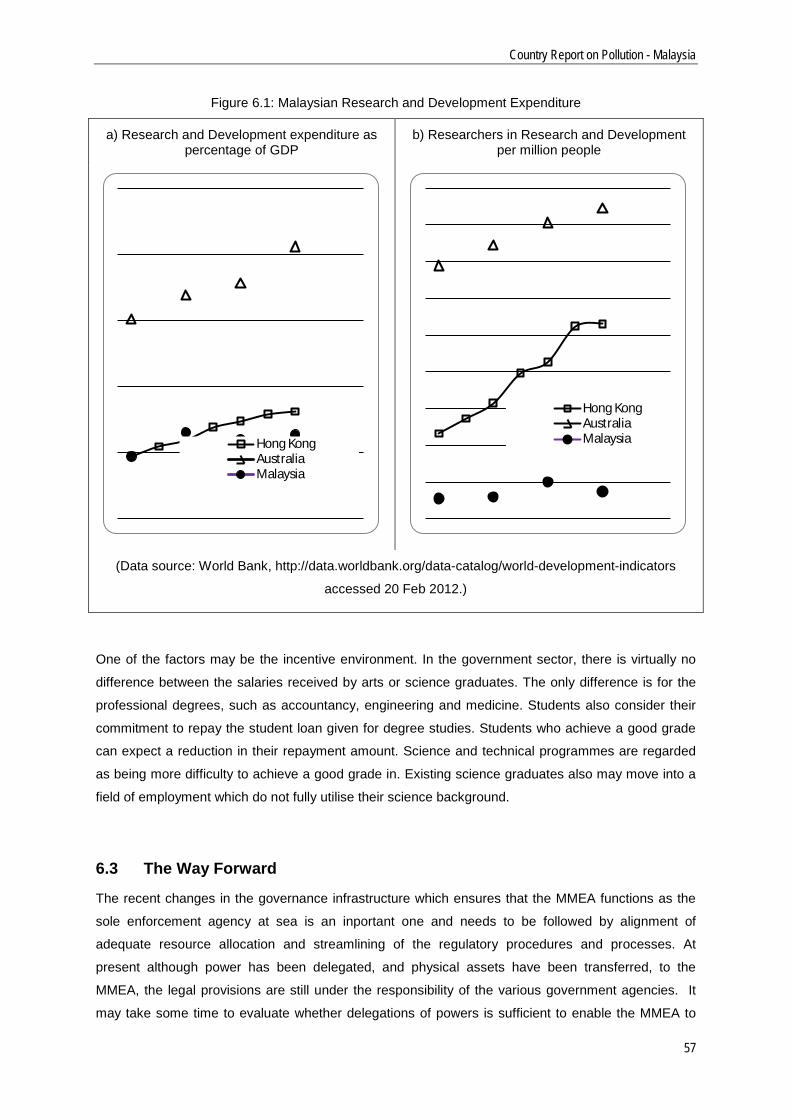
Country Report on Pollution - Malaysia
57
Figure 6.1: Malaysian Research and Development Expenditure
a) Research and Development expenditure as percentage of GDP
b) Researchers in Research and Development per million people
(Data source: World Bank, http://data.worldbank.org/data-catalog/world-development-indicators
accessed 20 Feb 2012.)
One of the factors may be the incentive environment. In the government sector, there is virtually no
difference between the salaries received by arts or science graduates. The only difference is for the
professional degrees, such as accountancy, engineering and medicine. Students also consider their
commitment to repay the student loan given for degree studies. Students who achieve a good grade
can expect a reduction in their repayment amount. Science and technical programmes are regarded
as being more difficulty to achieve a good grade in. Existing science graduates also may move into a
field of employment which do not fully utilise their science background.
6.3 The Way Forward
The recent changes in the governance infrastructure which ensures that the MMEA functions as the
sole enforcement agency at sea is an inportant one and needs to be followed by alignment of
adequate resource allocation and streamlining of the regulatory procedures and processes. At
present although power has been delegated, and physical assets have been transferred, to the
MMEA, the legal provisions are still under the responsibility of the various government agencies. It
may take some time to evaluate whether delegations of powers is sufficient to enable the MMEA to
Hong KongAustraliaMalaysia
Hong KongAustraliaMalaysia
Country Report on Pollution - Malaysia
58
take over the task which had been undertaken by the five or more agencies previously. There need to
be sufficient training given to the MMEA officers as well as not all the staff from the various agencies
have transferred across. This training is fundamental in order to provide the support for the
responsibilities given to the MMEA.
In terms of knowledge management, in order to improve the management of water quality and reduce
marine pollution both from land and sea-based sources, there must be mapping of existing and
missing knowledge. The relevant agencies or bodies who have the best potential to fill in the
knowledge gaps also should be identified. There needs to be awareness of the differentiation
between the type or scope of authority of the body, for example, for policy formulation and
coordination, enforcement, resource management, project implementation, technical expertise,
advisory, or research and knowledge generation. Training programmes need to implemented to
provide understanding not only for the general public, but also at intra-agency and inter-agency levels
on the roles and responsibilities by the different sectors related to the marine environment.
The Ministries of Education and Higher Education are taking action in order to improve the ratio of
students taking science and technical subjects as part of realising the Science and Technology
Human Capital Direction Plan 2020. In addition to this, however, there needs to be inclusion of
education modules on the coastal and marine environment, comprising topics such as maritime
geography, current circulations, the role of the oceans in the transport of materials, marine food and
pharmaceutical resources, within the education curriculum. This is because, although Peninsular
Malaysia and Sabah and Sarawak are almost surrounded by seas, the marine environment has been
taken for granted, and there is little realisation of the impact of development on the coastal and
marine resources. The general public see marine resources as being associated with low income
artisanl fisheries, recreational areas, rural villages, and undervalue their worth. The effect is felt only
indirectly to them as fish prices increase, fish size decreases and supply becomes erratic.
The NOD is moving in the right direction in trying to develop an integrated data centre. This requires
buy-in from the many stakeholders in the country. A data centre is only one step required to unleash
the potential for research and development. At present although the sector of ”Sea to Space” is
recognised as a fundable component, there are few large scale integrative projects funded. The NOD
is developing the national blueprint on ocean affairs soon and this is something that researchers and
agencies will forward to in order to provide the framework for future action.
The challenges faced by Malaysia are possibly also faced by other countries in the BOBLME region is
varying degrees. For each country is is important to ensure that different agencies working on the
marine environment have a common understanding of the terms and regulations governing national
and international interactions. This common understanding should not be of the governance
infrastructure but also of the marine ecosystem parameters and pollution indicators of common
interests. An example where regional groups have cooperated is the Association of Southeast Asian
Country Report on Pollution - Malaysia
59
Nations (ASEAN) Working Group on Coastal and Marine Environment which overseas technical and
implementation issues approved by the ASEAN Ministries concerned. This working group oversaw the
development of the Marine Water Quality Criteria for the ASEAN Region, the ASEAN Criteria for
National Marine Protected Areas, and the ASEAN Criteria for Marine Heritage Areas, which were
adopted by the ASEAN environment ministers. Probably the most important success factor for the
working group is the strong commitment of senior ministerial officials to the development of common
standards and guidelines.
The development of common terms and methodology is also a foundation to developing a common
understanding of the processes at work in the Bay of Bengal which affects all the countries in
BOBLME. For Malaysia, there is a perceived disconnect between the Strait of Malacca and the Bay of
Bengal area which is located beyond the Andaman Sea. However, the Bay of Bengal influence into
the Strait is felt through the transport of water and materials by current movements (Wyrtki, 1961).
More recently, the dramatic effect of the 2004 Acheh earthquake and the tsunami which emanated
from the Andaman Sea has awoken public awareness of the seas beyond the island of Langkawi in
Kedah. In addition there is increasing interest in river water quality and pollutant loading in to the
coastal seas. For Malaysia and Indonesia who share the Malacca Strait this issue is expected to be
increasingly a concern with rising population and increasing economic activity. It is this awareness
that will generate interest and eagerness to understand the transboundary issues among senior
officials. It is this type of interest that is so important in order to obtain strong and committed support
for regional discourse. Recommendations for action among the littoral states need to be based on
knowledge of the processes and forecasted conditions, thus the BOBLME countries need to work
together in order to pool resources and integrate knowledge the impacts of human activities on the
coastal zone.
Country Report on Pollution - Malaysia
60
References
Anton, A., M. Kusnan, F.M. Yusoff, and E.S. Ong, 1995. Nutrient Enrichment Studies in a Tropical
reservoir: The Effect of N:P Rations on Phytoplankton Populations. In, K.H. Timotius, and F.
Goltenboth (eds), Tropical Limnology, Vol II: 179 – 185.
Bong C.W and C.W. Lee, 2008. Nearshore and Offshore Comparison of Marine Water Quality
Variables Measured During SESMA 1. Malaysian Journal of Science 27 (3): 25-31.
Bujang, J.S., M.H. Zakaria, and A. Arshad, 2006. Distribution and significance of seagrass
ecosystems in Malaysia. Aquatic Ecosystem Health and Management, 9(2), 203-214.
Chong, V.C., 2006. Sustainable utilization and management of Mangrove ecosystems of Malaysia.
Aquatic Ecosystem Health & Management 9: 249 - 260
Chua, T.E., R.L.G. Ingrid, R. Adrian, R.B. Stella, B. Gervacio and M.C. Ebarvia, 2000. The Malacca
Straits. Mar. Pollut. Bull., 41: 160-178.
DOE, 2010. Malaysia Environmental Quality Report 2010. Department of Environment, Ministry of
Natural Resources and Environment, Putrajaya.
DOE, 2009. Malaysia Environmental Quality Report 2008. Department of Environment, Ministry of
Natural Resources and Environment, Putrajaya.
Department of Fisheries. 2010. The 70’s to present day. http://www.dof.gov.my/web/guest/421
accessed 20 May 2010.
Hii, Y.S., Law, A.T., Shazili, N.A.M., Rashid, M.K.A., Lokman, H.M., Yusoff, F.M. and Ibrahim, H.M.
2006. The Strait of Malacca: hydrological parameters, biological oxygen demand and total suspended
solids. Journal of Sustainability Science and Management. 1(1):1-14.
http://journal.umt.edu.my/PDF/The_Straits_of_Malacca.pdf accessed 26 May 2010.
Country Report on Pollution - Malaysia
61
Hossain, M.M. 2001. Fate Of Organochlorine Pesticide (OCPs) Residues In Sediment And In The
Marine Food Chain. Ph D. Dissertation, Universiti Sains Malaysia.
Ibrahim, Z.Z. and T. Yanagi, 2006. The influence of the Andaman Sea and the South China Sea on
water mass in the Malacca Strait. La Mer, 43-44 (4-1):33-42.
Ismail A. K., R. M. Noordin, Abu Talib A. and Junaidi C. A., 2003. The Pressure on the Marine
Environment and its Living Resources in the Eastern Corridor of the Straits of Malacca. In Verlaan,
P.A. (ed.). Report of the First Regional Workshop of the Bay of Bengal Large Marine Ecosystem
Programme. Pattaya, Thailand, 17-21 February, 2003. BOBLME, Report No.1, Chennai, India, in two
Volumes; Vol.1: pages 40, Vol.2: pages 134, pp90-96.
http://www.fao.org/fi/oldsite/BOBLME/website/files/49-131.pdf accessed 30 May 2010.
JPBD. 2009. National Physical Plan. Town and Country Planning Department, Peninsular Malaysia.
Ministry of Housing and Local Government. Kuala Lumpur.
Kamaruzaman, R. M., 1998. Navigational Safety In The Strait Of Malacca. Singapore Journal of
International & Comparative Law 2: 468 – 485.
Kasmin, S., 2010. Enforcing Ship-Based Marine Pollution for Cleaner Sea in the Strait of Malacca.
Environment Asia 3 (Special Issue) 61-65.
Khor, H.M., and S.N.S. Obid, 2006. Economic instruments and their potential in conserving the
Malaysian coastal zone. Ocean & Coastal Management, 49: 727-738.
Law A.T. ,and Y.S. Hii, 2006. Status, impacts and mitigation of hydrocarbon pollution in the Malaysian
seas, Aquatic Ecosystem Health & Management, 9(2): 147-158.
,
Law, A.T. and V. Ravinthar, 1989. Petroleum Hydrocarbon along the Coastal Areas of Port Dickson.
Pertanika 12(3) 349-355.
Law, A.T. and C.H. Yeong, 1989. Petroleum hydrocarbons in the water and sediment of Port Dickson
coastal waters, Straits of Malacca. Proceedings of the 12th Annual Seminar of the Malaysian Society
of Marine Science, Nov. 18, University Malaya.
Country Report on Pollution - Malaysia
62
Law, A.T., 1994. Oil pollution in the Malaysian Seas. Malaysian Fish. Soc., 6: 5-23.
Malaysian Marine Department, 2010. http://www.marine.gov.my/ accessed 29 May 2010.
Malaysian Meteorological Department, 2010. General Climate of Malaysia.
(http://www.met.gov.my/index.php?option=com_content&task=view&id=75&Itemid=1089 accessed 29
May 2010).
MMEA, 2010. Agency’s function. (http://www.mmea.gov.my/index.php/en/profile/function.html
accessed 25 May 2010.)
MEHDP, 2010a. Project Development, Objectives and Phases, The Straits of Malacca and
Singapore. (http://www.meh-project.com/the-project accessed 31 May 2010.)
MEHDP, 2010b. Field Survey of Area 1 of the Malacca Straits TSS Completed. (http://www.meh-
project.com/news-events/news/field-survey-of-area-1-of-the-malacca-straits-tss-completed accessed
31 May 2010.)
MEHDP, 2010c. The maritime importance of the Straits. (http://www.meh-
project.com/setting/maritime-importance accessed 31 May 2010.)
MIDA, 2010. Infrastructure Support, 6. Sea Ports.
(http://www.mida.gov.my/en_v2/index.php?page=sea-ports accessed 30 May 2010)
Mohammad Noor, N., 1998. Identification and Distribution of Marine Dinoflagellates at Sebatu and
Sungai Rambai, Malacca, Malaysia. Master’s thesis, Universiti Putra Malaysia.
Mokhtar B.M., 2003. Integrated coastal zone management using the ecosystem approach, some
perspective in Malaysia. Ocean & Coastal Management 46 (2003) 407-419
Country Report on Pollution - Malaysia
63
Mokhtar, M., A.Z. Aris, V. Munusamy, and S.M. Praveena, 2009. Assessment Level of Heavy Metals
in Penaeus Monodon and Oreochromis Spp in Selected Aquaculture Ponds of High Densities
Development Area. European Journal of Scientific Research, 30 (3), 348-360.
Moradi, A.M., M.P. Zakaria, J. Ali and H. Takada, 1999. Geographical distribution of polycyclic
aromatic hydrocarbons in mussels from Malaysian coastal waters. Proceedings of the International
Conference on the International Oceanographic Data and Information Exchange in the Western
Pacific (IODE_WESTPAC).
Namba, T., and H.M. Ibrahim. 2002. Mixed Layer Depth in the Straits of Malacca. In: Yusoff, F.M. et
al., (eds), Tropical Marine Environment: Charting Strategies for the Millennium. MASDEC UPM,
Serdang. pp. 269-279.
Nixon, S.W., B.N. Furnas, V. Lee and N. Marshall, 1984. The Role of Mangroves in the Carbon and
Nutrient Dynamics of Malaysian Estuaries. Proceedings of the Asian Symposium on Mangrove
Environment - Research and Management. pp. 534-544.
Ong, J. E., W. K. Gong, C. H. Wong, Zubir Hj. Din and B. Kjerfve, 1991. Characterization of a
Malaysian Mangrove Estuary. Estuaries Vol. 14, No. 1, p. 38-48.
Othman, M.A., 1994. Value of Mangroves in Coastal Protection. Hydrobiologia 285: 277-282.
Ramachandran, R., and J. Mourin, 2006. Overview of the POPs Pesticide Situation in Malaysia.
International POPs Elimination Project. IPEN, UNIDO, UNEP, GEF, UNITAR, SDC-SAEFL.
(http://www.ipen.org/ipepweb1/library/ipep_pdf_reports/2mal%20malaysia%20country%20situation%2
0report.pdf accessed on 21 May 2010.)
Sangaralingam, M., 2005. Malaysia Country Situation Report. International POPs Elimination Project.
IPEN, UNIDO, UNEP, GEF, UNITAR, SDC-SAEFL.
(http://www.ipen.org/ipepweb1/library/ipep_pdf_reports/2mal%20malaysia%20country%20situation%2
0report.pdf accessed on 21 May 2010.)
Sekimizu, K. , J.-C. Sainlos and J. N. Paw, 2001. The Marine Electronic Highway in the Straits of
Malacca and Singapore - An Innovative Project for the Management of Highly Congested and
Confined Waters. Tropical Coasts 8 (No. 1):24-31.
Country Report on Pollution - Malaysia
64
Somchit, N., M.N. Somchit, A. Hadi, and M.P. Zakaria, 2009. Persistant organic chemicals in
Malaysian waters: A review. Research Journal of Environmental Toxicology, 3(2), 101-112.
Tan. S.G. and F .M. Yusoff, 2002. Biodiversity in the Straits of Malacca: What are the Opportunities?
In Yusoff, F.M., M. Shariff, H.M. Ibrahim, S.G. Tan, and S.Y. Tai (eds.), Tropical Marine Environment:
Charting Strategies for the Millennium, Proceedings International Conference on the Straits of
Malacca. Malacca Straits Research and Development Centre (MASDEC), Universiti Putra Malaysia,
Serdang, Malaysia, pp. 137-154.
Toda, T., T. Okashita, T. Maekawa, B.A.A. Kee Alfian, M.K. Mohd Rajuddin, R. Nakajima, W. Chen,
K.T. Takahashi, B.H.R. Othman and M. Terazaki, 2007. Community structures of coral reefs around
Peninsular Malaysia. Journal of Oceanography 63: 113-123.
Usup, G., 2011. Seafood Toxicity in Malaysia (Of Seafood, Mice and Man). Presented at Kelantan
Health Conference 2011, 15-16 June 2011, Khota Bahru, Malaysia.
http://jknkelantan.moh.gov.my/v3/uploads/files/pdfs/khc2011/SYM_2-02.pdf.
Usup G., L.C. Pin, A. Ahmad and L.P. Teen, 2002. Alexandrium (Dinophyceae) species in Malaysian
waters. Harmful Algae 1 (2002) 265-275.
Wood, A.K., B. Ahmad, A.R. Mohd-Kamil and H. Jamaluddin, 1999. Organic Contaminants in
Sediments of Melaka Straits. Proceedings of the International Conference on the International
Oceanographic Data and Information Exchange in the Western Pacific (IODE_WESTPAC).
Wyrtki, K. 1961. Scientific results of marine investigations of the South China Sea and the Gulf of
Thailand 1959-1961. Naga Report Volume 2. The University of California, Scripps Institutions of
Oceanography, La Jolla, California.
Yap, C.K., A. Ismail, S.G. Tan, and H. Omar, 2002. Concentrations of Cu and Pb in the offshore and
intertidal sediments of the west coast of Peninsular Malaysia. Environment International, 28, 467–
479.
Country Report on Pollution - Malaysia
65
Yap, C.K., A. Ismail and S.G. Tan, 2004. Heavy metal (Cd, Cu, Pb and Zn) concentrations in the
green- lipped mussel Perna viridis (Linnaeus) collected from some wild and aquacultural sites in the
west coast of Peninsular Malaysia. Food Chemistry, 84, 569–575.
Zakaria, M.P., Takada, H., Tsutsumi, H., Ohno, k., Yamada, J., Kouno, E., Kumata, H. 2002.
Distribution of polycyclic aromatic hydrocarbons (PAHs) in rivers and estuaries in Malaysia; a
widespread input of petrogenic PAHs. Environmental Science and Technology, 36, 1907-1918.
Zakaria, M.P. and H. Takada, 2007. Case Study: Oil Spills in the Strait of Malacca, Malaysia. In,
Zhendi Wang and S.A. Stout (eds), Oil Spill Environmental Forensics. Academic Press, pp. 489-504.