j ourna l homepage: www.e lsev ie r .com/ locate / jcorpf in
Convertible debt and shareholder incentives☆
Christian Dorion, Pascal François, Gunnar Grass⁎, Alexandre JeanneretHEC Montréal, Canada
a r t i c l e i n f o
☆ We thank the editors Craig Lewis and Chris Veld,2013 IFM2 Mathematical Finance Days for helpful comare also affiliated to CIRPEE. Financial support from I⁎ Corresponding author.
Article history:Received 3 October 2012Received in revised form 29 October 2013Accepted 30 October 2013Available online 9 November 2013
Given equity's convex payoff function, shareholders can transfer wealth from bondholders byincreasing firm risk. We test the existing hypothesis that convertible debt reduces this classicalagency problem of risk-shifting. First, we derive a measure of shareholders' risk incentivesinduced by convertible debt using a contingent claims framework. We then document thatwhen risk-shifting incentives are high, the propensity to issue convertible (rather thanstraight) debt increases and the negative stock market reaction following convertible debtissue announcements is amplified. We further highlight that convertible debt is the only typeof security that affects business risk durably downwards. Our conclusions support the agencytheoretic rationale for convertible debt financing especially for financially distressed firms.
Equity provides shareholders with a call option on the underlying firm. Because option values are an increasing function ofrisk, shareholders can transfer wealth from bondholders by increasing asset risk, leading to the classical risk-shifting (or assetsubstitution) agency conflict between shareholders and bondholders.
An appropriately designed convertible debt issue (Jensen and Meckling, 1976 and Green, 1984) can reduce this agency conflictbecause conversion forces existing shareholders to share the firm's upside potential as new shareholders are carved in whenconvertible bondholders choose to convert. This mitigates incentives for existing shareholders to engage in asset substitution.
The asset substitution problem has been widely analyzed in theoretical studies on agency conflicts. Yet, De Jong and Van Dijk(2007) and Graham et al. (2002) conclude from large-scale CFO surveys that managers care little about asset substitution inpractice. This may be attributable to the observation that incentives to engage in asset substitution are most acute when firms arefinancially distressed and that most respondents are unlikely to be financially distressed at the time of the survey. In line with thisperspective, Grass (2010) challenges the notion that ex-ante concerns about asset substitution are pervasive. Consistent with hisview, Eisdorfer (2008) notices that broad empirical support for this agency conflict is scarce and provides specific evidence ofrisk-shifting in financially distressed firms.
The first objective of this paper is to gauge the economic magnitude of risk-shifting and the potential benefits from issuingconvertible debt. To evaluate the economic significance of risk-shifting incentives, we develop a simple contingent claims
and an anonymous referee, as well as Tolga Cenesizoglu, Jean-Sébastien Michel, and participants at thements. François Leclerc, Manping Li and SiyangWu provided valuable research assistance. The authors
FM2 (Dorion, Grass, and Jeanneret) and SSHRC (François) is gratefully acknowledged.
39C. Dorion et al. / Journal of Corporate Finance 24 (2014) 38–56
framework that quantifies the magnitude of shareholders' incentives to increase risk. We then introduce “equity vega” as ameasure of the potential economic loss associated with the risk-shifting incentives of shareholders (RSI).1 We compute RSI for abroad sample of U.S. firms. On average, shareholders of firms that already have outstanding convertible debt can increase thevalue of their equity claim by nearly 2% if they increase asset volatility by 5%. Had those firms not used convertible debt financing,this increase would have been 2.6%, implying that convertible debt has reduced RSI by 0.6 percentage points across all samplefirms. A closer look at the distribution of issuers reveals that most firms are largely unaffected by asset substitution problems,indicating that RSI is highly skewed. The incentives are most pronounced for a small number of highly levered issuers that havehigh exposure to such incentives. For example, one percent of the firms we consider have equity vegas that exceed 25%. In linewith Eisdorfer (2008), our results suggest that the change in risk-shifting incentives induced by convertible debt is moreeconomically significant for the subset of firms close to financial distress.
Our second objective is to consider whether risk-shifting incentives are empirically relevant. Our approach is threefold. First,we conduct an event study to understand how RSI influences the market reaction to convertible debt issuance. We show thatshareholders perceive convertible debt issue more negatively when risk-shifting incentives are stronger. We also explore thecross-sectional variation in RSI to investigate the determinants of the announcement of convertible debt issuances and find thatissue size, regulated status and CEO ownership are important explanatory variables. Overall, the evidence is consistent with theobservation that convertible debt financing can mitigate agency costs associated with asset substitution. Second, we analyze theevolution of firm risk around such offerings and compare it to changes in risk around straight debt and equity offerings. Wedocument both a strong short-term drop and a long-lasting reduction in firm risk around the issuance of convertible debt. Third,we study the decision to issue convertible debt. Results from a multinomial logit model Ãã la Brown et al. (2012) show that firmswith high risk-shifting incentives are more likely to issue convertible debt. The RSI-induced preference for convertible debt iseven stronger when firms are financially distressed. The findings are robust across various controls and sub-samples.
The remainder of this paper is structured as follows. In Section 2, we review the literature on the use of convertible debtfinancing. The contingent claims analysis of risk-shifting incentives is conducted in Section 3 along with an empirical estimationof RSI for a large sample of U.S. firms that have issued convertible debt. Section 4 investigates the announcement effects ofconvertible debt issues. The dynamics of business risk around convertible debt issuance is examined in Section 5, and Section 6studies the effect of RSI on the decision to issue convertible debt. Section 7 concludes. Methodological details are presented in theAppendices A, B and C.
2. Previous studies
Why do firms issue convertible debt and why do investors buy it? Despite the widespread use of convertible bonds asfinancing instruments, these questions remain challenging both theoretically and empirically. In this section, we present a broadoverview of the common theories explaining the existence of convertible debt together with empirical evidence, and continuewith a review of studies related to convertible debt financing and risk-shifting.
2.1. Convertible debt financing
Early studies suggest that convertible debt can be attractive to young companies due to its relatively low coupon. Brennan andSchwartz (1988) highlight that convertible debt cannot provide firms with a “free lunch” because it does not reduce the overallcosts of financing. However, it does decrease the initial interest expense and can thus be advantageous to companies that willneed liquidity in the near future. Along these lines, Mayers (2000) suggests that callable convertible bonds, which allow the issuerto force conversion, can be used by companies that have sequential financing needs due to growth options. In case these optionsturn out to be valuable in the future, firms can force the conversion of bonds into equity and raise additional financing. If thegrowth options do not turn out to be valuable, bonds are not converted, and excessive financing leading to overinvestment isprevented. Mayers' argument is supported by the observation that especially small companies with high growth rates useconvertible debt for financing, as documented in Lee and Figlewicz (1999). Lyandres and Zhdanov (2014–this issue) provideanother investment-based explanation for issuing convertible debt. They show using a theoretical framework that the issuance ofconvertibles helps alleviate the underinvestment problem (debt overhang, Myers, 1977).
Stein (1992) argues that firms use convertible debt as backdoor equity financing. Given information asymmetries betweenmanagement and investors, equity issues are relatively unattractive. In line with the pecking order theory, a firm therefore prefersto issue less risky securities for financing. However, debt financing can be expensive given the high cost of financial distress andpotential risk-shifting problems (see Choi et al. (2010)). Callable convertible bonds allow forced conversion and are attractive forfirms that are optimistic about their future stock price performance. Following a stock price increase, firms can force conversion tobring equity into their capital structures. Stein (1992) and Mayers (2000) suggest that convertible debt is particularly interestingfor high-growth companies. Jalan and Barone-Adesi (1995) add that even though it is backdoor equity, convertible debt providesthe benefit of interest tax deductibility until conversion, which equity does not. Stein's (1992) argument is supported by empirical
1 Equity vega is defined here as the partial derivative of equity value to an instantaneous change in the volatility of the underlying assets. This interpretation issomewhat loose, as we consider the sensitivity of equity to discrete changes in volatility. Our main results use a volatility change of 5%.
40 C. Dorion et al. / Journal of Corporate Finance 24 (2014) 38–56
evidence that high-quality firms issue debt, medium-quality firms issue convertible debt, and low-quality firms issue equity (seeLewis et al. (1998)).
Other studies claim that convertible debt financing can be used as a signalling instrument. Nyborg (1995) studies thesignalling effect of the choice of call policy. He argues that the advantages of convertible debt as delayed equity are onlymaintained if conversion is voluntary. Nyborg's claim explains the observation that firms, on average, delay forced conversionuntil the conversion value reaches a substantial premium of 43.9% on call prices. Kraus and Brennan (1987) argue that convertibledebt can be used to convey information about firm risk.
Brennan and Schwartz (1988) also use information asymmetries about firm risk to justify the use of convertible debt.However, Brennan and Schwartz's argument is not based on signalling. Rather, they observe that the value of convertible debtis less sensitive to changes in the issuer's risk than is straight debt because the value of the convertible's straight debt(warrant) component decreases (increases) in asset risk. The researchers argue that, given uncertainty about the true assetvolatility, convertible debt is easier to price than straight debt, and investors may therefore be willing to provide funds onbetter terms.
2.2. Convertible debt and risk-shifting
Equity payoff is a convex function of firm value. Shareholders can therefore increase the value of their claim by augmentingfirm risk. In doing so, shareholders transfer wealth from the owners of straight debt, whose payoff function is concave. As arguedby Jensen and Meckling (1976) and Green (1984), convertible debt can reduce this classical agency problem of risk-shifting (alsocalled asset substitution): If equity values are above the strike price of the conversion option (which corresponds to a warrant),convertible debt investors will exercise the option and convert their bonds to newly issued shares, diluting the wealth of oldshareholders who nowmust share the firm's upside potential. The introduction of convertible debt thus alters the payoff functionof equity such that the incentives of existing shareholders to shift risk via asset substitution decrease. Green (1984) concludesthat the right convertible design can align the objectives of firm and equity value maximization.
Multiple studies show different limitations of Green's (1984) argument. Using game theoretical analysis, François et al. (2011)show that Green's results do not necessarily extend to a multi-period setting. Frierman and Viswanath (1993) argue that theeffectiveness of convertible debt in reducing the risk-shifting problem is limited if investors can trade derivatives written on firmassets. According to Chesney and Gibson-Asner (2001) and Grass (2010), the risk-shifting problem is less severe when accountingfor the possibility of default before debt maturity. In contrast, Hennessy and Tserlukevich (2009) argue that shareholders alwaysbenefit from increases in asset risk if the firm is close to default.
Several empirical studies support the relevance of risk-shifting for the choice of convertible debt as a financing instrument.Lewis et al. (1999) observe that price reactions around convertible debt issues are conditioned on investors' expectation ofwhether or not they are used to reduce agency conflicts. The researchers suggest that both asset substitution and informationasymmetries are motives for issuing convertibles. Krishnaswami and Devrim (2008) provide empirical evidence that the agencycost of debt determines the choice of convertible over straight debt financing. King and Mauer (2014–this issue) show that thecall policy for convertible bonds is, in part, designed to reduce agency conflicts between equity and debt.
Additionally, several studies examine the long-term change in different measures of risk around convertible debt issues.Lewis et al. (2013) report decreases in asset and equity betas and increases in idiosyncratic and total risk for their sampleperiod 1979–1990. They conclude that not all issuers use convertible debt financing to reduce agency conflicts. Zeidler et al.(2012) confirm the decrease in systematic equity risk for the years 1980–2002 and document that this change is morepronounced for small firms.
In summary, the discussion about whether convertible debt can and does mitigate risk-shifting is not over. Various theoreticalstudies questioning Green's (1984) argument contrast with scarce empirical evidence supporting the general notion thatconvertible debt is used to mitigate the agency conflicts of debt financing. We add to the existing literature by isolating the effectsof convertible debt on the value of risk-shifting for a broad dataset using a contingent claims framework. Understanding whatdrives these changes in incentives is not obvious. As pointed out by Siddiqi (2009), who uses simulation techniques to derive theoptimal financing mix, agency costs of risk-shifting are very sensitive to the capital structure choice.
Our paper contributes to the literature by measuring risk-shifting incentives and quantifying the economic significance of therisk-mitigating role of convertible debt.
3. The magnitude of risk-shifting incentives
Risk-shifting incentives can create an agency conflict if the magnitude of such incentives is economically significant. Inthis section, we propose a measure of risk-shifting that we first discuss in a numerical analysis and that we then employ in acomprehensive empirical study.
3.1. Measuring the benefits from risk-shifting
The proposed measure is based on the pricing of equity as an option on firm assets. We start by introducing the pricingframework employed in this study.
41C. Dorion et al. / Journal of Corporate Finance 24 (2014) 38–56
We consider that firms are financed with a combination of equity E, straight debt DS, and subordinated convertible debt DC. Alldebt matures at time T, which also corresponds to the time of conversion.2 The face values of straight and convertible debt aredenoted by FS and FC, and r is the risk-free rate. All three claims add up to firm value V:
and
whereotherratio e
2 Thisby assuof their
V ¼ E þ DS þ DC : ð1Þ
This framework allows us to price all three securities using standard pricing formulae for European options. The values ofequity, straight debt and convertible debt as contingent claims are given by:
E ¼ C K ¼ FS þ FC ; �ð Þ−αC K ¼ FS þFCα
; �� �
; ð2Þ
DS ¼ FSe−rT−P K ¼ FS; �ð Þ; ð3Þ
DC ¼ FCe−rT þ P K ¼ FS; �ð Þ−P K ¼ FS þ FC ; �ð Þ þ αC K ¼ FS þ
FCα
; �� �
; ð4Þ
C(K,⋅) and P(K,⋅) are the values of a European call and put option on firm value, calculated as a function of strike price K andpricing parameters using the Black and Scholes (1973) and Merton (1974) pricing formulae. Finally, α is the conversionxpressed in percentage terms. It is equal to the fraction of total equity owned by the new shareholders and thus measureslution of existing equity induced in case of conversion.
the di
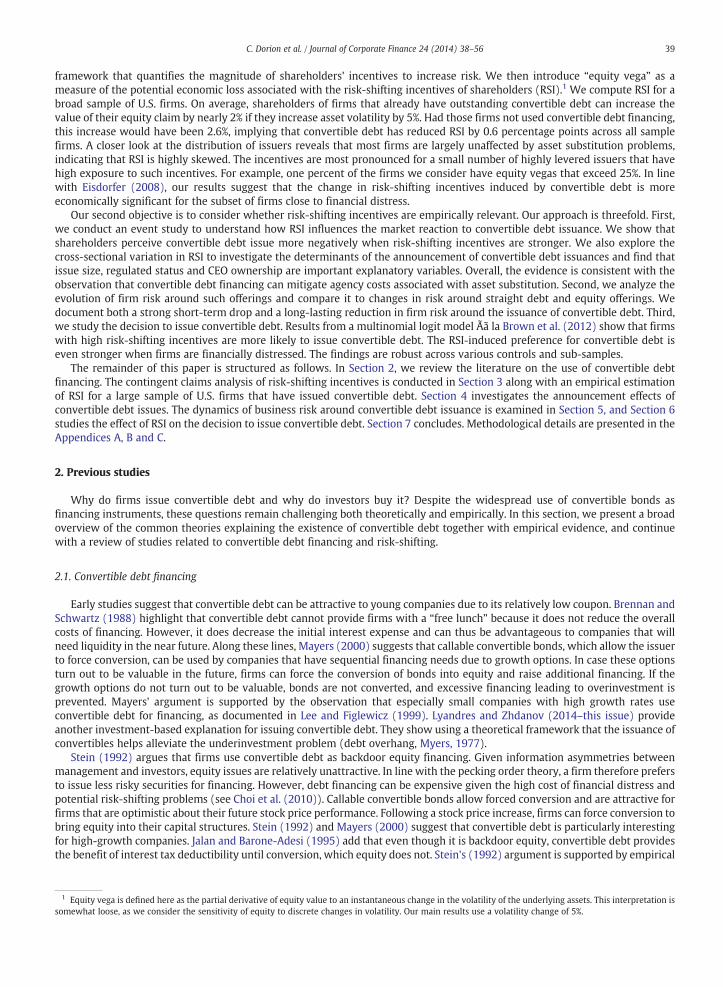
Fig. 1 illustrates how these securities can be viewed as options written on firm assets. In the simple Black and Scholes (1973)and Merton (1974) framework (upper left graph), shareholders own a call option, while debt holders hold a combination of arisk-free bond and a short put option on firm value. This is due to their payoff structure: Equity holders have unlimited upsidepotential and thus benefit from positive firm developments. At the same time, equity holders have limited liability if the firmdefaults. Debt holders, however, lose a part or all of their investment if the firm defaults, but never get more than the pre-agreedface value at debt maturity — even if firm value increases substantially.
In contrast, the owners of convertible debt (both lower graphs in Fig. 1) participate in the firm's upside potential as theirpayoff increases beyond the face value of the convertible if asset values are high enough to make the conversion valuable.Convertible debt financing affects the payoff and thus the pricing of equity: If the option to convert the bond into equity is in themoney, owners of convertible debt will exercise it. As opposed to the exercise of a plain vanilla call option on a stock, the exerciseof the conversion option corresponds to the exercise of a warrant. This means that old shareholders must share the payoff withnew shareholders as new equity is issued and existing equity is diluted (stock settled convertibles).
The last decade has witnessed a surge in the issuance of cash-settled convertibles. Lewis and Verwijmeren (2014–this issue)show that this trend can be attributed to changes in accounting rules. The cash settlement provision hardly affects the riskincentive mitigation effect of convertibles, however. Indeed, by selling a conversion option, shareholders commit to sharing theupside benefits with convertible debt holders. This in turn creates the concavity in shareholders' payoff, which essentiallyprovides the disincentive for risk-shifting. Admittedly, the cash settlement provision allows shareholders to avoid dilution uponconversion. Equity holders are thus obliged to share the upside firm value but not voting rights with convertible debt holders.Compared to cash-settled convertibles, stock-settled convertibles might therefore induce a stronger disincentive for risk-shifting,as their conversion entails for shareholders a loss in value and control.
In practice, most firms using convertible debt are also partly financed with straight debt. This is important for our studybecause we are interested in the agency conflict between shareholders and the owners of straight debt (also referred to asbondholders). Whenever a firm is financed with both convertible and straight debt, we assume the former to be subordinated.The lower right graph thus represents the capital structure that is at the center of our study. Shareholders have incentives toincrease firm risk under the simple capital structure (see the upper left graph in Fig. 1). Given their convex payoff, shareholdersbenefit from the higher upside potential, but do not have to be concerned about the increased downside of risky investments. Thechange in the value of their claim following an increase in risk can be computed using the formula that prices equity as acontingent claim.
We now introduce an intuitive measure of the value of risk-shifting. Based on Eq. (2), we calculate shareholders' risk-shiftingincentives, RSI, as follows:
RSI ¼ E σV þ κ ; T ; �ð ÞE σV ; T; �ð Þ −1; ð5Þ
κ describes an exogenous shift in firm risk. The RSI measure captures by how many percentage points the value of equity
wherechanges given a shift in firm risk. It is thus a direct measure of the value of risk-shifting to shareholders. We examine the classical
assumption is reasonable for any firm with a moderate payout policy, no shocks to firm value dynamics and for which forced conversion can be ruled outming that the convertible is non-callable. Empirically, Nyborg (1995) observes that even if a convertible is callable, firms tend to significantly delay the usecall option for forcing conversion.
Fig. 1. The figure shows payoff (solid lines) and value (dashed lines) of equity (black), straight senior debt (dark gray), straight junior debt (light gray, upperright) and convertible debt (light gray, lower graphs) as a function of firm value for four different capital structures. The parameters are r = .05, σV = .4, T = 1,FS = 45 (upper left graph), FS,sen = 30, FS,jun = 15 (upper right graph), FC = 45, α = .35 (lower left graph), FS,sen = 50, FC,jun = 30, and α = .35 (lower rightgraph).
42 C. Dorion et al. / Journal of Corporate Finance 24 (2014) 38–56
agency conflict arising from the incentive of shareholders to steal wealth from bondholders by risk-shifting. Shareholders willtypically risk-shift by increasing firm risk as long as their payoff is convex in firm value. We thus restrict our analysis to κ N 0.
3.2. Numerical analysis
Fig. 2 displays RSI and the dollar value of risk-shifting, E(σV + κ, T,⋅) − E(σV,T,⋅), as a function of asset value. Interestingly, thedollar value gain from risk-shifting admits a maximum for relatively low asset value (see left graph of Fig. 2). Indeed, in theextreme cases (asset value being very low or very high), the value of equity gets very close to the intrinsic value of the call optionon assets. The speculative value being close to zero, there is not much to gain (in dollars) from risk-shifting. In relative terms(which is what shareholders care about), the story is quite different. The right graph of Fig. 2 shows indeed that shareholders'incentive to increase risk is highest for low firm values, that is, in financial distress, both under straight-debt-only financing (blackline) and a straight debt — convertible debt mix.3 Convertible debt in the capital structure clearly attenuates the risk-shiftingincentive.
Overall, we note that the change in the value of risk-shifting induced by convertible debt can amount to several percentagepoints, which clearly is economically significant. Second, convertible debt has the strongest impact on risk-shifting incentives forfirms in financial distress. Firms with little debt are distant from default and, in contrast to shareholders of distressed firms, theirshareholders cannot steal a significant amount of wealth from bondholders by risk-shifting. In line with this finding, Eisdorfer(2008) documents a tendency of firms in financial distress to take on risky projects even if they generate little or no value.
3.3. Empirical estimation of risk-shifting incentives
In the following subsection, we estimate the effect of convertible debt on shareholders' risk-shifting incentives for a broadsample of U.S. firms.
3 Given that the face value of debt is fixed in Fig. 2, low firm values correspond to high leverage. For the lowest firm values displayed, firms can be considered infinancial distress.
Fig. 2. The figure displays our measure of risk-shifting incentives, RSI, in dollar terms (left graph) and relative terms (right graph). Solid (dashed) lines representequity value in a firm financed only with straight debt (with straight and convertible debt). The difference between the two is the reduction in risk-shiftingincentives induced by convertible debt. The parameters are: σ = .4, κ = .05, α = .35, r = 0.05, and T = 4.
43C. Dorion et al. / Journal of Corporate Finance 24 (2014) 38–56
3.3.1. Data and parametersOur sample covers the period 1984 to 2010 and consists of all firm-year observations with reported convertible debt financing.
We exclude observations for which the central accounting and stock market variables needed to compute pricing parameters arenot available in the Compustat and CRSP databases.4 The sample includes 17,867 firm-year observations. Appendix A providesdetails on the calculation of the different pricing parameters and variables.
Table 1 displays descriptive statistics for our parameter estimates, which are in line with those documented in the previousliterature. As outlined in Section 2, issuing convertible debt is particularly interesting for young, small, and risky firms with highgrowth.
On average, firms with convertible debt are substantially leveraged (with book leverage close to 50%) and have riskyoperations (with asset volatility at approximately 47%).5 However, we note some strong heterogeneity in leverage, business risk,and conversion ratio.
3.3.2. ResultsTable 2 shows empirical estimates for shareholders' risk-shifting incentives for a comprehensive sample of firms that use
convertible debt financing. It also reports how they are affected by convertible debt. We compute the risk-shifting incentives, RSI,with and without convertible debt. The first row of each panel shows the increase in shareholder value following a rise in firm riskby κ under the actual capital structure, including convertible debt financing.
Panel (a) of Table 2 indicates that, on average, shareholders can increase the value of their claim by nearly 2% if they increaseasset volatility by 5%. Comparing average and median values indicates that the distribution of RSI is highly skewed. For themajority of firms, risk-shifting incentives are negligible, and firms are therefore unaffected by the asset substitution problem.However, a small number of firms exhibit a high exposure to such risk. For the top one percent of firms, a 5% increase in assetvolatility induces a 25% increase in equity value.
Shareholders benefit from increases in firm risk under most capital structures. However, in some scenarios, convertible debtcan encourage shareholders to reduce asset risk in order to lower the likelihood of conversion and thus the dilution of existingshares. Therefore, RSI can be either positive or negative.
The second row displays statistics for the distribution of RSI computed for hypothetical firms in which convertible debtfinancing has been replaced with straight debt financing (that is, the conversion ratio is set to zero). Shareholders will alwaysbenefit from increases in firm risk under this simple financingmix of straight debt and equity. The third row reports the differencebetween the true RSI and the hypothetical RSI (second rowminus first row values) and is positive by construction. For the averagefirm, the presence of convertible debt decreases the value of risk-shifting by almost 0.6 percentage points: Without convertibledebt, shareholders could have increased the value of their claim by 2.6% instead of 2% had they increased asset volatility by 5%.Inspection of panels 2 (a), 2 (b) and 2 (c) shows that RSI and changes in RSI almost linearly increase with κ. Hence, the RSI metric,as a sensitivity measure, is largely unaffected by the choice of κ.
Overall, the results presented in Table 2 are consistent with the hypothesis that the issuance of convertible debt cansubstantially reduce the benefits from risk-shifting.
4 Specifically, we require the availability of the Compustat items DLTT, DLC, DCVT, SIC, and CSHO, and the CRSP items SHROUT, PRC, and RET.5 Our estimate of asset risk is higher than that reported in various other studies, in particular because of the covered time period that includes the 2008
financial crisis. Eisdorfer (2008) reports an average asset volatility of 25% for a comprehensive sample covering the years 1963 to 2002 and thus including earlyyears during which asset risk was low. Eom et al. (2004) calculates an average asset risk of 23% for a sample of large issuers of corporate bonds. For a morecomparable sample covering the period 1980–2003, Bharath and Shumway (2008) report clearly higher values. They calculate median volatilities of 46% and 42%using the iterative measure by Crosbie and Bohn (2003), and their own measure, respectively.
Table 2Convertible debt and the magnitude of risk-shifting incentives, empirical estimates. This table displays the average and different percentiles of the distribution ofthe value of risk-shifting. The sample covers the period 1984 to 2010 and consists of 17,867 firm-year observations with reported convertible debt outstanding. Asdetailed in Section 3.1, we compute RSI, a measure of the value of risk-shifting, as the percentage increase in the value of equity following an increase in assetvolatility by κ. RSIα = 0 is computed for hypothetical firms for which the convertible debt financing is replaced with straight debt financing. By construction, RSI islower than RSIα = 0, given that convertible debt reduces the value of risk-shifting. The difference between the two measures (RSI − RSIα = 0) is thus alwayspositive. All values are in percent. Panels (a), (b) and (c) contain statistics for a low, medium and high level of risk-shifting, respectively.
Table 1Descriptive statistics for parameter estimates. This table provides the average, standard deviation, and different percentiles of the distribution of several pricingparameters (some of which we scale by asset value for this table) employed in this study. All variables are defined in Appendix A. The number of firm-yearobservations equals 17,867.
44 C. Dorion et al. / Journal of Corporate Finance 24 (2014) 38–56
4. Announcement effects of convertible debt issues
The main objective of this paper is to investigate whether convertible debt financing can help alleviate the classical agencyproblem between equity holders and bondholders. Convertible debt financing reduces shareholders' incentives to increase riskand limits their potential to transfer wealth from bondholders. We therefore expect equity prices to decrease and the value ofstraight debt to increase upon issuance of convertible debt. Our model further predicts pricing effects to be particularlypronounced for firms with strong RSI that are in financial distress. We test these predictions by conducting a detailed event studyof 1229 convertible bond offerings on the issuer's equity returns. We also explore the effect on a firm's cost of debt.
4.1. Computation of abnormal equity returns
Our primary dataset includes convertible debt offerings made between 1984 and 2010 that are included in the SDC Platinumdatabase. Following common methodology, we delete offerings made by financial firms. As discussed later in this paper,regulation can have an impact on the agency problem of risk-shifting. We therefore also exclude utilities and firms active in thetelecommunications sector – which was only deregulated at the end of the last century – from our main sample and examinethem in a separate analysis. Furthermore, we follow Duca et al. (2012) and only include standard types of convertible bonds.Specifically, we exclude mandatory convertibles, exchangeable bonds, and convertible preferred stock. Finally, we delete allobservations from the sample for which we are not able to obtain the necessary data to construct our control variables.
We follow standard event study methodology and use a market model to compute 3-day buy-and-hold abnormal returns(BHARs). The event window spans one day before to one day after the event.6 The event date determination strictly follows theapproach of Duca et al. (2012) and is detailed in Appendix B. We define a stock's BHAR as the difference between its return and
6 Consistent with Duca et al. (2012), we include the day following the event in order to capture the reaction to an announcement made after the closing of thestock markets. Our results are robust to using an event window spanning only two days.
Table 3Descriptive statistics for risk-shifting incentives (RSI), abnormal returns (BHARs) and the control variables. This table provides the average, standard deviationand different percentiles of the distribution of RSI, BHARs and control variables, together with the number of observations for which the data are available (N).The upper (lower) panel displays statistics for the subsample of convertible debt (straight debt).
45C. Dorion et al. / Journal of Corporate Finance 24 (2014) 38–56
the return predicted by a one-factor market model, where the market index is given by the CRSP value-weighted index.7
Parameters of the market model are estimated over a window of 255 trading days ending 31 days before the event. Returns mustbe available for at least 90 days during the estimation window. In case an event falls on a non-trading date, we change it to thenext trading date.
We observe negative and significant abnormal returns around the announcement of convertible debt offerings. Over the1984–2010 period, the average 3-day effect is −3.5% (see Table 3). Both the sign and the magnitude are in line with previousstudies. Dann and Mikkelson (1984) show that shareholders earn significant abnormal returns of −2.31% on the announcementdate of convertible debt offerings. Similarly, Eckbo (1986) reports an average two-day abnormal return relative to theannouncement date that varies between−1.2% and−1.8%, and shows that the effect increases for lower debt ratings. Duca et al.(2012) show that the 3-day effect varies between −1.7% over the 1984–1999 period and −4.6% over the period 2000–2008.Henderson and Zhao (2014–this issue) find a similar two-day announcement effect (−4.78%) over the period 2000–2010.8
7 Given that we examine short term announcement effects, BHARs are virtually identical to traditional cumulative abnormal returns; the correlation betweenthe two equals 99.9%.
8 This result holds for convertible issuers that are not conducting concurrent transactions. In their analysis, Henderson and Zhao (2014–this issue) show thatthe announcement effect varies when convertible issuers conduct concurrent transactions.
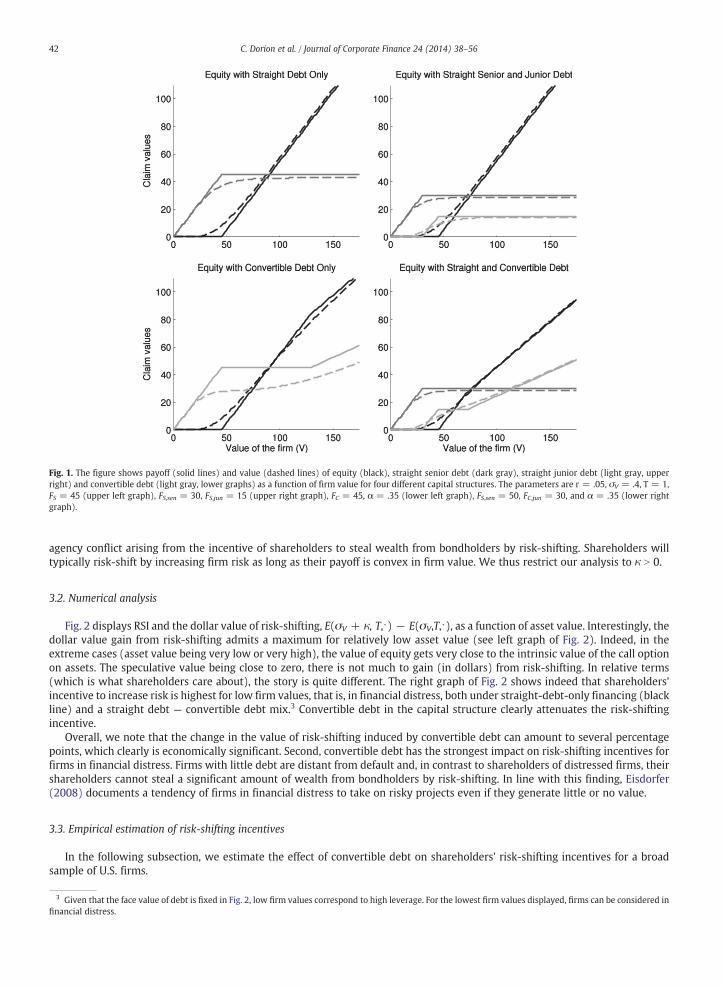
Fig. 3. This figure displays the average announcement effect of security issuances on three-day buy-and-hold abnormal returns (BHARs) and yields spreadchanges in the upper and lower panels, respectively. Results on convertible debt issues (left panels) are compared with those for straight debt issues (rightpanels). The average effects are reported by quintiles of risk-shifting incentives (RSI).
46 C. Dorion et al. / Journal of Corporate Finance 24 (2014) 38–56
Fig. 3 displays the average announcement effect on BHARs by quintiles of RSI. Consistent with our prediction, the marketreaction to convertible debt issues appears more pronounced when the level of risk-shifting is high (top-left panel). In contrast,the emission of straight debt does not seem to affect shareholder wealth, regardless of the level of RSI (top-right panel).
4.2. Regression analysis of announcement effects
We now conduct a cross-sectional analysis of the relation between the stock price effects around the issuance date and thecharacteristics of both the issuer and the issued security. In line with De Jong et al. (2011) and Duca et al. (2012), we run aregression of abnormal returns (BHAR) on a set of variables of interest. In particular, we focus on the firm's level of RSI aspresented in subsection 3.1 and explained in detail in Appendix A.
4.2.1. Control variablesOur set of control variables is similar to that used in Brown et al. (2012). Because the authors document significant differences
between firms that issue convertible debt privately versus publicly, we include a dummy that equals one for all Rule 144aplacements. Our baseline specification includes issuer-specific and market-wide variables.
As far as issuer-specific controls are concerned, we include the logarithm of the market-to-book ratio, a dummy for whetherthe issuer's stock is listed on Nasdaq, firm size as measured by the logarithm of the issuer's total assets, the fraction of propertyplant and equipment over total assets (referred to as asset tangibility), the ratio of research and development expenses over sales(referred to as R&D intensity), the Amihud (2002) measure for equity liquidity, and a dummy for dividend-paying firms.
Market-wide variables include the one-year stock market return computed on the S&P500, the 10-year Treasury rate, theaverage spread of Moody's Baa corporate bonds over the 10-year Treasury rate, and the Conference Board's Leading EconomicIndicator. Appendix C provides a detailed definition of each of the control variables.
Table 3 reports descriptive statistics for control variables for firms issuing convertible debt or straight debt. The two groups offirms exhibit different characteristics. Compared to firms issuing straight debt, firms issuing convertible debt have a profile that ismore in line with a younger firm: They are smaller, have less leverage, less tangible assets, more growth opportunities, morevolatile equity returns, and are more likely to be listed on the Nasdaq.
Table 4Risk-shifting incentives (RSI) and the announcement effect of convertible debt issues — main results. Displayed are results of linear regressions of abnormalreturns on RSI and control variables. Column 1 reports the baseline model. In Column 2, we exclude the macroeconomic controls used in Brown et al. (2012),whereas Column 3 additionally considers a set of issue-specific controls suggested by Duca et al. (2012). Coefficients are not reported, but are available uponrequest. Columns 4 and 5 report results when firm credit risk is above and below the median, respectively, while Columns 6 and 7 present results related to thehighest and lowest quartiles. All control variables are defined in Appendix C. We report t-statistics, using Huber-White heteroskedasticity-robust standard errorsadjusted for firm-level clustering, in parentheses below the coefficient estimates. t-statistics for the difference in coefficients between subsamples are reported insquare brackets. Significance at the 10%, 5%, and 1% level is indicated by ⁎, ⁎⁎, and ⁎⁎⁎, respectively.
(1) (2) (3) (4) (5) (6) (7)
Financial distress π
High Low Very high Very low
RSI (%) −28.41⁎⁎⁎
(−3.36)−39.35⁎⁎⁎
(−4.55)−23.44⁎⁎
(−2.41)−29.94⁎⁎⁎
(−3.23)0.60(0.04)[1.68⁎]
−34.73⁎⁎⁎
(−2.82)29.00(0.36)[0.79]
Log MB −0.18(−0.97)
0.02(0.08)
−0.14(−0.68)
−0.14(−0.65)
0.03(0.05)
−0.24(−0.91)
0.85(1.01)
Nasdaq listing −0.27(−0.63)
−0.65(−1.45)
−0.09(−0.20)
0.40(0.61)
−0.99⁎
(−1.76)0.53(0.52)
−1.10(−1.50)
Firm size 1.07⁎⁎⁎
(6.24)0.54⁎⁎⁎
(3.52)1.01⁎⁎⁎
(5.71)1.30⁎⁎⁎
(4.30)0.75⁎⁎⁎
(3.73)1.36⁎⁎⁎
(2.68)0.73⁎⁎⁎
(2.74)Tangibility −0.52
(−1.06)−0.61(−1.22)
−1.03(−1.22)
−0.50(−0.62)
−0.23(−0.33)
−0.28(−0.22)
−0.40(−0.41)
R&D intensity −0.17(−0.94)
−0.29(−1.53)
−0.06(−0.34)
−0.07(−0.33)
−0.40(−1.53)
0.05(0.19)
−0.56⁎⁎⁎
(−3.74)Amihud liquidity 1.50⁎⁎
(2.28)1.59⁎⁎
(2.18)1.19⁎
(1.75)1.34(1.55)
2.05⁎⁎
(2.31)1.13(1.04)
1.66(1.35)
Dividend paying −0.06(−0.15)
0.62(1.49)
−0.08(−0.19)
−0.43(−0.62)
0.39(0.73)
−0.58(−0.43)
0.53(0.70)
Rule 144a −0.51(−0.96)
−2.18⁎⁎⁎
(−4.95)−0.44(−0.74)
−0.87(−1.10)
0.32(0.44)
−1.18(−0.89)
0.78(0.75)
SP500 return 4.36⁎⁎⁎
(3.36)1.90(1.23)
3.78⁎
(1.85)4.72⁎⁎⁎
(2.88)4.84(1.29)
3.97⁎
(1.87)Interested rate 0.19
(0.99)−0.06(−0.27)
0.62⁎
(1.91)−0.23(−0.99)
0.94(1.62)
−0.38(−1.20)
Baa credit spread −0.92⁎
(−1.75)−0.23(−0.37)
−0.53(−0.69)
−1.66⁎⁎
(−2.42)0.01(0.01)
−2.59⁎⁎
(−2.55)Leading indicator −0.08⁎⁎⁎
(−2.65)−0.02(−0.59)
−0.06(−1.37)
−0.10⁎⁎⁎
(−2.73)−0.01(−0.11)
−0.13⁎⁎
(−2.31)Constant −3.07
(−0.70)−5.59⁎⁎⁎
(−5.06)−5.96(−1.03)
−9.27(−1.34)
5.10(0.92)
−16.97(−1.40)
9.84(1.21)
Issue controls No No Yes No No No NoObservations 1.229 1.229 1.191 610 610 305 305Adjusted R2 (%) 11.2 6.0 12.6 9.9 10.6 6.4 12.2
47C. Dorion et al. / Journal of Corporate Finance 24 (2014) 38–56
4.2.2. Effect of risk-shifting incentivesWe now test whether the reaction of stock prices to convertible debt announcements can be attributed to variations in
shareholders' risk-shifting incentives. Table 4 reports the results of different regression specifications with BHARs over thewindow (−1,+1) relative to convertible debt issuances as the dependent variable.
Column (1) shows that RSI enters significantly and negatively, suggesting that a convertible debt issue is perceived morenegatively by shareholders when risk-shifting incentives are stronger. The interpretation of a coefficient of−28.41 is as follows. Aone standard deviation increase in RSI (equal to 0.0317) decreases BHARs from its average of −3.5% to −4.4%. The marginalchange is −0.9% (i.e. 0.0317 × −28.41), which is economically sizable. The effect of RSI remains large and significant whenexcluding market-wide variables (see Column (2)), as well as when including issue-specific variables (see Column (3)).9
4.2.3. Analysis by distress levelThe issuance of convertible debt limits the possibility for shareholders to steal wealth from bondholders. Equity returns to
convertible debt announcements should be more negative for firms with significant credit risk, as the benefits from risk-shiftingare highest for these companies. We test the hypothesis that convertible debt can mitigate agency conflicts in financiallydistressed firms by conditioning the announcement effects on the credit risk level. Our measure of credit risk is based on the studyof Campbell et al. (2008) and explained in Appendix C.
The baseline regression is run on subsamples broken down by credit risk levels: above and below the median (Columns (4)and (5)) or top and bottom quartiles (Columns (6) and (7)). In line with our prediction, we observe that equity values are
9 The issue-specific variables considered are from Duca et al. (2012). They consist of dummies indicating whether the convertible bond is non-callable, whetherit is the first time the firm issues convertible debt, whether the issue date equals the announcement date used in the event study, and two time dummiesindicating whether the issue was announced between 1/1/2000 and 14/9/2008 or between 15/9/2008 and 31/12/2009.
Table 5Risk-shifting incentives (RSI) and the announcement effect of convertible debt issues — cross-sectional variation. Displayed are results of linear regressions ofabnormal returns on RSI and control variables. Columns 1 and 2 provide results when the issue size is small or large, as separated by the median. Columns 3 and 4report results when the fraction of secured debt over total debt is below and above the median, respectively, while Columns 5 and 6 present the results when theaverage debt maturity is below and above the median, respectively. Columns 7 and 8 compare the results for unregulated and regulated firms. Finally, Columns 9and 10 display results when the fraction of CEO shares is below and above the median, respectively. All variables are defined in the Appendices A, B and C. We useHuber-White heteroskedasticity-robust standard errors adjusted for firm-level clustering to compute t-statistics, which are reported in parentheses. t-statisticsfor the difference in coefficients between subsamples are reported in square brackets. ⁎, ⁎⁎, and ⁎⁎⁎ indicate significance at the 10%, 5%, and 1% level.
(1) (2) (3) (4) (5) (6) (7) (8) (9) (10)
Proceeds % secured debt Debt maturity Regulation CEO ownership
48 C. Dorion et al. / Journal of Corporate Finance 24 (2014) 38–56
particularly sensitive to the level of RSI when firms are in financial distress. RSI coefficients obtained from regressions fitted onsubsamples of high versus low credit risk issuers are substantially different in terms of their magnitude. The difference, however,can hardly be pinned down statistically. Given that the average RSI of low credit risk firms is extremely small, the RSI coefficientsfor the low credit risk subsamples thus have high standard errors. Accordingly, we only observe a weak statistical significance ofthe difference for the split along the median, but not along quartiles.
4.2.4. Cross-sectional variations in the effect of RSIWe now explore cross-sectional variations in the effect of RSI to better understand which firms are more affected by the
announcement of convertible debt issuance through RSI. For each variable of interest, we break down the sample according to themedian, and run the baseline regression on the two subsamples. Table 5 reports the results.
The negative market reaction following convertible debt issuance is consistent with the correction of an agency conflictbetween shareholders and creditors. All else equal, the greater the size of the convertible debt issue, the stronger the mitigation ofthe agency conflict. In line with this intuition, we find that large issue size is associated with a strong contribution of RSI to thenegative market reaction (see the RSI coefficients in Columns (1) and (2)).
When debt is secured, we expect the agency conflict to be mitigated, implying that RSI should play a smaller role in explainingthe BHARs. Similarly, short-term debt is commonly viewed as a disciplining financing tool that reduces the magnitude of agencyconflicts. Along this line, the effect of RSI should be weaker when debt maturity is short. The data indicates, however, that theeffect of RSI is similar across debt maturity and whether debt is secured or not (the RSI coefficients have comparable magnitudeand significance in Columns (3) and (4) as well as Columns (5) and (6) in Table 5).
Regulated firms may not have shareholder value maximization as their only objective. Consequently, these firms are lessconcerned with the asset substitution problem, and we expect the market reaction to convertible debt issuance to be little
49C. Dorion et al. / Journal of Corporate Finance 24 (2014) 38–56
affected by RSI in regulated industries. Our regression results indicate that the effect of RSI becomes indeed insignificant when itcomes to regulated firms.10
The CEO's decision to issue convertible debt can weakly or strongly reduce the shareholder–bondholder agency problem,depending on the alignment of his interests with those of shareholders, as measured by the CEO's equity share. We thereforeexpect the negative market reaction to exhibit a stronger dependence on the level of RSI when the CEO has a low equity share.This is indeed what we observe in the data (see Columns (9) and (10)).
4.3. Changes in yield spreads
To further examine the extent to which convertible debt issues help attenuate the agency problem between shareholders andbondholders, we now analyze the effect of such announcements on the value of straight debt. In particular, we examine changesin yield spreads on straight bonds issued by firms previous to their announcement of a convertible bond offer. Our sampleincludes 68 announcements occurring in such a setting. The number of events for which all required data is available is small, asexplained in detail in Appendix B. Nonetheless, estimating the announcement effects of convertible debt issues on the change inaverage yield spread is useful.
On average, yield spreads decrease by 0.60% following the announcement of convertible debt. The reduction in the costs ofdebt is both statistically and economically significant. As argued previously, the agency conflict between shareholders andbondholders should be particularly pronounced for firms close to financial distress. If convertible debt can indeed reduceshareholder incentives to shift risk, bondholders should benefit most from convertible debt if the issuing firm has a high level ofRSI.
Fig. 3 displays average announcement effects on firm yield spreads by quintiles of RSI (lower-left panel). Consistent with theanalysis of equity returns, the market reaction captured by the change in yield spreads is highest for firms whose shareholdershave the strongest incentives to shift risk.11 In contrast, no clear pattern emerges when we focus on straight debt issues (rightpanels).
In sum, convertible debt issues are bad news for equity holders and good news for creditors, especially when the agencyconflict between shareholders and bondholders is severe, as indicated by a high RSI. Fig. 3 shows this wealth transfer frombondholders to shareholders. It is consistent with the view that convertible debt reduces the benefits of risk-shifting toshareholders, decreasing their expected cash flows and increasing those to bondholders.
5. Impact on real investment decisions
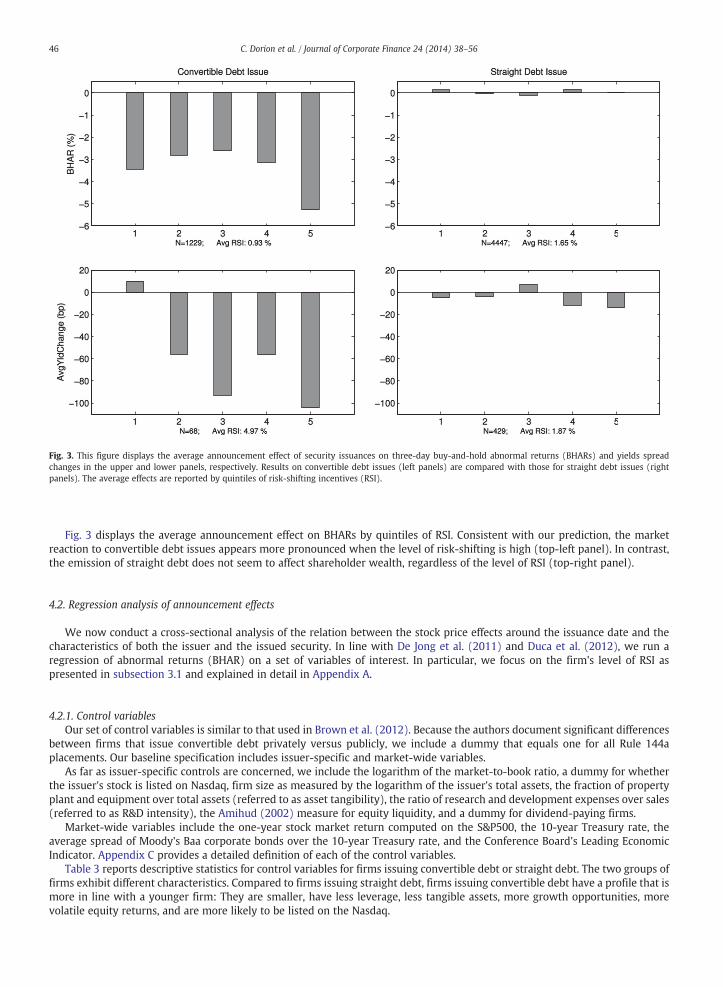
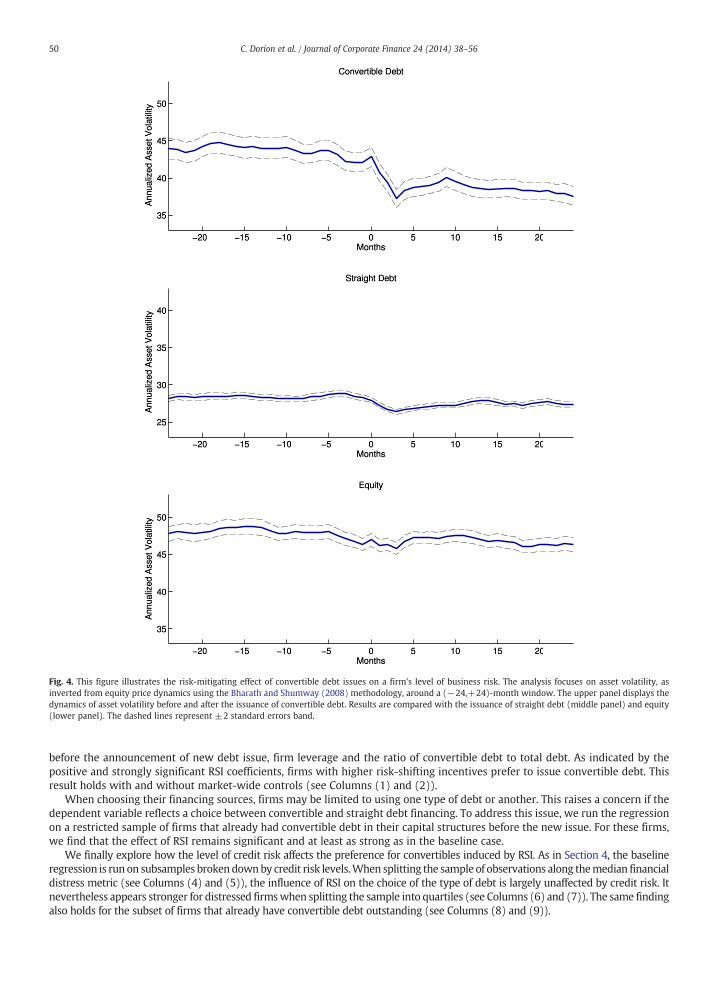
Another way to examine the risk-mitigating effect of convertible debt is to investigate the level of investment in risky projectsfollowing the issuance of such security. To this end, we study the dynamics of firm volatility before and after convertible debt isemitted. We examine the asset volatility that is inverted from equity price dynamics using the Bharath and Shumway (2008)methodology.12
Fig. 4 illustrates a clear decline in asset volatility after the issuance of convertible debt. We observe a strong drop in the shortrun and a long-lasting reduction. Table 6 reports a decrease of 4.87 percentage points (4.62 percentage points) in asset volatilitythree months (two years) following the issuance of convertible debt. In contrast, the issuance of other types of securities (equityor straight debt) induces a weaker, short-term decrease in asset volatility that vanishes after a few months. Table 6 reports a dropin asset volatility induced by equity or straight debt that is substantially lower in magnitude than the one induced by convertibledebt. Convertible debt therefore appears to be the only type of security that affects business risk durably downwards.
6. Risk-shifting incentives and the decision to issue convertible debt
So far, we have examined the consequences of issuing convertible debt. However, risk-shifting incentives should also influencethe decision to issue convertible debt (as opposed to straight debt) in the first place. The aim of this section is to analyze whetherfirms with higher RSI are more prone to issue convertible debt rather than straight debt. We also explore how this effect varieswith firm characteristics.
We follow the approach of Hovakimian et al. (2001) and Brown et al. (2012) and employ a multinomial logit model to predictthe issuance of convertible debt. As shown in these studies, controlling for the possibility of issuing equity is important whenexamining the choice between straight and convertible debt.
Table 7 reports the results of a multinomial logit regression for which the dependent variable is zero for straight debt issues(base case), one for convertible debt issuance and two for equity issuance. As our analysis focuses on the decision to issue straightor convertible debt, we only report results for this alternative. Results for the equity issuance decision are available upon request.The baseline model is the same as in Section 4. We add two variables to control for the firm's capital structure prevailing a quarter
10 The subsample of regulated firms in Column (8) in Table 5 is defined based on firms' SIC code, as detailed in Appendix C.11 The increase in the value of straight debt is significant for the upper four RSI quintiles. This can be explained by the fact that the average RSI is very high for thesubsample of 68 firms issuing convertible debt, which already have straight bonds outstanding as of the announcement date.12 Alternatively, we computed asset volatility using the iterative method described by Crosbie and Bohn (2003). Results are robust to this choice and availableupon request.
Fig. 4. This figure illustrates the risk-mitigating effect of convertible debt issues on a firm's level of business risk. The analysis focuses on asset volatility, asinverted from equity price dynamics using the Bharath and Shumway (2008) methodology, around a (−24,+24)-month window. The upper panel displays thedynamics of asset volatility before and after the issuance of convertible debt. Results are compared with the issuance of straight debt (middle panel) and equity(lower panel). The dashed lines represent ±2 standard errors band.
50 C. Dorion et al. / Journal of Corporate Finance 24 (2014) 38–56
before the announcement of new debt issue, firm leverage and the ratio of convertible debt to total debt. As indicated by thepositive and strongly significant RSI coefficients, firms with higher risk-shifting incentives prefer to issue convertible debt. Thisresult holds with and without market-wide controls (see Columns (1) and (2)).
When choosing their financing sources, firms may be limited to using one type of debt or another. This raises a concern if thedependent variable reflects a choice between convertible and straight debt financing. To address this issue, we run the regressionon a restricted sample of firms that already had convertible debt in their capital structures before the new issue. For these firms,we find that the effect of RSI remains significant and at least as strong as in the baseline case.
We finally explore how the level of credit risk affects the preference for convertibles induced by RSI. As in Section 4, the baselineregression is run on subsamples brokendownby credit risk levels.When splitting the sample of observations along themedian financialdistress metric (see Columns (4) and (5)), the influence of RSI on the choice of the type of debt is largely unaffected by credit risk. Itnevertheless appears stronger for distressed firmswhen splitting the sample into quartiles (see Columns (6) and (7)). The same findingalso holds for the subset of firms that already have convertible debt outstanding (see Columns (8) and (9)).
Table 6The effect of issuing convertible debt on asset volatility. This table reports differences in the average asset volatility before and after issuing convertible debt,straight debt, and equity. The difference in impact between issuing convertible debt and other securities is investigated using a difference-in-difference approach.The asset volatility is inverted from equity price dynamics using the Bharath and Shumway (2008) methodology. It is based on returns over a quarter, e.g. theasset volatility one month before issuance (−1) is inferred from returns observed from −4 to −1. Significance at the 10%, 5%, and 1% level is indicated by ⁎, ⁎⁎,and ⁎⁎⁎, respectively.
Months relative to issue date Difference in mean Difference in difference
CD SD EQ CD-SD CD-EQ
(−1, +3) −4.87(−5.66)⁎⁎⁎
−1.87(−7.22)⁎⁎⁎
−0.74(−1.27)
−3.00(−4.48)⁎⁎⁎
−4.13(−3.52)⁎⁎⁎
(−1, +6) −3.39(−3.93)⁎⁎⁎
−1.22(−4.50)⁎⁎⁎
0.71(1.24)
−2.18(−3.18)⁎⁎⁎
−4.11(−3.55)⁎⁎⁎
(−1, +12) −3.47(−4.03)⁎⁎⁎
−0.43(−1.52)
0.89(1.50)
−3.04(−4.34)⁎⁎⁎
−4.35(−3.68)⁎⁎⁎
(−1, +24) −4.62(−5.18)⁎⁎⁎
−0.86(−3.01)⁎⁎⁎
−0.14(−0.23)
−3.76(−5.22)⁎⁎⁎
−4.48(−3.61)⁎⁎⁎
Table 7Effect of firm risk-shifting incentives (RSI) on the decision to issue convertible debt. Displayed are results of a multinomial logit regression. The dependentvariable is zero for straight debt issues (base case), one for convertible debt and two for equity. Only coefficients for the choice between issuing convertible versusstraight debt are reported. Column 1 reports the baseline model, Column 2 excludes market-wide controls whereas Column 3 restricts the sample to firms alreadyusing convertible debt before the issue. Columns 4 and 5 report results when firm credit risk is above and below the median while Columns 6 and 7 presentresults related to the highest and lowest quartiles. Columns 8 and 9 report results when credit risk is above and below the median but only for firms alreadyfinanced by convertible debt. All variables are defined in the Appendices A, B and C. We use Huber-White heteroskedasticity-robust standard errors adjusted forfirm-level clustering to compute t-statistics, which are reported in parentheses. t-statistics for the difference in coefficients between subsamples are reported insquare brackets. ⁎, ⁎⁎ and ⁎⁎⁎ indicate significance at the 10%,5% and 1% level.
51C. Dorion et al. / Journal of Corporate Finance 24 (2014) 38–56
52 C. Dorion et al. / Journal of Corporate Finance 24 (2014) 38–56
7. Conclusion
As equity resembles a call option on firm assets, shareholders can steal wealth from bondholders by increasing asset volatility.This article examines whether convertible debt can reduce this classical agency problem of risk-shifting. The following four
results support this hypothesis.First, we show that both the magnitude of the agency conflict and its mitigation through convertible debt can be economically
significant. To show this, we propose a simple measure of shareholders' risk-shifting incentives, RSI. It is calculated as the percentagechange in the option value of equity due to an increase in asset volatility. We estimate RSI for a comprehensive data set of firms usingconvertible debt financing. Even though risk-shifting incentives are low for themajority of companies, a small number of firms exhibit ahigh exposure to the risk-shifting problem: For the top one percent of firms, a 5% increase in asset volatility induces a 25% increase inequity value. In the upper percentile, convertible debt reduces the benefits of risk-shifting by more than 4%. Second, we examine theannouncement effects of convertible debt issues on the value of equity and straight debt and document a wealth transfer fromshareholders to bondholders, which is particularly pronounced for firms with high RSI. Share prices drop by 3.5%, while the cost of debtdecreases by 0.6% around the announcement of convertible issues. This wealth transfer is consistent with our main hypothesis: ifconvertible debt reduces the benefits of risk-shifting for shareholders, it decreases their expected cash-flows and increases those ofbondholders.Wedo not observe awealth transfer around the announcement of straight debt offerings. Third,wedocument that the levelof investment in risky projects – as proxied for by asset volatility – decreases following the issuance of convertible debt. The drop involatility is substantially lower around equity and straight debt offerings.
Finally, an ex-ante analysis of the decision to issue convertible debt shows that firms with higher risk-shifting incentivesprefer using convertible debt over straight debt.
Our findings suggest that even though risk-shifting is not a concern in most companies, it affects claim values, financing choiceand operational decisions for a subset of firms, particularly those close to financial distress. Convertible debt appears to be oneway of mitigating this agency conflict.
Appendix A. Calculation of RSI
We define the strike prices of convertible debt and equity based on reported face values, in line with Eom et al. (2004) andBharath and Shumway (2008). Specifically, we set the strike price of equity and the strike price of the junior convertible debtequal to the face value of total debt, which we compute as the sum of reported long term debt and debt in current liabilities. Wesubstract the face value of convertible debt to obtain the face value of the straight senior debt.
As illustrated in Kraus and Brennan (1987), the strike price of the conversion option embedded in the convertible bond can becomputed based on the face value of debt and the dilution measure. Here, the dilution parameter, α, equals the percentage of shares,which would be held by convertible bondholders in case they exercise their conversion option and become new shareholders:
where
13 Thisoutliers14 Stillparamecompar
α ¼ NNew
NOld þ NNew; ðA:1Þ
NNew is the number of new shares issued in case of conversion and NOld is the number of shares outstanding before
whereconversion. Up to 1996, this ratio can be computed based on the data items common shares outstanding (CSHO) and commonshares reserved for conversion from convertible debt (CSHRC). In 1996, Compustat discontinued the reporting of CSHRC. For thesubsequent firm-years, we account for the historical relation between CSHRC and CSHO, which is given by:
CSHRC ¼ 0:8780þ 0:3309FCE
� �wsCSHO; ðA:2Þ
the values 0.8780 and 0.3309 are the coefficient estimates a and b from the pooled linear regression
CSHRC i;yð Þ ¼ aþ bFC; i;yð ÞE i;yð Þ
" #ws
CSHOþ ε i;yð Þ: ðA:3Þ
The regression is fitted using all available data from the first part of the sample period. Subscriptws indicates that the ratio FC/Eis winsorized at the 99th percentile.13 The intuition underlying this estimation of CSHRC – which corresponds to NNew – is asfollows: NNew is defined as the number of new shares issued after conversion, and it is equals to the face value of convertible debtdivided by the conversion price. Our estimation implicitly assumes the conversion price to be equal to the current share pricetimes a factor (1 + p). Then,NNew ¼ FC
ENOld1þp, which we can estimate using the regression described by Eq. (A.3). This procedure is not
only intuitively appealing, but also yields a high fit to the data. The adjusted R2 of this regression equals 32.97%.14
means that we set all values in the upper one percent of the distribution of FC/E equal to the 99th percentile. Doing so allows us to reduce the number ofthat are likely a result of erroneous data., to some extent the estimation procedure remains arbitrary. It is therefore important to note that the risk-shifting measures computed based on thister are similar to those computed for the subsample for which CSHRC is given, and the one for which we must estimate it. The distribution of α isable for both subsamples, also. The averages of α calculated based on estimated and actual values of CSHRC equal 11.6% and 11.8%, respectively.
53C. Dorion et al. / Journal of Corporate Finance 24 (2014) 38–56
Next, we calculate firm risk σV following the approach of (Bharath and Shumway, 2008), as follows:
where
with adays phighly
15 This16 On
σV ¼ DVσD þ E
VσE; ðA:4Þ
D = FC + FD and the volatility of debt equals
σD ¼ :05þ :25σE; ðA:5Þ
n equity volatility σE computed as the annualized standard deviation of daily stock returns observed over the 252 tradingreceding the fiscal year-end date. While Bharath and Shumway (2008) call their measure “naive”, they show that it iscorrelated to the estimates of firm risk by Moody's KMV and that, in combination with other parameters, it is a bettertor of default risk than alternative, common measures.
predic
We then derive the time to debt maturity, T, as a face value-weighted average of debt with different maturities as follows.Using the Compustat items long-term debt due in year 1 to 5 (DD1 through DD5), we first estimate the time to maturity oflong-term debt as
TLT ¼ 0:5DD1 þ 1:5DD2 þ 2:5DD3 þ 3:5DD4 þ 4:5DD5
DLTþ 10 1−DD1to5
DLT
� �: ðA:6Þ
As reported by Barclay and Smith (1995), the Compustat items debt due in year one to five, DD1to5, appear to containerroneous data as the ratio of DD1to5 to total debt is sometimes larger than one and sometimes below zero. We follow theiradjustment and require the ratio to lie between 10% and 110%. In case the ratio lies between 100% and 110%, we scale DD1to5 downby dividing it by the ratio itself. Observations outside of the acceptable range are ignored in the first step and then are assigned theaverage value of TLT. Based on TLT, we obtain T as:
T ¼ TLTDLT
Dþ 0:5
DST
D; ðA:7Þ
DST is debt in current liabilities. Finally, for observations for which we were not able to compute a value, we set T to the
whereaverage T of the aggregate sample.
Based on T, we extract the risk-free rate r from interest rates on constant Treasury securities. To do so, we first construct yieldcurves using cubic spline interpolation for each event date in our sample and then obtain r as the risk-free rate observed on thatdate for maturity T.
Finally, we back out an estimate of asset value V from equity values assuming that the relation between equity value and firmvalue is correctly described by our pricing framework. Observing the value of equity and given all other pricing parameters exceptV, we can compute V numerically such that it solves Eq. (2).15 Relative to the measure used in Eom et al. (2004) and Bharath andShumway (2008), who set V equals to the market value of equity plus the book value of total debt, this yields more realistic valuesof V for firms closer to financial distress: Book values of debt are a particularly poor (upward-biased) proxy of the market value ofdebt for these firms. As pointed out previously, the incentive to shift risk is particularly relevant for such firms. Overstating V byoverstating the value of debt would lead to a downward biased estimate of the value of risk-shifting. Calculating V as describedallows us to avoid this bias.16
Appendix B. Analysis of announcement effects
Appendix B.1. Event date
The determination of the event date strictly follows the approach of Duca et al. (2012), who “assume that the publicannouncement of convertible debt offerings happens on the filing date obtained from SDC.” In footnote 12, Duca et al. state thatthey “manually cross-check the accuracy of the filing dates by verifying the actual announcement dates obtained from Factiva for100 convertible bond issues.” The researchers find that the SDC and Factiva dates are identical for all 100 issues. Because theirsample (January 1984 to December 2009) is almost the same as ours (January 1984 to December 2010), we rely on the sameassumption.
As mentioned by Duca et al. (2012), the filing date is, however, only available for publicly placed convertible bond issues. Intheir sample, 754 of the 1436 convertible debt issues were not publicly placed, which is consistent with the 50% proportion of ourconvertible issues for which SDC does not report a filing date. For the remainder of the convertibles, we manually look up theannouncement date in Factiva, as suggested by Duca et al. (2012).
is comparable to computing implied option volatilities when all other pricing parameters and the price of an option are observed.average, our estimates of V are 9.77% below the book value-based estimates.
54 C. Dorion et al. / Journal of Corporate Finance 24 (2014) 38–56
For 50 randomly picked post-1996 issues, we double-check the announcement date obtained from Factiva by looking for theearliest corresponding form on the SEC's EDGAR system.17 For five of these private issues, we cannot find a corresponding reporton EDGAR. For 43 issues, using EDGAR would have led to the exact same date as using Factiva. For the two remaining issues, theissue date in Factiva is one or two days earlier than the date in EDGAR.
Appendix B.2. Credit spread data
Our initial sample is identical to the main sample of 1229 convertible debt announcements we use in the study of equityreturns. Using names and CUSIP identifiers of the convertible issuer, we match this dataset to the TRACE (Trade Reporting andCompliance Engine) and the Mergent FISD (Fixed Income Securities Database) databases, from which we obtain trading data andinformation about bond characteristics, respectively. In a first step, we match 868 of the events to issuers for which trading dataare reported in TRACE. In total, data for 2397 bonds from these issuers is available from both TRACE and FISD. For a large part ofthese events, trading data is only available for convertible bonds. After discarding all 834 convertible debt issues, the number ofevents for which bond data is reported in FISD and TRACE falls to 376. A large portion of the remaining bonds was inactive as ofthe announcement date. That is, the remaining bonds either matured before the date or were issued afterwards. Droppinginactive observations leaves bond observations for 182 announcements. Given that corporate bonds are traded infrequently, thisnumber falls further when we require the bonds to be traded during the event window, as described below.
Appendix B.3. Changes in credit spreads
In a first step, we calculate the yield spread for each bond trade by subtracting a maturity-matched, risk-free rate from theyield reported in TRACE.18 For each announcement date ADi, we then derive before- and after-announcement reference dates RDas the dates for which trading data are reported in TRACE, and which are at least two, but no longer than five, days before or afterthe announcement date. If trades are reported on multiple days before and after the announcement, we use the dates that areclosest to the announcement (but still not closer than two days). Thus, RDbefore = max(ADi − bi) and RDafter = min(ADi + ai),where bi and ai are between 2 and 5. This procedure yields an average event window of 5.46 days. Increasing the length of theevent window would increase the sample size, but would simultaneously yield more noisy estimates of announcement effects.Finally, we define our measure of the announcement effect on credit spreads as
17 As n6, 1996exempt18 Weused to
ΔCSi ¼1Ni
XNi
j¼1
CSi; j;after−CSi; j;before� �
; ðB:1Þ
CSi; j;before and CSi; j;after are the average credit spreads of all trades on bond j reported by the issuing firm i for the RDbefore and
whereRDafter. Ni is the number of bond issues of firm i with available data.
Appendix C. Control variables
• CD to Total Debt: Convertible debt scaled by total debt. The level of convertible debt is primarily based on Compustat item DCVT.For firms issuing convertibles more than once in the same fiscal period, we account for the potential impact of previous issueson the capital structure of the firm. Total debt is the sum of long-term debt and debt in current liabilities (Compustat Items(DLTT + DLC)).
• Leverage: Total debt (Compustat items DLTT + DLC) scaled by the sum of total debt and the market value of equity (CRSP itemsPRC × SHROUT).
• Log MB: The natural logarithm of the ratio of market and book value of equity, where market values are taken from CRSP andthe book value of equity equals Compustat item SEQADJ.
• Stock Return Volatility: The annualized standard deviation of monthly stock returns reported in CRSP of up to 10 years beforethe event. We require at least 12 months of data.
• Nasdaq Listing: Dummy indicating Nasdaq listing. Equals one when Compustat item EXCHG is 14, and zero otherwise.• Firm Size: The natural logarithm of the sum of the market value of equity (CRSP items PRC × SHROUT) and total debt (Compustatitems DLTT + DLC) in millions.
• Tangibility: Plant property and equipment scaled by the book value of assets (Compustat items PPEGT/AT).• R&D Intensity: R&D expenditure scaled by sales (Compustat items XRD/SALE).• Amihud Liquidity: Average of the ratio of absolute daily returns and daily trading volume observed during 12 months. Wemultiply the measure by 106 for displaying purposes and require at least three months of data.
oted on EDGAR's website (http://www.sec.gov/edgar/aboutedgar.htm), “Companies were phased in to EDGAR filing over a three-year period, ending May. As of that date, all public domestic companies were required to make their filings on EDGAR, except for filings made in paper because of a hardshipion.”obtain the risk-free rate from Treasury yield curves constructed using cubic spline interpolation, in the same way we did in Subsection 3.3.1. The maturityobtain the risk-free rate is equals to the time between the TRACE trading date and the bond maturity reported in FISD.
55C. Dorion et al. / Journal of Corporate Finance 24 (2014) 38–56
• Dividend Paying: Dummy indicating whether a firm pays dividends. The dummy is set to one when Compustat item DVC isabove zero.
• Dividend Paying: Dummy indicating whether a debt issue is made under Rule 144a.• Financial Distress: π = TLMTA∗ − NIMTAAVG∗ − CASHMTA∗ + MB∗ − RSIZE∗ − PRICE∗ − EXRETAVG∗ + SIGMA∗. The variablesentering the calculation are identified by Campbell et al. (2008) as the most powerful predictors of corporate default.Specifically, NIMTAAVG, TLMTA, and CASHMTA measure net income, liabilities and cash holdings relative to an estimate of themarket value of assets, respectively. EXRETAVG is the stock's 12 months excess return over the S&P500; SIGMAmeasures equityvolatility; RSIZE is the market value of equity relative to the total market value of the S&P500; MB is the market-to-book ratio,and PRICE is the stock price truncated at 15. In line with citeCampbell-etal-2008, we winsorize all variables at the 5th and 95thpercentiles of their distribution. The star ∗ indicates that we normalize each of the variables by subtracting their mean anddividing by their standard deviation. For further details on the derivation of these variables, see Campbell et al. (2008).
• Secured Debt: Secured long-term debt scaled by total long-term debt (Compustat item DM/DLTT).• Proceeds: Issue proceeds as reported in SDC Platinum scaled by the sum of total debt (Compustat items DLTT + DLC) and themarket value of equity (CRSP items PRC × SHROUT).
• Debt Maturity: Corresponds to the parameter T used to compute RSI and described previously.• Regulated Industries: Our sample of firms in regulated industries includes all firms with an SIC code from 4810 to 4899, 4910 to4924, and 4930 to 4941.
• CEO Ownership: Number of shares owned by the CEO scaled by total shares outstanding. Obtained directly from the CompustatExecuComp database (item SHROWNEXCLOPTSPCT).
• SP500 Return: Return on the S&P 500 index over a 12-month window. Obtained from CRSP.• Interest Rate: Interest rate on 10-year constant maturity Treasuries. Obtained from the Federal Reserve Bank reports.• Baa Credit Spread: Average Moody's Baa corporate bond yield minus the yield on 10-year constant maturity Treasuries.Obtained from the Federal Reserve Bank reports.
• Leading Indicator: Conference Board Leading Economic Indicator obtained from Datastream. It is computed from the followingcomponents: the average weekly hours worked by manufacturing workers, the average number of initial applications forunemployment insurance, the amount of manufacturers' new orders for consumer goods and materials, the speed of delivery ofnewmerchandise to vendors from suppliers, the amount of new orders for capital goods (excluding aircraft orders), the amountof new building permits for residential buildings, the S&P 500 stock index, a credit index, consumer sentiment, and the spreadbetween long and short interest rates.
References
Amihud, Y., 2002. Illiquidity and stock returns. J. Financ. Mark. 5, 31–56.Barclay, M.J., Smith, C.W., 1995. The maturity structure of corporate debt. J. Financ. 50, 606–631.Bharath, S., Shumway, T., 2008. Forecasting default with the merton distance to default model. Rev. Financ. Stud. 21, 1339–1369.Black, F., Scholes, M., 1973. The pricing of options and corporate liabilities. J. Polit. Econ. 81, 637–654.Brennan, M.J., Schwartz, E.S., 1988. The case for convertibles. J. Appl. Corp. Financ. 1, 55–65.Brown, S.J., Grundy, B.D., Lewis, C.M., Verwijmeren, P., 2012. Convertibles and hedge funds as distributors of equity exposure. Rev. Financ. Stud. 25, 3077–3112.Campbell, J.Y., Hilscher, J., Szilagyi, J., 2008. In search of distress risk. J. Financ. 63, 2899–2939.Chesney, M., Gibson-Asner, R., 2001. Reducing asset substitution with warrant and convertible debt issues. J. Deriv. 9, 39–52.Choi, D., Getmansky, M., Henderson, B., Tookes, H., 2010. Convertible bond arbitrageurs as suppliers of capital. Rev. Financ. Stud. 23, 2492–2522.Crosbie, P., Bohn, J., 2003. Modeling default risk. Working Paper. KMV Corporation, pp. 1–31.Dann, L.Y., Mikkelson, W.H., 1984. Convertible debt issuance, capital structure change and financing-related information: some new evidence. J. Financ. Econ. 13,
157–186.De Jong, A., Van Dijk, R., 2007. Determinants of leverage and agency problems: a regression approach with survey data. Eur. J. Financ. 13, 565–593.De Jong, A., Dutordoir, M., Verwijmeren, P., 2011. Why do convertible issuers simultaneously repurchase stock? An arbitrage-based explanation. J. Financ. Econ.
100, 113–129.Duca, E., Dutordoir, M., Veld, C., Verwijmeren, P., 2012. Why are convertible bond announcements associated with increasingly negative issuer stock returns?
An arbitrage-based explanation. J. Bank. Financ. 36, 2884–2899.Eckbo, B.E., 1986. Valuation effects of corporate debt offerings. J. Financ. Econ. 15, 119–151.Eisdorfer, A., 2008. Empirical evidence of risk-shifting in financially distressed firms. J. Financ. 63, 609–638.Eom, Y.H., Helwege, J., Huang, J.Z., 2004. Structural models of corporate bond pricing: an empirical analysis. Rev. Financ. Stud. 17, 499–544.François, P., Hübner, G., Papageorgiou, N., 2011. Strategic analysis of risk-shifting incentives with convertible debt. Q. J. Financ. 1, 293–321.Frierman, M., Viswanath, P., 1993. Agency problems of debt, convertible securities, and deviations from absolute priority in bankruptcy. J. Law Econ. 37, 455–476.Graham, J.R., Lemmon, M.L., Wolf, J.G., 2002. Does corporate diversification destroy value? J. Financ. 57, 695–720.Grass, G., 2010. The impact of conglomeration on the option value of equity. J. Bank. Financ. 34, 3010–3024.Green, R.C., 1984. Investment incentives, debt and warrants. J. Financ. Econ. 13, 115–136.Henderson, B.J., Zhao, B., 2014. More than meets the eye: convertible bond issuers' concurrent transactions. J. Corp. Financ. 24, 57–79 (this issue).Hennessy, C.A., Tserlukevich, Y., 2009. Taxation, agency conflicts, and the choice between callable and convertible debt. J. Econ. Theory 143, 374–404.Hovakimian, A., Opler, T., Titman, S., 2001. The debt-equity choice. J. Financ. Quant. Anal. 36, 1–24.Jalan, P., Barone-Adesi, G., 1995. Equity financing and corporate convertible bond policy. J. Bank. Financ. 19, 187–206.Jensen, M.C., Meckling, W.H., 1976. Theory of the firm: managerial behavior, agency costs and ownership structure. J. Financ. Econ. 3, 305–360.King, T.H.D., Mauer, D.C., 2014. Determinants of corporate call policy for convertible bonds. J. Corp. Financ. 24, 112–134 (this issue).Kraus, A., Brennan, M.J., 1987. Efficient financing under asymmetric information. J. Financ. 42, 1225–1243.Krishnaswami, S., Devrim, Y., 2008. The role of convertible bonds in alleviating contracting costs. Q. Rev. Econ. Finance 48, 792–816.Lee, H.W., Figlewicz, R.E., 1999. Characteristics of firms that issue convertible debt versus convertible preferred stock. Q. Rev. Econ. Finance 39, 547–563.Lewis, C.M., Verwijmeren, P., 2011. Security design and contract innovation. J. Corp. Financ. 17, 809–831.
56 C. Dorion et al. / Journal of Corporate Finance 24 (2014) 38–56
Lewis, C.M., Verwijmeren, P., 2014. Cash-settled convertible bonds and the value relevance of their accounting treatment. J. Corp. Financ. 24, 101–111 (this issue).Lewis, C.M., Rogalski, R.J., Seward, J.K., 1998. Agency problems, information asymmetries and convertible debt security design. J. Financ. Intermed. 7, 32–59.Lewis, C.M., Rogalski, R.J., Seward, J.K., 1999. Is convertible debt a substitute for straight debt or for common equity? Financ. Manag. 28, 5–27.Lewis, C.M., Rogalski, R.J., Seward, J.K., 2013. Risk changes around convertible debt offerings. J. Corp. Financ. 8, 67–80.Lyandres, E., Zhdanov, A., 2014. Convertible debt and investment timing. J. Corp. Financ. 24, 21–37 (this issue).Mayers, D., 2000. Convertible bonds: matching financial and real options. J. Appl. Corp. Financ. 13, 8–21.Merton, R.C., 1974. On the pricing of corporate debt: the risk structure of interest rates. J. Financ. 29, 449–470.Myers, S., 1977. The determinants of corporate borrowing. J. Financ. Econ. 5, 147–175.Nyborg, K.G., 1995. Convertible debt as delayed equity: forced versus voluntary conversion and the role of call policy. J. Financ. Intermed. 4, 358–395.Siddiqi, M.A., 2009. Investigating the effectiveness of convertible bonds in reducing agency costs: a Monte-Carlo approach. Q. Rev. Econ. Finance 49, 1360–1370.Stein, J.C., 1992. Convertible bonds as backdoor equity financing. J. Financ. Econ. 32, 3–21.Zeidler, F., Mark, M., Schiereck, D., 2012. Risk dynamics surrounding the issuance of convertible bonds. J. Corp. Financ. 18, 273–290.