Expert Group Meeting on Climate Change and Sustainable Development - The Role of Indicators Presentation from Brazil Brazilian Ministry of Planning, Budget and Management United Nations New York, October 15 - 16, 2008
Transcript
Expert Group Meeting on Climate Change and Sustainable Development - The Role of Indicators
Presentation from Brazil
Brazilian Ministry of Planning, Budget and Management
United NationsNew York, October 15 - 16, 2008
PesquisasPesquisas EstatEstatíísticassticas
GeografiaGeografia
DivisãoDivisãoTerritorialTerritorial
GeodGeodéésiasia
CartografiaCartografia
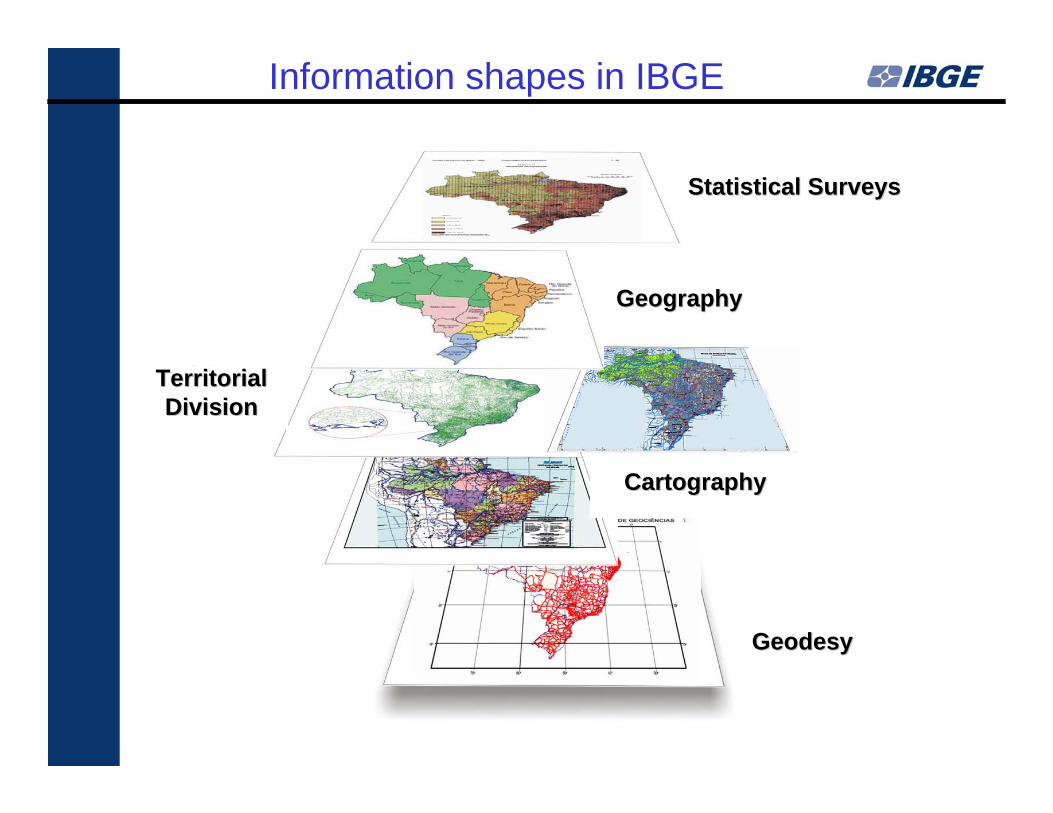
Information shapes in IBGE
Statistical SurveysStatistical Surveys
GeographyGeography
Territorial Territorial DivisionDivision
GeodesyGeodesy
CartographyCartography
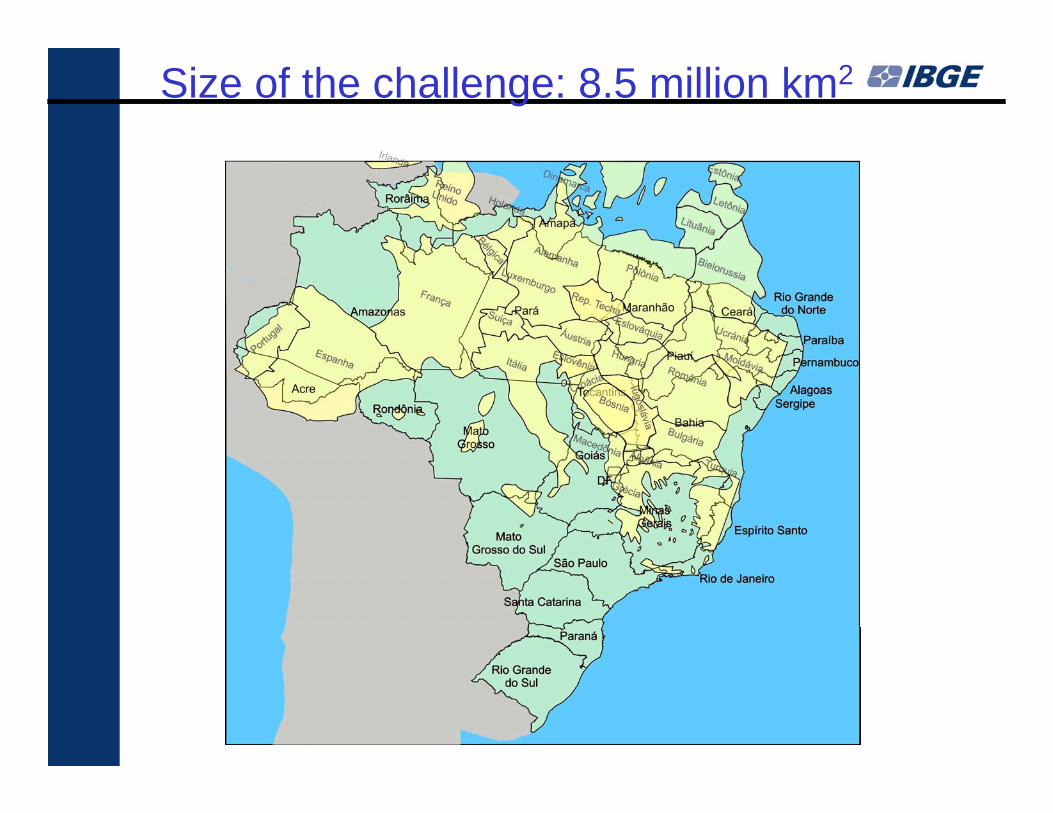
Size of the challenge: 8.5 million km2
• IBGE will publish each two years reports on Sustainable Development Indicators from Brazil.
Using the proposed framework in the background paper the existing indicators at the national report are.
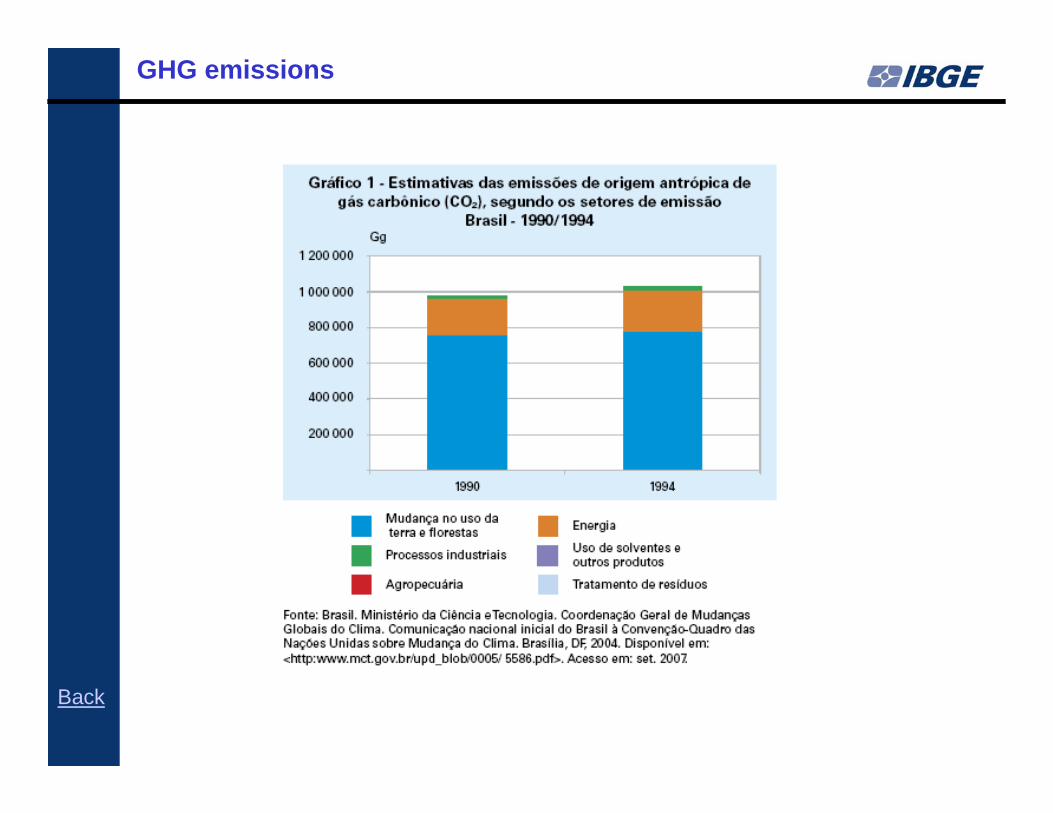
• Mitigation• GHG emissions
• GHG emissions by sector Go ...• Industrial consumption of ozone-depleting substances Go ...
•Energy• Energy intensity total Go ...• Participation of renewable sources in energy supply Go ...
• Industry and product use• Mineral consumption per capita Go ...• Usable life of mineral reserves Go ...
National SDI and Climate Change Indicators
• Using the proposed framework in the background paper the existing indicators at the national report are.
• Mitigation• Waste
• Final disposal of solid waste Go ...• Waste water treatment Go ...• Concentration of air pollutants in urban areas Go ...
• Agriculture. forests and other land use• Use of fertilizers Go ...• Deforestation of Brazilian Amazon Go ...• Deforestation and remnant area of Mata Atlântica Go ...
(Brazilian Atlantic Forest) and of coastal vegetation (restingas and mangroves)
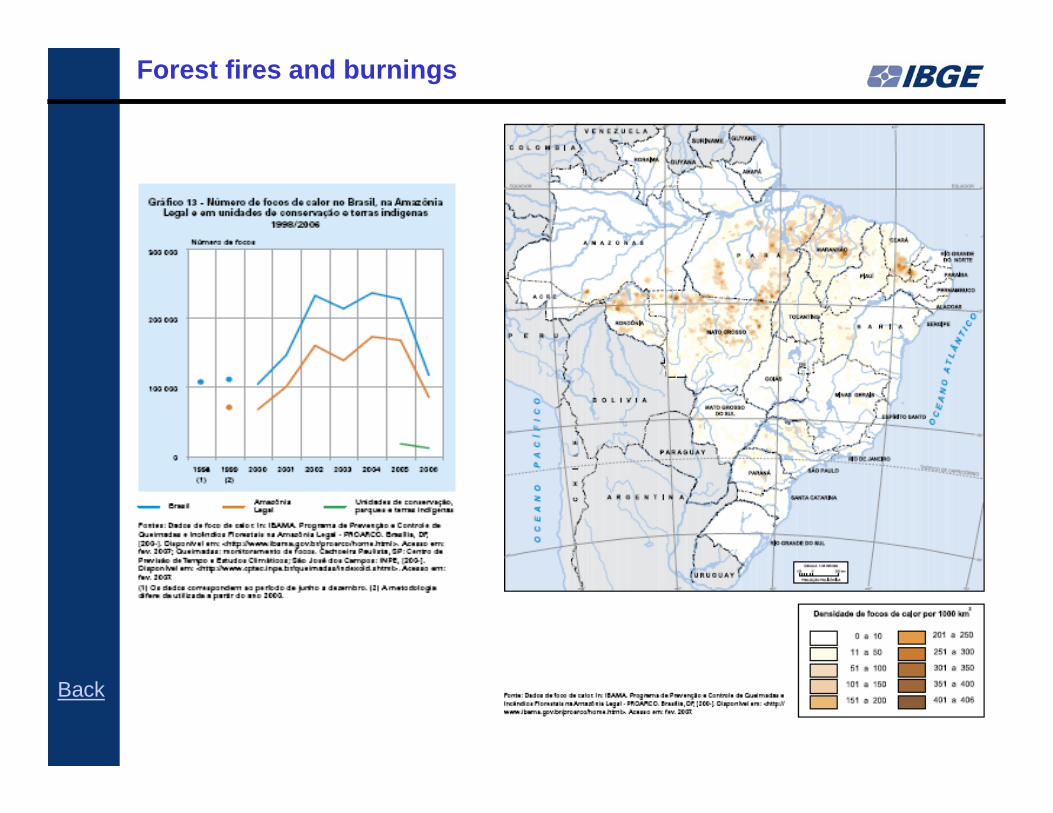
• Forest fires and burnings Go ...
National SDI and Climate Change Indicators
• Using the proposed framework in the background paper the existing indicators at the national report are.
• Adaptation•Agriculture.
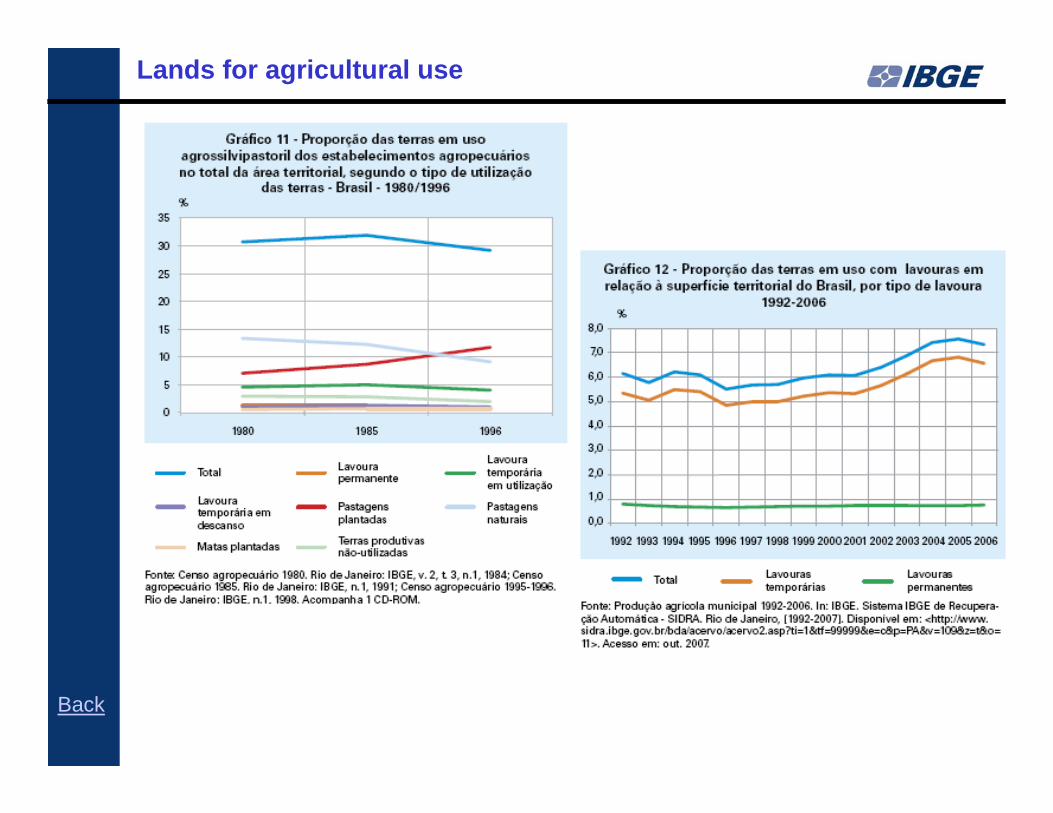
• Lands for agricultural use Go ...•Health
• DRSAI Diseases Related with Inadequate Environmental Sanitation Go ...
• Costal zone and marine environment • Population living in coastal areas Go ...
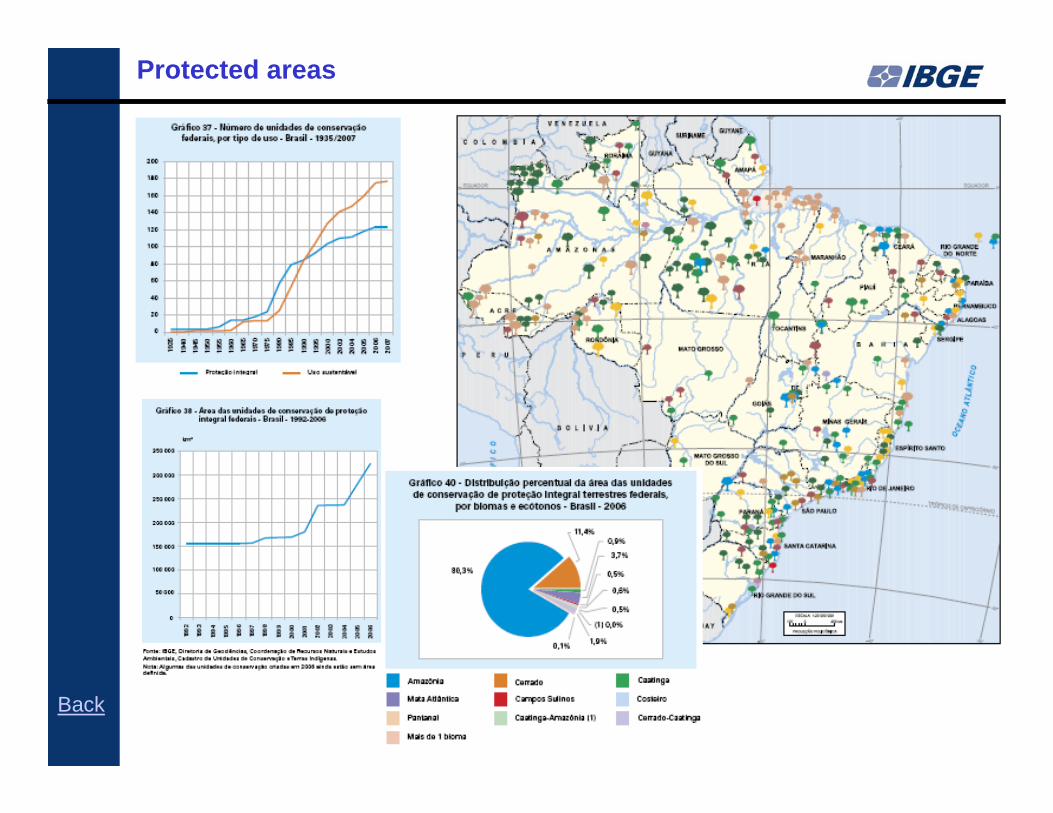
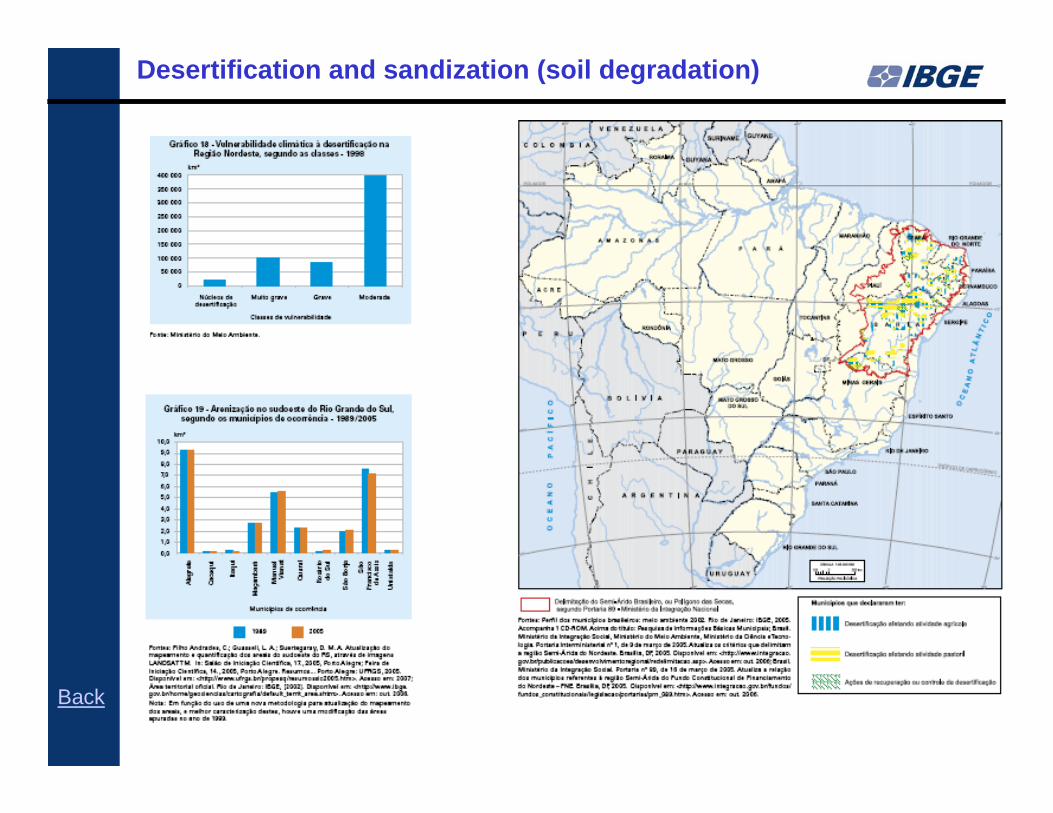
• Biodiversity• Threatened species Go ...• Invasive alien species Go ...• Protected areas Go ...• Desertification and sandization (soil degradation) Go ...
National SDI and Climate Change Indicators
• Using the proposed framework in the background paper the existing indicators at the national report are. • Adaptation
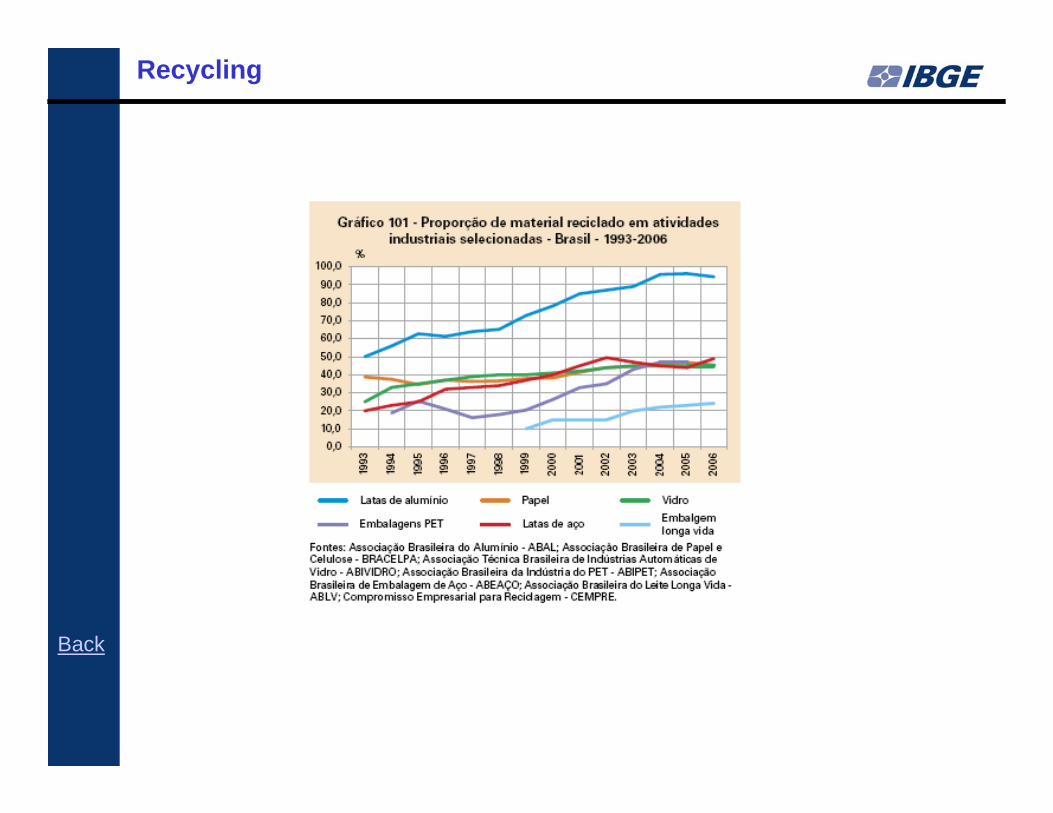
• Adaptative capacity • Proportion of population living below national poverty line Go ...• Proportion of population using an improved water source Go ...• Infant mortality rate Go ...• Gross domestic product per capita Go ...• Recycling Go ...• Solid waste selective collection Go ...
• Financing and technology
National SDI and National Plan on Climate Change
GHG emissions
Back
Industrial consumption of ozone-depleting substances
Back
Energy intensity total
Back
Participation of renewable sources in energy supply
Back
Gráfico 96 - Participação das fontes renováveis no total de energia ofertadaBrasil - 1992-2006
DRSAI Diseases Related with Inadequate Environmental Sanitation
Back
Population living in coastal areas
Back
Threatened species
Back
Invasive alien species
Back
Protected areas
Back
Desertification and sandization (soil degradation)
Back
Proportion of population living below “national poverty line”
Back
Proportion of population using an improved water source
Back
Infant mortality rate
Back
Gross domestic product per capita
Back
Recycling
Back
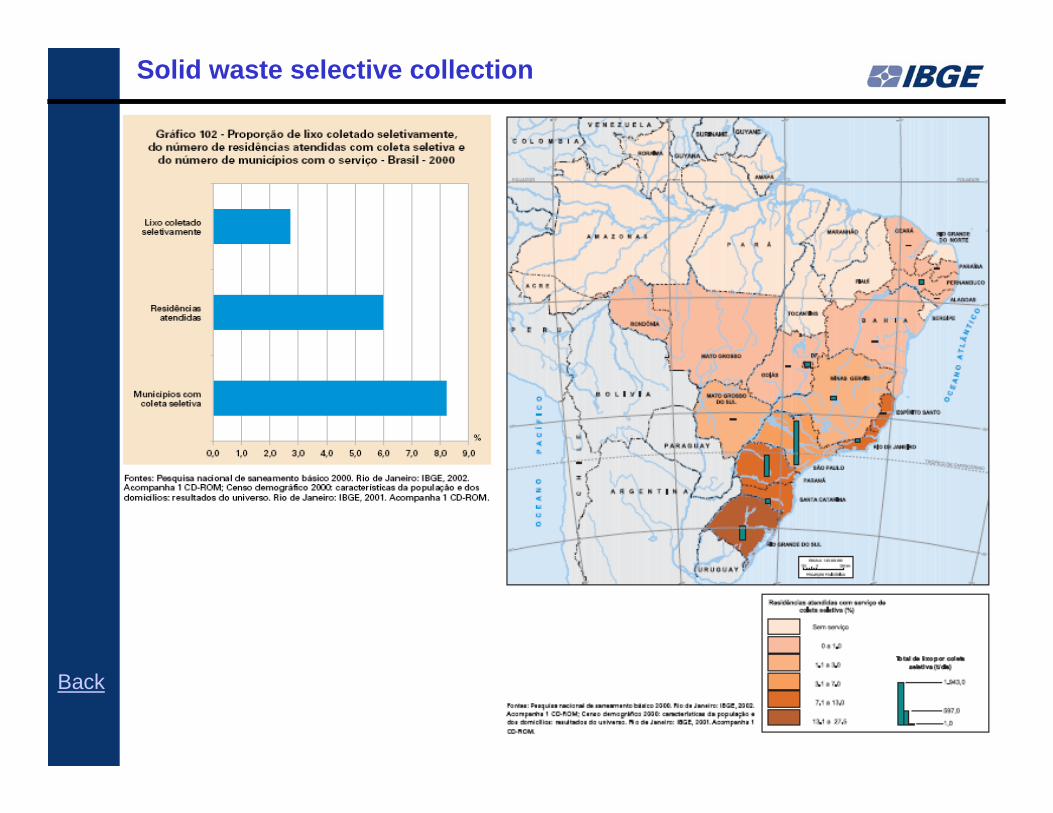
Solid waste selective collection
Back
Measuring the anthropic area (PRODES 2006)
Other possibilities beyond indicators using geographic and statistic information
Db - Floresta Ombrófila Densa das Terras Baixas
Ds - Floresta Ombrófila Densa Submontana
Campinarana
Pontos de inventário florestal em áreas de Db
Pontos de inventário florestal em áreas de Ds
Área Antrópica
8
12
4
37
5 6
TAILÂNDIA – Forest Invetory Points
310 300
200
304 311
284
231
158
0
50
100
150
200
250
300
350
m3 /
hect
are
Ponto 1 Ponto 2 Ponto 3 Ponto 4 Ponto 5 Ponto 6 Ponto 7 Ponto 8
Wood volume in similar forest points - Db
Mean of the 8 points262,37 m3/ha
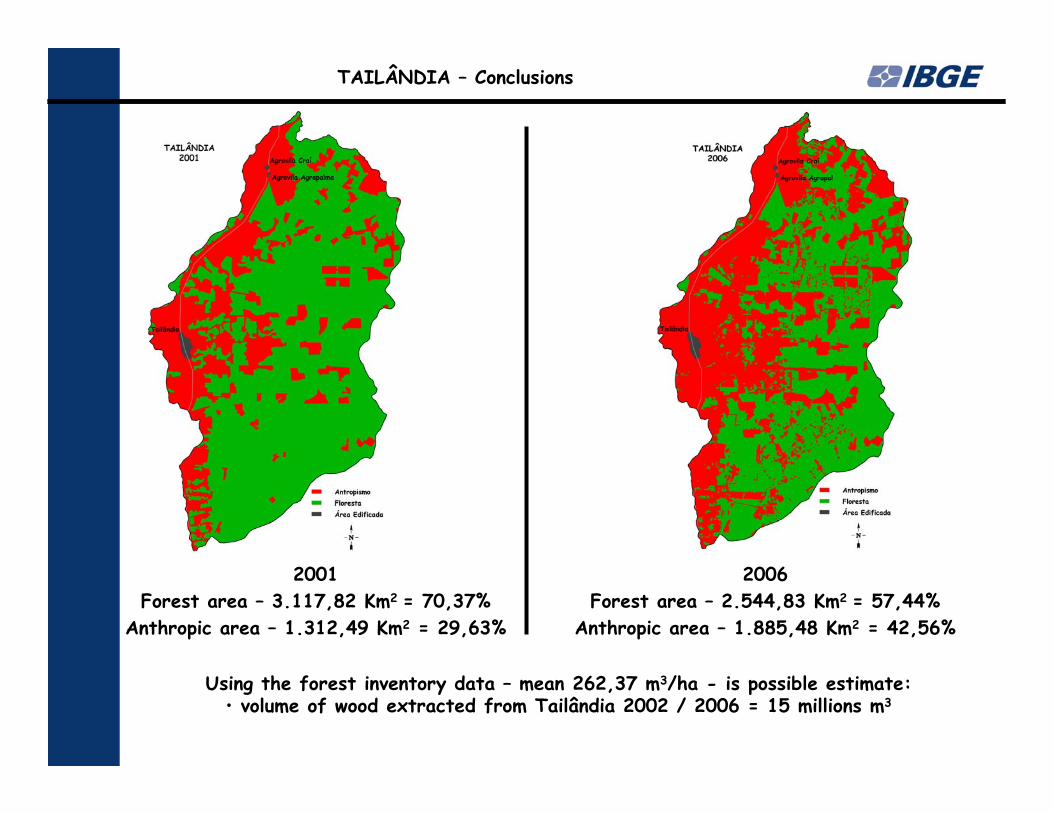
TAILÂNDIA – Conclusions
2001Forest area – 3.117,82 Km2 = 70,37%
Anthropic area – 1.312,49 Km2 = 29,63%
2006Forest area – 2.544,83 Km2 = 57,44%
Anthropic area – 1.885,48 Km2 = 42,56%
Using the forest inventory data – mean 262,37 m3/ha - is possible estimate:• volume of wood extracted from Tailândia 2002 / 2006 = 15 millions m3
• IBGE in cooperation with the Planning Ministry and other governmental agencies is creating a Geographical Information System - GIS Brazil - at 1:1 000 000 scale, according the National Spatial Data Infrastructure, that will contemplate shapes with environmental information.
• At local level the City of Rio de Janeiro has made an in deep evaluation of the climate change impacts
OTHER PRODUCTS
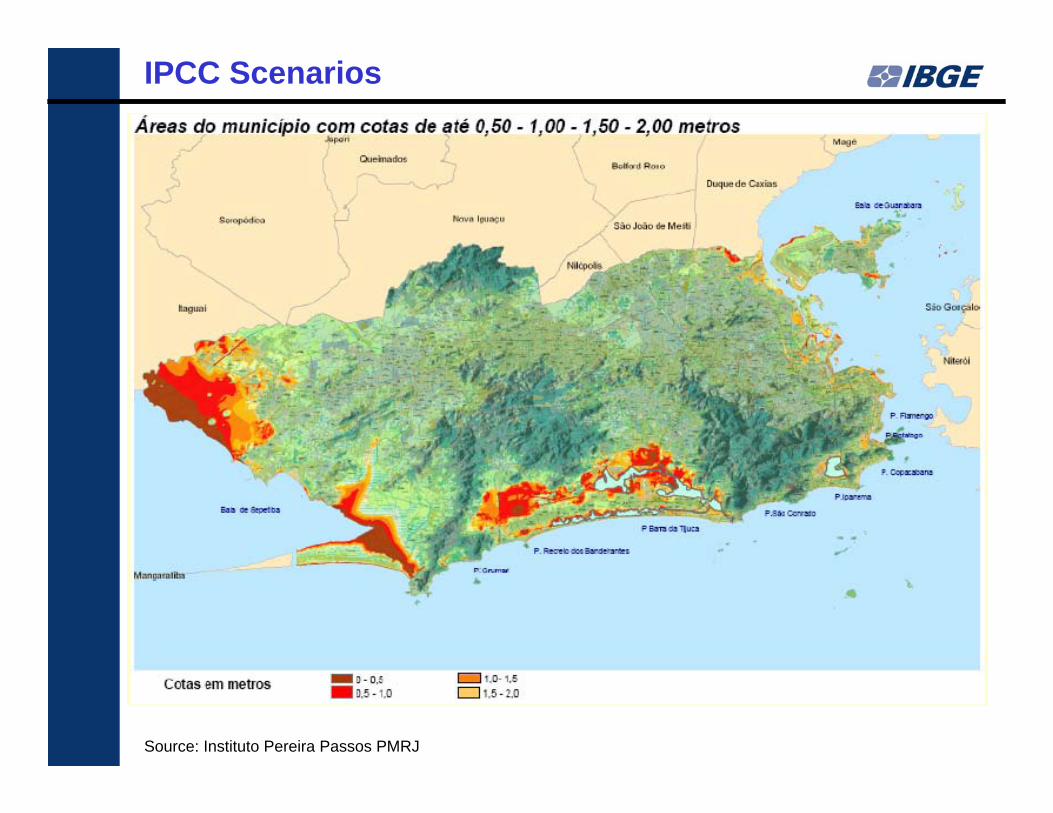
Source: Instituto Pereira Passos PMRJ
IPCC Scenarios
Source: Instituto Pereira Passos PMRJ
• There was not directly relationship between SDI and NSSD but in 2008 IBGE was contacted by the Planning Ministry that intents tostart a process of territorial planing including the sustainability dimension, using the National SDI as bases to make some commitments between the Federal Government and the Government at the States Level.
• The works has been started 3 month ago and now we propose a subset of 45 indicators, in 4 dimensions, that will be used to build targets for each indicator, at states level, and asses the achievement of the sustainable development targets.
• It is not properly a NSSD (at least not with this name) but is better because includes the sustainable development principles (and indicators) into the General Planning for Territorial Development
National SDI and NSSD
The especial configuration of IBGE (like INEGI in Mexico), that includes the statistical and geographical information into the same institution, is an advantage in the treatment of this issues in an integrated form.Now, we are working to improve your capacity to produce, recompile and organize the environmental information, in physical aspects and to start working on environmental-economic accounting on land use to be followed by forest accounting.
Conclusion:
Wadih João Scandar NetoNational SDI project manager