Investigations and corruption scandals:• Accusations against the President and
political allies;• Public Protests (starting in 2013):• Dilma impeached (August, 2016)
Inflation:6% (2013) 10% (2016)
Benchmark Interest Rate:7% (2013) 14% (2016)
Industry Confidence Index:58% (2013) 35% (2015)
Unemployment:5.4% (2013) 11.5% (2016)
Economic contraction (∆ GDP):2014 2015 2016
-0.3% -1.9% -2.5%
Refineries are chemical plants that transform crude oil into oil products
3
Crude oil Refinery Oil products
Raw oil as produced, with
varying qualities:
Density: lighter oil
yield higher valued
products
Sulfur content: sweet
(low sulfur) oil can be
refined simpler
refineries
Chemical plant with
varying complexity,
according to:
Oil quality: lower oil
quality can demand more
complex refineries
Mix of products: more
complex refineries can
yield higher valued
products
Fuels and chemical
feedstocks with varying
market values, such as:
Diesel
LPG
Jet fuel
Naphtha
Fuel Oil
Asphalt
First Refinery in
Brazil
1932 1938
CNP is Created
1946
First Petroleum reserve
discovered
1939
First Estate Owned
Refinery
Petrobras is Stablished
1960
Brazil is Auto sufficient
1980
Pro Alcohol Program
1953
Timeline
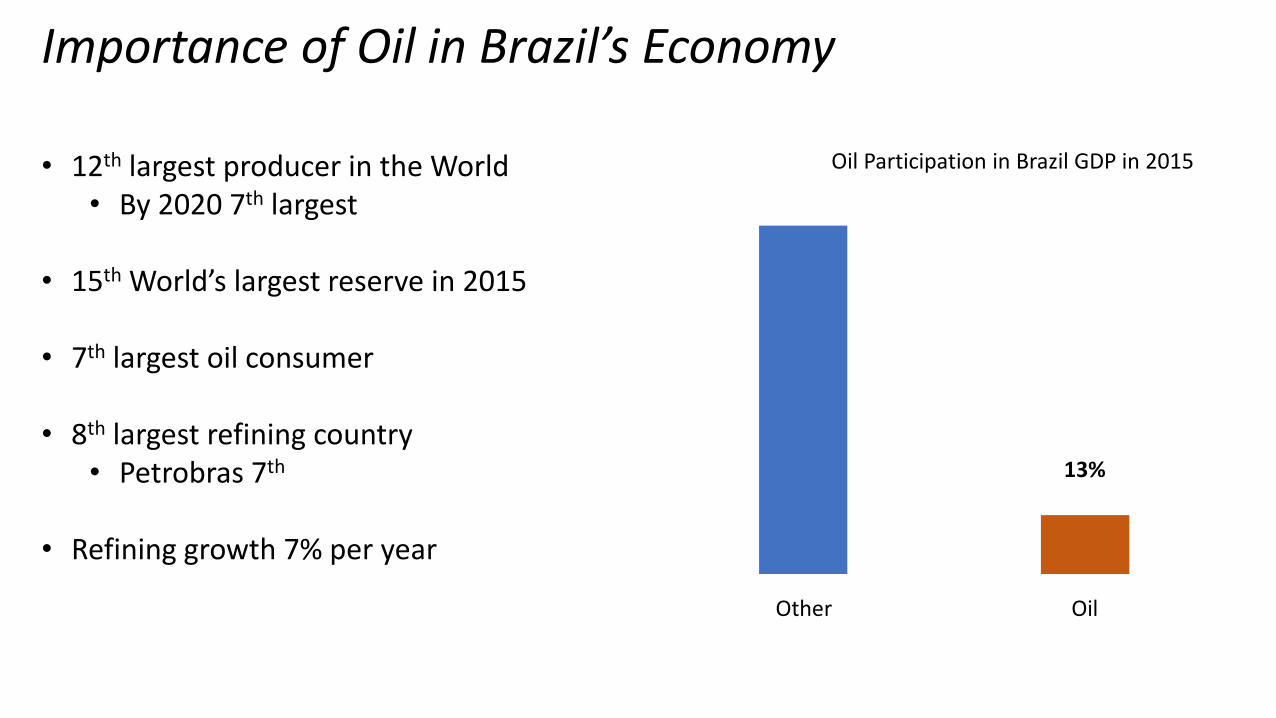
Importance of Oil in Brazil’s Economy
Oil Participation in Brazil GDP in 2015
13%
Other Oil
• 12th largest producer in the World• By 2020 7th largest
• 15th World’s largest reserve in 2015
• 7th largest oil consumer
• 8th largest refining country• Petrobras 7th
• Refining growth 7% per year
Petrobras98%
Private players2%
Refining
Petrobras80%
Private players20%
Crude productionFuels Distribution (85% of revenues)
Petrobras28%
Ipiranga19%
Other private players
37%
Raízen16%
Chemicals (<10% of revenues)
Braskem100%
Other private players
0%
INPUTS MAIN BUSINESS SELECTED OUTPUTS
Strategy, Structure, Rivalry
0.00%
10.00%
20.00%
30.00%
40.00%
50.00%
60.00%
Diesel Automotivegasoline
Fuel oil(including
bunker fuel)
Naphtha Liquefiedpetroleum
gas
Jet fuel Other oilproducts
Volume % Revenue %
0%
10%
20%
30%
40%
50%
60%
Retailmargin
Ethanol orBiodiesel
VAT (StateTax)
FederalTaxes
Petrobras*
Gasoline Diesel LPG
Price composition of Petrobras major outputs (in 2017)
Refining outputs for Petrobras, per volume and revenue (2015)
Outputs & Prices
8
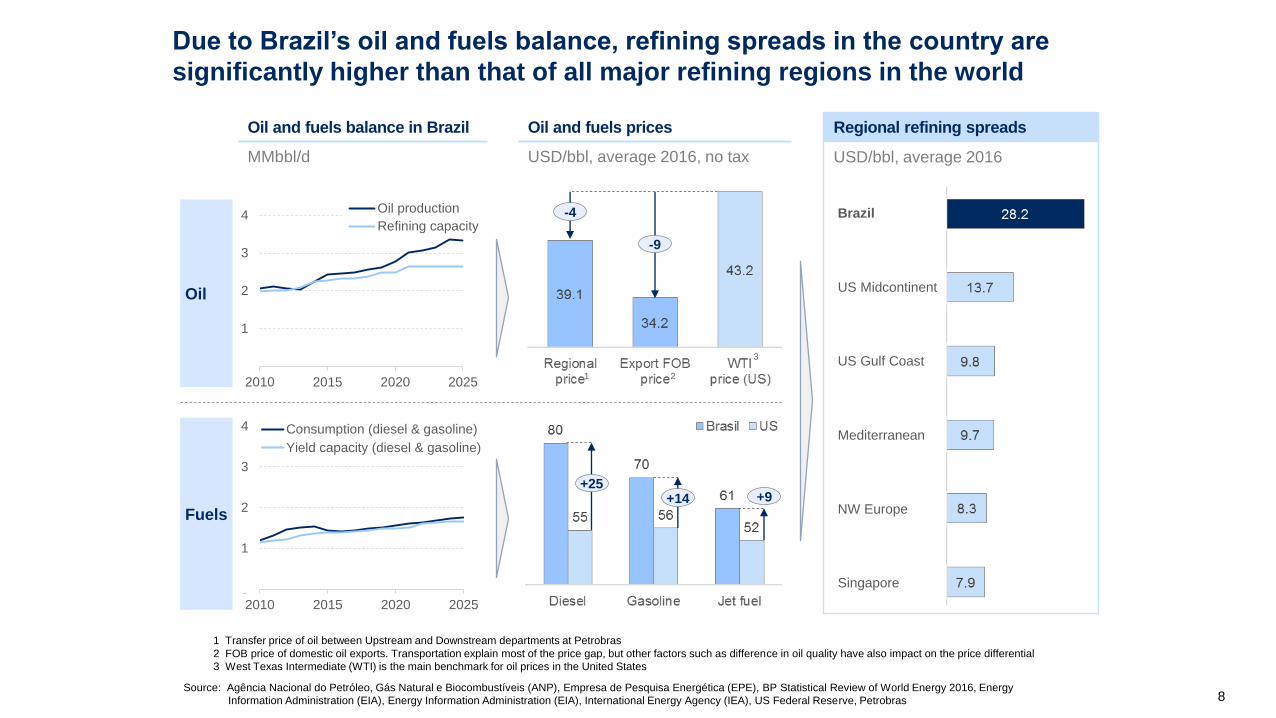
Oil and fuels balance in Brazil
MMbbl/d
Due to Brazil’s oil and fuels balance, refining spreads in the country are
significantly higher than that of all major refining regions in the world
0
1
2
3
4
2010 2015 2020 2025
Oil production
Refining capacity
Oil
Fuels
0
1
2
3
4
2010 2015 2020 2025
Consumption (diesel & gasoline)
Yield capacity (diesel & gasoline)
1 Transfer price of oil between Upstream and Downstream departments at Petrobras
2 FOB price of domestic oil exports. Transportation explain most of the price gap, but other factors such as difference in oil quality have also impact on the price differential
3 West Texas Intermediate (WTI) is the main benchmark for oil prices in the United States
Source: Agência Nacional do Petróleo, Gás Natural e Biocombustíveis (ANP), Empresa de Pesquisa Energética (EPE), BP Statistical Review of World Energy 2016, Energy
Information Administration (EIA), Energy Information Administration (EIA), International Energy Agency (IEA), US Federal Reserve, Petrobras
Oil and fuels prices
USD/bbl, average 2016, no tax
Brazil
US Midcontinent
US Gulf Coast
Mediterranean
NW Europe
Singapore
1 2
+25+14 +9
-9
-4
3
Regional refining spreads
USD/bbl, average 2016
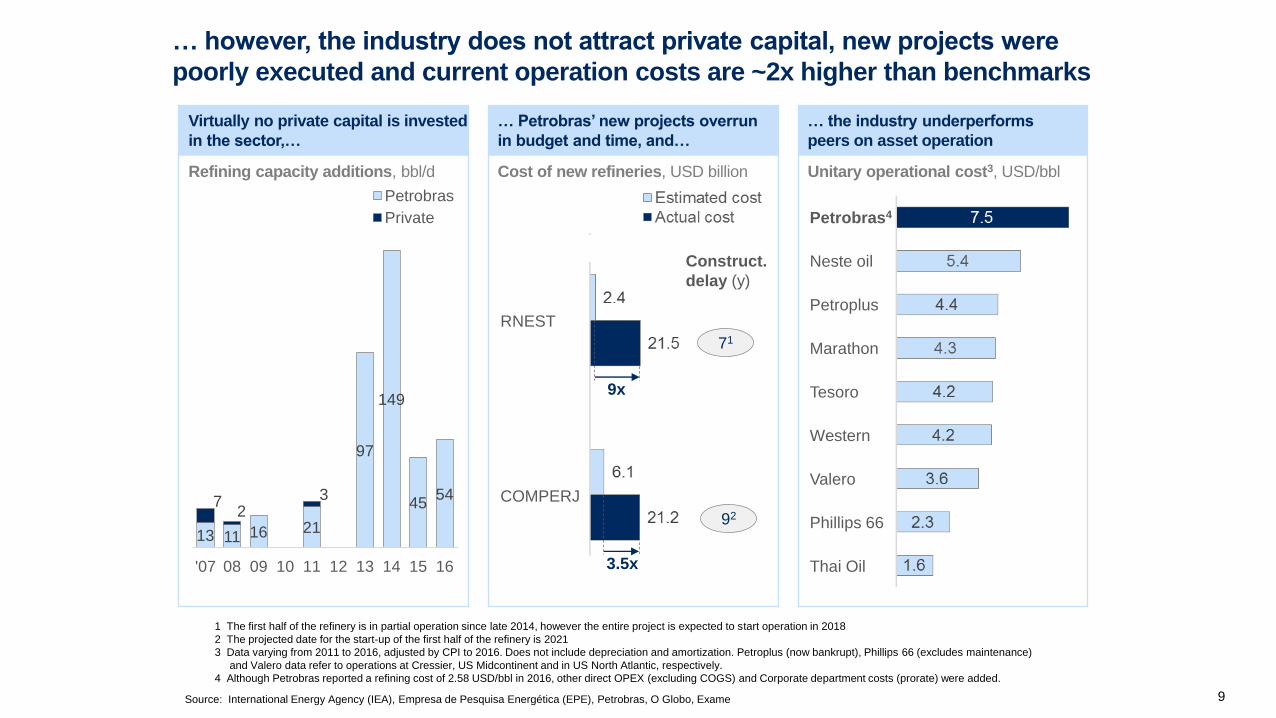
… however, the industry does not attract private capital, new projects were
poorly executed and current operation costs are ~2x higher than benchmarks
9
Virtually no private capital is invested
in the sector,…
… Petrobras’ new projects overrun
in budget and time, and…
… the industry underperforms
peers on asset operation
Refining capacity additions, bbl/d Cost of new refineries, USD billion Unitary operational cost3, USD/bbl
71
92
1 The first half of the refinery is in partial operation since late 2014, however the entire project is expected to start operation in 2018
2 The projected date for the start-up of the first half of the refinery is 2021
3 Data varying from 2011 to 2016, adjusted by CPI to 2016. Does not include depreciation and amortization. Petroplus (now bankrupt), Phillips 66 (excludes maintenance)
and Valero data refer to operations at Cressier, US Midcontinent and in US North Atlantic, respectively.
4 Although Petrobras reported a refining cost of 2.58 USD/bbl in 2016, other direct OPEX (excluding COGS) and Corporate department costs (prorate) were added.
Source: International Energy Agency (IEA), Empresa de Pesquisa Energética (EPE), Petrobras, O Globo, Exame
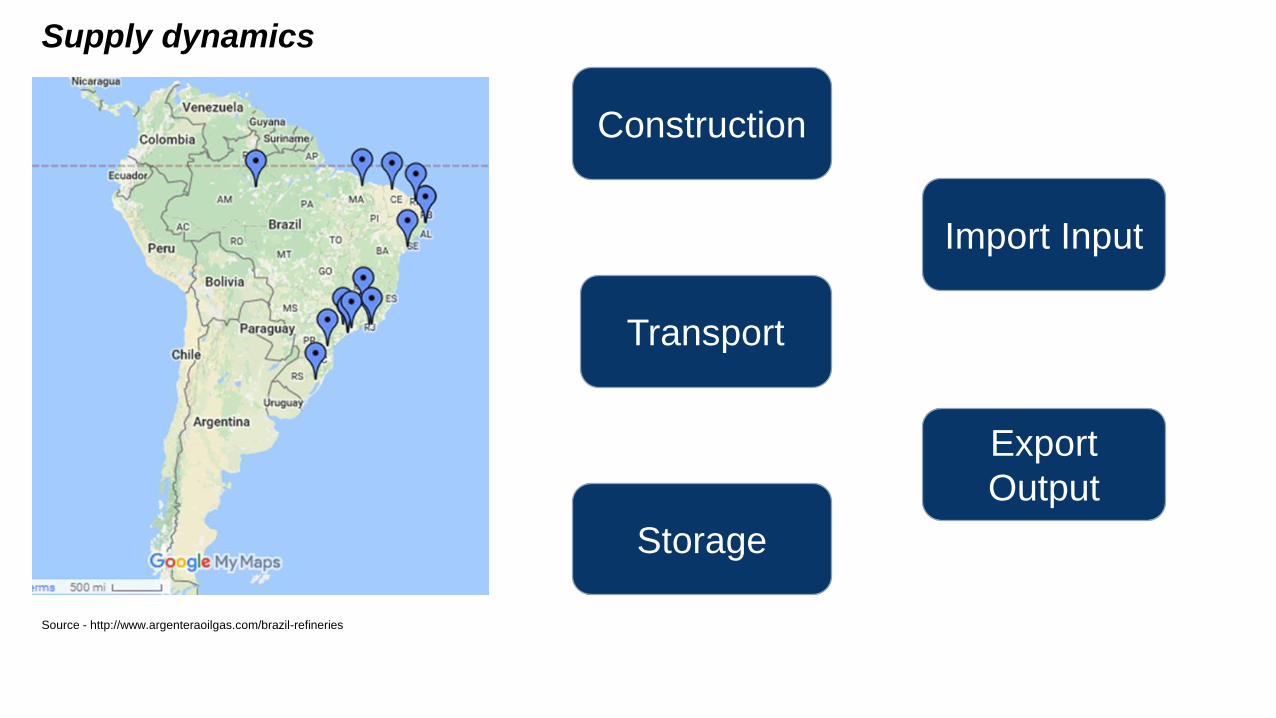
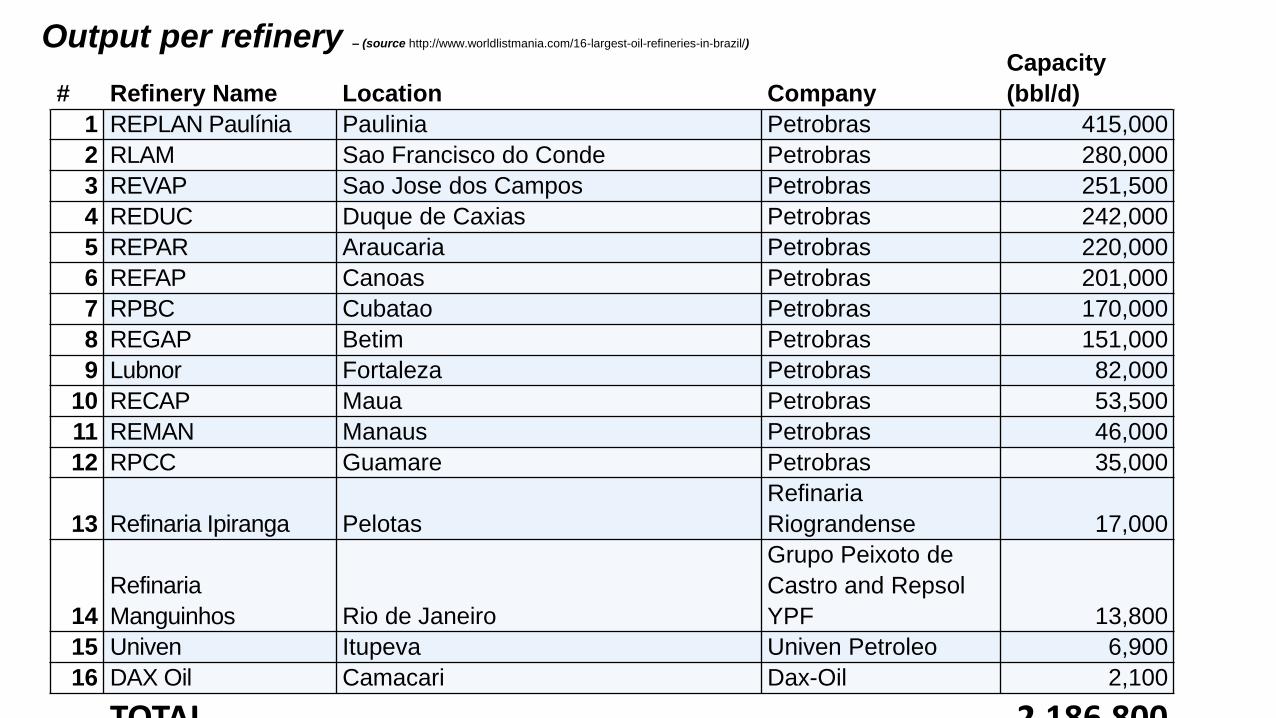
Output per refinery – (source http://www.worldlistmania.com/16-largest-oil-refineries-in-brazil/)
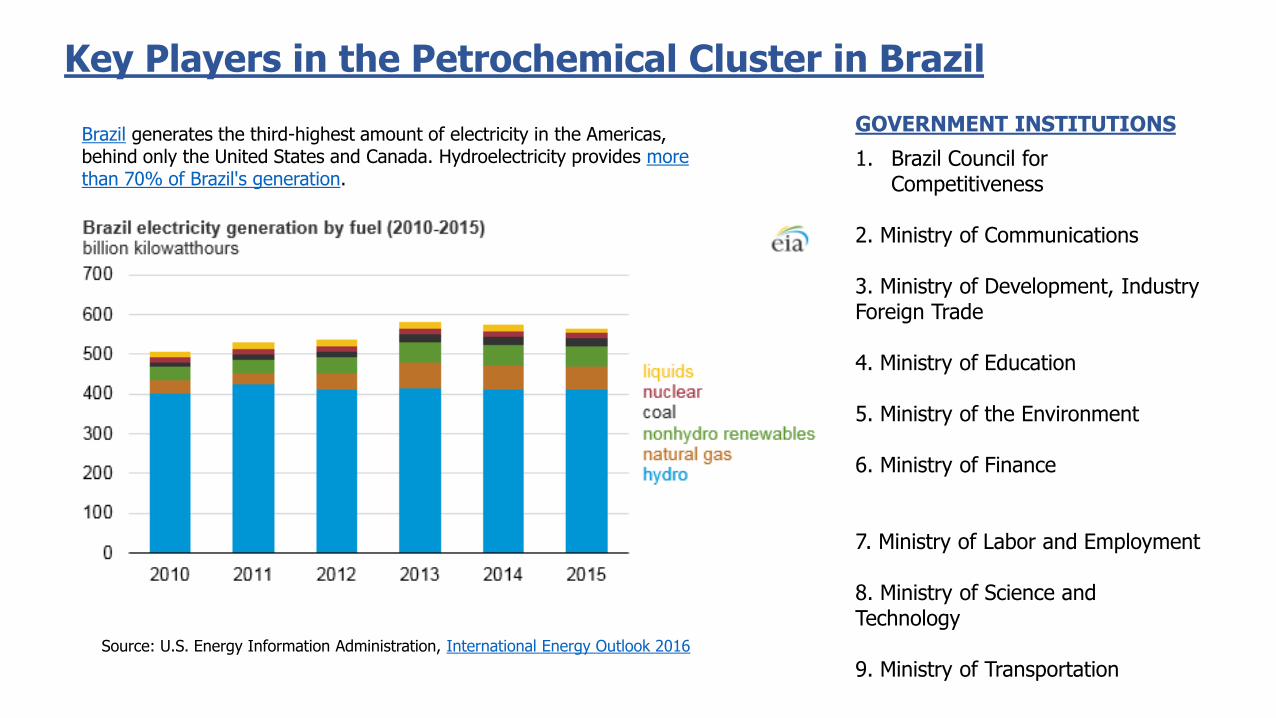
Source: U.S. Energy Information Administration, International Energy Outlook 2016
Brazil generates the third-highest amount of electricity in the Americas, behind only the United States and Canada. Hydroelectricity provides more than 70% of Brazil's generation.
Key Players in the Petrochemical Cluster in Brazil