20
KPMG in Brazil Brazilian Transnational Companies The route of Brazilian investments abroad
��
KPMG in Brazil
Brazilian Transnational Companies The route of Brazilian investments abroad

�8
Contents
About this report 3
Brazilian Transnational Companies - Overview 4
Main destinations of Brazilian Investments 10
Top 20 12
Main Brazilian Investments 15
Success Strategies 16
Challenges and Advantages 17

�9
In an unprecedented event, in 2006 the total Brazilian Direct Investments abroad outweighed the Foreign Direct Investments in Brazil.
The internationalization process reveals a country that, besides its image of supplier of mineral and agricultural commodities, wants to consolidate its position as a global player in the international trade of goods and services.
�

�

�
About this reportThis is a KPMG Brazil report which offers an overview of the new panorama of the Brazilian flow of direct investments abroad. The report is based on data published by the Central Bank of Brazil, United Nations Conference on Trade and Development (UNCTAD), Fundação Dom Cabral (FDC) and other media publications.
This information has been updated up to January 31, 2008. KPMG in Brazil cannot be held responsible for the accuracy of this information, whose sources are duly mentioned.
The Portuguese and the English version of this report may also be accessed at KPMG in Brazil´s website: www.kpmg.com.br
2006
accumulated investments abroad through
Brazilian Direct
US$152 Billion Balance of Brazilian
2006
US$97 Billion Balance of
49.4%of increase in the flow of Brazilian Direct Investment (BDI) in 2006 compared to 2005
Investments (BDI) accumulated abroad until 20061
US$32 Billion of additional Brazilian Direct Investments (BDI) in 2006 compared to 20051
Source: Central Bank of Brazil, 2007 census of the Brazilian Capital Abroad
1 On December 31, 2006. It does not include intercompany loans and considers only 10 percent or higher share capital in the invested company. Shareholding participation lower than 10 percent was allocated under “Portfolio” investments.
��
BrazilianTransnational Companies - Overview
Even though most of the major transnational companies (“TNCs”) of the world are concentrated in the European Union, United States and Japan, in recent years a significant change in this global scenario has taken place: a substantial increase has been observed in the number of companies in the developing countries exporting capital2.
In Brazil, although the expansion of the Brazilian transnationals’ contribution for the balance of foreign direct investment (FDI) account occurred almost a century after a similar development was observed in Europe and America (where TNCs had their internationalization process initiated after the First World War), Brazilian companies have been growing rapidly in recent years (mainly due to the Real appreciation).
Late or not so, one might state that “borders” are no longer
an obstacle for the Brazilian transnational concern, but part of a market expansion strategy and, sometimes, a surviving necessity. The liberalization of international commerce, the strength of the economic blocks and cross-border acquisition deals made the market an even more competitive environment.
In Brazil, the pioneers of the internationalization process began investing abroad in the 70’s. However, the Brazilian internationalization only grew significantly in recent years, and for the first time in history, in 2006 the Brazilian direct investment abroad outweighed the amount of equivalent FDI in Brazil.
Amongst the total amount of US$152.2 billion in declared Brazilian assets located abroad in 2006, the vast majority was represented by direct long-term investment3, which totalized US$97.7 billion (being US$91 billion related to the service sector).
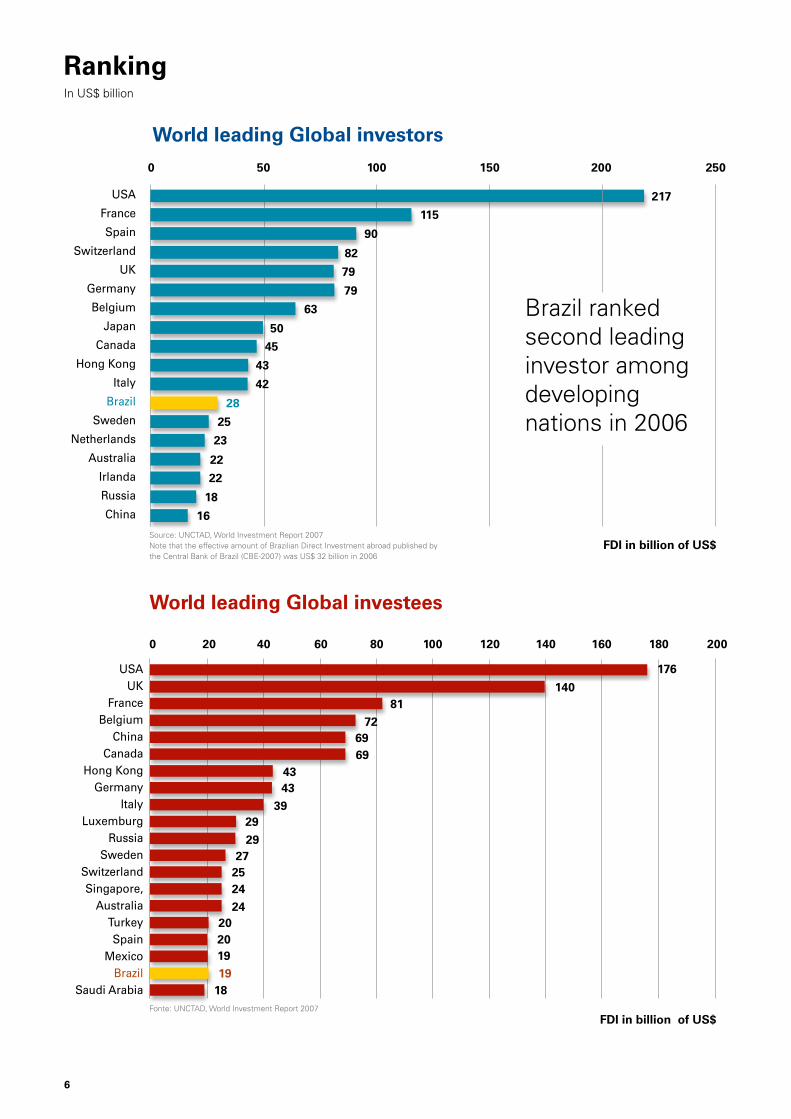
In addition, Brazil appears as the 19th major destination for global FDI. In 2006, Brazil received investments worth US$19 billion, a 20 percent increase compared to the prior year, which places the country as one of the main destinations for international investments. Besides being one of the main destinations for foreign direct investment, Brazil also boasts a strong presence in the scenario of capital exports.
According to the Central Bank of Brazil 2007 data (CBE - an annual census of the Brazilian total capital invested abroad), the total amount of BDI abroad reached the unprecedented mark of US$32.3 billion in FY2006. Such amount of outflow investment ranked Brazil 12th among the leading global investing countries in 2006, surpassing countries as Australia, China, Russia and Sweden4.
��

�
The unprecedent mark of the Brazilian Direct Investment abroad in 2006 ranked Brazil 12th
among leading global investing countries.
2 UNCTAD, World Investment Report 2007
3 On December 31, 2006. It does not include intercompany loans and considers only 10 percent or higher share capital in the invested company. Shareholding participation lower than 10 percent was allocated as “Portfolio” investments.
4 UNCTAD, World Investment Report 2007
�
RankingIn US$ billion
USA
France
Spain
Switzerland
UK
Germany
Belgium
Japan
Canada
Hong Kong
Italy
Brazil
Sweden
Netherlands
Australia
Irlanda
Russia
China
USA UK
France Belgium
China Canada
Hong Kong Germany
Italy Luxemburg
Russia Sweden
Switzerland Singapore,
Australia Turkey Spain
Mexico Brazil
Saudi Arabia
World leading Global investors
0 �0 �00 ��0 �00 ��0
Source: UNCTAD, World Investment Report 2007 Note that the effective amount of Brazilian Direct Investment abroad published by the Central Bank of Brazil (CBE-2007) was US$ 32 billion in 2006
��7
���
90
8�
79
79
�� Brazil ranked �0 second leading��
�� investor among �� developing �8
�� nations in 2006 ��
��
��
�8
��
FDI in billion of US$
World leading Global investees
0 �0 �0 �0 80 �00 ��0 ��0 ��0 �80 �00
Fonte: UNCTAD, World Investment Report 2007
8� 7�
�9
�� ��
�9 �9
�9
�7�
��0
�9 �7
������
�0 �0 �9 �9
�8
FDI in billion of US$
�
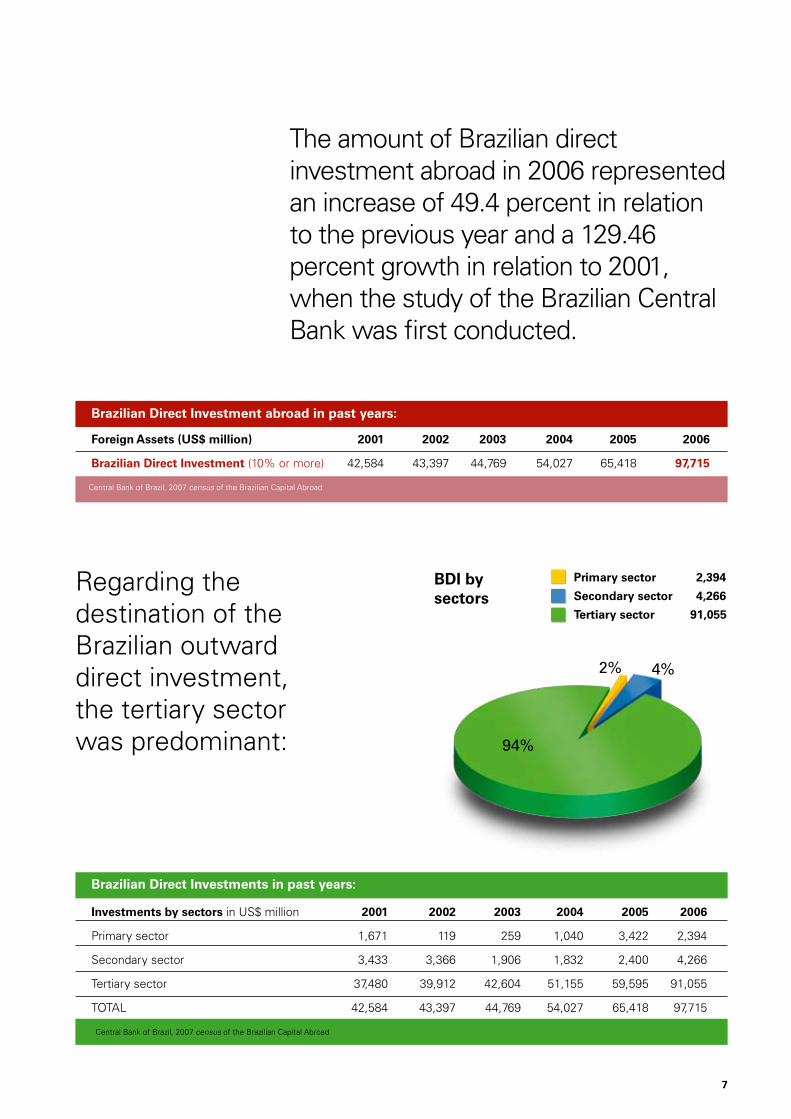
The amount of Brazilian direct investment abroad in 2006 represented an increase of 49.4 percent in relation to the previous year and a 129.46 percent growth in relation to 2001, when the study of the Brazilian Central Bank was first conducted.
Brazilian Direct Investment abroad in past years:
Foreign Assets (US$ million) �00� �00� �00� �00� �00� �00�
Brazilian Direct Investment (10% or more) 42,584 43,397 44,769 54,027 65,418 97,7��
Central Bank of Brazil, 2007 census of the Brazilian Capital Abroad
Regarding the destination of the Brazilian outward direct investment, the tertiary sector was predominant:
Primary sector �,�9� BDI by Secondary sector �,��� sectors Tertiary sector 9�,0��
2% 4%
94%
Brazilian Direct Investments in past years:
Investments by sectors in US$ million
Primary sector
Secondary sector
Tertiary sector
TOTAL
Central Bank of Brazil, 2007 census of the Brazilian Capital Abroad
�00�
1,671
3,433
37,480
42,584
�00�
119
3,366
39,912
43,397
�00�
259
1,906
42,604
44,769
�00�
1,040
1,832
51,155
54,027
�00�
3,422
2,400
59,595
65,418
�00�
2,394
4,266
91,055
97,715
7

8
9
Total (in US$ million) �00� �00� �00� �00� �00� �00�
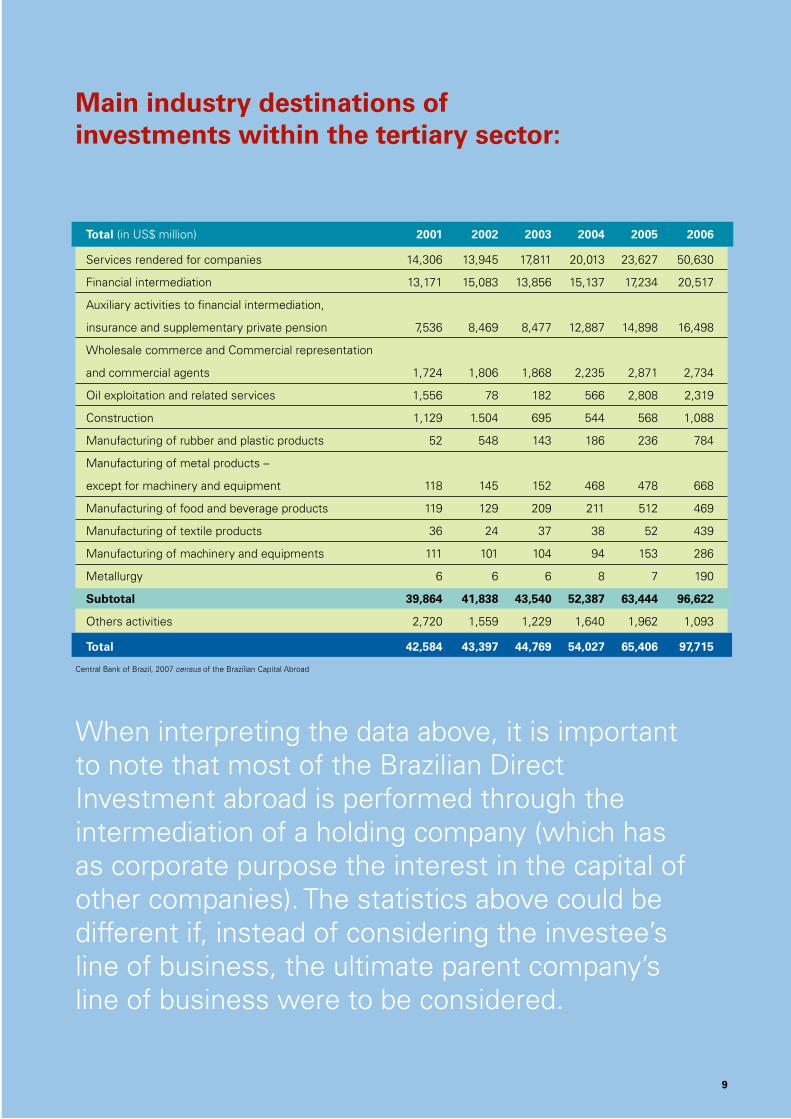
Services rendered for companies 14,306 13,945 17,811 20,013 23,627 50,630
Financial intermediation 13,171 15,083 13,856 15,137 17,234 20,517
Auxiliary activities to financial intermediation,
insurance and supplementary private pension 7,536 8,469 8,477 12,887 14,898 16,498
Wholesale commerce and Commercial representation
and commercial agents 1,724 1,806 1,868 2,235 2,871 2,734
Oil exploitation and related services 1,556 78 182 566 2,808 2,319
Construction 1,129 1.504 695 544 568 1,088
Manufacturing of rubber and plastic products 52 548 143 186 236 784
Manufacturing of metal products –
except for machinery and equipment 118 145 152 468 478 668
Manufacturing of food and beverage products 119 129 209 211 512 469
Manufacturing of textile products 36 24 37 38 52 439
Manufacturing of machinery and equipments 111 101 104 94 153 286
Metallurgy 6 6 6 8 7 190
Subtotal �9,8�� ��,8�8 ��,��0 ��,�87 ��,��� 9�,���
Others activities 2,720 1,559 1,229 1,640 1,962 1,093
Total ��,�8� ��,�97 ��,7�9 ��,0�7 ��,�0� 97,7��
When interpreting the data above, it is important to note that most of the Brazilian Direct Investment abroad is performed through the intermediation of a holding company (which has as corporate purpose the interest in the capital of other companies). The statistics above could be different if, instead of considering the investee’s line of business, the ultimate parent company’s line of business were to be considered.
Main industry destinations of investments within the tertiary sector:
Central Bank of Brazil, 2007 census of the Brazilian Capital Abroad
9

Main destinations of Brazilian Investments
According to the Central Bank of Brazil’s 2007 CBE publication, there is a noticeable steady flow of Brazilian investment to tax havens, mainly to Cayman Islands, the British Virgin Islands and the Bahamas. The United States of America continues as a predominant destination for Brazilian capital. As from 2004, Denmark joined the list of the most attractive destinations for Brazilian investments and, in 2006 Bermuda became one of the main choices as well.
Cayman Islands has kept the leadership in the list at US$20.3 billion, followed by Bermuda (US$15.1 billion), Denmark (US$10.4 billion), British Virgin Islands (US$10.3 billion) and Bahamas (US$9.3 billion). Those five countries account 66.8 percent of the total Brazilian Direct Investments abroad
Ranking of the major destinations of the Brazilian Direct Investment in US$ million 5 .
Countries �00� �00� �00� �00� �00� �00�
Cayman Islands 14,785 16,465 15,097 13,930 15,113 20,284
Bermuda 990 1,103 593 397 690 15,061
Denmark 16 8 10 6.460 9.466 10.361
British Virgin Islands 7,109 5,416 6,314 6,254 7,333 10,345
The Bahamas 5,954 6,958 6,565 7,825 7,449 9,259
Spain 1,657 2,953 1,775 2,934 3,324 4,221
United States of America 1,401 1,830 2,100 2,552 4,163 3,942
Luxembourg 584 402 2,055 3,114 3,512 3,918
Austria 21 106 324 397 659 3,819
The Netherlands 208 247 599 1,095 2,936 3,195
Argentina 1,625 1,503 1,549 1,722 2,068 2,136
Uruguay 3,121 1,547 2,810 1,657 1,748 1,743
Subtotal �7,�7� �8,��8 �9,79� �8,��7 �8,��� 88,�8�
Others countries 5,113 4,859 4,978 5,690 6,957 9,431
Total ��,�8� ��,�97 ��,7�9 ��,0�7 ��,��8 97,7��
5 Source: Central Bank of Brazil, 2007 census of the Brazilian Capital Abroad
�0

The primary destination of investments abroad is not always the country where the operating company to be acquired or to be incorporated is located in. The investment might pass through companies which are used as intermediary vehicles (holding companies) usually resident in European countries or tax havens. The attractiveness of those countries is based on the combination of reduced tax burden, simplified corporate rules and financial and political stability; in addition, those countries also enable a better administration of foreign investments, consolidation for accounting and financing purposes, etc.
Tax havens
According to the Central Bank of Brazil’s survey an amount of US$75.7 billion, out of a total amount of US$152 billion in Brazilian investment abroad, was directed to jurisdictions generally known for their tax haven regimes. Besides the utilization of tax havens for creating holding companies, many investments are carried out in those countries due to financial reasons.
The investment in tax havens has increased by 55 percent in 2006 in comparison to 2005. This increase exceeded the growth percentage of the Brazilian Direct Investments abroad (36 percent)6. According to the Brazilian IRS (SRF), tax havens are countries that do not tax income or that tax it at a rate below 20 percent and/or where domestic legislation permits the non-disclosure of the names of investing legal entities or their shareholders7.
This usually applies to companies interested in investing abroad. Those companies transfer their funds to an affiliate located in a tax haven country, and from that affiliate the funds are invested in other non-tax haven countries.
Percentage of Brazilian direct investments abroad, in the total amount of US$97.7 billion total in �00�, broken down by tax havens:
Main Tax havens ��% Cayman Islands
�0% Bermudas
7% British Virgin Islands
�% Bahamas
��% Other destinations of the BDI
Source: Central Bank of Brazil, 2007 census of the Brazilian Capital Abroad
6 Source: Folha de São Paulo. January 5th, 2008. 7 According to Instrução Normativa/SRF 188/2002, the following are considered as tax havens: Andorra, Anguilla, Antigua and Barbuda, Netherlands Antilles, Aruba, The Bahamas,
Bahrein, Barbados, Belize, Bermuda, Campione D`Itália Channel Islands (Alderney, Guernsey, Jersey and Sark), Cayman Islands, Cyprus, Singapore, Cook Islands, Costa Rica, Djibouti, Dominicana, United Arab Emirates, Gibraltar, Granada, Hong Kong, Labuan, Lebanon, Liberia, Liechtenstein, Luxembourg (concerning holding companies governed by local Law dated July 31, 1929), Macau, Madeira Islands, Maldives, Malta, Man Islands, Marshall Islands, Mauritius, Monaco, Montserrat Islands, Nauru, Niue Islands, Oman, Panama, St. Kitts and Nevis, American Samoa, Eastern Samoa, San Marino, Saint Vicent and the Grenadines, St. Lucia, Seychelles, Tonga, Turks and Caicos Islands, Vanuatu, U.S. Virgin Islands, and British Virgin Islands.
��
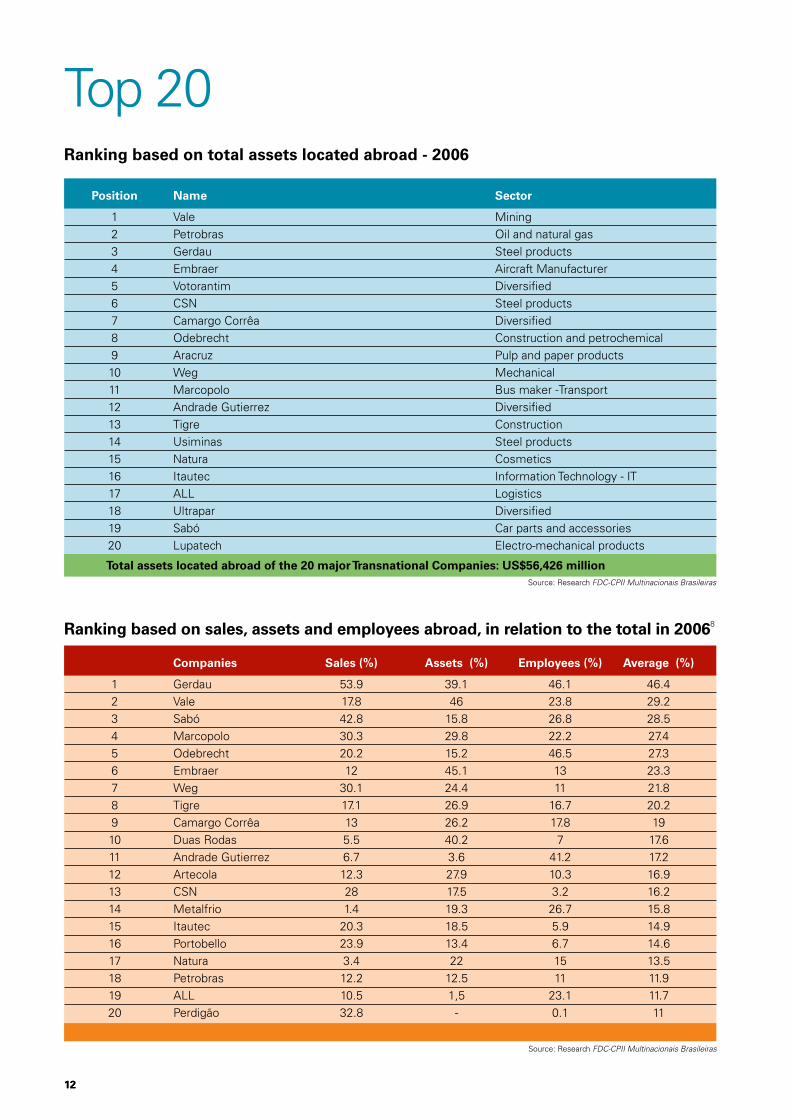
Top 20Ranking based on total assets located abroad - �00�
Position Name Sector
1 Vale Mining 2 Petrobras Oil and natural gas 3 Gerdau Steel products 4 Embraer Aircraft Manufacturer 5 Votorantim Diversified 6 CSN Steel products 7 Camargo Corrêa Diversified 8 Odebrecht Construction and petrochemical 9 Aracruz Pulp and paper products 10 Weg Mechanical 11 Marcopolo Bus maker -Transport 12 Andrade Gutierrez Diversified 13 Tigre Construction 14 Usiminas Steel products 15 Natura Cosmetics 16 Itautec Information Technology - IT 17 ALL Logistics 18 Ultrapar Diversified 19 Sabó Car parts and accessories 20 Lupatech Electro-mechanical products
Total assets located abroad of the �0 major Transnational Companies: US$��,��� million Source: Research FDC-CPII Multinacionais Brasileiras
Ranking based on sales, assets and employees abroad, in relation to the total in �00�8
Companies Sales (%) Assets (%) Employees (%) Average (%)
1 Gerdau 53.9 39.1 46.1 46.4 2 Vale 17.8 46 23.8 29.2 3 Sabó 42.8 15.8 26.8 28.5 4 Marcopolo 30.3 29.8 22.2 27.4 5 Odebrecht 20.2 15.2 46.5 27.3 6 Embraer 12 45.1 13 23.3 7 Weg 30.1 24.4 11 21.8 8 Tigre 17.1 26.9 16.7 20.2 9 Camargo Corrêa 13 26.2 17.8 19 10 Duas Rodas 5.5 40.2 7 17.6 11 Andrade Gutierrez 6.7 3.6 41.2 17.2 12 Artecola 12.3 27.9 10.3 16.9 13 CSN 28 17.5 3.2 16.2 14 Metalfrio 1.4 19.3 26.7 15.8 15 Itautec 20.3 18.5 5.9 14.9 16 Portobello 23.9 13.4 6.7 14.6 17 Natura 3.4 22 15 13.5 18 Petrobras 12.2 12.5 11 11.9 19 ALL 10.5 1,5 23.1 11.7 20 Perdigão 32.8 - 0.1 11
Source: Research FDC-CPII Multinacionais Brasileiras
����
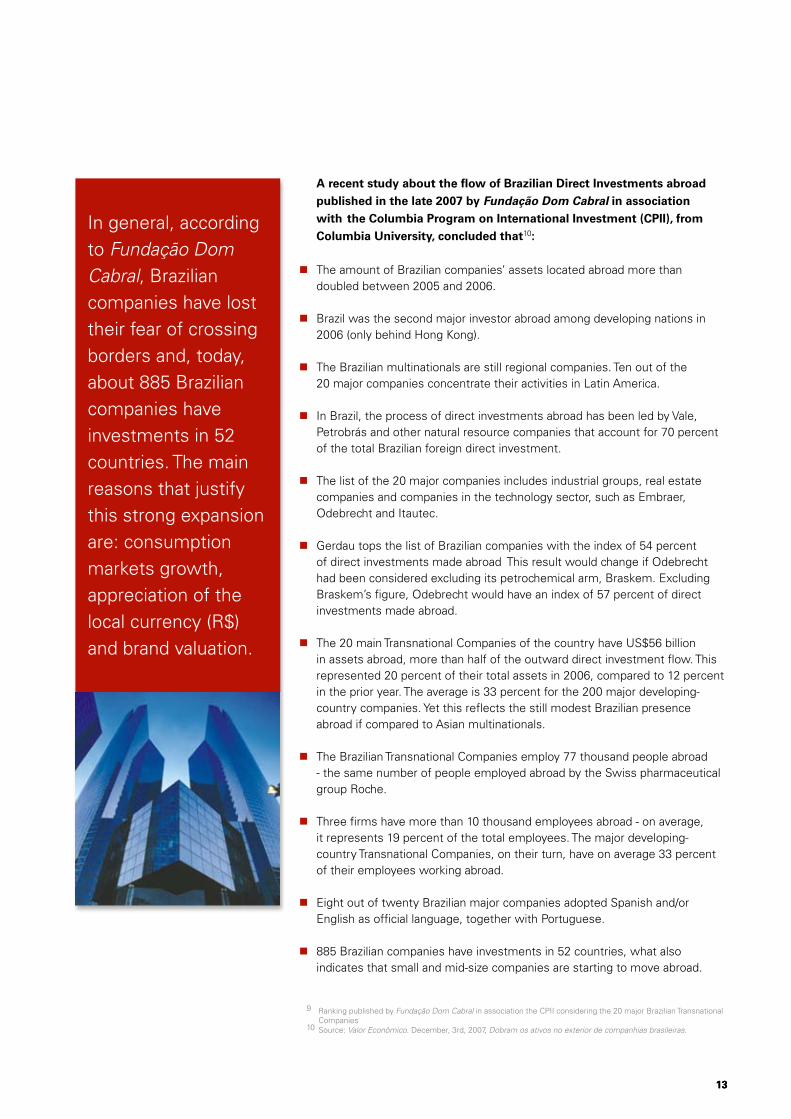
In general, according to Fundação Dom Cabral, Brazilian companies have lost their fear of crossing borders and, today, about 885 Brazilian companies have investments in 52 countries. The main reasons that justify this strong expansion are: consumption markets growth, appreciation of the local currency (R$) and brand valuation.
A recent study about the flow of Brazilian Direct Investments abroad published in the late �007 by Fundação Dom Cabral in association with the Columbia Program on International Investment (CPII), from Columbia University, concluded that10:
nThe amount of Brazilian companies’ assets located abroad more than doubled between 2005 and 2006.
nBrazil was the second major investor abroad among developing nations in 2006 (only behind Hong Kong).
nThe Brazilian multinationals are still regional companies. Ten out of the 20 major companies concentrate their activities in Latin America.
nIn Brazil, the process of direct investments abroad has been led by Vale, Petrobrás and other natural resource companies that account for 70 percent of the total Brazilian foreign direct investment.
nThe list of the 20 major companies includes industrial groups, real estate companies and companies in the technology sector, such as Embraer, Odebrecht and Itautec.
nGerdau tops the list of Brazilian companies with the index of 54 percent of direct investments made abroad This result would change if Odebrecht had been considered excluding its petrochemical arm, Braskem. Excluding Braskem’s figure, Odebrecht would have an index of 57 percent of direct investments made abroad.
nThe 20 main Transnational Companies of the country have US$56 billion in assets abroad, more than half of the outward direct investment flow. This represented 20 percent of their total assets in 2006, compared to 12 percent in the prior year. The average is 33 percent for the 200 major developingcountry companies. Yet this reflects the still modest Brazilian presence abroad if compared to Asian multinationals.
nThe Brazilian Transnational Companies employ 77 thousand people abroad - the same number of people employed abroad by the Swiss pharmaceutical group Roche.
nThree firms have more than 10 thousand employees abroad - on average, it represents 19 percent of the total employees. The major developingcountry Transnational Companies, on their turn, have on average 33 percent of their employees working abroad.
nEight out of twenty Brazilian major companies adopted Spanish and/or English as official language, together with Portuguese.
n885 Brazilian companies have investments in 52 countries, what also indicates that small and mid-size companies are starting to move abroad.
9 Ranking published by Fundação Dom Cabral in association the CPII considering the 20 major Brazilian Transnational Companies
10 Source: Valor Econômico. December, 3rd, 2007, Dobram os ativos no exterior de companhias brasileiras.
����

��
�
�
Geographical Distribution of the subsidiaries of the 10 Major BrazilianTransnational Companies
��� UK
� France
��� Spain
������Portugal Scandinavia
� Belgium
� The Netherlands
�� Germany
� Hungry
�� Switzerland ���
��������� � �
������ �
� � ����
��� � � �� � � �
�� � ��
�� Panama
� Ecuador � ��
����� Peru � ����� Argentina
�� Chile
�����Venezuela
���� Colombia � Companhia Vale do Rio Doce
���� Bolivia � Petrobrás S.A.
� Gerdau S.A.
� Embraer
� Votorantim
� CSN
� Camargo Corrêa
� Odebrecht
� Aracruz
� Weg
Source:Research FDC-CPII Multinacionais Brasileiras
��

Main Brazilian Investments
According to a KPMG Corporate Finance survey, M&A transactions involving Brazilian companies continued growing in 2007. In fact, from January to December, 699 M&A transactions took place, representing an increase of 48 percent in relation to the prior year (which had 226 fewer transactions). This number was a new record for M&A transactions.
Domestic economic factors favored M&A transactions, mainly due to the increase in consumption index, credit, interest rate reductions, country risk reduction and the increase of international reserves. Besides, the continued development
of the Brazilian capital market supported companies to be capitalized and financed to invest abroad.
Last years have witnessed a new panorama in which the Brazilian foreign direct investment outflow has had a steady increase. In 2007, the Brazilian acquisitions of foreign companies recorded a growth of 40 percent. KPMG Corporate Finance recorded 22 transactions in 2004, 24 transactions in 2005, 47 in 2006 and 66 in 2007.
Among the most important Brazilian investments abroad, we can throw a spotlight on the:
Acquisition of the Argentine Mirab by Marfrig in 200811
Acquisition of the American Swift Foods Company by Friboi (JBS) in 200712
Acquisition of the American Chaparral Steel by Gerdau in 200713
Acquisition of the Colombian Acerías Paz del Rio, of the American U.S. Zinc and the acquisition of 27 percent of Aceros de Bragado (AcerBrag)’s capital by Votorantim Group in 200714
Construction of a plant in Russia by Sadia in 200715
Acquisition of the Canadian INCO in 2006 and the Australian AMCI Holdings in 2007 by Vale16
Joint venture between Tata Motors and Marcopolo in 2006 for the construction in India of the largest bus plant in the world17
Acquisition of the Argentinean Loma Negra by Camargo Corrêa in 200518
11 Source: O Estado de São Paulo, January 3rd, 2008 12 www.jbs.com.br 13 www.gerdau.com.br 14 Source: Valor Econômico, December 27th, 2007 15 Source: Valor Econômico, December 3rd, 2007 16 www.vale.com.br 17 www.marcopolo.com.br 18 www.camargocorrea.com.br
��

��
Success Strategies
According to a study developed by the University of São Paulo (in a universe of companies in which 96 percent have plans of investing abroad) and published on Época Negócios magazine, and, despite the fact internationalization demands planning ,only 43 percent assured to have carefully prepared a study to do so19 . Questions such as professional hunting, training, cultural diversity, management flexibility among other aspects may raise concerns and should be considered before implementing any investment abroad.
On the other hand, opportunities such as reduction in logistic and labor costs, improved access to financing, new markets among others may appear as result of the internationalization.
When investing abroad, there are several financing options available for the investor. These options comprise bank loans, intercompany loans, foreign financing, capitalization of resources in the capital market and special lines of credit such as the ones offered by the Brazilian Development Bank - BNDES.
The tax burden associated with the investment should also be carefully
analyzed. The investor should be aware of the tax burden in the invested country as well as the respective impact in Brazil. The use of double tax treaties and their potential favorable outcomes should be considered20. It is not only important to analyze the investor-investees’ relationship but also the tax impact on the transactions carried out between the subsidiaries.
In the after-investment scenario, an important challenge is the transference of knowledge not only from headquarters to its affiliates abroad, but it is also important to be aware of the opportunities associated with learning from the foreign experience. In fact, the Brazilian companies investing abroad tend to take advantage of internationalization by not imposing their business culture on foreign affiliates; on the contrary, they create a new model based on the accumulated experience gained from both experiences.
The integration of operations, the after-acquisition processes and the autonomy level of subsidiaries are issues that deserve attention. The Transnational Companies should determine the autonomy level of
their foreign subsidiaries in relation to the parent company. Due to the lack of transparent policies, companies may delegate less than they should, resulting in limitation or loss for the subsidiaries’ entrepreneurship, headquarters’ work overload and discouragement for the foreign executives. The balance should be searched both by centralizing and decentralizing operations and administrative functions in order to avoid duplicity of tasks or inefficiency due to mistakes, when delegating responsibilities.
In the same study aforementioned, participants pointed out the human resources management as one of the main concerns of a company in an internationalization process. The expatriation of executives from the headquarters is common in the market; however, excesses and/or the lack of organization in this process may cause negative impact. Recruiting well becomes a challenge. The ideal teams should be heterogeneous and formed by professionals knowledgeable of the foreign culture, mission, figures and aware of the new market so as to contribute with information on local culture, operations and business goals. Without these elements, a great deal of the initiatives is bound to fail. It is mandatory that the professionals have the ability to cope with and accept different ideas and types of work from those they are used to.
19 Source: Época Negócios Magazine, December, 2007. The study was coordinated by the professors Afonso and Maria Tereza Fleury.
20 Countries with which Brazil has a double tax treaty in force: South Africa, Argentina, Austria, Belgium, Canada, Chile, China, Korea, Denmark, Ecuador, Spain, Philippine, Finland, Netherlands, Hungry, India, Israel, Italia, Japan, Luxembourg, Mexico, Norway, Portugal, Czech Republic, Slovakia, Sweden and Ukraine.
��
�7
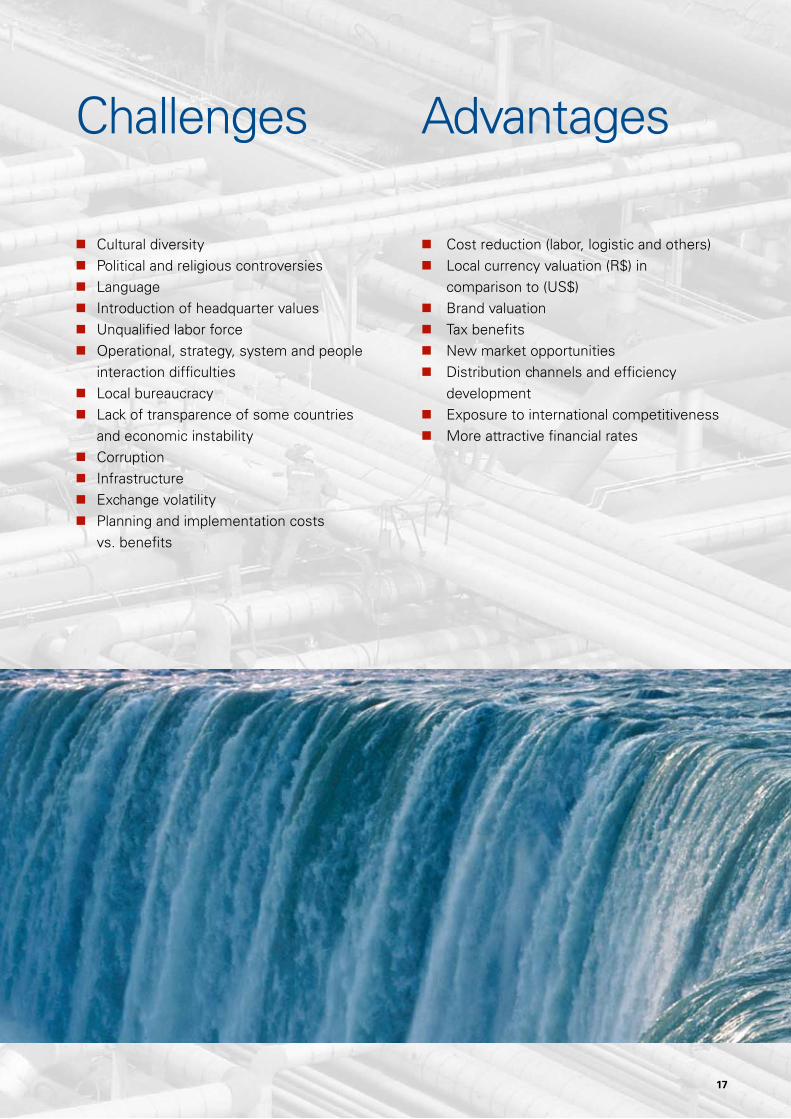
Challenges Advantages
nCultural diversity nPolitical and religious controversies nLanguage nIntroduction of headquarter values nUnqualified labor force nOperational, strategy, system and people
interaction difficulties nLocal bureaucracy nLack of transparence of some countries
and economic instability nCorruption nInfrastructure nExchange volatility nPlanning and implementation costs
vs. benefits
nCost reduction (labor, logistic and others) nLocal currency valuation (R$) in
comparison to (US$) nBrand valuation nTax benefits nNew market opportunities nDistribution channels and efficiency
development nExposure to international competitiveness nMore attractive financial rates
�7

�0
kpmg.com.br
Contacts:
International Corporate Tax Marienne Shiota Munhoz +55 11 2183.3182 [email protected]
Audit Pedro A. Melo +55 11 2183.3135 [email protected]
Corporate Finance Cláudio R. L. Ramos +55 11 3245.8313 [email protected]
China Desk Hsieh Yuan +55 11 2183.3112 [email protected]
Human Resources Advisory Services Patrícia Molino +55 11 3245.8021 [email protected]
Capital Markets Group Rogério Andrade +55 11 2183.3166 [email protected]
Risk Advisory Services Pieter Van Dijk +55 21 3515.9444 [email protected]
The information contained herein is of a general nature and is not intended to address the circumstances of any particular individual or entity. Although we endeavor to provide accurate and timely information, there can be no guarantee that such information is accurate as of the date it is received or that it will continue to be accurate in the future. No one should act on such information without appropriate professional advice after a thorough examination of the particular situation.
KPMG and the KPMG logo are registered trademarks of KPMG International, a Swiss cooperative.
© 2008 KPMG Tax Advisors - Assessores Tributários Ltda., a Brazilian member firm of the KPMG network of independent member firms affiliated with KPMG International, a Swiss cooperative. All rights reserved. Printed in Brazil.Date of publication: XXXX


