308
Breaking new ground The annual report 2018

Breaking new ground
The annual report 2018

Income statement (EUR million) 01/01 – 31/12/2018 01/01 – 31/12/20171
Net interest income 1,558 1,587
Net fee and commission income 513 534
Net gains/losses on remeasurement and disposal 222 289
of which allowances for losses on loans and securities2 – 142 – 93
Other operating income/expenses 140 101
Total operating income/expenses 2,433 2,511
Administrative expenses – 1,773 – 1,824
Expenses for bank levy and deposit guarantee system – 89 – 69
Guarantee commission for the State of Baden-Württemberg 0 – 61
Net income/expenses from restructuring – 12 – 41
Consolidated profit/loss before tax 558 515
Income taxes – 139 – 97
Net consolidated profit/loss 420 419
Key figures in % 01/01 – 31/12/2018 01/01 – 31/12/20171
Return on equity (RoE) 4.3 4.0
Cost/income ratio (CIR) 72.8 76.4
Balance sheet figures (EUR billion) 31/12/2018 31/12/20171
Total assets 241.2 237.7
Equity 13.2 13.4
Ratios in accordance with CRR/CRD IV (after full implementation) 31/12/2018 31/12/2017
Risk-weighted assets (EUR billion) 80.3 75.7
Common equity Tier 1 (CET 1) capital ratio (in %) 15.1 15.7
Total capital ratio (in %) 21.9 22.2
Employees 31/12/2018 31/12/2017
Group 10,017 10,326
1 The previous year’s figures based on IAS 39 were transferred to the structure of the IFRS 9 scheme without adjustments. 2 Relates to the category »Financial assets measured at amortized cost«. In addition, the allowances for losses on loans and advances for »Financial assets measured at fair value through other
comprehensive income« is attributable to a net reversal of EUR 1 million in the current year and a net addition of EUR 8 million in the previous year. Differences are due to rounding effects
Rating (25 February 2019)
Rating
Moody’s Investors
Service Rating Fitch
Ratings
Long-term Issuer Rating Aa3, stable Long-term Issuer Default Rating A–, stable
Long-term Bank Deposits
Senior Unsecured Bank Debt Junior Senior Unsecured Bank Debt
Aa3, stable
Aa3, stable A2
Long-term Deposit Rating
Long-term Senior Preferred Debt Rating Long-term Senior Non-Preferred Debt Rating
A–
A- A-
Short-term Ratings P–1 Short-term Issuer Default Rating F1
Baseline credit assessment (financial strength) baa2 Viability rating (financial strength) bbb +
Public-sector covered bonds Aaa Public-sector covered bonds -
Mortgage-backed covered bonds Aaa Mortgage-backed covered bonds -
Key figures of the LBBW Group

Key figures of the LBBW Group
Foreword by the Board of Managing Directors
Report of the Supervisory Board
Corporate governance at LBBW
Remuneration report
Report on gender equality and equal pay
Foreword and Reports
Page 4
Income statement
Total comprehensive income
Balance sheet
Statement of changes in equity
Cash flow statement
Notes
Consolidated Financial Statements
Page 120
Group overview
Business report of the Group
Risk report
ICS with regard to the accounting process
Outlook and opportunity report
Explanatory notes on the annual financial statements
of LBBW (Bank)
Non-financial statement
Combined Management Report
Page 26
Responsibility statement
Independent Auditor’s report
Limited assurance report of the independent auditor
regarding the combined non-financial statement
Note regarding forward-looking statements
Further information
Page 293
01
04
02
03

Foreword and Reports

Fo
rew
ord
by t
he
Boar
d o
f M
anag
ing
Dir
ecto
rs
5
Fore
wo
rd a
nd
re
po
rts
Dear Readers,
2018 was a special year for us as we celebrated the 200th anniversary of our Bank, whose story began when the Württembergische Sparcasse was founded in 1818. Last year, we looked back on this long history and what we have achieved. And above all, we have accomplished a great deal – with our customers and for our customers, at home and abroad.
We have successfully bolstered our customer business, stepping up both lending and deposits. We achieved good growth, in particular in business with corporate customers and commercial real estate financing. And moreover, we continued to improve our performance and processes – from a multitude of new and refined digital offers and solutions to the expansion of sustainable investment opportunities and financing right up to an once again stronger commitment to project and infrastructure financing. In 2018, not only did we launch the digital financing market place »Debtvision« from LBBW and the Stuttgart Stock Exchange, which has already been used to market a wide range of Schuldscheine, we also introduced our first fully-digital current account »Giro Worldwide«. Furthermore, we joined the blockchain-based trade finance network »Marco Polo« as a founding member, which will allow us to provide even better trade financing support to our corporate customers in the future, and opened another international location in Toronto, Canada. In the Capital Markets Business, we maintained our position as a market leader in the issuing and certificates business and further underscored our role as a pioneer in the area of green finance by issuing our second own green bond and a sustainability certificate.
It is a great success for our work that what we do is well received by our customers. It shows us that we are on the right path as a company and above all as a strong and reliable service provider and partner for our customers.
All in all, we closed the 2018 financial year with consolidated profit before tax of EUR 558 million. This is once again a good result under the current conditions and is up moderately on the previous year’s figure.
This year, the anniversary is followed by another milestone birthday. LBBW as we know it today was born 20 years ago, on 1 January 1999, when Südwestdeutsche Landesbank, Landesgirokasse and the commercial banking business of Landeskreditbank Baden-Württemberg merged.
In 2019 it is essential to maintain the positive momentum and refine the Bank’s strengths with the same amount of dedication and the same rigor. To do this in line with our strategic agenda and its four thrusts of business focus, digitalization, sustainability and agility. On the basis of LBBW’s stable foundations that it enjoys thanks to its balanced business model, long-standing customer relationships, solid capitalization and stable ownership. And with our ongoing willingness to repeatedly break new ground with our customers.
We would like to extend particular thanks to our employees who, every day, breathe life into the goal we have set for ourselves: to be one of the best medium-sized universal banks in Germany. We would also like to thank our customers and owners for their trust and for the valuable drive that we gain from collaborating with them.
Foreword by the Board of Managing Directors

Fo
rew
ord
by t
he
Boar
d o
f M
anag
ing
Dir
ecto
rs
6
Fore
wo
rd a
nd
re
po
rts
We expect the market environment to remain challenging in 2019. Nonetheless, we aim to continue to grow our customer business and once again to achieve a mid-nine-figure consolidated profit before tax.
Sincerely,
The Board of Managing Directors
RAINER NESKE Chairman
MICHAEL HORN Deputy Chairman
KARL MANFRED LOCHNER
DR. CHRISTIAN RICKEN
THORSTEN SCHÖNENBERGER
VOLKER WIRTH


R
eport
of
the
Super
vis
ory
Boar
d
8
Fore
wo
rd a
nd
re
po
rts
Ladies and gentlemen,
During the past financial year, we advised the Board of Managing Directors on the management of the company and regularly monitored the management of LBBW. The Board of Managing Directors provided us with regular, timely, and comprehensive information concerning key developments at the Bank and the Group in 2018. The economic situation of the individual business units and the business situation of the LBBW Group were the subject of intense discussion. The Board of Managing Directors regulator informed us on the risk, liquidity and capital management of the Bank, as well as of transactions and events of considerable importance for the Bank, and took advice from us on these matters. The Supervisory Board was involved in decisions of major importance for LBBW and, when required, granted its approval after extensive consultation and examination. We also exchanged ideas with the Board of Managing Directors on significant developments in domestic and European banking supervisory legislation, while critically scrutinizing and monitoring LBBW's management and corporate planning. Between the meetings, I, in my capacity as Chairman of the Supervisory Board, maintained close contact with the Chairman of the Board of Managing Directors.
The economic environment for banks was characterized last year by ongoing low interest rates, strong competition and mounting volatility on the financial markets. In light of this, LBBW, with its balanced business model, has developed successfully and expanded its customer business. At the same time, the strategic agenda, with its four cornerstones of business focus, digitalization, sustainability and agility, made good progress.
Supervisory Board meetings In the year under review, the Supervisory Board held a total of four meetings, each of which was attended by representatives of the competent statutory and regulatory authorities.
In all the ordinary Supervisory Board meetings, the Board of Managing Directors reported on the ongoing situation and particularly on the development of income, expenditure, risks and capital ratios. Questions from the Supervisory Board were answered promptly and to our satisfaction. Furthermore, when necessary, we examined matters relating to the Board of Managing Directors and legal issues. In addition, we again discussed a large number of statutory, regulatory and supervisory law changes in 2018: we looked at the amended Remuneration Ordinance for Institutions (Institutsvergütungsverordnung, InstitutsVergV), the ESMA/EBA guidelines on the suitability assessment of management body members, the trend of capital requirements and the ongoing Supervisory Review and Evaluation Process (SREP). Reviews by the regulatory authorities of particular relevance were also on the agenda. Last but not least, we prepared the rotation of the statutory auditor for the 2020 financial year onwards and implemented a selection process.
In our first ordinary meeting of the year on 19 February 2018, the preliminary results for the 2017 financial year were discussed. The Board of Managing Directors also briefed us on the HSH Nordbank selling process and the implications for the Sparkassen-Finanzgruppe guarantee system. At this meeting, we also took note of the new remuneration model in place at LBBW from the 2018 financial year onwards and the result of the 2018 risk taker selection.
Report of the Supervisory Board

R
eport
of
the
Super
vis
ory
Boar
d
9
Fore
wo
rd a
nd
re
po
rts
The focus of our 13 April 2018 meeting was the 2017 annual financial statements. The Board of Managing Directors and the statutory auditor reported extensively on the previous financial year. Based on the recommendation of the Audit Committee we adopted the 2017 annual financial statements and approved the consolidated financial statements. Additionally, we accepted the proposal made by the Audit Committee and recommended to the annual general meeting that KPMG again be appointed as statutory auditor in accordance with Section 89 of the German Securities Trading Act (Wertpapierhandelsgesetz, WpHG) for the 2018 financial year. We also dealt with the status regarding the ECB audits on risk management. During this meeting we also decided on the new Board of Managing Directors remuneration model to be applied at LBBW from the 2018 financial year onwards which takes account of regulatory developments and set the variable remuneration for the Board of Managing Directors for the 2017 financial year. In addition, we were informed of some of the Bank’s specific digitalization projects, in particular schuldschein transactions using blockchain technology and the establishment of a digital marketplace for schuldschein transactions. We also examined the effects of introducing International Financial Reporting Standards 9 from 2018 onwards. We also received an update on the implementation of the strategic agenda with the four cornerstones of business focus, digitalization, sustainability and agility.
At the meeting on 26 September 2018 we took note of the detailed report prepared by the Board of Managing Directors on the current business situation. Moreover, the Board of Managing Directors updated us on developments in the HSH Nordbank selling process and the bidding process initiated by NordLB. The Board of Managing Directors reported on LBBW’s presence in Asia. One focus of the meeting was the selection of a statutory auditor for LBBW for the 2020 financial year onwards, prepared by the Audit Committee, and the submission of a corresponding proposal to the annual general meeting. The assessment of the annual evaluation of the Board of Managing Directors and the Supervisory Board were also on the agenda at this meeting. We also discussed the ESMA/EBA guidelines on the suitability assessment of management body members and decided on their implementation.
On 26 November 2018, the Board of Managing Directors provided us with updates on the program of action and the update of the restructuring plan required by the regulatory authorities. Alongside the budget for the variable remuneration of the Board of Managing Directors and staff members, we approved the business plan for the 2019 financial year and took note of the medium-term planning. We also adopted new versions of the rules of procedure governing the Board of Managing Directors and Supervisory Board.
Supervisory Board committees The Supervisory Board established a total of four committees from among its members: the Risk Committee, Audit Committee, Remuneration Control Committee and Executive Committee, with the latter assuming the statutory duties of the Nomination Committee. The current membership of the committees is printed on page 12 of this Annual Report.
The Executive Committee met five times in the period under review. Its deliberations centered on preparing the meetings of the full Supervisory Board, especially personnel matters and legal issues. The Executive Committee also discussed the evaluation of the Board of Managing Directors and the Supervisory Board in 2018 in accordance with KWG and the implementation of the ESMA/EBA guidelines on the suitability assessment of management body members. Furthermore, the Executive Committee approved the mandates of the Board of Managing Directors, discussed long-term succession planning and reviewed the Board of Managing Directors’ principles for the appointment of senior management. The Executive Committee also addressed the current status with regard to promoting the presence of women on the Supervisory Board and a strategy to achieve this target.
The Remuneration Control Committee fulfilled its statutory responsibilities in a total of five meetings. In particular, it reviewed LBBW's remuneration systems according to the requirements of the Remuneration Ordinance for Institutions, heard regular reports on the implementation of the InstitutsVergV reforms and

R
eport
of
the
Super
vis
ory
Boar
d
10
Fo
rew
ord
an
d r
ep
ort
s
took note of new LBBW remuneration systems valid from the 2018 financial year onwards. The Head of Human Resources provided extensive information on the Bank's remuneration structure. The Remuneration Officer participated regularly in the committee meetings and produced a comprehensive annual report on activities undertaken. Moreover, in fulfilling its primary responsibility the Remuneration Control Committee deliberated on questions relating to the remuneration of the Board of Managing Directors and prepared decisions to be taken by the Supervisory Board.
The Audit Committee held a total of four meetings in 2018. It discussed the annual financial statements and the consolidated financial statements of LBBW as well as the audit reports of the statutory auditor. It requested the auditor's declaration of independence and prepared the Supervisory Board's recommendation to the annual general meeting concerning the reappointment of KPMG. The Audit Committee also agreed on the main points of the audit and the statutory auditor's fee. The Audit Committee received regular reports on the current status and results of the audit of annual financial statements and monitored the implementation of the audit. It also discussed mandates for the statutory auditor within the scope of non-audit services. Furthermore, the Audit Committee discussed the half-yearly financial report with the Board of Managing Directors and the statutory auditor. As well as this, it satisfied itself of the efficacy of internal control, risk management, auditing and compliance systems, and monitored the accounting process. The Audit Committee also took note of the annual report by the Anti Money Laundering Officer and the annual report on the organization of the internal control system. In every meeting the management of the Group Auditing departments reported on its work. Furthermore, representatives of the Bank's Compliance and Risk Controlling departments reported to the Committee on matters of current relevance. The Audit Committee also discussed the non-financial statement. In the 2018 financial year, the Audit Committee also prepared the rotation of the statutory auditor for the 2020 financial year onwards and carried out a selection process, on the basis of which the Supervisory Board submitted a proposal to the annual general meeting.
In a total of nine meetings, the Risk Committee held in-depth discussions on the Bank's risk situation and risk management as well as its exposure for which reporting duties apply in accordance with the law, the articles of association and the bylaws, granting its approval where this was required in individual cases. Within the framework of regular risk reporting of the Board of Managing Directors, the Risk Committee deliberated in depth the Bank's risk-bearing capacity and the Bank's main types of risk. The Risk Committee also discussed the Group risk strategy as derived from the business strategy, as well as the Bank's credit, market-price, liquidity, real estate, development and investment risk and operational risk strategies with the Board of Managing Directors. The Risk Committee also examined whether the Bank's remuneration system took adequate account of the Bank's risk, capital and liquidity structure. Furthermore, the Risk Committee took note of the status of a recent audit by the regulatory authorities. The Risk Committee also regularly discussed current business areas, in particular money market transactions at German insurance companies and building societies, the performance of LBBW’s Immobilien Group, covered bonds and pfandbriefen, the development of business in Turkey since 2016 and the financing of offshore wind farms. In addition, the Risk Committee took note of reports on country limits and utilization, sector portfolio strategies and the impact of tariffs on the portfolio.
The committee chairpersons regularly reported on the work of the committees to the full Supervisory Board.
All members of the Supervisory Board attended the meetings of the Supervisory Board and the committees in 2018, with only a few exceptions (average attendance 92%).
Training and development measures The members of the Supervisory Board assumed responsibility for taking part in the training and development measures which they required to perform their duties. They were given appropriate support for this by LBBW. In addition to individual training measures, the Supervisory Board received training on regulatory changes on 19 February 2018 and on digitalization topics on 26 September 2018.

R
eport
of
the
Super
vis
ory
Boar
d
11
Fo
rew
ord
an
d r
ep
ort
s
Annual and consolidated financial statements The statutory auditor KPMG audited the annual financial statements and the consolidated financial statements of LBBW for 2018 including the management report, issuing an unqualified auditor's certificate. The annual financial statements were prepared in accordance with the provisions of the German Commercial Code (Handelsgesetzbuch, HGB) and the consolidated financial statements in accordance with the International Financial Reporting Standards (IFRS). The documentation relating to the financial statements and the principal auditor's reports were forwarded to all members of the Supervisory Board in good time. Furthermore, the members of the Audit Committee received all the relevant audit reports. The statutory auditor attended the committee meetings pertaining to the annual financial statements, elaborated on the main results of the audit and was available to answer any questions. At its balance sheet meeting on 22 March 2019, the Audit Committee discussed the documentation relating to the financial statements in detail with the Board of Managing Directors and the statutory auditor.
At its meeting on 1 April 2019, following an assessment of the reports and an in-depth discussion, the Supervisory Board accepted the recommendation of the Audit Committee that there were no objections to be made to the annual and consolidated financial statements. The Supervisory Board adopted the annual financial statements drawn up as at 31 December 2018 and approved the consolidated financial statements for 2018.
Conflicts of interest The Risk Committee dealt with the credit approvals stipulated by Section 15 of the German Banking Act (Kreditwesengesetz, KWG) and in accordance with its bylaws. Those members of the Supervisory Board who at the time at which the resolutions were passed were members of the decision-making bodies of the borrowers concerned or were exposed to a possible conflict of interests for any other reasons did not participate in the deliberations and voting. To that extent the provisions governing the handling of conflicts of interest set out in the Municipal Code for Baden-Württemberg apply accordingly to the Supervisory Board.
Legal matters The Supervisory Board and the individual committees continuously obtained detailed information on any significant legal matters. Where necessary, we consulted with external specialists.
Personnel changes in the Board of Managing Directors and the Supervisory Board The Supervisory Board elected the Supervisory Board members Mr. Martin Peters and Ms. B. Jutta Schneider to the Compensation Control Committee by way of circulation effective 30 June 2018. The Compensation Control Committee has had seven members since this time. We also decided to extend Mr. Michael Horn’s mandate as a member of the Board of Managing Directors and Deputy Chairman.
On behalf of the members of the Supervisory Board I would like to thank the Board of Managing Directors as well as the staff for their great personal dedication and performance in the 2018 financial year.
For the Supervisory Board
CHRISTIAN BRAND
Chairman

R
eport
of
the
Super
vis
ory
Boar
d
12
Fo
rew
ord
an
d r
ep
ort
s
Supervisory Board of LBBW
Chairman
CHRISTIAN BRAND
Former chairman of the Board of Management of L-Bank
Deputy Chairperson
EDITH SITZMANN MDL
Minister of Finance and Economics of the State of Baden-Wurttemberg
Members
WOLFGANG DIETZ
Lord Mayor of the town of Weil am Rhein
UTA-MICAELA DÜRIG
Managing Director of Robert Bosch Stiftung GmbH
WALTER FRÖSCHLE
Employee Representative of Landesbank Baden-Württemberg
HELMUT HIMMELSBACH
Lord Mayor (retired)
CHRISTIAN HIRSCH
Employee Representative of Landesbank Baden-Württemberg
MARC OLIVER KIEFER
(from 1 February 2019) Employee Representative of Landesbank Baden-Württemberg
BETTINA KIES-HARTMANN
Employee Representative of Landesbank Baden-Württemberg
FRITZ KUHN
Lord Mayor of the State Capital Stuttgart
SABINE LEHMANN
Employee Representative of Landesbank Baden-Württemberg
KLAUS-PETER MURAWSKI
State Secretary (retired)
DR. FRITZ OESTERLE
Attorney at law
MARTIN PETERS
Managing Partner of the Eberspächer group of companies
CHRISTIAN ROGG
Employee Representative of Landesbank Baden-Württemberg
CLAUS SCHMIEDEL
CEO of Critalog GmbH
B. JUTTA SCHNEIDER
Executive Vice President Global Services Delivery, SAP SE & Co. KG
PETER SCHNEIDER
President of the Sparkassen-verband Baden-Württemberg (Savings Bank Association of Baden-Württemberg)
DR. JUTTA STUIBLE-TREDER
Managing Partner of EversheimStuible Treuberater GmbH
DR. BRIGITTE THAMM
(until 31 January 2019) Employee Representative of Landesbank Baden-Württemberg
BURKHARD WITTMACHER
Chairman of the Board of Managing Directors of Kreissparkasse Esslingen-Nürtingen
NORBERT ZIPF
Employee Representative of Landesbank Baden-Württemberg
Executive Committee of LBBW
Chairman
CHRISTIAN BRAND
Former chairman of the Board of Management of L-Bank
Deputy Chairperson
EDITH SITZMANN MDL
Minister of Finance and Economics of the State of Baden-Wurttemberg
FRITZ KUHN
Lord Mayor of the State Capital Stuttgart
PETER SCHNEIDER
President of the Sparkassen-verband Baden-Württemberg (Savings Bank Association of Baden-Württemberg)
NORBERT ZIPF
Employee Representative of Landesbank Baden-Württemberg

R
eport
of
the
Super
vis
ory
Boar
d
13
Fo
rew
ord
an
d r
ep
ort
s
LBBW Remuneration Control Committee
Chairman
CHRISTIAN BRAND
Former chairman of the Board of Management of L-Bank
Deputy Chairperson
EDITH SITZMANN MDL
Minister of Finance and Economics of the State of Baden-Wurttemberg
Members
FRITZ KUHN
Lord Mayor of the State Capital Stuttgart
MARTIN PETERS
(from 30 June 2018) Managing Partner of the Eberspächer group of companies
B. JUTTA SCHNEIDER
(from 30 June 2018) Executive Vice President Global Services Delivery, SAP SE & Co. KG
PETER SCHNEIDER
President of the Sparkassen-verband Baden-Württemberg (Savings Bank Association of Baden-Württemberg)
NORBERT ZIPF
Employee Representative of Landesbank Baden-Württemberg
Audit Committee of LBBW
Chairman
BURKHARD WITTMACHER
Chairman of the Board of Managing Directors of Kreissparkasse Esslingen-Nürtingen
Deputy Chairman
KLAUS-PETER MURAWSKI
State Secretary (retired)
Members
UTA-MICAELA DÜRIG
Managing Director of Robert Bosch Stiftung GmbH
HELMUT HIMMELSBACH
Lord Mayor (retired)
SABINE LEHMANN
Employee Representative of Landesbank Baden-Württemberg
B. JUTTA SCHNEIDER
Executive Vice President Global Services Delivery, SAP SE & Co. KG
PETER SCHNEIDER
President of the Sparkassen-verband Baden-Württemberg (Savings Bank Association of Baden-Württemberg)
DR. JUTTA STUIBLE-TREDER
Managing Partner of Evers-heimStuible Treuberater GmbH
Guest
CHRISTIAN BRAND
Former chairman of the Board of Management of L-Bank
Risk Committee of LBBW
Chairman
PETER SCHNEIDER
President of the Sparkassen-verband Baden-Württemberg (Savings Bank Association of Baden-Württemberg)
Deputy Chairman
CHRISTIAN BRAND
Former chairman of the Board of Management of L-Bank
Members
WOLFGANG DIETZ
Lord Mayor of the town of Weil am Rhein
WALTER FRÖSCHLE
Employee Representative of Landesbank Baden-Württemberg
DR. FRITZ OESTERLE
Attorney at law
CLAUS SCHMIEDEL
CEO of Critalog GmbH
B. JUTTA SCHNEIDER
Executive Vice President Global Services Delivery, SAP SE & Co. KG
BURKHARD WITTMACHER
Chairman of the Board of Managing Directors of Kreissparkasse Esslingen-Nürtingen
Corp
ora
te G
over
nan
ce
14
Fo
rew
ord
an
d r
ep
ort
s
LBBW takes account of the fundamental aspects of the German Corporate Governance Code. This is a set of essential legal regulations governing the management and monitoring of German listed companies and contains nationally and internationally recognized standards for good and responsible corporate governance – including in the form of recommendations. As the Code is geared towards listed joint-stock companies, not all points of it are applicable to Landesbank Baden-Württemberg, since LBBW is a non-listed credit institution incorporated under public law (Anstalt des öffentlichen Rechts). For this reason, several provisions of the German Corporate Governance Code can only be transferred analogously to Landesbank Baden-Württemberg. In terms of content, LBBW's corporate governance is oriented very closely to the spirit of the German Corporate Governance Code. For a large number of recommendations of the German Corporate Governance Code there are therefore special regulations in the legislation governing LBBW, in the articles of association and bylaws of the executive bodies and further committees. Furthermore, there are special provisions for corporate governance in the banking supervisory legislation that are not included in the Code, but do apply to LBBW.
At LBBW, management and supervisory rules applicable to corporations are practiced. For instance, the tasks of LBBW's annual general meeting and Supervisory Board are regulated as for a joint-stock company although this is not the legal form of LBBW. The members of the LBBW Board of Managing Directors make their decisions independently of any external instructions. At the same time, it is ensured that independent expertise is drawn on through the supervisory bodies. The Supervisory Board of LBBW has eight independent members, including the Chairman of the Supervisory Board.
Corporate governance, as practiced at LBBW, is presented below. The structure of the report is based on the standards of the German Corporate Governance Code, which is voluntary and not mandatory for LBBW on account of its legal form, as amended on 7 February 2017.
Shareholders and annual general meeting
Shareholders
As an institution incorporated under public law, LBBW has not securitized any equities. The shareholders are therefore described as owners (Träger) and not as shareholders.
Landesbank Baden-Württemberg’s owners are:
∙ Sparkassenverband Baden-Württemberg (Savings Bank Association of Baden-Württemberg) ∙ with a 40.534118% stake in the share capital, ∙ State of Baden-Württemberg (state) ∙ with a 24.988379% stake in the share capital, ∙ State Capital of Stuttgart (city) ∙ with a 18.931764% stake in the share capital, ∙ Landesbeteiligungen Baden-Württemberg GmbH (Landesbeteiligungen BW) ∙ with a 15.545739% stake in the share capital,
The owners of LBBW assume their rights before or during the annual general meeting within the scope of the opportunities offered by the articles of association and thereby exercise their voting rights. The voting rights of the owners are based on the size of their stake in the share capital, with each euro granting one vote.
Corporate governance at LBBW
Corp
ora
te G
over
nan
ce
15
Fo
rew
ord
an
d r
ep
ort
s
Annual General Meeting
At the annual general meeting, the owners exercise their rights over the affairs of LBBW in the absence of any stipulations to the contrary in the legislation governing Landesbank Baden-Württemberg or the articles of association of LBBW. The owners are represented at the annual general meeting by one or several people.
The powers of the annual general meeting encompass the typical tasks of an annual general meeting based on joint-stock companies legislation, for example, voting on the appropriation of net profit, or granting discharge to the members of the Supervisory Board and the Board of Managing Directors. The annual general meeting also makes decisions about the content of the articles of association and any changes thereto, and about key structural measures, such as corporate agreements, setting and changes to the share capital, the issue of profit participation rights and granting of silent partners' contributions. The Supervisory Board decides whether to change the principles of business policy.
The functions of supervising and monitoring the Board of Managing Directors, including the appointment and dismissal of members of this board, lie with the Supervisory Board. The Board of Managing Directors submits the audited annual financial statements to the Supervisory Board for approval in line with LBBW's articles of association.
LBBW's share capital can be increased or decreased by a resolution passed at the annual general meeting. LBBW can accept capital generated from profit-participation rights, silent partners' contributions as well as subordinated guarantee capital, and other forms of capital as provided for in the German Banking Act (Kreditwesengesetz, KWG) from its owners and third parties.
Each owner with a share in the share capital is entitled to a share in the new share capital based on their shareholding in the event of increases. If one owner fails to exercise their subscription right, this right will accrue to the other owners for a corresponding consideration in a proportion to their share in the share capital, unless they have reached an agreement to the contrary among themselves.
The ordinary general meeting takes place within the first eight months of the year. Further general meetings are called if the good of LBBW so requires and also when the Supervisory Board or an owner makes an application detailing the agenda items. The internal regulations of the annual general meeting provide more details in this respect, particularly as regards the form and deadline for requests that a meeting be held and for the calling of a meeting.
In contrast to a joint-stock company, LBBW provides its owners with the documents required for the annual general meeting, such as the convocation documents for the annual general meeting, directly by e-mail or by mail rather than via its website, in view of the small number of owners.
Interoperation between the Board of Managing Directors and the Supervisory Board
The Board of Managing Directors and the Supervisory Board work closely together for the good of the Company. The Board of Managing Directors agrees the strategic direction of the Company with the Supervisory Board and they discuss the status of strategy implementation at regular intervals. For business of fundamental importance, the articles of association or the Supervisory Board, the latter also in individual cases, stipulate that the consent of the Supervisory Board is required. Examples include decisions or measures that fundamentally change the Company's net assets, financial position or results of operations.

Corp
ora
te G
over
nan
ce
16
Fo
rew
ord
an
d r
ep
ort
s
It is the duty of the Board of Managing Directors to supply the Supervisory Board with information although the Supervisory Board for its part needs to make sure that it is adequately informed. For this purpose, the Supervisory Board sets out the Board of Managing Director's duties of information and reporting in detail. The Board of Managing Directors provides the Supervisory Board with regular, prompt and comprehensive information about all relevant questions relating to planning, business performance, the risk situation, effectiveness of the internal control system, the internal auditing system and compliance. It examines deviations in the business development from the plans and targets drawn up and gives reasons for such deviations.
Reporting by the Board of Managing Directors to the Supervisory Board is generally carried out in written form. Documents required for a decision are generally forwarded to members of the Supervisory Board in good time before the meeting.
The Chairman of the Board of Managing Directors informs the Chairman of the Supervisory Board his Deputy about important events, including between the individual meeting dates.
Based on LBBW's and its owners' understanding, good corporate governance requires open discussion between the Board of Managing Directors and the Supervisory Board and internally within the Board of Managing Directors and the Supervisory Board. Full and comprehensive confidentiality is of decisive importance. The members of the Supervisory Board and the Board of Managing Directors are therefore bound to secrecy. This obligation remains even after the end of their activity within the executive bodies of the Landesbank. All members of the executive bodies ensure that employees asked by them to provide support observe the same obligation to secrecy.
The Board of Managing Directors and the Supervisory Board observe the rules of proper corporate governance. Should they culpably breach the due diligence expected of a prudent and conscientious director or Supervisory Board member, they are liable to pay damages to LBBW. There is no breach of obligations for business decisions if the member of the Board of Managing Directors or Supervisory Board may reasonably have assumed that they were acting for the good of the Company on the basis of fair information (business judgment rule).
With regard to the D&O insurance taken out for the Board of Managing Directors, a deductible has been agreed of 10% of the loss up to one and a half times the Board member's annual fixed compensation. A corresponding deductible was also agreed when the D&O insurance was taken out for the members of the Supervisory Board.
Decisions about granting loans to members of the Board of Managing Directors and the Supervisory Board and related parties are made by the Risk Committee in accordance with Section 15 German Banking Act (Kreditwesengesetz, KWG). The fact that the Risk Committee is a Supervisory Board committee ensures that the Supervisory Board is involved in the aforesaid lending decisions.
LBBW has been reporting on its corporate governance in a report on corporate governance forming part of the annual report since the 2010 financial year.

Corp
ora
te G
over
nan
ce
17
Fo
rew
ord
an
d r
ep
ort
s
Board of Managing Directors
Duties and responsibilities
The Board of Managing Directors manages the business of LBBW under its own responsibility pursuant to the law and in the Company's interest, i.e. by taking the needs of the owners, its employees and other groups (stakeholders) affiliated to the Company into account, with the aim of achieving sustainable added value. In accordance with the legal principles of LBBW, it is responsible for any LBBW matters that do not fall within the remit of another authority based on the legislation governing Landesbank Baden-Württemberg or the articles of association of LBBW. In managing the business, the members of the Board of Managing Directors exercise the due diligence of a prudent and conscientious business manager. In so doing, the Board of Managing Directors develops the strategic direction of the Company, agrees it with the Supervisory Board and ensures it is implemented. Furthermore, the Board of Managing Directors ensures compliance with the statutory regulations and the Company's internal rules and works toward ensuring that they are observed by LBBW Group companies. The Board of Managing Directors further ensures a reasonable risk management and risk controlling within the Group.
The Board of Managing Directors is the line superior for all employees of LBBW, including its subsidiaries, branches, stock market offices, representative offices and legally dependent institutions under public law. The Board of Managing Directors strives for diversity and therefore a reasonable inclusion of women, in particular, when filling management positions within the Bank.
Members of the Board of Managing Directors
The Board of Managing Directors consists of several members. The members of the Board of Managing Directors, the Chairman and his deputy or deputies are determined and appointed by the Supervisory Board. In filling positions on the Board of Managing Directors, the Supervisory Board strives for diversity.
To ensure maximum flexibility, LBBW has refrained from fixing an allocation of competences for the members of the Board of Managing Directors in the bylaws. A schedule of responsibilities governs the departmental responsibilities of individual board members. The Supervisory Board makes decisions about the bylaws of the Board of Managing Directors and about the approval of the proposed allocation of responsibilities.
Remuneration
Details on the remuneration of the Board of Managing Directors can be found in the remuneration report.
Conflicts of interest
Members of the Board of Managing Directors are obliged to act in the interests of the Bank. Members of the Board must not pursue personal interests when making their decisions.They are bound by a comprehensive non-compete clause while working for LBBW and must not exploit business opportunities open to the Bank for their own ends. Members of the Board of Managing Directors must not seek or accept undue advantages from third parties in connection with their activities, neither for themselves nor for other persons, or grant undue advantages to third parties.
Every member of the board should disclose any possible conflicts of interest to the Supervisory Board immediately and inform the other board members. All business between LBBW, on the one hand, and the members of the Board of Managing Directors or persons or enterprises closely associated with them, on the other, must satisfy industry standards. Important business requires the consent of the Supervisory Board.

Corp
ora
te G
over
nan
ce
18
Fo
rew
ord
an
d r
ep
ort
s
Members of the Board of Managing Directors may only accept secondary activities, in particular appointments to supervisory boards outside the LBBW Group, with the consent of the Executive Committee. The Executive Committee consists of the Chairman of the Supervisory Board, the Deputy Chairman and three members of the Supervisory Board. This ensures that the Supervisory Board is involved in the decision about secondary activities of the Board of Managing Directors.
In the event of a conflict of interests, the member concerned will not take part in the deliberations and voting on the item in question by the Board of Managing Directors. Section 18 paragraphs 1 – 3 and 5 of the Municipal Code for Baden-Württemberg applies accordingly to the members of the Board of Managing Directors in this regard.
Supervisory Board
Duties and responsibilities
It is the duty of the Supervisory Board to offer regular advice and oversee the Board of Managing Directors' management of LBBW. It is involved in decisions of key importance to the Company. It is responsible for the appointment and dismissal of the members of the Board of Managing Directors and of the Chairman and Deputy Chairmen of the Board and for setting the remuneration of the Board of Managing Directors. The Supervisory Board is able to appoint deputy members of the Board of Managing Directors, who have the same rights and obligations as the members of the Board of Managing Directors. The Supervisory Board has set itself its own bylaws. The Supervisory Board has a Chairman and a Deputy Chairman. The Chairman and Deputy Chairman of the Supervisory Board are elected from the Supervisory Board's own number on the basis of a proposal made by the shareholders' meeting in the absence of any requirements to the contrary in the Landesbank Baden-Württemberg Act.
Tasks and powers of the Supervisory Board Chairman
The Chairman of the Supervisory Board calls a meeting of the Supervisory Board as required, but no less than four times a year, and chairs its meetings. The bylaws for the Supervisory Board set out further details, in particular, the format and deadlines for the calling of meetings. The Chairman coordinates the work in the Supervisory Board, chairs its meetings and attends to the affairs of the Supervisory Board in dealings with outside parties.
The Chairman of the Supervisory Board takes part in the meetings of the Audit Committee as a permanent guest.
The Chairman of the Supervisory Board is in regular contact with the Board of Managing Directors, in particular with its Chairman, and discusses with the latter strategy, business development and risk management at LBBW. The Chairman of the Supervisory Board is informed immediately by the Chairman of the Board of Managing Directors about important events that are of key importance in the assessment of the position and development of the Company and its management. The Chairman of the Supervisory Board then notifies the Supervisory Board and calls an extraordinary meeting of the Supervisory Board if required.
Formation of committees
Due to the specific circumstances of LBBW and the number of its members, the Supervisory Board has formed four well-qualified committees in the shape of the Executive Committee, the Remuneration Control Committee, the Audit Committee and the Risk Committee. The respective committee chairpersons regularly report on the work of the committees to the Supervisory Board.

Corp
ora
te G
over
nan
ce
19
Fo
rew
ord
an
d r
ep
ort
s
The Executive Committee performs the statutory duties of the Nomination Committee; in the absence of anything to the contrary in the Landesbank Baden-Württemberg Act, the proposals for the election of members of the Supervisory Board that are submitted to the annual general meeting are prepared solely by the representatives of the owners.
The Audit Committee deals, in particular, with the effectiveness of the internal control system and internal auditing, as well as issues relating to accounting, risk management and compliance. It also monitors the audit of the annual and consolidated financial statements. The Audit Committee submits a substantiated proposal for a statutory auditor to the Supervisory Board.If a different auditor is recommended than the previous one, a selection of at least two candidates is to be proposed. The Audit Committee monitors the independence of the statutory auditor and handles additional services provided by the auditor, issues the audit assignment to the auditor and determines focal areas of the audit and the auditor's fee. The Chairman of the Audit Committee has specific knowledge and experience of the application of accounting standards and internal control procedures. The Chairman of the Audit Committee is not a former member of LBBW's Board of Managing Directors.
Members of the Supervisory Board
The members of the Supervisory Board are elected by the shareholders' meeting unless they are required to be elected by the employees and in the absence of any requirements to the contrary in the Landesbank Baden-Württemberg Act. Eight of the members of the Supervisory Board elected by the annual general meeting, including the chairman, are independent. Each owner has the right to submit proposals for election.
The composition of the Supervisory Board is such that its members collectively possess the requisite knowledge, skills and technical experience to assume their tasks in due form.
The members of the Supervisory Board assume responsibility for taking part in the training and development measures which they require to perform their duties. They receive reasonable support for this from LBBW, e.g. through the designation of specific seminars and the availability of corresponding lectures. In 2018, two specialist seminars were organized especially for the Supervisory Board.
To enable the Supervisory Board to provide independent advice and oversee the Board of Managing Directors independently, the Supervisory Board includes independent members, the number of which is set out in LBBW's rules and regulations. Supervisory Board members are seen as independent if they have no business or personal relationship with the Company, its Board of Managing Directors or the owners that could constitute the basis for a conflict of interests. There are no former members of the Board of Managing Directors on the Supervisory Board. Each Supervisory Board member takes care that they have sufficient time to fulfill their role.
If a member of the Supervisory Board has attended half or fewer than half of the meetings of the Supervisory Board or the committees of which he or she is a member in the course of a financial year, a note to that effect is included in the Supervisory Board's report. Attendance is also deemed to include participation via a conference call or video link although this should not be the rule.
Remuneration
Details on the remuneration of the Supervisory Board can be found in the remuneration report.
Conflicts of interest
Every member of the Supervisory Board is obliged to act in the interests of the Bank. They may not pursue any personal interests in their decisions, nor use any business opportunities open to the Company for their own advantage. Any conflicts of interest, in particular those that may arise because of an

Corp
ora
te G
over
nan
ce
20
Fo
rew
ord
an
d r
ep
ort
s
advisory or executive function exercised for customers, suppliers, lenders or other business partners must be disclosed to the Supervisory Board. In the event of a conflict of interests, the member concerned does not participate in the deliberations and voting of the Supervisory Board on the issue in question. Section 18 paragraphs 1 to 3 and 5 of the Municipal Code for Baden-Württemberg applies to the members of the Supervisory Board accordingly in this regard.
Any material conflicts of interest of a non-temporary nature existing in the person of a Supervisory Board member will lead to a member's appointment being terminated. Furthermore, any consulting, other service or employment contracts of a Supervisory Board member with the Company require the Supervisory Board's approval.
The Supervisory Board regularly checks the efficiency of its activities and at least once a year evaluates its structure, size, composition and performance as well as the knowledge, skills and experience both of individual members and of the executive body as a whole.
Transparency
LBBW deals with its owners equally and without distinction in matters of information.
LBBW supports good contact with its owners. It is the view of LBBW that publication of a financial calendar would not offer any added value.Such a calendar is therefore not provided.
Accounting and audit of the annual accounts
Accounting
The owners and third parties are provided with information primarily via the consolidated financial statements. They also receive information during the financial year through the half-yearly financial report. The consolidated financial statements and the abbreviated consolidated financial statements of the half-yearly financial report are compiled in accordance with the relevant international accounting standards.
The consolidated financial statements are compiled by the Board of Managing Directors and audited by the auditor and the Supervisory Board. The Audit Committee, as a Supervisory Board committee, discusses the half-yearly financial reports with the Board of Managing Directors. In addition, the German Financial Reporting Enforcement Panel (Deutsche Prüfstelle für Rechnungslegung) is authorized to check that the consolidated financial statements comply with the applicable accounting standards (enforcement). As a company not listed on the stock market, LBBW publishes its consolidated financial statements and its half-yearly financial reports within the timescale required by the German Securities Trading Act (Wertpapierhandelsgesetz – WpHG). The annual report is published at the latest four months after the end of each financial year (Section 114 WpHG) and the half-yearly financial report three months following the end of the reporting period at the latest (Section 115 WpHG).
In its consolidated financial statements LBBW explains the relationships with representatives of the owners who are considered as related parties within the meaning of the applicable accounting standards.
Audit of the annual accounts
Prior to submitting the proposal to the annual general meeting for the appointment of the auditor, the Supervisory Board or the Audit Committee obtains a declaration from the proposed auditor stating whether any and, if applicable, which, business, financial and personal or other relationships exist between the auditor and its executive bodies and audit managers, on the one hand, and LBBW and the

Corp
ora
te G
over
nan
ce
21
Fo
rew
ord
an
d r
ep
ort
s
members of its executive bodies, on the other, which may give reason to doubt the auditor's independence. The declaration also states the extent to which other services were provided for LBBW over the past financial year, in particular in terms of consultancy, and have been contractually agreed for the following financial year.
The Supervisory Board or its Audit Committee commissions the auditor and reaches an agreement with the latter about the fee.
The auditor notifies the Chairman of the Supervisory Board and/or the Chairman of the Audit Committee immediately of any grounds for disqualification or partiality that may emerge during the course of an audit, unless they are rectified immediately.
The Supervisory Board has also stipulated that the auditor will immediately report on all events and findings of importance to the Supervisory Board's duties that may arise while carrying out the audit. The auditor takes part in the deliberations of the Supervisory Board and the Audit Committee relating to the annual financial statements and the consolidated financial statements and reports on the key results of its audit.

R
emuner
atio
n r
eport
2
2
Fore
wo
rd a
nd
re
po
rts
Remuneration report Board of Managing Directors
Principles of the remuneration system
Responsibility The Supervisory Board makes decisions on the remuneration system for the members of the Board of Managing Directors, fixes the remuneration payable to them and regularly reviews its appropriateness. The Remuneration Control Committee assumes an important advisory role in this respect and prepares the resolutions of the Supervisory Board.
Principles of the remuneration system The remuneration parameters that determine variable remuneration are geared toward achieving the targets derived from the Bank's strategy on a sustained basis and support it in reaching its strategic company targets.1The variable performance-based remuneration for the members of the Board of Managing Directors in 2018 was guided by the Group’s sustained overall success over a period of three years, accounting for 50%, and on the individual Board members' contribution to profit in the year under review, accounting for 50%. The individual performance contribution is tied to target achievement agreements based on the business strategy and business plan. Final calculation of the variable performance-based remuneration is based on the overall target achievement as determined in a resolution passed by the Supervisory Board in the following year.
Alongside sustainability in the decision on performance, sustainability in the payout of the variable remuneration constitutes a key element for the remuneration for members of the Board of Managing Directors. Significant parts of the variable remuneration are based on sustained business success. For this reason, 60% of the variable remuneration granted for 2018, the year under review, will be deferred over a five-year period and paid out on a pro rata temporis basis (deferral); negative performance contributions can reduce the deferral, lead to its expiry (malus) or result in a clawback. 60% of the deferred proportion of the variable remuneration granted for 2018, the year under review, is subject to a blocking period of one year and guided by sustained performance (i.e. subject to an appreciation right). LBBW's sustained performance is measured by the change in the adjusted aggregate risk cover2, taking into account the risk situation (risk protection). To this end, the aggregate risk cover performance in each respective payout year is determined in a comparison with the base year (awarding of variable performance-based remuneration). The current risk situation is evaluated in line with the risk assessment in the overall risk report. Of the non-deferred portion (40%), 40% of the variable remuneration calculated is paid out immediately. The other 60% of the non-deferred potion of variable remuneration is frozen for one year and during this period is also aligned to any changes in the sustained performance.
Following the expiry of the deferral period, the malus / clawback is reviewed using the criteria set out in the Board remuneration model at Group level and at individual level prior to payment. In addition, a review is performed prior to payment to establish that the additional conditions (positive overall performance of the Group, no risk to appropriate capital backing, sufficient liquidity on the part of the Bank and compliance with the combined capital buffer requirements) have been satisfied.
1 Business focus, digitalization, sustainability and agility. 2 The basis is the aggregate risk cover anchored in the Bank’s risk management, adjusted by certain items.

R
emuner
atio
n r
eport
2
3
Fore
wo
rd a
nd
re
po
rts
The retirement benefits are essentially designed as defined-contribution benefits. Some members of the Board of Managing Directors have an arrangement taking the form of a final salary scheme, the amount of which is calculated according to the length of their service on the Board of Managing Directors.
Remuneration 2018 In 2018, remuneration of members of LBBW's Board of Managing Directors consisted of fixed, non-performance-based remuneration and a performance-based variable component. In addition to the contractually agreed fixed salary, the fixed remuneration includes payments into the company pension scheme and all other benefits (essentially the use of a company car).
During the 2018 financial year, the members of the Board of Managing Directors received fixed contractually agreed remuneration totaling EUR 5.1 million for the performance of their duties on the Board. The other benefits amounted to EUR 0.1 million. In addition, variable performance-based remuneration totaling EUR 1.2 million was paid out (inflow). This amount includes percentages of deferred variable remuneration from previous years.
In 2018, EUR 2.0 million was transferred to the pension obligations for serving members of the Board of Managing Directors as an element of the fixed remuneration according to IFRS and recognized in the income statement. As at 31 December 2018, pension obligations according to IFRS for serving members of LBBW's Board of Managing Directors as at the reporting date totaled EUR 18.1 million.
Supervisory Board
Principles of remuneration for Supervisory Board members
The annual general meeting on 22 July 2011 decided on the remuneration of Supervisory Board members as follows:
∙ The members of the Supervisory Board receive a fixed remuneration of EUR 25,000 for the respective financial year. The Chairman of the Supervisory Board receives twice and the Deputy Chairman one and a half times the fixed remuneration of a Supervisory Board member.
∙ Supervisory Board members who hold a seat on a committee receive further fixed remuneration of EUR 10,000 per committee. The Chairman of a committee receives 2.0 times and the Deputy Chairman 1.5 times the further fixed remuneration.
∙ Each Supervisory Board member receives an attendance allowance of EUR 200 to attend a meeting of the Supervisory Board or one of its committees.
∙ The Supervisory Board members are further reimbursed for the expenditure that they incur in connection with performing their duties as members of the Supervisory Board (travel expenses, individual bank-specific further training etc.).
∙ The Supervisory Board members are reimbursed for the value-added tax incurred that they have to pay as a result of their activity as a member of the Supervisory Board or a committee.
The employee representatives on the Supervisory Board employed at LBBW also receive their salary as employees.
The remuneration of Supervisory Board members who are not part of the Supervisory Board for a complete financial year is paid pro rata for their term in office.

R
emuner
atio
n r
eport
2
4
Fore
wo
rd a
nd
re
po
rts
Remuneration 2018 For the 2018 financial year, a total of EUR 951,702.74 was paid in salaries and EUR 49,564.00 in attendance allowances to the members of the Supervisory Board.
Other information
There is also pecuniary loss liability insurance for members of the Board of Managing Directors and Supervisory Board (»D&O«). The deductible is 10% of the loss up to a maximum of 1.5 times the fixed annual remuneration.
Landesbank Baden-Württemberg
The Supervisory Board The Board of Managing Directors

R
eport
on g
ender
equal
ity a
nd e
qual
pay
2
5
Fore
wo
rd a
nd
re
po
rts
Landesbank Baden-Württemberg (LBBW) has a duty to draw up and publish a report on gender equality and equal pay, according to Sections 21 et seqq. of the Act to Promote Transparency in Pay Structures (EntgTranspG). The report relates solely to LBBW (Bank).
Promoting diversity and equality of opportunity is firmly established in LBBW’s sustainability targets and in the human resources policy guidelines, particularly in the »equal opportunity and diversity« principles. As early as 2008, by becoming a member of the »Diversity as Opportunity – German Corporate Diversity Charter« initiative (www.charta-der-vielfalt.de), LBBW committed itself to creating a workplace free of prejudice for all employees. A Diversity Officer is assigned to supervise and support diversity and equal opportunity efforts at LBBW. The topics »work-life balance« and »active promotion of women« take center stage, with the aim of ensuring equal opportunities for men and women at LBBW. Specifically, for example, we have increased the number of child-care spots and re-auditing by berufundfamilie GmbH in 2016 confirmed that LBBW has steadily improved its awareness of family issues.
A mentoring program is being offered in order to promote career opportunities for women. It is targeting women who see themselves taking on managerial responsibility at the second and third levels (head of division and head of department). The seminars »Life planning and career for women« and »Communication awareness«, addressed to employees with leadership ambitions, also seek to promote women.
Measures designed to bring about equal pay for men and women are anchored in LBBW's remuneration systems in the sense that they are guided by performance, results and the market. Fixed remuneration is essentially based on the function exercised and its significance in accordance with applicable collective agreements or, for positions not covered by such agreements, market conditions. The duties and requirements of the position, the qualifications and skills required of the employees and sustained individual performance are among the factors relevant for determining remuneration.
Generally speaking, a review of fixed salaries takes place once a year, when the performance-related variable remuneration (bonus) is also determined. The decision as to which employee receives an individual increase and/or a bonus is made by the responsible manager. The percentage of women and men with measures and their average size are made transparent to executives to help them in their decision-making.
Gender-specific remuneration is additionally disclosed in internal and external reports, for example in the sustainability report, which is published once a year.
The following table sets out the gender distribution of part-time and full-time positions.
Human resources indicators for LBBW (Bank) – average total for 2018 (pre-year figures in brackets).
Total of which women of which men
Employees 8,335 (8,706) 4,373 (4,564) 3,962 (4,142)
Full-time employees 5,872 (6,087) 2,129 (2,242) 3,743 (3,845)
Part-time employees 2,463 (2,619) 2,244 (2,322) 219 (297)
Report on gender equality and equal pay

Combined Management Report

G
roup o
ver
vie
w
27
C
om
bin
ed m
an
age
me
nt
rep
ort
This annual report published by Landesbank Baden-Württemberg comprises the combined management report and the consolidated financial statements (IFRS). The management report of LBBW (Bank) and the group management report are combined in accordance with German Accounting Standard (DRS) 20. The report thus comprises both the Group and LBBW (Bank) as a single entity, with notes based on the German Commercial Code. The LBBW (Bank) annual financial statements according to the German Commercial Code (HGB) and the combined management report are published simultaneously in the German Federal Gazette (Bundesanzeiger).
The combined management report also includes a combined non-financial statement. This is based on five aspects: the environment, social responsibility, the treatment of employees, respect for human rights, and anti-corruption as well as bribery. As a result, the separate chapters on employees and sustainability have been omitted in the combined management report. Information on the employee numbers can be found in the business report.
Structure and business model
The Landesbank Baden-Württemberg (LBBW) Group predominantly comprises the single entity Landesbank Baden-Württemberg, which is referred to below as LBBW (Bank). LBBW (Bank) is the parent company of the LBBW Group.
LBBW (Bank) is an institution incorporated under public law. It has four registered offices in Stuttgart, Karlsruhe, Mannheim and Mainz Its owners are the Savings Bank Association of Baden-Württemberg (Sparkassenverband Baden-Württemberg) with 40.53%, the state capital Stuttgart with 18.93% and the State of Baden-Württemberg with 40.53% of the share capital. The State of Baden-Württemberg holds its share directly and indirectly through Landesbeteiligungen Baden-Württemberg GmbH.
As a universal bank, the LBBW Group offers a comprehensive range of products and services. The Group's business model focuses on customer business as reflected by its segments of Corporate Customers, Real Estate/Project Finance, Capital Markets Business and Private Customers/Savings Banks. The LBBW Group operates locally in its regional core markets of Baden-Württemberg, Rhineland-Palatinate and Saxony and selectively takes advantage of growth opportunities in attractive economic areas such as North-Rhine Westphalia, Bavaria and the greater Hamburg area.
The LBBW Group’s private customer business and private asset management as well as SME corporate customers business in Baden-Württemberg have operated under the name BW Bank since 2018. Following the break-up of the LBBW Sachsen Bank as at 31 March 2018 and the LBBW Rheinland-Pfalz as at 31 March 2019 – subject to formal board approval – the Bank operates corporate customer business (outside Baden-Württemberg) only under the LBBW brand. Internally, this harmonization affords LBBW a leaner Group structure and, externally, a clear brand image.
Group companies for special products (leasing, factoring, asset management, real estate and equity investment finance) supplement the LBBW Group’s portfolio of services. A global network of international locations and German Centres is also available to support customers with country-specific expertise and financial solutions as well as with market entry solutions.
Group overview

G
roup o
ver
vie
w
28
C
om
bin
ed m
an
age
me
nt
rep
ort
As a mid-sized universal bank, LBBW has the highest standards when it comes to the quality of its services and customer focus. In light of the many and varied challenges posed in the areas of economic performance, customer requirements, market trends as well as society and the environment, the Bank sees itself to be well-positioned with its four strategic priorities:
∙ Business focus: A strong focus on customer business takes center stage. LBBW aims to grow by expanding its already strong customer base. In addition, its specialized product expertise will, in the future, be more heavily dovetailed with its customer segments. The requirements for success are efficiency improvements and an effective operating model.
∙ Digitalization: This strategic priority seeks to bring the Bank's competitive benefits into the digital age. In the first instance, central customer business procedures need to be digitalized and innovative products and solutions offered. On the other hand, it is necessary to achieve faster and leaner internal processes through process digitalization and modernizing the IT landscape.
∙ Sustainability: LBBW aims to gradually expand its portfolio of sustainable products and services and to help our customers navigate the way into the future in establishing sustainable business models. One critical step here is adjusting the lending policy to meet sustainability and risk criteria. The sustainability efforts are expected to be rounded off by building up talent management that is geared toward LBBW's strategic goals for the in-house development of suitable candidates at all levels.
∙ Agility: Quick, unbureaucratic decision-making channels, a stronger customer- and solution-oriented approach as well as autonomous cross-divisional cooperation constitute the core of embedding the agility aspect within LBBW.
Corporate Customers In the Corporate Customers segment the focus is on traditional SMEs, companies in the upper SME segment with capital market orientation and groups with a constant capital market focus in the regional core markets and other attractive economic areas, such as North Rhine-Westphalia, Bavaria and the greater Hamburg area.

G
roup o
ver
vie
w
29
C
om
bin
ed m
an
age
me
nt
rep
ort
The LBBW Group implements its universal bank approach with a broad range of products and services, extending from international business to all forms of financing, payments, hedging transactions and asset management. Landesbank Baden-Württemberg partners with municipalities in its core markets and selectively throughout Germany.
Various subsidiaries such as SüdLeasing GmbH, MKB Mittelrheinische Bank/ GmbH, SüdFactoring GmbH and Süd Beteiligungen GmbH supplement this segment's offering.
Real Estate/Project Finance The Real Estate/Project Finance segment serves professional investors, real estate investment trusts and housing companies as well as open and closed-end real estate funds in commercial real estate. Types of use include residential, office, retail and logistics, principally on the target markets of Germany, USA, UK and, selectively, in France and Canada. LBBW's syndication business focuses on structuring and arranging large-volume transactions. It also offers refinancing solutions for real estate lease transactions.
The Project Finance subsegment comprises project and transport finance for major projects, rail vehicles and aircraft. Customers include investors, users, key suppliers and subcontractors. The emphasis is on stable, low-risk fields with little market risk, for example public-sector projects, infrastructure, renewable energies and jurisdictions with stable general conditions. The regions of North America, the UK and continental Europe are at the center of focus here.
The subsidiary LBBW Immobilien Management GmbH is responsible for managing the entire real estate portfolio and offers supplementary real estate services.
Capital Markets Business The Capital Markets Business segment is in charge of Savings Banks, institutional customers and banks. LBBW is the central bank for the savings banks in the core markets of Baden-Württemberg, Saxony and Rhineland-Palatinate. Together with the savings banks, it forms a service partnership and provides them with a wide range of products and services, both for savings banks' proprietary business and the market partner business. Services such as research or securities processing and administration are offered for further distribution to the customers of the savings banks. The Bank also selectively offers products and services to other savings banks beyond the core markets.
Furthermore, within this segment the customer-oriented capital market business with banks and institutional customers is bundled and closely linked. The product range is aimed consistently at the customer's requirements and comprises capital market investments, (capital market) financing, risk management products and financial services (including the custodian bank function), and research. Export-oriented customers are supported specifically through LBBW's tailor-made offers for foreign business and its international network. The product expertise in the Capital Markets Business segment will be provided for customers in the Corporate Customer segment as well.
LBBW's asset management business is pooled within the group subsidiary LBBW Asset Management Investmentgesellschaft mbH. The main business areas are the management of special funds and direct investment mandates for institutional investors, together with mutual funds for institutional and private investors.
Private Customers/Savings Banks The Private Customers/Savings Banks segment comprises the classic and upscale private customer business, supporting business customers and the meta-and development lending banking sector with Savings Banks and their customers. BW-Bank is the Savings Bank of the state capital, Stuttgart. It offers

G
roup o
ver
vie
w
30
C
om
bin
ed m
an
age
me
nt
rep
ort
its full range of services, while its complete scope of financial and other services guarantees citizens the full array of basic banking services.
In addition to the classic retail customer segment, the business model beyond Stuttgart is also orientated towards higher-income private customers in Baden-Württemberg, Rhineland-Palatinate and Saxony as well as other attractive economic regions such as Hamburg, Munich and Düsseldorf. BW Bank has combined its skills in financing and investment matters for business customers (health care practitioners, freelancers and tradespeople) into one business area. An integrated customer management approach creates close links between private and business financial topics.
The comprehensive range of products and services extends from classic checking accounts, credit card business and basic and commercial financing to securities management, asset management and pension-savings solutions for those with a considerable portfolio of assets and complex asset structures.
LBBW furthermore offers savings banks the opportunity, by way of joint credits, to share credit risk, thus playing an important role when it comes to offering development loans to savings bank customers.
Segment allocation and coordination Since the segments were restructured as part of refining its business focus as at 1 January 2018, the LBBW Group’s customer-oriented business model has been directly reflected in the segments Corporate Customers, Real Estate/Project Finance, Capital Markets Business and Private Customers/Savings Banks. LBBW's segment reporting also includes the Corporate Items segment, which comprises all further business activities.
Information on the segments and their development can be found in the segment report (IFRS) included in the notes.
Within this business model, LBBW's Board of Managing Directors manages the Bank as a whole by tracking a set of performance indicators along the strategic segments in the light of the Group's risk-bearing capacity. The information required for managing the LBBW is provided through comprehensive, target-oriented monthly reports. The following financial performance indicators are of particular relevance to the management of the Group:
∙ consolidated profit/loss before tax (IFRS) ∙ return on equity1 ∙ cost/income ratio1 ∙ risk weighted assets (in accordance with CRR/CRD IV) ∙ common equity Tier 1 capital ratio (in accordance with CRR/CRD IV after full implementation) ∙ total capital ratio (in accordance with CRR/CRD IV after full implementation) ∙ consolidated total assets (IFRS) ∙ leverage ratio (in accordance with CRR/CRD IV after full implementation) ∙ utilization of the aggregate risk cover (Bank's own calculation pursuant to MaRisk) ∙ liquidity coverage ratio (in accordance with CRR/CRD IV in conjunction with Commission
Delegated Regulation (EU) 2015/61) ∙ For information: net profit before tax (HGB) in the case of LBBW (Bank)
In addition, the integrated bank management will continue to focus on the net stable funding ratio (in accordance with CRR/CRD IV).
1 As part of adjustments to the structure of the income statement which were required from 2018 onwards under IFRS 9, the performance indicators return on equity and cost/income ratio werealso adjusted. The previous year figures have been restated to take account of the new definition. The definitions to be applied from 2018 are shown in the segment reporting.

B
usi
nes
s re
port
3
1
Co
mb
ined
ma
na
gem
en
t re
po
rt
Overall economic development
Global economy
As a whole, the past year brought high global economic growth on par with 2017. The International Monetary Fund estimates that global GDP grew by 3.7% in 2018, 0.1 percentage points lower than in the previous year. However, GDP growth in the euro area slowed from 2.5% to 1.8%. The government shutdown in the US has delayed the publication of US GDP figures beyond the time of writing. Nonetheless, economic output is likely to have risen by 2.9% in 2018, up on 2.3% in 2017. GDP in China increased by 6.6%, following growth of 6.8% in 2017.
The price of oil fluctuated considerably. The price of a barrel of North Sea Brent opened the year at around USD 67, reaching its peak in early October at over USD 86 per barrel. Ongoing speculation about a global economic slowdown and OPEC production quotas then sent the price of oil tumbling to USD 53 per barrel by the end of the year. In the eurozone, the spike in the price of oil caused inflation to rise from 1.5% in 2017 to 1.7%.
Germany
GDP in Germany grew by 1.5% in 2018. Without accounting for the »calendar effect«, GDP grew by 1.4%. It was a year of two halves for the economy, with economic performance rallying in the first two quarters (up 0.4% and 0.5% respectively in comparison to the previous quarter) before declining by 0.2% in the third quarter – the first drop-off since the first quarter of 2015. This was the result of a hold-up in the automotive industry. The shift to a new certification standard for car emissions regulations (Worldwide Harmonized Light Vehicles Test Procedure – WLTP) caused a major slump in autumn production figures, with the Ministry for Economic Affairs reporting a 22% year-on-year decline for September 2018. This was reflected in private consumption and in exports. The final quarter then saw a return to slight growth. Driven by energy and food prices, inflation increased significantly, peaking at 2.5% and averaging 1.8% for the year as a whole. House prices also continued to climb. The German Bundesbank’s index for new and existing properties in Germany rose by 8.2% in the first three quarters.
Central bank policy
The signs pointed to monetary policy tightening in 2018. In the eurozone, the ECB gradually retired its bond purchasing program and discontinued net purchases at the end of 2018. From January 2019 onwards, the Bank will reinvest only maturing funds from the purchasing program. That amounts to an average of around EUR 17 billion a month in 2019. Funds will be reinvested in accordance with the ECB’s new capital key, which sets out a slightly higher share for Germany and France and a lower share for Italy. Key interest rates were unchanged in the reporting period. The main refinancing rate is 0% and the deposit facility rate comes to -0.40%.
In the USA, the economic upturn and greater pricing pressure led the Federal Reserve to raise its key interest rates a total of four times last year, specifically by 25 basis points in each quarter. This put the target range for the federal funds rate at 2.25% to 2.50% at the end of the year.
Business report for the Group

B
usi
nes
s re
port
3
2
Co
mb
ined
ma
na
gem
en
t re
po
rt
Bond market
On the bond market, the yield on 10-year Bunds fell from 0.42% at the beginning of the year to 0.25% at the end of the year overall. In February, yields initially rose to 0.70% thanks to good economic data indicating an early end to the ECB’s expansive monetary policy. However, this was followed by a sharp correction when Italy elected a coalition of two eurosceptic parties, causing yields to slide from over 0.60% to 0.28% in just a few trading days in May. The yield premiums of Italian 10-year government bonds surged from around 130 basis points to 280 basis points in May. In the subsequent months, this risk premium continued to widen against Bunds, reaching 327 basis points. Italian yields peaked at 3.67%. Unlike in previous crises, however, this slump did not spread to other eurozone countries. The bond market was stymied for a second time in autumn. Sustained protectionism in the US sparked economic fears and the tumbling price of oil put an end to expectations that inflation would pick up. On the US bond market, the steep US interest rate curve was eyed warily as »inversion«, i.e. an interest rate curve where yields are higher on the short end than on the long end, can be a harbinger of a recession. While the steepness of the US interest rate curve was still fairly comfortable at the beginning of the year, with 10-year Treasuries enjoying a yield advantage of over 50 basis points over the two-year US Treasuries and growing to over 70 basis points, the curve flattened out steadily from mid-February onwards. Shortly before the end of the year, the yields of 10-year US Treasuries were just 11 basis points above that of their 2-year equivalents. The flattening came from two sides. US Fed policy, as mentioned above, caused short-term yields to rise, while increasing economic worries meant that long-term yields fell to below 2.80%, after reaching 3.20% in autumn.
Currency market
The EUR started 2018 at an exchange rate of USD 1.20 per EUR and held steady at around USD 1.24 until April. Following the Italian elections and the impending eurosceptic coalition, the EUR/USD exchange rate slid to USD 1.15 per EUR. The US dollar essentially benefited from US Treasuries’ interest rate advantage over Bunds and stronger growth in the US. The EUR closed the year at USD 1.1450 per EUR.
Stock market
With the exception of a few periods of recovery, 2018 was characterized largely by price losses on the German stock market. Germany's benchmark index, the DAX, which closed out the previous year at 12,917 points, peaked at the end of January at just over 13,500 points. This was followed by a substantial correction. One reason behind this was the discussion surrounding the future of the automotive industry, a key sector of the German economy. Leading automotive companies were hit hard by the fallout caused by revelations that their vehicle emissions had been manipulated. This was exacerbated by ongoing debate surrounding the possibility of banning diesel vehicles in major cities and automotive companies potentially compensating consumers for harm caused. In addition, escalating protectionist trade policy in the US and fears that US monetary policy would continue to tighten caused prices to collapse time and time again. In December, the DAX fell below the 11,000 point mark for the first time in two years. The DAX closed out the year at 10,558 points. The situation had looked better in the US for a long time. Spurred on by tax reforms for US businesses, the country’s benchmark index, the S&P 500, rose from 2,673 points at the end of 2017 to 2,872 points at the end of January. After a few price setbacks, the market then rose to 2,930 in September. Nonetheless, the US market then dropped notably, with the S&P 500 at just 2,506 points at the end of 2018.

B
usi
nes
s re
port
3
3
Co
mb
ined
ma
na
gem
en
t re
po
rt
Banking industry performance
Despite a recent slowdown in momentum, the German banking industry continued to benefit from stable economic conditions in Germany in 2018. Demand for loans picked up over the year, although margin pressure persisted. Largely good to very good asset quality and, with this, a lower need for allowances for losses on loans and advances, together with the robust performance of the real estate market, supported the industry's development. The comfortable liquidity is encouraging. The massive expansion of equity in the last few years also shows that the German banking system is increasingly resilient. Notwithstanding, competitive pressure remained high in 2018, particularly so as business models are undergoing change provoked by digitalization advances. Furthermore, the new IFRS 9 accounting standard for creating allowances for losses on loans and advances introduced at the start of 2018 is likely to result in more volatile results at banks. Ongoing low interest rates are also hurting banks whose sources of income depend heavily on interest rates. The German banking industry therefore continues to face significant pressure to adjust, in particular due to the technological changes described above and ongoing challenging regulatory conditions. As a result, the past year saw the industry’s cost and income situation remain strained.

B
usi
nes
s re
port
3
4
Co
mb
ined
ma
na
gem
en
t re
po
rt
Business performance of the LBBW Group Results of operations, net assets and financial position
Business development in 2018
Robust economic conditions and a positive economic situation in Germany formed the basis for a good net profit/loss for the year at the LBBW Group. 2018 centered on successfully refining the strategic cornerstones of business focus, digitalization, sustainability and agility. The focus was also on bolstering customer business, with growth in both lending and deposits. In the new core sectors, business relationships were expanded and project financing activities were stepped up. The opening of the Toronto representative office marked further progress in internationalizing customer business and boosted the international network. The LBBW Group has also taken another major step in digitalizing schuldschein transactions by successfully implementing blockchain. Together with Stuttgart Stock Exchange, LBBW has created a digital marketplace for funding under the DEBTVISION brand, and has successfully used it to process its first transactions. Joining the Marco Polo network marked a further step towards improving banking services for LBBW customers through technological innovation. By introducing Fitbit Pay, LBBW also set another milestone in innovative payment methods. Another sustainable capital market product was placed on the market after a green bond in the form of a mortgage-backed cover bond was issued and the Group was also named best green bond issuer. LBBW employs principles and guidelines to create a binding framework for sustainable and responsible business practices and conduct. Neutral rating agencies regularly review LBBW’s commitment to sustainability in all business areas and have attested to this by awarding high ratings. Supported by agility managers, the Group turned increasingly to agile methods in 2018 in order to meet the challenges posed by competition in the banking industry, while also being able to take projects forward more efficiently.
Nevertheless, business performance continued to be characterized by intense competition within the banking sector, tough general conditions in capital markets, high costs in IT infrastructure due to investment in further digitalization and ongoing negative key interest rates in the eurozone. Considerable uncertainty continues to surround discussion of the final Brexit scenario and the consequences of this for the banking sector. All in all, LBBW considers the potential impact of Brexit as manageable for the Group. Risks and uncertainties are countered by permanent monitoring. Increased uncertainty in relevant portfolios was also reflected in the valuation.
IFRS 9 was adopted in full for the first time in the 2018 financial year. In applying IFRS 9 for the first time, LBBW is exercising the option of not calculating the comparative prior-year figures in accordance with this standard. The comparative information for 2017 is therefore shown in accordance with IAS 39, applying the same accounting policies as in the annual report as at 31 December 2017. The previous year’s figures based on IAS 39 were transferred to the structure of the IFRS 9 scheme without adjustments.
Consolidated profit/loss before tax improved moderately by EUR 43 million and came to EUR 558 million for the 2018 reporting year (previous year: EUR 515 million). This was down slightly on forecasts, due primarily to net interest income and net fee and commission income coming in slightly below forecast. A moderate reduction in administrative expenses compared to the forecast and a substantial increase in net gains/losses on remeasurement and disposal over the target figure did not fully offset the effects described above. Despite higher risk provisions on the basis of IFRS 9, the overall drop in net additions to allowances for losses on loans and advances was in line with planning, confirming that LBBW’s lending portfolio continues to be of a high quality. A very high share of the exposure remains in the investment grade range.

B
usi
nes
s re
port
3
5
Co
mb
ined
ma
na
gem
en
t re
po
rt
The cost/income ratio (CIR) as at 31 December 2018 amounted to 72.8%. This represents a slight year-on-year improvement (previous year: 76.4%), driven mainly by lower expenses, and puts the figure within the forecast. LBBW calculates its CIR as the ratio of total administrative expenses, expenses for the bank levy and deposit guarantee system, the guarantee commission for the State of Baden-Württemberg and net restructuring income to total net interest income, net commission income, net gains on remeasurement and disposal less allowances for losses on loans and securities and other operating income/expenses. The return on equity (ROE) also improved to 4.3% (previous year: 4.0%), marginally below target. RoE as a performance indicator is calculated on the basis of (annualized) consolidated profit/loss before tax and average equity on the balance sheet. This figure is adjusted for the unappropriated profit for the current period.
Total assets rose by EUR 3.6 billion year on year to EUR 241.2 billion, essentially driven by an upturn in business with corporate customers and real estate financers. Despite growth, in particular with large corporates, total assets remained slightly below target on account of the challenging capital markets environment.
At 4.7% (in accordance with CRR/CRD IV »fully loaded«), LBBW’s leverage ratio rose against the previous year figure of 4.6%, thereby substantially exceeding the minimum 3.0% stipulated by the supervisory authorities.
As at the reporting date of 31 December 2018, LBBW's minimum liquidity coverage ratio (LCR) under the Commission Delegated Regulation (EU) 2015/61 pertaining to liquidity coverage ratios stood at 114.8% (previous year 145.8%). The temporary decline resulted primarily from maturing term deposits and repurchase transactions that were not extended and from new business. Nonetheless, the statutory minimum for 2018 of 100% was substantially exceeded.
Risk-weighted assets (RWA) rose moderately by EUR 4.6 billion in the period under review to EUR 80.3 billion (previous year: EUR 75.7 billion), driven chiefly by growth in customer business.
The LBBW Group’s capital ratios as at the end of the reporting period remained well in excess of the regulatory capital requirements (CRR/CRD IV fully loaded). Specifically, the common equity Tier 1 capital ratio came to 15.1% (previous year: 15.7%) and the total capital ratio to 21.9% (previous year: 22.2%).
The European Central Bank (ECB) informed LBBW that it is required to maintain a common equity Tier 1 capital ratio of 9.75% as at 1 March 2019. This ratio includes the Pillar 2 capital requirement and the common equity Tier 1 capital to be maintained as a capital conservation buffer in accordance with section 10c of the German Banking Act (KWG) and as a capital buffer in accordance with section 10g KWG for other systemically important institutions, which has now been fully phased in. In addition, Section 10d KWG stipulates that a countercyclical capital buffer must be maintained for a marginal share of foreign receivables. The ECB has also declared a capital recommendation that goes beyond the mandatory requirement, which must also comprise CET1 capital.
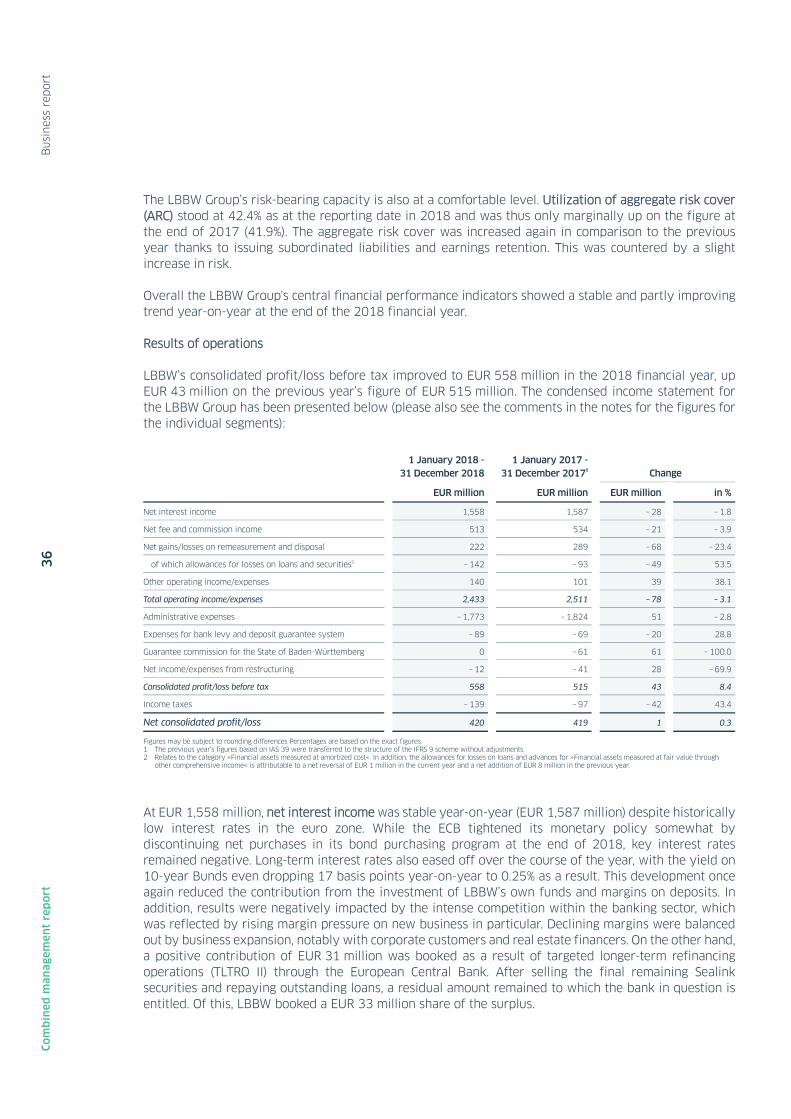
B
usi
nes
s re
port
3
6
Co
mb
ined
ma
na
gem
en
t re
po
rt
The LBBW Group’s risk-bearing capacity is also at a comfortable level. Utilization of aggregate risk cover (ARC) stood at 42.4% as at the reporting date in 2018 and was thus only marginally up on the figure at the end of 2017 (41.9%). The aggregate risk cover was increased again in comparison to the previous year thanks to issuing subordinated liabilities and earnings retention. This was countered by a slight increase in risk.
Overall the LBBW Group's central financial performance indicators showed a stable and partly improving trend year-on-year at the end of the 2018 financial year.
Results of operations
LBBW’s consolidated profit/loss before tax improved to EUR 558 million in the 2018 financial year, up EUR 43 million on the previous year’s figure of EUR 515 million. The condensed income statement for the LBBW Group has been presented below (please also see the comments in the notes for the figures for the individual segments):
1 January 2018 -
31 December 2018 1 January 2017 -
31 December 2017¹ Change
EUR million EUR million EUR million in %
Net interest income 1,558 1,587 – 28 – 1.8
Net fee and commission income 513 534 – 21 – 3.9
Net gains/losses on remeasurement and disposal 222 289 – 68 – 23.4
of which allowances for losses on loans and securities2 – 142 – 93 – 49 53.5
Other operating income/expenses 140 101 39 38.1
Total operating income/expenses 2,433 2,511 – 78 – 3.1
Administrative expenses – 1,773 – 1,824 51 – 2.8
Expenses for bank levy and deposit guarantee system – 89 – 69 – 20 28.8
Guarantee commission for the State of Baden-Württemberg 0 – 61 61 – 100.0
Net income/expenses from restructuring – 12 – 41 28 – 69.9
Consolidated profit/loss before tax 558 515 43 8.4
Income taxes – 139 – 97 – 42 43.4
Net consolidated profit/loss 420 419 1 0.3
Figures may be subject to rounding differences Percentages are based on the exact figures. 1 The previous year’s figures based on IAS 39 were transferred to the structure of the IFRS 9 scheme without adjustments. 2 Relates to the category »Financial assets measured at amortized cost«. In addition, the allowances for losses on loans and advances for »Financial assets measured at fair value through
other comprehensive income« is attributable to a net reversal of EUR 1 million in the current year and a net addition of EUR 8 million in the previous year.
At EUR 1,558 million, net interest income was stable year-on-year (EUR 1,587 million) despite historically low interest rates in the euro zone. While the ECB tightened its monetary policy somewhat by discontinuing net purchases in its bond purchasing program at the end of 2018, key interest rates remained negative. Long-term interest rates also eased off over the course of the year, with the yield on 10-year Bunds even dropping 17 basis points year-on-year to 0.25% as a result. This development once again reduced the contribution from the investment of LBBW’s own funds and margins on deposits. In addition, results were negatively impacted by the intense competition within the banking sector, which was reflected by rising margin pressure on new business in particular. Declining margins were balanced out by business expansion, notably with corporate customers and real estate financers. On the other hand, a positive contribution of EUR 31 million was booked as a result of targeted longer-term refinancing operations (TLTRO II) through the European Central Bank. After selling the final remaining Sealink securities and repaying outstanding loans, a residual amount remained to which the bank in question is entitled. Of this, LBBW booked a EUR 33 million share of the surplus.

B
usi
nes
s re
port
3
7
Co
mb
ined
ma
na
gem
en
t re
po
rt
Net fee and commission income declined slightly by EUR 21 million to EUR 513 million (previous year: EUR 534 million). The sharp downturn in brokerage business and slightly lower loans and guarantees were not offset by the significant upsurge in asset management. Fund consulting services performed particularly well. Commission from payment transactions rose slightly, while securities and custody business was stable.
Net gains/losses on remeasurement and disposal fell noticeably by EUR 68 million to EUR 222 million and was defined by the at times opposing effects described below.
At EUR 24 million, net income from investments accounted for using the equity method fell short of the previous year’s figure of EUR 31 million. This was driven by a drop in current income from associates and joint ventures that were not offset by lower impairment.
Net additions to allowances for losses on loans and securities measured at cost climbed to EUR 142 million in the 2018 financial year, well in excess of the EUR –93 million booked in the previous year. While the previous accounting standard IAS 39 stipulated that impairment losses are to be recognized only once a previously defined default event occurs, the new Standard IFRS 9, applicable from 1 January 2018 onwards, requires that expected losses are reported. In the event of an economic slowdown, the loss allowance in accordance with IFRS 9 is therefore recognized at an earlier stage and is higher than under IAS 39. This may result in situations where the modeling no longer delivers unbiased results, for example in the event of significant disruptive elements due to macroeconomic, political or legal developments that cannot yet be sufficiently accounted for in the ratings on which the allowances for losses on loans and advances are based. As well as taking into account forward-looking information on a parameter-specific basis, qualitative information, estimates, scenario analyses and simulations were therefore used to determine how to adjust allowances for losses on loans and advances, which ultimately meant that allowances for losses on loans and advances had to be increased. Nonetheless, LBBW continues to enjoy good portfolio quality, as demonstrated by the very high exposure share in the investment grade range and a low default rate.
The marked decline in net income from financial instruments measured at fair value through other comprehensive income was caused in particular by lower contributions from securities and equity investments. Following the introduction of IFRS 9 and from the 2018 financial year onwards, the earnings contributions from equity investments are reported under net gains/losses from financial instruments measured at fair value through profit or loss, resulting in a EUR 78 million decrease in net gains/losses from equity investments to EUR 0 million. Net income from securities also fell by EUR – 18 million to EUR 37 million.
Net gains/losses from financial instruments measured at fair value through profit or loss improved by EUR 83 million to EUR 302 million. Capital market activities contributed EUR 290 million to the result, while banking book management contributed EUR 25 million. Hedge accounting had a slightly negative effect of EUR –12 million. Following the introduction of IFRS 9, net income from equity investments and other equity instruments are reported with net gains/losses from financial instruments measured at fair value through profit or loss as an element of banking book activities and amounted to EUR 32 million. Net gains from other equity instruments benefited from a subsequent purchase price payment in connection with a disposal of an equity investment in 2015.
Other operating income/expenses increased sharply by EUR 39 million to EUR 140 million (previous year: EUR 101 million). Net reversals amounted to EUR 3 million in the current year, up on net additions to provisions of EUR – 53 million in the previous year. On the contrary, the result from the sale of properties was down by EUR – 8 million at EUR 40 million and the result from investment property fell by EUR – 5 million to EUR 70 million.

B
usi
nes
s re
port
3
8
Co
mb
ined
ma
na
gem
en
t re
po
rt
Despite continued high investment in the restructuring and modernization of IT, administrative expenses fell marginally by EUR 51 million year on year to EUR –1,773 million (previous year: EUR – 1,824 million). Reflecting the reduction in the number of employees and lower pension expenses, staff costs fell by EUR 24 million to EUR – 1,002 million (previous year: EUR – 1,026 million) despite offsetting effects from pay-scale adjustments. Other administrative expenses were also down by EUR 24 million at EUR – 667 million (previous year: EUR – 691 million), in particular as a result of a reduction in IT costs, which in the previous year had included high expenses for the operational launch of the new core banking system in April 2017. Nonetheless, investment in the modernization of IT, not least for more extensive digitalization, was at a high level. Amortization and write-downs of property and equipment and intangible assets decreased by EUR 3 million to EUR – 104 million.
The substantial rise in expenses for the bank levy and deposit guarantee system of EUR 20 million to EUR – 89 million was caused in part by an adjustment of the bank levy assessment base, which rose from 1.05% to 1.15% of guaranteed deposits. The volume of contributions is also spread across a smaller number of institutions.
The state of Baden-Württemberg had guaranteed certain loans to the special-purpose entity Sealink until the end of 2017. Guarantee commission of EUR – 61 million was paid for this in the previous year. Following the discontinuation of the risk protection set up for the loans to Sealink, guarantee commission is no longer paid to the State of Baden-Württemberg, hence no further expenses were incurred.
Lower demand for restructuring expenses – following the implementation of some measures in back office divisions and retail customer business – benefited net income/expenses from restructuring, resulting in expenses of EUR 12 million, down on EUR 41 million in the previous year. The new planned measures focus on adjusting the organizational setup and monitoring the product portfolio in selected units in Capital Markets Business.
Consolidated profit/loss before tax improved slightly to EUR 558 million, up EUR 43 million on the previous year’s figure of EUR 515 million.
Income tax expenses increased to EUR –139 million (previous year: EUR –97 million) on account of the rise in net profit/loss before tax. In addition, the first-time recognition of deferred tax assets in the New York branch had a positive impact on the tax rate in the previous year.
Net consolidated profit/loss after tax rose to EUR 420 million (previous year: EUR 419 million).
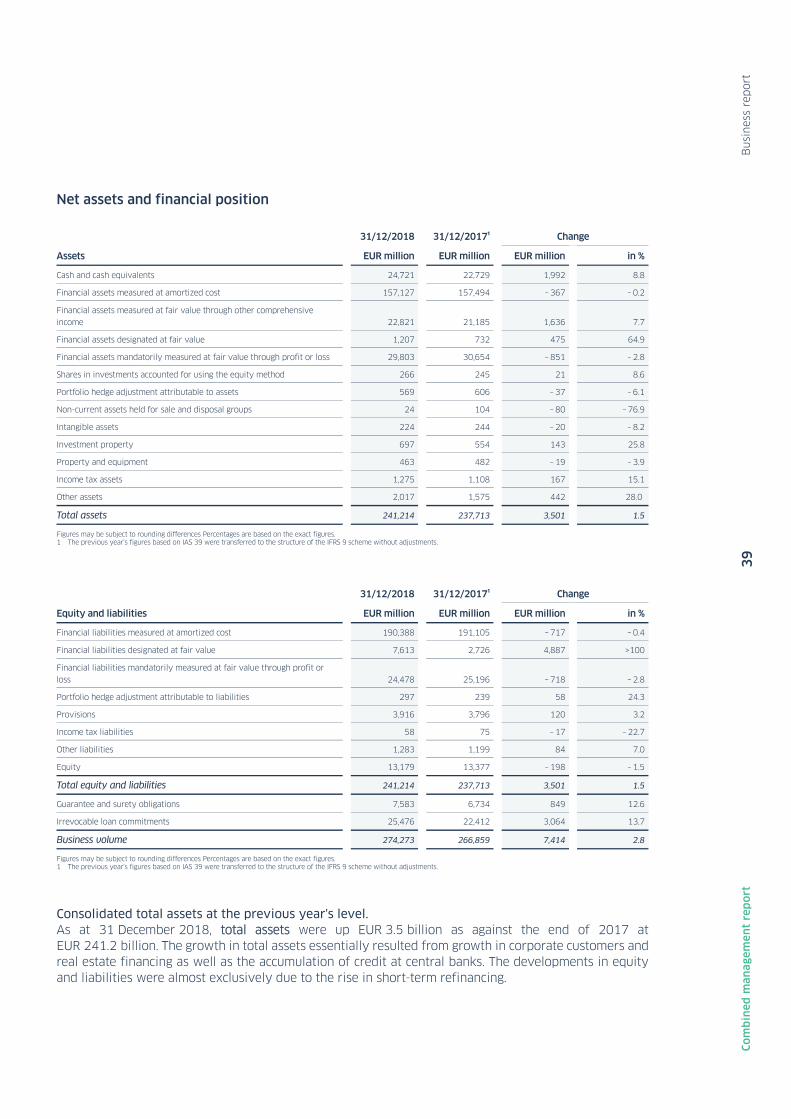
B
usi
nes
s re
port
3
9
Co
mb
ined
ma
na
gem
en
t re
po
rt
Net assets and financial position
31/12/2018 31/12/2017¹ Change
Assets EUR million EUR million EUR million in %
Cash and cash equivalents 24,721 22,729 1,992 8.8
Financial assets measured at amortized cost 157,127 157,494 – 367 – 0.2
Financial assets measured at fair value through other comprehensive income 22,821 21,185 1,636 7.7
Financial assets designated at fair value 1,207 732 475 64.9
Financial assets mandatorily measured at fair value through profit or loss 29,803 30,654 – 851 – 2.8
Shares in investments accounted for using the equity method 266 245 21 8.6
Portfolio hedge adjustment attributable to assets 569 606 – 37 – 6.1
Non-current assets held for sale and disposal groups 24 104 – 80 – 76.9
Intangible assets 224 244 – 20 – 8.2
Investment property 697 554 143 25.8
Property and equipment 463 482 – 19 – 3.9
Income tax assets 1,275 1,108 167 15.1
Other assets 2,017 1,575 442 28.0
Total assets 241,214 237,713 3,501 1.5
Figures may be subject to rounding differences Percentages are based on the exact figures. 1 The previous year’s figures based on IAS 39 were transferred to the structure of the IFRS 9 scheme without adjustments.
31/12/2018 31/12/2017¹ Change
Equity and liabilities EUR million EUR million EUR million in %
Financial liabilities measured at amortized cost 190,388 191,105 – 717 – 0.4
Financial liabilities designated at fair value 7,613 2,726 4,887 >100
Financial liabilities mandatorily measured at fair value through profit or loss 24,478 25,196 – 718 – 2.8
Portfolio hedge adjustment attributable to liabilities 297 239 58 24.3
Provisions 3,916 3,796 120 3.2
Income tax liabilities 58 75 – 17 – 22.7
Other liabilities 1,283 1,199 84 7.0
Equity 13,179 13,377 – 198 – 1.5
Total equity and liabilities 241,214 237,713 3,501 1.5
Guarantee and surety obligations 7,583 6,734 849 12.6
Irrevocable loan commitments 25,476 22,412 3,064 13.7
Business volume 274,273 266,859 7,414 2.8
Figures may be subject to rounding differences Percentages are based on the exact figures. 1 The previous year’s figures based on IAS 39 were transferred to the structure of the IFRS 9 scheme without adjustments.
Consolidated total assets at the previous year's level. As at 31 December 2018, total assets were up EUR 3.5 billion as against the end of 2017 at EUR 241.2 billion. The growth in total assets essentially resulted from growth in corporate customers and real estate financing as well as the accumulation of credit at central banks. The developments in equity and liabilities were almost exclusively due to the rise in short-term refinancing.

B
usi
nes
s re
port
4
0
Co
mb
ined
ma
na
gem
en
t re
po
rt
The business volume (consolidated total assets including the off-balance-sheet surety and guarantee agreements and irrevocable loan commitments) amounted to EUR 274.3 billion, up EUR 7.4 billion on the figure as at 31 December 2017. In addition to the change in total assets in the reporting period, the increase was due to a rise in irrevocable loan commitments.
Business performance at the start of the year was defined by highly intensive competition and rising volatility on the capital markets. Despite this, LBBW was able to achieve growth in its lending and deposit business in this difficult environment. LBBW reported consistently high demand for share-based certificates in its business with banks and savings banks. The cooperation with the savings banks also led to growth in new business in the area of development loans, and there has been a marked increase in lending to medium-sized and large enterprises. Furthermore, LBBW reported a higher volume in commercial real estate financing with a high share of certified, sustainable real estate.
Sustainability is one of LBBW’s four strategic cornerstones. LBBW was able to underline its strong product expertise in the sustainable issues market segment. In June, it placed its first green Hypothekenpfandbrief with a volume of EUR 500 million and a term of five years. Just in May, LBBW became the first continental European bank to issue the largest ever covered bond in the form of a mortgage bond denominated in sterling, with a volume of GBP 750 million and a term of three years.
After the portfolio of the Sealink Funding special purpose entity, in which the securities of the former Sachsen LB were bundled, was sold almost entirely to international investors last year, the final remaining securities from this portfolio were sold in 2018. This allowed Sealink Funding to end the guarantee relationship with the German state of Saxony. LBBW’s guarantee financing loan – which amounted to EUR –1.8 billion on last count – was subsequently repaid in full.
IFRS 9 has been effective for companies since 1 January 2018. This replaces the previous accounting regulations of IAS 39. The transition to IFRS 9 essentially resulted in changes to the classification and measurement of financial instruments, new regulations for recognizing impairment and the adoption of a new model for general hedge accounting.
Lending The cash reserve amounted to EUR 24.7 billion as at 31 December 2018 and was therefore EUR 2.0 billion higher than the previous year's figure. The excess liquidity on the money markets thus led to rising central bank balances.
The item Financial assets measured at amortized cost declined slightly by EUR 0.4 billion to EUR 157.1 billion.
Loans and advances to banks declined by EUR 1.4 billion, bringing their total to EUR 46.8 billion at the end of the reporting period. A fall in business with major European banks led in particular to a EUR 2.5 billion drop in securities repurchase business and a EUR 1.5 billion decrease in overnight and term deposits. The stronger development loan business with savings banks allowed public-sector loans to climb by EUR 1.4 billion.

B
usi
nes
s re
port
4
1
Co
mb
ined
ma
na
gem
en
t re
po
rt
Loans and advances to customers, on the other hand, rose by EUR 1.7 billion to EUR 110.1 billion as at 31 December 2018, mainly on account of activities with corporate customers. In connection with the transition to IFRS 9, transactions that did not satisfy the requirements for a simple loan agreement as defined in IFRS 9 (contractual cash flow criterion) on account of adverse collateral agreements were allocated to financial assets mandatorily measured at fair value through profit or loss in the amount of EUR 2.8 billion. A portfolio of EUR 2.3 billion used for short-term liquidity management was allocated to the »hold to collect and sell« business model, and is therefore reported at fair value through other comprehensive income.
The sale of the final securities from the former Sachsen LB was completed this year. The repayment of the guarantee finance loan reduced other loans by EUR – 1.8 billion. This was offset by new business with SME customers and large companies and by real estate financing, resulting in an increase in the Other loans item of EUR 3.8 billion.
The statement of financial position item Financial assets measured at fair value through other comprehensive income climbed by EUR 1.7 billion to EUR 22.8 billion, mainly on account of the reclassification of a portfolio to manage LCR in the context of the transition to IFRS 9. Under IFRS 9, almost all equity investments were also reclassified from measurement through other comprehensive income to measurement through profit or loss, causing this item to decrease. This item still mainly consists of debentures and fixed-income securities.
Financial mandatorily assets measured at fair value through profit or loss fell by EUR 0.9 billion to EUR 29.8 billion. In addition to transactions that do not satisfy the contractual cash flow criterion, almost all non-consolidated equity investments that were previously measured at fair value through other comprehensive income are now reported under this item in accordance with IFRS 9. This resulted in an effect from the transition to IFRS 9 of EUR 3.2 billion. Netting effects and low customer activity in derivatives held for trading caused the trading portfolio to fall by a total of EUR 2.1 billion as a result of operating activities. Loans and advances to customers that did not meet the contractual cash flow criterion (the »SPPI« criterion) due to adverse collateral agreements also declined by EUR 2.0 billion.
Funding On the liabilities side of the consolidated balance sheet, compared with the previous year the main items affected by major volume changes were deposits from customers, securitized liabilities and deposits from banks.
The item Financial liabilities measured at amortized cost declined by EUR 0.7 billion to EUR 190.4 billion.
Deposits from banks changed by EUR 1.7 billion to EUR 63.6 billion. Transmitted loans rose by EUR 1.4 billion, in particular due to new business in development loans. The volume of overnight and term deposits also saw an upturn of EUR 1.2 billion.

B
usi
nes
s re
port
4
2
Co
mb
ined
ma
na
gem
en
t re
po
rt
The item Deposits from customers was EUR 3.1 billion higher as against the end of 2017 at EUR 82.5 billion, primarily the result of an increase in overnight and term deposits of EUR 3.1 billion. The dissolution of the guarantee relationship with the German state of Saxony in connection with the sale of the final securities in the Sealink portfolio meant that the cash deposits were repaid in full, resulting in a decrease in current account liabilities of EUR 1.8 billion.
By contrast to the two above items, Securitized liabilities declined by EUR 5.6 billion to EUR 38.8 billion in 2018. The change in the item was due to some bonds maturing and, primarily, the transition to IFRS 9, which requires the designation of transactions with accounting mismatches to the fair value option.
Liabilities designated at fair value rose by EUR 4.9 billion to EUR 7.6 billion. This was partly on account of the reclassification of transactions with accounting mismatches in the amount of EUR 2.8 billion to the fair value option in accordance with IFRS 9. New issues such as the mortgage-backed covered bond increased these securitized liabilities by a further EUR 2.0 billion in the current financial year.
Financial liabilities mandatorily measured at fair value through profit or loss dropped slightly by EUR 0.7 billion to EUR 24.5 billion. Derivatives held for trading declined by EUR – 1.1 billion to EUR 14.1 billion which – like the development under assets – was largely caused by netting effects and customer business coming to an end. By contrast, securitized liabilities rose by EUR 0.6 billion and obligations from short sales of securities by EUR 0.3 billion.
Equity At EUR 13.2 billion as at 31 December 2018, LBBW’s equity was virtually unchanged as against 31 December 2017 (previous year: EUR 13.4 billion). The decline is essentially due to the first-time effects of the adoption of IFRS 9 of EUR 0.2 billion and the distribution of dividends to shareholders of EUR 0.2 billion.
Financial position LBBW’s funding strategy is determined by the Asset Liability Committee (ALCo). Here the Group focuses on ensuring a balanced overall structure in terms of the groups of products and investors used. The Group’s financial position was satisfactory throughout the entire 2018 reporting year thanks to the good liquidity situation. LBBW was able to obtain funding to the desired extent at all times.
The Bank has been required to maintain a liquidity coverage ratio (LCR) of 100% since 1 January 2018, and has done so at all times during the year. With an LCR ratio of 114.8% at the end of the year, LBBW outperformed this target substantially.

B
usi
nes
s re
port
4
3
Co
mb
ined
ma
na
gem
en
t re
po
rt
Employees
Dedicated, motivated and efficient employees are central to the success of every company. This is particularly the case for the financial services sector, which is under significant pressure to change. In addition to integrity, excellent professional skills and in-depth customer orientation, a constant willingness to change and to be open to new market developments are factors becoming increasingly important as success criteria in competition.
In view of the advancing digitalization, tighter regulatory requirements and a long-lasting phase of low interest rates, LBBW and the entire industry is forced to renew its offerings and the underlying processes in ever faster cycles. Consistent customer-orientation, high adaptability and a willingness to work in a flexible manner will therefore continue to be of great importance for the success of the LBBW Group.
LBBW is very demanding of itself and hence of its workforce. At the same time, it offers attractive workplaces with development potential for ambitious employees who relish in success. LBBW reports extensively on its offerings and benefits as an attractive employer in its non-financial statement, as a component of its combined management report.
Employee numbers.
LBBW (Bank) LBBW
2018 2017 2018 2017
Employees 8,232 8,574 10,017 10,326
Proportion of women 52.2% 52.6% 52.2% 52.6%
Proportion of men 47.8% 47.4% 47.8% 47.4%
Part-time employees 29.7% 30.9% 28.1% 29.1%
Full-time employees 70.3% 69.1% 71.9% 70.9%
Apprentices (including students at universities of cooperative education) 260 281 278 300
Proportion of apprentices 3.2% 3.3% 2.8% 2.9%
As at 31 December 2018, the number of employees at LBBW fell to 10,017 (previous year: 10,326), also due to the adjustments to its strategic alignment. The staff fluctuation rate based on the Confederation of German Employers' Association's (BDA) formula declined to 6.4% for LBBW (Bank) in 2018, up from 7.4% in the previous year. Adjusted for restructuring-related early retirement and severance agreements (3.0%), the LBBW (Bank) rate of 3.4% was slightly lower than the previous year's figure.
At 45.3 years, the average age of employees at LBBW (Bank) in the year under review increased slightly over the previous year (44.8 years). The average length of service also increased marginally to 19.4 years, a slight rise for the Bank (previous year: 18.9 years). The proportion of female employees, in contrast, remained nearly unchanged in 2018 at 52.2%. The proportion of part-time employment contracts, including reduced working hours due to partial retirement, in turn moved down at LBBW from 29.1% to 28.1%.
R
isk
report
4
4
Co
mb
ined
ma
na
gem
en
t re
po
rt
Basic principles
Risk-oriented integrated bank management
LBBW defines risk management as the use of a comprehensive set of tools to address risks in accordance with the scope set out by law and the articles of association and by the strategy set out by the Board of Managing Directors. Risks and the associated opportunities for income and growth potential should be taken within the scope of the internal control process and defined risk appetite, in a deliberate and controlled manner.
The internal control process and the guidelines arising from risk appetite thus form a core element of the Group-wide system for risk-oriented integrated bank management and particularly comprises the organizational and operational structure, the risk management and controlling processes, and internal auditing.
Risk strategy
The Board of Managing Directors and the Risk Committee of the Supervisory Board stipulate the principles of the risk management system by defining risk strategies that are consistent with LBBW's business strategy.
Risk strategy guidelines are defined in the group risk strategy, which applies to the entire Group and across all risk types, in accordance with the Minimum Requirements for Risk Management (MaRisk) and the relevant European standards (including the European Banking Authority Guidelines). In this context, the Group risk strategy defines specifications on risk appetite from both qualitative and quantitative points of view that are to be observed in all business activities.
The quantitative part of risk appetite sets out concrete specifications in the form of thresholds for LBBW's material economic and regulatory steering parameters – specifications are set out for times of normal business operations as well as under stress conditions.
As part of the quantitative risk appetite, the strategic limit system operationalizes the requirements and objectives defined in the business strategy for all material risk types covered by risk-bearing capacity. The upper risk limit for economic capital was defined by the Group's Board of Managing Directors, taking into account the aforementioned fundamental risk strategy requirements and the economic capital forecast for the coming five years for 2019, and allocated to the material risk types. Further details can be found in the section on the risk situation of the LBBW Group.
The liquidity risk tolerance caps the liquidity risk in the narrower meaning (i.e. it limits the risk of not meeting payment obligations). Further information can be found in the section on liquidity risks.
The risk guidelines form the qualitative element of risk appetite. They constitute the main strategic principles and rules of conduct that are used for weighing up risks and opportunities within the LBBW Group. They contribute to the creation of a uniform risk culture and – in accordance with materiality principles – form the framework for the precise organization of processes and methods of risk management. This qualitative element of risk appetite is completed with further guidelines – such as in the form of a Code of Conduct and Ethics which applies throughout the entire Group.
Risk report
R
isk
report
4
5
Co
mb
ined
ma
na
gem
en
t re
po
rt
In addition, the specific risk strategies approved for each material risk type document the current and target risk profile of LBBW, specify customer-, product- and market-specific guidelines and thereby create the framework for medium-term planning together with the business strategy. Additional information on the specific risk strategies is provided in the sections on the respective risk type.
Risk management systems
Risk capital and liquidity management
Capital management at LBBW is designed to ensure solid capitalization within the LBBW Group, both in times of normal business operations and under stress conditions. In order to guarantee adequate capital and hence the associated permanent viability of LBBW from various perspectives, the capital ratios and structures are analyzed from an economic value view point as well as from a regulatory perspective. Both control loops focus on achieving the company targets for normal business operations, while making adequate provisions for stress resistance under stress conditions.
LBBW's risk management procedures are appropriately structured on the basis of the type, scope, complexity and risk content of the business activities and business strategy. The structure takes account of MaRisk and other relevant statements by national and European regulatory authorities.
All the principal economic risks are included in the risk management procedures. The processes, procedures and methods are regularly reviewed to ensure their adequacy and permanently further developed. These reviews also take account of the findings of the audits and the SREP process of the European Central Bank (ECB), of the statutory auditor and the Group Auditing division and these findings are implemented accordingly.
Risk types The overall risk profile of the LBBW Group is ascertained annually by Group Risk Controlling on the basis of the Group risk inventory and is presented to the Board of Managing Directors in the form of a risk map for approval. Risk measurement of the principal subsidiaries from a risk point of view is based on the transparency principle; i.e. the types of risk identified as material in the respective companies are integrated in the Group-wide risk measurement of the respective type of risk. LBBW shows companies whose risks are regarded as immaterial in investment risk.

R
isk
report
4
6
Co
mb
ined
ma
na
gem
en
t re
po
rt
The following material risk types were identified:
Risk types
Risk category Describes possible ...
... Losses arising from the default or deterioration in the credit rating of business partners.
...Defaults by sovereign borrowers or restrictions on payments.
... Losses arising from shortfall in proceeds from the liquidation of collateral.Counterparty default risks
... Losses caused by changes in interest rates, credit spreads, equity prices, exchange rates,commodity prices, volatility.
...Problem of not being able to quickly close out larger positions at market value. Market price risks
... Problems meeting payment obligations in the short term.Liquidity risks
... Losses arising from the unsuitability or failure of internal processes and systems, people, or due to external events, including legal risks.
Operational risks
... Losses in the value of Group companies and equity investments not included in the above riskcategories.
Investment risks
... Losses caused by damage to the Bank’s reputation.Reputation risks
... Losses due to less favorable business performance than expected or from strategicerrors, provided that they do not relate to the aforementioned characteristic banking risks.
Business risks
... Increase in provisions for pensions.Pension risks
... Losses in the value of the Group’s real estate holdings.Real estate risks
... Losses resulting especially from potential plan variances in the project developmentbusiness of LBBW Immobilien Management GmbH.
Development risks
... Losses that can arise as a result of decisions that are based on the result of models. Triggering factors could include errors in the concept, application and validation of models.
Model risks

R
isk
report
4
7
Co
mb
ined
ma
na
gem
en
t re
po
rt
Economic view To ensure adequate capitalization from an economic point of view, a Group-wide compilation of risks across all material risk types and subsidiaries, and the comparison of these with the capital calculated from an economic perspective (aggregate risk cover). This calculation of risk-bearing capacity (RBC) is carried out at a confidence level of 99.93 and with comprehensive classification of the definition of capital taking into consideration subordinated liabilities.
The internal monitoring of this risk-bearing capacity using binding targets and tolerance levels ensures LBBW Group has adequate economic capital both in times of normal business operations as well as under stress conditions.
At LBBW, aggregate risk cover (corresponds to risk coverage potential as per MaRisk) denotes the equity restricted according to economic criteria which is available to cover unexpected losses. In addition to equity (as per IFRS including revaluation reserves), subordinated debt and the realized income statement result in accordance with IFRS are considered components of aggregate risk cover. Conservative deductible items are also included in aggregate risk cover due to regulatory requirements.
Economic capital is calculated as a uniform risk measure at the highest level. This is deemed to constitute the amount of capital necessary to cover the risk exposure resulting from LBBW's business activities. In contrast with the capital backing stipulated by regulatory bodies, it therefore represents the capital backing required from LBBW’s point of view for economic purposes, which is calculated using its own risk models. It is quantified as value-at-risk (VaR) at a confidence level of 99.93% and a one-year holding period for counterparty, market price, real estate, development, investment and operational risks. Other risks (reputation, business, pension and model risks) are quantified either as value-at-risk or using simplified procedures.
By contrast, the liquidity risks (within the meaning of the risk of not meeting payment obligations) are managed and limited in accordance with the quantitative and procedural rules defined in the liquidity risk tolerance.
The model risks are managed entirely via the model risk management process and the corresponding tools, wherein the identification and classification of models via model inventory and the independent validation unit of Group Risk Controlling play a prominent role.
The upper risk limit for economic capital (economic capital limit) as part of the quantitative risk tolerance represents the Group-wide overarching limit for all relevant quantified risk types. This limit reflects the maximum willingness of the LBBW Group to accept risk. In keeping with the conservative principle underlying risk tolerance, it is substantially below the aggregate risk cover and thus provides scope for risks arising from unforeseeable stress situations, which are also limited (stress resistance). In addition, the economic capital limit is verified on the basis of the economic capital target figures from the capital planning process.
On the basis of the upper economic capital limit, economic capital limits are defined for the various directly quantified risk types and for the other risks not quantified within a model approach. The risk-bearing capacity is monitored by Group Risk Controlling by means of a traffic light system. The respective traffic light thresholds are linked to the recovery plan pursuant to the German Recovery and Resolution Act (SAG) and tied to an escalation process. Risks within the framework of the LBBW Group's risk-bearing capacity are described before possible measures to limit risks (so-called gross presentation).

R
isk
report
4
8
Co
mb
ined
ma
na
gem
en
t re
po
rt
Regulatory view In addition to the economic perspective, LBBW's risk appetite and management concept includes the regulatory steering group. This steering group is responsible for ensuring compliance with regulatory capital and risk parameters at all times. To this end, internal targets are set (tolerance levels well above the minimum regulatory requirements) and compliance is ensured by way of an ongoing monitoring process. This process comprises frequent comparisons of target/actual data and a forecast process.
In addition, the capital planning process ensures that the company targets are met in the long-term; this process includes planning regulatory and economic key figures for anticipated business performance (including expected changes in volume if necessary) over a five year period. In addition, compliance with the internal targets also in case of adverse developments over the same time horizon is ensured.
Further details on this can be found in the notes.
Stress tests In addition to risk measurement tools and statistical indicators based on historical data, various stress scenarios play an important part in risk assessment. They analyze in advance the impact of possible future economic volatility and market crises in order to establish whether LBBW is able to withstand extreme situations. Stress tests are therefore an integral part of LBBW's risk management.
The scenarios are designed using various criteria: LBBW’s scenarios comprise adverse developments with moderate deviations (from the plan), stress scenarios with exceptional but plausible events of varying degrees of severity and exposure scenarios under which the existence of the Bank is threatened within the context of the recovery plan. The adverse scenarios develop over a period of several years, whereas the severe stress scenarios are defined either for a time frame of several years or of one year.
The scenarios are arranged in such a way that they take into account the impact on economic and regulatory capital and on the liquidity situation. For this purpose, various methods ranging from a simple sensitivity analysis to complex macroeconomic scenarios addressing multiple risk types are applied, with the definition focusing in particular on LBBW's risk concentrations. So-called inverse stress testing is also conducted regularly to examine which scenarios could threaten the existence of the LBBW Group.
In order to ensure risk-bearing capacity and regulatory capital ratios even in a stress case, so-called MaRisk stress scenarios are defined for the various risk types for a one-year time period. These stress scenarios are geared towards economic scenarios with different types of risk. In addition to the analysis of the economic and regulatory capital in the status quo, the Group's resistance to stress is also monitored on the basis of these scenarios. These also form the basis of the recovery plan pursuant to SAG.
LBBW Group – risk situation
To sum up, it can be stated that the risk-bearing capacity of the LBBW Group was maintained without restriction during the entire 2018 financial year. The aggregate risk cover at year-end 2018 was increased further from the end of 2017. The capital base was strengthened by issuing new subordinated liabilities and retaining earnings, thereby keeping utilization of the aggregate risk cover virtually stable year on year at 42.4% despite a slight increase in risk. Furthermore, stress test resistance was maintained throughout the entire financial year.

R
isk
report
4
9
Co
mb
ined
ma
na
gem
en
t re
po
rt
LBBW Group – Risk-bearing capacity
31/12/2018 31/12/2017
EUR million Absolute1 Utilization Absolute1 Utilization
Aggregate risk cover 16,838 42% 16,495 42%
Economic capital limit2 12,800 56% 12,800 54%
Correlated total economic capital 7,146 6,903
of which:
interrisk correlations – 481 – 446
Counterparty risk 4,086 3,326
Market price risk 1,885 1,974
Investment risk 40 35
Operational risk 790 781
Development risk 146 102
Real estate risk 123 162
Other risks3 558 970 -
1 Confidence level of 99.93 %/one-year holding period. 2 The individual risk types are capped by economic capital limits. 3 Other risks (in particular reputation, business, pension and model risks).
The economic capital commitment has increased by a total of EUR 0.2 billion since the end of 2017. The upturn in counterparty risk is largely a result of refinements in methodology and portfolio changes. The reduction in other risks results in particular from the integration of the calculation of the interest and credit spread risk from pension provisions into market price risk. In addition to its impact on other risks, this refinement of methodology also has a positive effect on market price risk. The reason for this is a hedge effect on existing interest rate positions. The upturn in commercial and residential projects caused the development risk to rise in comparison to the end of 2017.
Details on the regulatory key figures can be found in the report on results of operations, net assets and financial position, the notes and in the section on liquidity risks.
Risk management processes and reporting
Risk management and monitoring LBBW's risk management and monitoring is based on the guidelines of the risk strategy and the defined limits and approval powers.
At LBBW, transactions can only be entered into within clearly defined limits or approval powers and in accordance with the principles of the risk strategy. Within the defined framework, risk management decisions are made by the departments with portfolio responsibilities, maintaining the separation of functions; these decisions are monitored by central Group Risk Controlling. The risk controlling and risk management system set up for this purpose covers all material risks and the details specific to the risk types.
Potential concentration of risk receives particular attention. On the one hand, concentrations tend to arise as a result of the synchronization of risk positions within one risk type. On the other hand, they can also be produced as a result of common risk factors or interactions between various risk factors of different risk types. At LBBW, appropriate processes are used to identify and to deliberately manage risk concentration. Risks to the Group’s going concern status must be excluded. Differentiated monitoring processes (e.g. report on risk concentrations, stress tests) and limits (e.g. sector and country limits) are available for the purpose of monitoring this strategic requirement. Additional information on this is provided in the sections on the respective risk type.

R
isk
report
5
0
Co
mb
ined
ma
na
gem
en
t re
po
rt
An overview of the structure and individual elements of the risk management system of LBBW is given in the following chart:
Risk management structure
Committees and reporting The members of the Group’s Board of Managing Directors with responsibility for managing risks are supported in their decision-making by corporate bodies and a comprehensive risk and subject-specific reporting system. The overall risk report and the report to the Asset Liability Committee (ALCo) thus form the reporting system relevant to risk within the context of the requirements of MaRisk.
The monitoring body, the Risk Committee, comprises the heads of department with responsibility for capital markets business and asset management/international business, risk management, compliance and auditing, the head of finance/strategy and divisional managers from Group Risk Controlling, Finance Controlling, Treasury and Back Office. As an advisory committee, it prepares decisions for the Board of Managing Directors and supports it in risk monitoring, risk methodology and risk strategy for the Group as a whole. The monthly overall risk report and other reports prepared on specific issues as required form the basis for this.
Risk Committee, Asset Liability Committee, Regulatory / Accounting Committee
Investment risks Group investments
Market price risksLiquidity risks Treasury Financial Institutions & Markets Group Risk Control
Counterparty default risks/Country risks Front office departments Back office departments
– Credit and risk management– Central loan processing
Country Limit Committee Joint decision-making authority on
lending (front office/back office) Group Risk Control Credit Committee
Credit risk strategyInvestment risk,
real estate risk anddevelopment risk strategy
Market price risk,liquidity risk,
operational risk strategy
Group's Board of Managing DirectorsBusiness strategy, Group risk strategy
Annual General MeetingSupervisory Board
Committees
Real estate risks LBBW Immobilien Group BW-Immobilien GmbH
Development risks LBBW Immobilien
Management GmbH
Operational risks Group Risk Control in cooperation
with all of the Group's divisions
Other risks Business risks Reputation risks Pension risks Funding (spread) risks Model risks Dilution risks
Authority based on decision-making hierarchy for loans and trading, articles of association and internal regulations of the executive bodies and the Group’s Board of Managing Directors

R
isk
report
5
1
Co
mb
ined
ma
na
gem
en
t re
po
rt
The managing body, ALCo, also has an advisory role and works on preparing decisions for the Group's Board of Managing Directors. The focus of the ALCo is on strategic resource management for the Group as a whole. It supports the Board of Managing Directors, among other things in structuring the balance sheet, managing capital and liquidity as well as in funding and managing market price risks. The committee comprises the heads of department with responsibility for capital markets business and asset management/international business, the divisional director of finance/strategy and the divisional managers from Financial Controlling and Treasury. Group Risk Controlling and Finance also participate in the meetings.
The coordinating Regulatory/Accounting Committee evaluates at an early stage the requirements of the large number of provisions of banking supervisory law and accounting that are relevant for management purposes and takes the measures required. The committee comprises, among other areas, the board members with responsibility for capital markets business and asset management/international business, risk management/compliance and auditing, in addition to divisional managers from the Legal division, Information Technology, Finance, Group Risk Controlling, Financial Controlling and Treasury.
Processes of adjustment New types of trading and credit product at LBBW are subject to a New Product Process that ensures the product is included in LBBW's various systems, such as accounting or Group Risk Controlling. Any potential legal consequences are also outlined.
The main focus is on trading products. If it is not possible to fully integrate the products into the model immediately, a step-by-step approach is taken in which the products are initially traded only under very strict supervision.
In the case of material changes in the set-up and procedural organization and in the IT systems, LBBW analyzes the potential effects on control procedures and control intensity within the framework of a pre-defined standard process.
Process-independent monitoring The Group Auditing division is a process-independent division that monitors the operations and business work flows, risk management and controlling and the internal control system (ICS) with the aim of safeguarding LBBW’s assets and boosting its operating performance. The Group Auditing division exercises its duties autonomously. The Board of Managing Directors is informed of the results of audits in written audit reports, which are discussed with the audited operating units. The Group Auditing division also monitors the measures taken in response to the audit findings.
The auditing activities of the Group Auditing division are generally based on an audit schedule, approved annually by the Board of Managing Directors, on the basis of a long-term risk-oriented plan, which records all the activities and processes of the LBBW Group, allowing for risk weighting in a reasonable period, but always within three years.
Regulatory developments
Takeover of supervision by the European Central Bank (ECB) On 4 November 2014, the ECB assumed the supervision of LBBW within the framework of the Single Supervisory Mechanism (SSM). In this connection LBBW is assigned to Directorate General I within the ECB's bank supervision. One of the core tasks of the ECB is to carry out an independent assessment and review of banks’ capital and liquidity resources. The central tool used here is the Supervisory Review and Evaluation Process (SREP). In addition to workshops, audits, data queries and requests for information on various focus areas, stress tests are also an important supervisory tool. An EBA/ECB stress test was carried out in 2018, as well as the annual Transparency Exercise, published on the EBA and LBBW homepage.

R
isk
report
5
2
Co
mb
ined
ma
na
gem
en
t re
po
rt
On 30 October 2018, the ECB also stated its supervisory priorities in 2019 for all banks. The key issues include monitoring non-performing loans, which are still high at some European banks, the quality of lending guidelines and exposures of certain asset classes, finalizing the TRIM review, focusing on IT and cyber risks and supervising Brexit and trade risks with regard to the fundamental review of the trading book (FRTB). The ECB stress test that has been announced for 2019 will assess banks’ resilience to liquidity shocks.
Development of CRD/CRR The CRD and CRR form the European framework for banks and financial services institutions. These must meet strict requirements concerning solvency, liquidity and special reporting obligations. CRD IV includes provisions on the authorization and supervision of banks and financial services institutions, fundamental rules on the banks' equity base, penalties in the event of breaches and rules on the institutions' corporate bodies and their supervision. The CRR governs the guidelines for the level of regulatory capital to be held, as well as for large exposures and liquidity requirements.
This regulatory framework has implications for business strategy, the strategic direction of the business units, management metrics and technical reporting capacity. The interdependencies between the regulatory framework and business strategy are analyzed constantly on an integrated basis and taken account of accordingly.
After almost two years of consulting and negotiating, an agreement to finalize the revised EU banking regulation CRR II /CRD V has been reached and so it is very likely that this will be enacted in the first quarter of 2019. The revision aims to remove inconsistencies as well as implement international regulatory requirements. This includes guidelines for indebtedness, liquidity and liabilities. Furthermore, new trading book guidelines (»FRTB« – Fundamental review of the trading book), provisions for counterparty risk of derivatives (»SA-CCR – standardized approach for measuring counterparty credit risk exposures«) as well as interest rate risks in the banking book will be introduced.These can be described informally as forming part of the »Basel IV« reform package. The new provisions are expected to come into force for the key areas in 2021. The divisions and control units responsible at the Bank will prepare for project implementation once the final legal texts are available.
Basel IV In December 2017, the Basel Committee on Banking Supervision (BCBS) passed the last package of reforms (for now) to complete the Basel III framework as reaction to the financial crisis (»Basel IV«). This introduces a new output floor of 72.5%, which will limit the internal models in the regulatory capital requirements or link them to the results of the standard approaches set out by supervisory authorities. At the same time, the standards for calculating risk weighted assets were revised and are now far more sensitive to risk. These will include new provisions for the approach to credit risk, the own funds requirements for CVA and operational risks. The new rules, which will, in the final analysis, impact on the denominator of the solvency and equity ratios, are expected to be phased in internationally over a five-year period from 2022 on. The standards still need to be transposed into European law prior to this.
LBBW participates regularly in the Basel impact studies, in order to quantify the RWAs and take them into account in the capital planning. Additionally, further steps will regularly be initiated to anticipate the impact and develop potential, strategic options for action.

R
isk
report
5
3
Co
mb
ined
ma
na
gem
en
t re
po
rt
Outlook With effect from 1 January 2019, the ECB has released guidance relating to banks’ internal processes for ensuring adequate capital and liquidity. This aims to make banks more resilient during periods of stress and ensure solvency even under adverse conditions. Solid internal processes regarding adequate capital and liquidity are based on two complementary pillars – a regulatory and an economic perspective. Regulatory authorities review and assess the quality of these internal bank processes each year and the results are included in the bank-specific provisions regarding capital and liquidity requirements.
The LBBW Group has mechanisms in place to identify changing regulatory provisions and to take suitable measures as required and has therefore already taken preparatory measures in anticipation of modified requirements regarding the structure of internal bank processes for ensuring adequate capital and liquidity. Additional changes will be made to methodology in 2019. These will increase utilization of the aggregate risk cover while maintaining comfortable capitalization.

R
isk
report
5
4
Co
mb
ined
ma
na
gem
en
t re
po
rt
Risk types1
Counterparty risk
Definition
The umbrella term counterparty risk describes the loss potential resulting from the fact that business partners may in future no longer be in a position to fulfill their contractually agreed payment obligations. A counterparty risk may occur both from direct contractual relationships (e.g. granting loans, buying a security) and indirectly, e.g. from hedging obligations (especially issuing guarantees, selling hedging via a credit derivative).
The main characteristics of this risk are defined and briefly explained below.
Credit risk Here the term credit risk, often used synonymously with counterparty risk, describes the counterparty risk from the lending operation, i.e. from granting loans and hedging lending by third parties (e.g. via guarantees).
Issuer risk The term issuer risk covers the counterparty risk resulting from securities. It covers both the direct securities portfolio and securities referenced via derivatives (especially via credit derivatives).
Counterparty credit risk Counterparty credit risk describes the counterparty risk from financial transactions (especially derivatives transactions), resulting from the fact that the contracting party (counterparty) is no longer in a position to meet their obligations. In this situation, on the one hand, the position that becomes open upon closing may entail costs (so-called replacement risk), while on the other there is a risk that advance payments have been made to the counterparty without the counterparty being able to provide the corresponding counter-performance (so-called advance payment, performance and/or settlement risk).
Country risk The term country risk designates the counterparty risk that arises because, due to critical political or economic developments in a country (or entire region), the transfer of foreign exchange is not possible or only possible to a limited extent.
Collateral risk Collateral risk is not direct counterparty risk, but describes the potential that collateral received to reduce the counterparty risk loses value, especially if this happens systematically (e.g. due to turmoil on real estate markets).
Counterparty risk management
Management for limiting the counterparty risk is implemented as an integrated process at LBBW, and can be broken down into the three main components of risk measurement, risk monitoring and reporting as well as risk management:
1 Information on correlated total economic capital for the individual risk types can be found in the section on the risk management systems/risk situation of the LBBW Group.

R
isk
report
5
5
Co
mb
ined
ma
na
gem
en
t re
po
rt
Components of counterparty risk management
Risk measurement
In order to measure risk, LBBW uses an extensive range of instruments involving quantitative measuring procedures. These are subject to ongoing quality control and undergo permanent development.
Risk classification procedures LBBW uses specific rating and risk classification procedures for all relevant business activities. These procedures quantify the probability of default (PD) of the individual investments. For this purpose, the counterparty risk is calculated both including and excluding the transfer risk.
The quality of the risk classification procedures in use is reviewed regularly and the procedures are refined if necessary. These procedures are maintained and updated by LBBW on its own initiative or in cooperation with Rating Service Unit GmbH & Co. KG (an associated company of the Landesbanken) or Sparkassen Rating und Risikosysteme GmbH (a subsidiary of Deutscher Sparkassen- und Giroverband – DSGV).
Most of the portfolio is measured using internal rating procedures that have been approved for the Internal Ratings Based Approach (IRBA) by the banking regulator. The rating grades are not only used for internal management purposes but also to measure the regulatory capital requirements.
Risk monitoringand reporting
Individual transaction level− Counterparty credit limits− Early warning indicators− Intensive care of delinquent loans− Supervision of loans for restructuring and winding up by dedicated units of the Risk
Management division Portfolio level
− Economic capital and economic capital limit− Country and sector limits− Regular reports− Ad-hoc information on risk situation
Risk management
Individual transaction level− Guidelines of the credit risk strategy− Pricing in line with risk and equity
Sub-portfolio level− Measures to observe various portfolio limits− Targets for credit risk strategy
Total portfolio level− Allocation of economic capital to the sectors
Risk measurement
Risk classification procedures (PD) Evaluating collateral (LGD) Exposure at default (EaD) Expected Losses (EL), Value adjustment and Credit Value Adjustment (CVA) Credit Value-at-Risk (CVaR) Risk concentrations Stress tests

R
isk
report
5
6
Co
mb
ined
ma
na
gem
en
t re
po
rt
Evaluating collateral Collateral is evaluated on the basis of its market value, which is reviewed regularly and on an ad hoc basis and adjusted in the event of any change in the relevant factors. Loss given default (LGD) is estimated on the basis of the valuation of the individual items of collateral. In this respect, differentiated estimates are calculated for liquidation rates (average proceeds expected from the liquidation of collateral) and for recovery rates (proportion of the proceeds from the unsecured portion of a receivable). The estimates are based on empirical values and pool data recorded by the Bank itself and in cooperation with savings banks and other Landesbanken.
Exposure at default Whereas exposure is tied to a specific date (exposure at default, EaD) for reporting purposes, and potential future exposure is calculated to determine the CVaR and the utilization of internal limits, e.g. with derivatives. This is calculated for the most part on the basis of fair values and the corresponding add-ons. The add-on calculation takes account of the remaining maturity, product type and market factors (interest, currency etc.). Netting and collateral agreements are used for reducing risk. The capital charges for issuer risks held in the trading book take account of the settlement payments and actual fair value losses as a result of default (jump-to-default method). The (modified) nominals are used for issuer and reference debtor risks from securities and holdings in the banking book.
Expected losses, value adjustments and credit value adjustment The expected loss (EL) – as an indicator that depends on customer creditworthiness, an estimation of the loss at default and the expected exposure at default – provides the basis for the level of the standard risk costs. In preliminary costing at the individual transaction level, these are included in the calculation of risk-adequate loan terms. In addition, the concept of expected loss is key to calculating impairment. For more details, see the information on the impairment model in accordance with IFRS 9 under Note 2 (»Changes and estimates«). In the case of individual impairment calculation, the present values of the expected cash flows (including proceeds from the liquidation of collateral) are calculated and allowances for losses on loans and advances are made on the basis of uniform standards applied throughout the Group.
The market price of the counterparty risk of OTC derivatives accounted for at fair value is measured using the so-called credit value adjustment (CVA). This is included in the income statement of LBBW as a valuation adjustment. The credit ratings of the counterparty and of LBBW are taken into consideration.
Credit value-at-risk At LBBW, unexpected loss or credit value-at-risk (CVaR) represents the potential present value loss of a portfolio above its expected loss. A credit portfolio model that takes the defaults as well as rating migration into account is used to calculate this value. The borrowers are assigned corresponding default and migration probabilities, on the basis of their ratings. The CVaR is calculated using a Monte Carlo simulation approach and takes into consideration correlations between borrowers as well as borrower, sector and country concentrations.
CVaR is used as the parameter for economic capital used for counterparty risks in the risk-bearing capacity analysis and in LBBW’s management. CVaR and economic capital are defined using the same high confidence level and time horizon of one year.
Risk concentrations Risk concentration is measured using the CVaR, among other methods, and is limited using the LBBW Group’s free Tier 1 capital. Group Risk Controlling proposes concentration risk thresholds and the concentration limit for individual borrowers as well as at sector level; these are set by the Board of Managing Directors. The thresholds and limits are reviewed regularly and adjusted if necessary, depending on the development of the loan portfolio and the risk-bearing capacity.

R
isk
report
5
7
Co
mb
ined
ma
na
gem
en
t re
po
rt
Stress tests LBBW uses stress tests to evaluate the impact of adverse economic and political developments on key performance indicators in the lending portfolio (e.g. CVaR, impairment). The potential effects of crises are converted into negative changes to the key lending risk parameters (PD, LGD and correlations) of the transactions in the portfolio in question. A distinction is drawn between two types of stress tests:
∙ Basis stress tests are defined by the Board of Managing Directors as part of risk tolerance and include events such as an economic crisis, a national crisis and a financial market crisis. They are conducted on a quarterly basis and serve to ensure stress resistance and meet regulatory requirements.
∙ Potential effects of current developments (e.g. Brexit) are quantified through ad-hoc stress tests. These create tailor-made scenarios that reflect LBBW’s estimates regarding alternative future developments.
Risk monitoring and reporting
Individual transaction level Risk management at the level of individual exposures is the duty of the back office divisions. These are organized independently from the front office divisions, in line with the regulatory requirements. Clear responsibilities and appropriate experience and expertise are ensured in the back office divisions by a customer or sector-specific organizational structure. Credit decisions are made in a system of graded competencies, which are regulated in the Bank's decision-making systems.
As part of risk monitoring, the risk managers responsible continuously check compliance on the basis of systems with the limits granted as well as any changes in information of relevance for credit ratings. This includes monitoring any irregularities in account behavior, evaluating company news and observing macroeconomic and sector trends. In cases in which market data can be observed for a given company, a market data-based system is additionally used according to requirements.
A system is in place for the early detection of risks, comprising procedural regulations and system-generated signals, whose goal it is to detect any deterioration in credit ratings at an early stage.
The early detection of any deterioration in credit ratings allows appropriate countermeasures, e.g. additional collateral or pre-emptive restructuring, to be taken in consultation with the customer. Depending on the level of risk, problem assets are classified as cases requiring intensified support, restructuring or liquidation and are dealt with by the departments responsible. LBBW aims to minimize losses through successful restructuring activities, in line with the Bank’s own interests and those of its customers.
Portfolio level Counterparty risk is monitored at the portfolio level in the Group Risk Controlling division, which, from an organizational point of view, is separate from the front and operational back office divisions. The utilization of the economic capital limit and the exposure and CVaR limits set for sector risks is documented each month in the overall risk report. Compliance with country limits is monitored on a daily basis using the Bank’s global limit system. If the country limit is almost fully utilized, the affected front and risk management units are notified. High limit utilizations are shown at an early stage using a traffic light system.
An ad hoc reporting process is implemented for limit overdraft and extraordinary events for specific reporting to the decision-makers in charge.
R
isk
report
5
8
Co
mb
ined
ma
na
gem
en
t re
po
rt
The most important periodic reports are as follows:
∙ The overall risk report presented monthly in the Risk Committee, which includes details about the risk situation at the portfolio level and compliance with the material limits. Portfolio analyses additionally report on the risk situation of individual sectors and risk concentrations, for example.
∙ The comprehensive credit risk report, submitted on a quarterly basis as an appendix to the overall risk report. This contains additional detailed information of the impairment, compliance with the parameters of the credit risk strategy, rating distributions, size classes, product types, remaining maturities, new business, and risk concentration arising from individual commitments.
∙ The half-yearly in-depth sector report with detailed information on the sector situation, portfolio structure and important customers in each sector.
Risk management
Counterparty risks are managed, in particular, through the requirements of the credit risk strategy, through the economic capital allocation to sub-portfolios with the aid of the CVaR, and by avoiding and reducing concentration risks at the level of sectors, countries and individual counterparties.
Individual transaction level As a rule, the upper limits on the individual transaction level taking the concentration limit into account are set individually by the respective authorized person responsible for the front office or back office divisions. This upper limit is taken into account for all risk-relevant transactions by a customer or borrower unit or group of connected clients. A material part of managing individual transactions involves monitoring compliance with the quantitative and qualitative requirements defined in the credit risk strategy. This determines the underlying terms and conditions for LBBW's lending business on the basis of the business strategy and in the light of the Group risk strategy. Particular attention is paid to avoiding concentration risks.
From an economic point of view, the question of whether a transaction will produce an adequate profit on a risk-adjusted basis is a key consideration before entering into business; for this reason, preliminary costing of all individual transactions is compulsory. In addition to the historical interest rate and the bank levy, the components in the preliminary costing comprise cover for expected loss (risk margin), interest on equity to be held in case of unexpected losses (capital margin) and cover for liquidity and processing costs. The results form the basis of business management at customer level.
Sub-portfolio level The risk management measures differ depending on the respective sub-portfolio level:
∙ Country limits are determined by the Board of Managing Directors, based on the proposals of the Country Limit Committee. In the case of a limit overdraft a ban on business is imposed. If the country credit rating deteriorates, limits are reduced and/or suspended. Wind-down targets also exist for countries that are the focus of particular attention.
∙ Sector limits are determined by the Board of Managing Directors (financials portfolio as a whole, corporates portfolio differentiated). They are set on a sector-specific basis below absolute concentration limits. The limit system is based on a risk-oriented sector key designed specifically for this purpose, which combines sector segments that have high economic dependencies along the value chains. The limitation on the financials portfolio and corporates sectors triggers controlling measures such as hedging transactions to reduce risk or a ban on new business etc. if certain thresholds are exceeded.
∙ At the business area or sub-business area level, risks are limited through measures to ensure adherence to the portfolio guidelines of the credit risk strategy with regard to upper limits, rating structures and the portfolio quality, among others.
R
isk
report
5
9
Co
mb
ined
ma
na
gem
en
t re
po
rt
Total portfolio level In the management of the Group's credit portfolio, the limit in particular for the economic capital for counterparty risks based on the CVaR is allocated to the sectors. As well as risk parameters (in particular avoiding concentration risks), appropriate consideration is also given to LBBW’s strategic targets for developing the lending portfolio when allocating economic capital and the resulting limits at sector level. Suitable measures are taken in the event of high limit utilization. In addition, the results of the stress tests provide indications of potentially dangerous risk constellations, which may require measures to be taken.
Risk situation of the LBBW Group
Preliminary note The quantitative information on the risk situation is based on the management approach. LBBW's risk situation is therefore reported on the basis of the figures used for the purpose of conducting internal risk management and reporting to the Board of Managing Directors and the corporate bodies. The management approach differs partially from balance sheet reporting. This can be put down to the presentation from risk aspects and deviations from the companies included for accounting purposes. In internal risk management the SüdLeasing Group is included as consolidated subsidiary.
The differences between the figures used for internal risk management on the one hand and external accounting on the other can be quantified as follows:
Reconciliation of accounting approach to management approach
Reconciliation
EUR million 31/12/2018
Balance sheet recognition
Basis of consolidation Measurement Other
Management approach
Financial assets measured at fair value
Trading assets 26,459 757 29,953 – 3 57,167
Financial instruments measured at fair value through
profit or loss, not classified as held for trading, and equity instruments 1,375 167 – 188 0 1,354
Positive fair values from hedging derivatives 1,969 0 3,232 0 5,201
Financial assets designated at fair value 2,370 – 1,163 – 196 0 1,011
Financial assets measured at fair value through other comprehensive income 22,821 1,390 – 965 0 23,246
Financial assets measured at amortized cost
Cash and cash equivalents 24,721 – 9 – 23,547 0 1,165
Receivables 156,836 – 5,046 18,891 – 1,207 169,473
Debentures and other non-current assets and
disposal groups 1,155 – 7 – 107 0 1,041
The primary parameter in the following comments is gross/net exposure. In this context, gross exposure is defined as the fair value or utilization plus outstanding external loan commitments. Net exposure also takes risk-mitigating effects into account. These include netting and collateral agreements, the hedging effect of credit derivatives or the inclusion of classic credit collateral such as real estate liens, financial collateral, guarantees or bonds.
Exposure to counterparty risks in 2018 was always in accordance with the risk-bearing capacity of the LBBW Group.
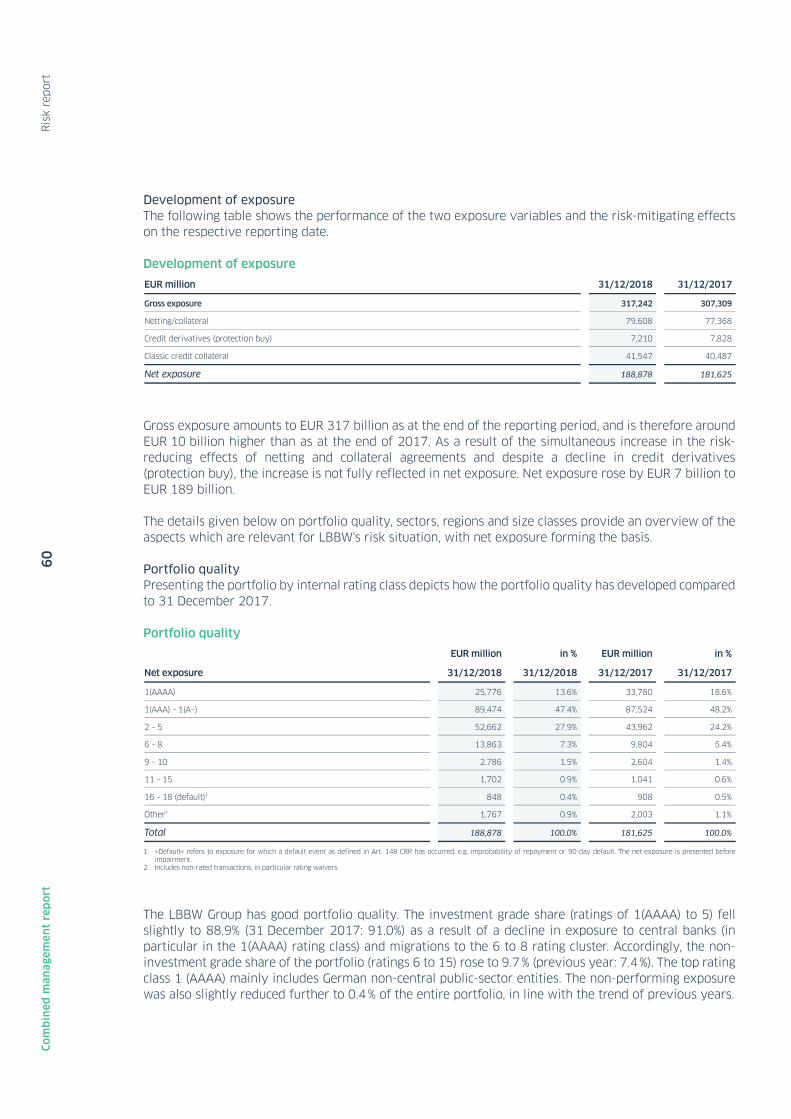
R
isk
report
6
0
Co
mb
ined
ma
na
gem
en
t re
po
rt
Development of exposure The following table shows the performance of the two exposure variables and the risk-mitigating effects on the respective reporting date.
Development of exposure
EUR million 31/12/2018 31/12/2017
Gross exposure 317,242 307,309
Netting/collateral 79,608 77,368
Credit derivatives (protection buy) 7,210 7,828
Classic credit collateral 41,547 40,487
Net exposure 188,878 181,625
Gross exposure amounts to EUR 317 billion as at the end of the reporting period, and is therefore around EUR 10 billion higher than as at the end of 2017. As a result of the simultaneous increase in the risk-reducing effects of netting and collateral agreements and despite a decline in credit derivatives (protection buy), the increase is not fully reflected in net exposure. Net exposure rose by EUR 7 billion to EUR 189 billion.
The details given below on portfolio quality, sectors, regions and size classes provide an overview of the aspects which are relevant for LBBW's risk situation, with net exposure forming the basis.
Portfolio quality Presenting the portfolio by internal rating class depicts how the portfolio quality has developed compared to 31 December 2017.
Portfolio quality
EUR million in % EUR million in %
Net exposure 31/12/2018 31/12/2018 31/12/2017 31/12/2017
1(AAAA) 25,776 13.6% 33,780 18.6%
1(AAA) – 1(A–) 89,474 47.4% 87,524 48.2%
2 – 5 52,662 27.9% 43,962 24.2%
6 – 8 13,863 7.3% 9,804 5.4%
9 – 10 2,786 1.5% 2,604 1.4%
11 – 15 1,702 0.9% 1,041 0.6%
16 – 18 (default)1 848 0.4% 908 0.5%
Other2 1,767 0.9% 2,003 1.1%
Total 188,878 100.0% 181,625 100.0%
1 »Default« refers to exposure for which a default event as defined in Art. 148 CRR has occurred, e.g. improbability of repayment or 90-day default. The net exposure is presented before impairment.
2 Includes non-rated transactions, in particular rating waivers.
The LBBW Group has good portfolio quality. The investment grade share (ratings of 1(AAAA) to 5) fell slightly to 88.9% (31 December 2017: 91.0%) as a result of a decline in exposure to central banks (in particular in the 1(AAAA) rating class) and migrations to the 6 to 8 rating cluster. Accordingly, the non-investment grade share of the portfolio (ratings 6 to 15) rose to 9.7 % (previous year: 7.4 %). The top rating class 1 (AAAA) mainly includes German non-central public-sector entities. The non-performing exposure was also slightly reduced further to 0.4 % of the entire portfolio, in line with the trend of previous years.
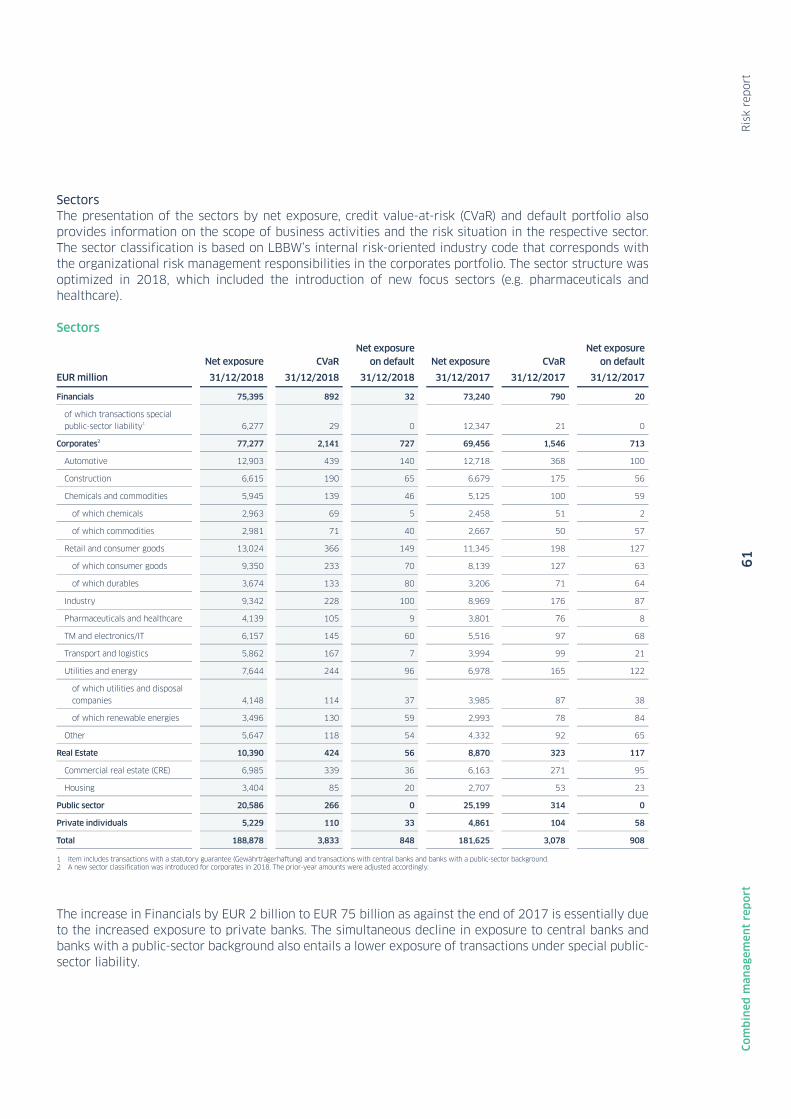
R
isk
report
6
1
Co
mb
ined
ma
na
gem
en
t re
po
rt
Sectors The presentation of the sectors by net exposure, credit value-at-risk (CVaR) and default portfolio also provides information on the scope of business activities and the risk situation in the respective sector. The sector classification is based on LBBW’s internal risk-oriented industry code that corresponds with the organizational risk management responsibilities in the corporates portfolio. The sector structure was optimized in 2018, which included the introduction of new focus sectors (e.g. pharmaceuticals and healthcare).
Sectors
EUR million
Net exposure
31/12/2018
CVaR
31/12/2018
Net exposure on default
31/12/2018
Net exposure
31/12/2017
CVaR
31/12/2017
Net exposure on default
31/12/2017
Financials 75,395 892 32 73,240 790 20
of which transactions special public-sector liability1 6,277 29 0 12,347 21 0
Corporates2 77,277 2,141 727 69,456 1,546 713
Automotive 12,903 439 140 12,718 368 100
Construction 6,615 190 65 6,679 175 56
Chemicals and commodities 5,945 139 46 5,125 100 59
of which chemicals 2,963 69 5 2,458 51 2
of which commodities 2,981 71 40 2,667 50 57
Retail and consumer goods 13,024 366 149 11,345 198 127
of which consumer goods 9,350 233 70 8,139 127 63
of which durables 3,674 133 80 3,206 71 64
Industry 9,342 228 100 8,969 176 87
Pharmaceuticals and healthcare 4,139 105 9 3,801 76 8
TM and electronics/IT 6,157 145 60 5,516 97 68
Transport and logistics 5,862 167 7 3,994 99 21
Utilities and energy 7,644 244 96 6,978 165 122
of which utilities and disposal
companies 4,148 114 37 3,985 87 38
of which renewable energies 3,496 130 59 2,993 78 84
Other 5,647 118 54 4,332 92 65
Real Estate 10,390 424 56 8,870 323 117
Commercial real estate (CRE) 6,985 339 36 6,163 271 95
Housing 3,404 85 20 2,707 53 23
Public sector 20,586 266 0 25,199 314 0
Private individuals 5,229 110 33 4,861 104 58
Total 188,878 3,833 848 181,625 3,078 908
1 Item includes transactions with a statutory guarantee (Gewährträgerhaftung) and transactions with central banks and banks with a public-sector background. 2 A new sector classification was introduced for corporates in 2018. The prior-year amounts were adjusted accordingly.
The increase in Financials by EUR 2 billion to EUR 75 billion as against the end of 2017 is essentially due to the increased exposure to private banks. The simultaneous decline in exposure to central banks and banks with a public-sector background also entails a lower exposure of transactions under special public-sector liability.
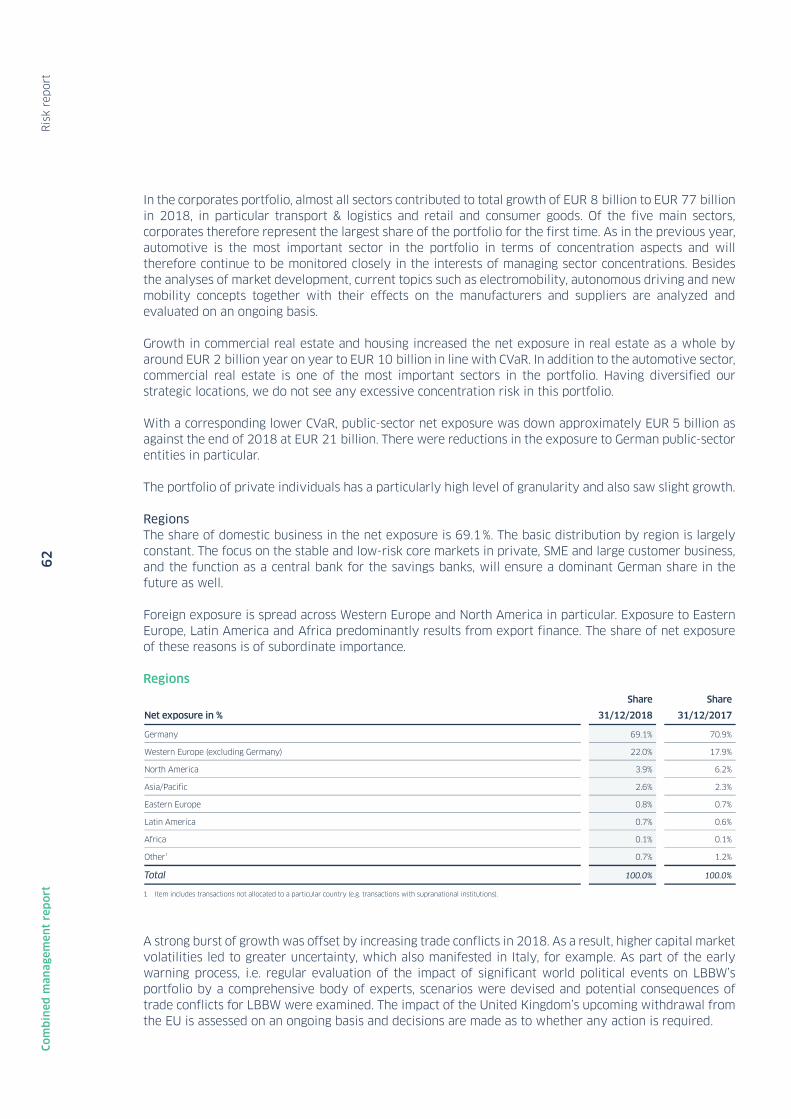
R
isk
report
6
2
Co
mb
ined
ma
na
gem
en
t re
po
rt
In the corporates portfolio, almost all sectors contributed to total growth of EUR 8 billion to EUR 77 billion in 2018, in particular transport & logistics and retail and consumer goods. Of the five main sectors, corporates therefore represent the largest share of the portfolio for the first time. As in the previous year, automotive is the most important sector in the portfolio in terms of concentration aspects and will therefore continue to be monitored closely in the interests of managing sector concentrations. Besides the analyses of market development, current topics such as electromobility, autonomous driving and new mobility concepts together with their effects on the manufacturers and suppliers are analyzed and evaluated on an ongoing basis.
Growth in commercial real estate and housing increased the net exposure in real estate as a whole by around EUR 2 billion year on year to EUR 10 billion in line with CVaR. In addition to the automotive sector, commercial real estate is one of the most important sectors in the portfolio. Having diversified our strategic locations, we do not see any excessive concentration risk in this portfolio.
With a corresponding lower CVaR, public-sector net exposure was down approximately EUR 5 billion as against the end of 2018 at EUR 21 billion. There were reductions in the exposure to German public-sector entities in particular.
The portfolio of private individuals has a particularly high level of granularity and also saw slight growth.
Regions The share of domestic business in the net exposure is 69.1 %. The basic distribution by region is largely constant. The focus on the stable and low-risk core markets in private, SME and large customer business, and the function as a central bank for the savings banks, will ensure a dominant German share in the future as well.
Foreign exposure is spread across Western Europe and North America in particular. Exposure to Eastern Europe, Latin America and Africa predominantly results from export finance. The share of net exposure of these reasons is of subordinate importance.
Regions
Net exposure in %
Share
31/12/2018
Share
31/12/2017
Germany 69.1% 70.9%
Western Europe (excluding Germany) 22.0% 17.9%
North America 3.9% 6.2%
Asia/Pacific 2.6% 2.3%
Eastern Europe 0.8% 0.7%
Latin America 0.7% 0.6%
Africa 0.1% 0.1%
Other1 0.7% 1.2%
Total 100.0% 100.0%
1 Item includes transactions not allocated to a particular country (e.g. transactions with supranational institutions).
A strong burst of growth was offset by increasing trade conflicts in 2018. As a result, higher capital market volatilities led to greater uncertainty, which also manifested in Italy, for example. As part of the early warning process, i.e. regular evaluation of the impact of significant world political events on LBBW’s portfolio by a comprehensive body of experts, scenarios were devised and potential consequences of trade conflicts for LBBW were examined. The impact of the United Kingdom’s upcoming withdrawal from the EU is assessed on an ongoing basis and decisions are made as to whether any action is required.

R
isk
report
6
3
Co
mb
ined
ma
na
gem
en
t re
po
rt
Size classes The following breakdown by size class is based on the customer level or, if part of the Group, the borrower unit level.
Size classes
Number Net exposure
in % Number Net exposure
in %
Net exposure 31/12/2018 31/12/2018 31/12/2017 31/12/2017
Up to EUR 10 million 708,635 11.4% 730,149 11.6%
Up to EUR 50 million 1,169 13.8% 1,144 13.7%
Up to EUR 100 million 272 10.1% 245 9.5%
Up to EUR 500 million 308 35.0% 291 34.8%
Up to EUR 1 billion 44 16.1% 40 15.3%
Over EUR 1 billion 14 11.2% 13 12.6%
LBBW Group1 53 2.4% 54 2.4%
Total 710,495 100.0% 731,936 100.0%
1 Item included for the first time. The prior-year amounts were adjusted accordingly.
The size classes up to a net exposure of EUR 100 million continue to account for 35 % of the net exposure. The large number of customers is due in particular to the retail portfolio.
With shares of 96 % and 99 % respectively, very good to good credit ratings (1 (AAAA) to 5) dominate the two net exposure size classes EUR 100 million to EUR 500 million and EUR 500 million to EUR 1 billion.
The number of exposures with a net exposure in excess of EUR 1 billion rose from 13 in the previous year to 14 overall, with an 11% share of the portfolio (previous year: 13%). Corporates dominate this size class as at the reporting date 31 December 2018 with a share of 42%, while financials account for a further 30% and the public sector (German non-central public sector entities) for 28%. These are exposures with exclusively very good to good ratings (minimum rating class 1 (A-) and one with the rating class 2). The large exposures will continue to be monitored closely in the interests of managing cluster risks.

R
isk
report
6
4
Co
mb
ined
ma
na
gem
en
t re
po
rt
Market price risks
Definition
LBBW defines market price risks as potential losses resulting from unfavorable changes in market prices or factors influencing prices. Market price risks are broken down into the categories equities, interest rates and currency/commodities.
The following characteristics of market price risks arise as a result of the nature of LBBW's business activities.
Equity risk The equity risk results from changes in share and/or index prices as well as from share or index volatilities.
Interest rate risk The interest rate risk is based on changes in market interest rates, interest spreads, credit spreads or interest rate volatilities. This also includes interest rate risks in the banking book (IRRBB) and the risk from pension obligations.
FX/commodity risk FX/commodity risks are summarized and reported under the FX risk type in the LBBW Group. The FX risk relates to the development of exchange rates. The commodity risk relates to changes in the price of precious metals and commodities.
Market price risk management
Risk measurement
Risk model In the financial sector, the market risk of the trading and banking book is represented by value-at-risk forecasts. The value-at-risk (VaR) can be determined as part of a stochastic-mathematical model. This model derives a distribution of portfolio values from a distribution of market factors, the valuation based on and, if necessary, corresponding simplifications. The VaR is determined from this as the maximum potential loss at a given confidence level.
LBBW is using an in-house developedmodel based on a classic Monte Carlo simulation. In this simulation, market-induced movements in the value of complex transactions are partially approximated. In addition,
Risk monitoringand reporting
Monitoring and observance of the limits by persons who are responsible for the portfolios in Group Risk Control
Daily, weekly and monthly reporting
Risk management
Specifications on the basis of market price risk strategy and portfolio descriptions VaR limit down to portfolio level Loss limit per portfolio via a loss-warning trigger Limiting of sensitivities
Risk measurement
Internal risk model approved by the regulatory authority Daily Value-at-Risk measurement Stress tests, calculation of Stressed-VaR, Backtesting Analysis Sensitivities Monitoring of risk concentration

R
isk
report
6
5
Co
mb
ined
ma
na
gem
en
t re
po
rt
historical time series for the last 250 days are weighted equally in the estimation of the covariance matrix. Backtesting analyses are used to ensure the quality of the applied VaR estimation procedures.
The risk model is used for general interest rate and equity risks to determine the regulatory capital requirements for market risks of the trading book.1 (CRR portfolio). The overall risk is included in the calculation of the economic capital.
In order to map this within the framework of risk-bearing capacity, the maximum of standard VaR (covariance matrix over 250 trading days) and long-term VaR are scaled to an adjusted level to meet the requirements of economic capital in terms of confidence level and holding period. The Long-term VaR is based on two observation periods of five years each, which also include crisis periods and more volatile market phases. This enhances the resilience of the calculated economic capital against crises. The following specific VaR parameters are used at LBBW:
∙ Internal management: confidence of 95% and one-day holding period ∙ Backtesting analyses: confidence level of 99% and one-day holding period ∙ Supervisory/regulatory purposes: confidence level of 99% and ten-day holding period ∙ Strategic management/economic capital/risk-bearing capacity: confidence level of 99.93% and
250-day holding period
Trading portfolios and the interest rate position of the banking book can be affected by potentially detrimental developments in market interest rates.
LBBW identifies credit spread risk as a significant part of the market price risk. The transactions of the trading book and the banking book that are sensitive to creditworthiness are mapped in a risk-oriented manner onto rating- and sector-dependent yield curves. In this way, general credit spread risks from bonds and Schuldscheine are also measured. In addition, the issuer-specific risk for securities is calculated using the spread of individual counterparties. Reference borrowers are allocated to CDS sector curves for credit spread risks from credit derivatives.
The calculations of VaR and sensitivities are completed with separate stress scenarios for the trading and the banking book on a weekly basis. Stress testing is used to examine how the value of the portfolio changes under extreme market conditions. LBBW uses both self-defined e.g. synthetic as well as historical market movements with a focus on altering specific movement of market price data i.e. curve trend or spread changes. Synthetic scenarios are based mostly on selected market factor groups, such as individual and combined interest rate or credit spread shifts. Historical scenarios were generated from the data analyses of market shocks. All scenarios serve the purpose of modeling extreme events on the financial markets that are not specifically included in VaR as a history-based indicator. The results are reported to the decision-makers and taken into account both on a portfolio basis and with regard to their impact on the Group as a whole. The interest rate shock in accordance with EBA GL 2018/02 is reported for the banking book on a monthly basis. These changes in value from the stress simulation are also integrated in the stress scenarios for multiple risk types and are therefore relevant for risk-bearing capacity.
In order to calculate the StressVaR, instead of the last 250 trading days, a period of observation is assumed that covers a significant stress period. The StressVaR is calculated on a weekly basis using the relevant observation period for the trading book portfolio required for the regulatory report. A second calculation simulates the increase in risk under stress during the relevant period for the Group. This figure is also integrated in the MaRisk stress scenarios for multiple risk types and is therefore relevant for the stress resistance. The relevant observation period is determined on a quarterly basis for the portfolio of relevance for CRR as well as for the Group.
1 Trading book excluding funds that cannot be represented transparently.

R
isk
report
6
6
Co
mb
ined
ma
na
gem
en
t re
po
rt
Risk concentration is monitored on a monthly basis using sensitivity analyses and VaR observations. Concentration risk is categorized to the type of risk (e.g. swap or credit spread risk), issuer groups (e.g. sovereigns, financials), individual issuers and interest rate or currency risk.
New products and further development of the risk model. In 2018, the product representation was refined in the model and changes in market conditions were also taken into account when modeling risk factors. These include improvements to the stress test with regards to basis risks for various market yield curves, improvements to the process of selecting risk factors and the implementation of transparent fund informations.
Validation of the risk model LBBW's market risk model is subject to an extensive validation program, in which the potential model risks are identified in the stochastics of the market factors (including distribution model, risk factor selection and mapping), in the implemented valuation procedures and in the relevant market data, and are measured in terms of their materiality using tailor-made validation analyses. The validation analyses are conducted within the Risk Controlling division by the model risk and validation group, which is organizationally independent from the model development. The validation analyses are guided by the materiality of the model risks and performed at regular intervals (at least once a year) and on an ad hoc basis in the event of material structural changes occurring in the model design, on the market or in the portfolio composition.
Particular importance is attached to the backtesting analysis within the validation program. This statistical backward comparison of the actual changes of the portfolios not only focuses on the VaR forecast using a binomial test, but is also based on the entire distribution forecast. According to regulatory requirements, it is based on the one hand on changes in portfolio value excluding new and intraday trades, net interest income and commissions and fees (so-called Clean P/L) and on the other on changes in portfolio value excluding commissions and fees (so-called Dirty P/L), which are derived directly from the economic P/L.
If the backtesting or validation analyses indicate material model risks, they are made transparent to all parties integrated in the market risk management process (model developers, model users (operational market risk controlling) and recipients of the model results (Risk Committee, Trading)) so that necessary model optimization measures can be initiated efficiently. Model optimization measures are carried out according to the model change policy and communicated to the regulatory authorities.
Risk monitoring and reporting
The utilization of limits and compliance with the detailed risk strategy defined in the portfolio descriptions, are monitored by the relevant persons in Group Risk Controlling and reported to the Group's Board of Managing Directors. Reporting comprises specifically:
∙ Daily report with overview of the P&L and risk development. ∙ Weekly stress test report comprising the effects of the stress scenarios. ∙ Overall risk report that is prepared monthly and contains detailed information about P&L
and risk development, risk concentration, economic capital and monitoring of the economic capital limit.

R
isk
report
6
7
Co
mb
ined
ma
na
gem
en
t re
po
rt
Risk management
The fundamental management aim of the front office divisions is to generate IFRS result. This aim is defined in detail by way of a comprehensive set of financial ratios, which are set by the Board of Managing Directors in the medium-term planning.They are broken down by business areas and form the basis for the reporting.
The market price risk strategy documents the strategic framework in the LBBW Group and is derived from the business strategy and the Group risk strategy. The Group risk strategy contains overarching requirements for taking market price risks, which are set out in the risk-taking principles. The requirements for active management of the material LBBW portfolios are documented in the portfolio descriptions, following from the market price risk strategy.
The Board of Managing Directors caps quantitative market price risk management in the LBBW Group by fixing the limit for economic capital for market price risks within the framework of risk-bearing-capacity. The loss-warning trigger acts as an indicator for losses of market value in the economic P&L and thus also entails a reduction of the aggregate risk bearing capacity. The loss-warning triggers at divisional and/or segment level are fixed by the Board of Managing Directors at least once a year taking into account the risk tolerance. Distribution among the portfolios below this level is effected by the authorized person responsible.
The relevant VaR amount is calculated for strategic management and monthly inclusion in the economic capital limit in the strategic limit system. If it is not possible to completely quantify the material risks, appropriate cushions or reserves are formed.
Differentiated VaR portfolio limits are connected with the economic capital limit. These limits plus the loss warning triggers and the sub-strategies together compose the risk taking guidelines for the divisions, departments and groups of Kapitalmarktgeschäft and Asset Management/International Business, Corporate Customers as well as the subsidiaries. The persons responsible for managing market price risks in the LBBW Group are defined via the escalation policy.
Operational management (intraday and end of day) in LBBW's trading books is conducted using sensitivity limits. The end-of-day portfolio limits monitored by Group Risk Controlling are to be observed. Furthermore, various special limits and restrictions, e.g. from the New Product Process, have been approved. These are monitored by Group Risk Controlling and if necessary escalated to the Risk Committee or the Board of Managing Directors.
For detailed risk management internal transactions are completed between the trading units, which are included in the calculations of market price risk.
Risk situation of the LBBW Group
Development of market price risks Exposure to market price risks in 2018 was always in accordance with the risk-bearing capacity of the LBBW Group. The risk limit was not exceeded in 2018 for the individual Group units either. The loss warning trigger was not breached for LBBW Group, the banking and the trading book in 2018.
LBBW's market price risks are generally characterized by interest rate and credit spread risks. Here, the overall risk is dominated by the positions in the banking book, which result mainly from treasury activities. The basis risks in interest between individual European sovereign or financial curves and the swap curve, as well as the exposure to credit spreads from fixed-income securities and pension liabilities, play a decisive part in the overall risk. Equity risks, along with currency and commodity risks, are less significant for LBBW than interest rate and spread risks. Commodity risks also include risks from precious metals and notes and coins portfolios, which LBBW holds to only a limited degree.
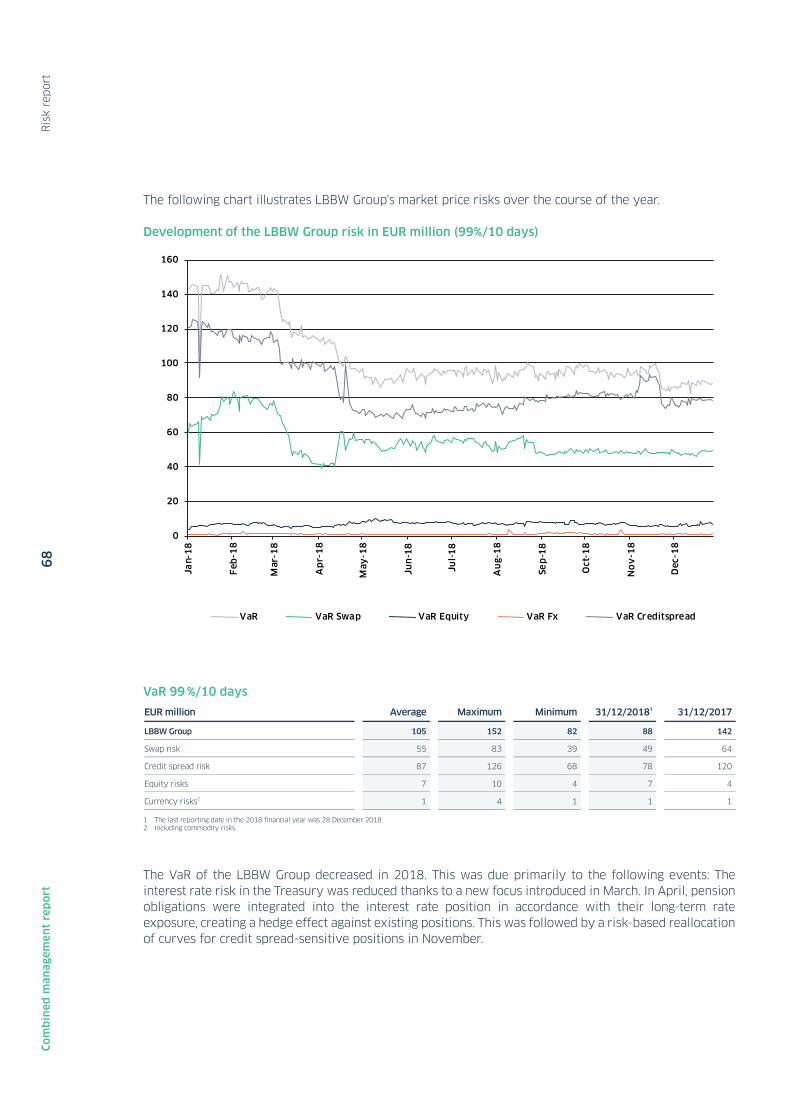
R
isk
report
6
8
Co
mb
ined
ma
na
gem
en
t re
po
rt
The following chart illustrates LBBW Group's market price risks over the course of the year.
Development of the LBBW Group risk in EUR million (99%/10 days)
VaR 99 %/10 days
EUR million Average Maximum Minimum 31/12/20181 31/12/2017
LBBW Group 105 152 82 88 142
Swap risk 55 83 39 49 64
Credit spread risk 87 126 68 78 120
Equity risks 7 10 4 7 4
Currency risks2 1 4 1 1 1
1 The last reporting date in the 2018 financial year was 28 December 2018. 2 Including commodity risks.
The VaR of the LBBW Group decreased in 2018. This was due primarily to the following events: The interest rate risk in the Treasury was reduced thanks to a new focus introduced in March. In April, pension obligations were integrated into the interest rate position in accordance with their long-term rate exposure, creating a hedge effect against existing positions. This was followed by a risk-based reallocation of curves for credit spread-sensitive positions in November.
0
20
40
60
80
100
120
140
160
Jan-
18
Feb
-18
Mar
-18
Ap
r-1
8
May
-18
Jun
-18
Jul-
18
Au
g-1
8
Sep
-18
Oct
-18
No
v-1
8
Dec
-18
VaR VaR Swap VaR Equity VaR Fx VaR Creditspread

R
isk
report
6
9
Co
mb
ined
ma
na
gem
en
t re
po
rt
For the trading book the VaR developed as follows in 2018:
Development of the trading book risk in EUR million (99%/10 days)
VaR 99 %/10 days
EUR million Average Maximum Minimum 31/12/20181 31/12/2017
LBBW (Bank) trading book 12 18 10 11 16
Swap risk 5 9 3 5 6
Credit spread risk 10 17 7 8 15
Equity risks 7 10 4 7 4
Currency risks2 1 4 1 1 1
1 The last reporting date in the 2018 financial year was 28 December 2018. 2 Including commodity risks.
The LBBW trading book includes the positions of the segment Financial Markets and of Treasury, which are used for short-term interest rate and liquidity management. As in previous years, the overall risk in the trading book declined and is at a low level. The changes to the VaR and credit spread VaR in March, July, August and September are based on changes in positions in securities. The sharp decline in the VaR and credit spread VaR in November resulted from a risk-based reallocation of Schuldschein curves.
0
2
4
6
8
10
12
14
16
18
20
Jan-
18
Feb-
18
Mar
-18
Apr
-18
May
-18
Jun-
18
Jul-1
8
Aug
-18
Sep-
18
Oct
-18
Nov
-18
Dec
-18
VaR VaR Swap VaR Equity VaR Fx VaR Creditspread

R
isk
report
7
0
Co
mb
ined
ma
na
gem
en
t re
po
rt
Backtesting result
Clean backtesting CRR portfolio for the period 28 Dec. 2017 – 28 Dec. 2018 in EUR million VaR parameters: 99% confidence level, 1-day holding period
Up to and including the last reporting date of 28 December 2018, the internal risk model shows two outliers for the Clean P/L for the preceding 250 trading days in the CRR portfolio, the portfolio relating to capital adequacy. In both cases, this was caused by a strong movement of credit spreads sparked by the political situation in Italy.
-8
-6
-4
-2
0
2
4
6
8
December-17 March-18 June-18 September-18 December-18
Clean-P&L (equities + interest gen.) VaR (equities + interest gen.)

R
isk
report
7
1
Co
mb
ine
d m
an
age
me
nt
rep
ort
Dirty backtesting CRR portfolio for the period 28 Dec. 2017 – 28 Dec. 2018 in EUR million VaR parameters: 99% confidence level, 1-day holding period
On the basis of the Dirty P/L four outliers were recorded for the CRR-relevant portfolio in the preceding 250 trading days. The December 2017 outlier reflects an amendment to a valuation adjustment. In May, an outlier was reported on the back of significant market volatility caused by developments in Italy. The November outliers relate to fluctuations in USD yield curves for products with short maturities.
To the end of the year, no additional equity is therefore required for model outliers for regulatory purposes. Since five outliers are necessary to impact on the weighting factor of the internal model, it was unchanged.
Stress test The adverse case scenario for the LBBW Group changed in comparison to 2017. The new scenario shows a financial crisis and comprises changes in interest rate and spread curves. The scenario was changed primarily due to the inclusion of pension obligations. The stress test value for the LBBW Group fell by approximately 15% on account of changes in positions and a partial change to the representation of positions.
The effects of an interest rate shock on the strategic bank position in accordance with EBA GL 2018/02 are calculated within the scope of conducting the stress test. The regulatory requirements stipulate that the result may not exceed a 20% share of liable equity. This limit was never breached in 2018.
Market liquidity risks Market liquidity risk designates the risk that transactions cannot be closed out, or can only be closed out at a loss, due to inadequate market depth or market disruptions. For example, if a large volume were to be bought or sold quickly, then a corresponding market-price influence would be anticipated, potentially reducing the expected proceeds.
R
isk
report
7
2
Co
mb
ined
ma
na
gem
en
t re
po
rt
The market liquidity risk is calculated for bonds, credit derivatives, equities and OTC interest rate derivatives. It is broken down into exogenous and endogenous risks. The exogenous market liquidity risk results from the fact that the valuation of market risk positions is based on mid values but bid or ask prices are achieved when positions are closed out. The volatility of the bid-ask spread is included when calculating the exogenous risk. The endogenous market liquidity risk occurs in cases where the Bank's own position relative to market capacity can no longer be ignored. Here there is a risk that liquidation or closeout of the position will result in an additional change in the bid-ask spread that is unfavorable from LBBW's point of view.
The market liquidity risk is calculated using a model that includes bonds, credit derivatives, OTC interest rate derivatives and equities. As at 31 December 2018 the market liquidity risk calculated using this model stood at EUR 345 million. The market liquidity risk decreased by EUR 38 million in the financial year, attributable chiefly to the adjustment of market-related parameters.

R
isk
report
7
3
Co
mb
ined
ma
na
gem
en
t re
po
rt
Liquidity risks
Definition
LBBW's liquidity risk monitoring and management activities draw a distinction between short-term liquidity risk in the narrower sense, which represents the risk of insolvency due to an acute funding shortfall, and the funding (spread) risk, which describes the adverse effects on income resulting from a possible deterioration of funding spreads.
Liquidity risk management
Risk measurement
Liquidity risk tolerance is primarily defined by reference to a survival period concept, i.e. time frames are specified by senior management over which LBBW is expected to remain at least solvent, even in the event of severely limited opportunities to borrow on the market, subject to different combinations of assumptions (development paths).
The assumptions to be made in the regular check of adherence to these parameters, especially within the framework of stress tests, are regularly checked to determine whether they are still adequate under the ongoing market conditions. If they need to be adjusted due to current developments, this is reported to senior management via the Risk Committee and, if approved, results in timely adjustments.
Risk management
Specifications on liquidity risk tolerance in the form of limits for the maximum funding requirement, survival times for cover through funding potential and stress test specifications
Defined escalation routes in the event of a breach of specifications Management of the assets and liabilities sides of the balance sheet via funds transfer pricing Active management of euro intraday liquidity Return-based management of economic and regulatory key performance indicators
Risk measurement
Overall funding requirements determined on a daily basis (business portfolio cash flow and quantifying call risks) and overall funding potential (available liquidity reserves and unsecured market potential)
Daily to monthly stress tests and calculation of the risk of funding spreads for various currencies, time periods and scenarios
Monthly liquidity flow analysis to assess structural liquidity and as the basis for planning funding.
Monthly analysis of the investor base for possible concentrations
Risk monitoring and reporting
Daily reports on day-specific liquidity gaps (funding requirements based on net maturities from the business portfolio) for each location and currency
Daily monitoring of the development of available liquidity reserves and the results of stochastic models for call risks
Daily monitoring including stress test of euro intraday liquidity Monitoring of and reporting on the overall funding requirements and potential of the Group
twice a week Monthly reports on liquidity and funding risks in the Board of Managing Director’s risk and
monitoring bodies Ongoing monitoring of LCR and NSFR

R
isk
report
7
4
Co
mb
ined
ma
na
gem
en
t re
po
rt
In addition, there is a limit system for the maximum funding requirements based on maturities from the business portfolio across various time frames and currencies, and utilization reviews that match the funding requirements with the potential funding.
The following measures, amongst other things, are used for the early identification of new call risks or increased risk from known but previously immaterial call risks:
∙ Permanent analysis of the documented business operations (overall risk report, ALCo documents, New Product Processes) with regard to new or increasingly significant call risks.
∙ A liquidity group consisting of Treasury, Risk Controlling, Regulatory Reporting and Financial Controlling convenes regularly for an operational report on current liquidity issues.
∙ Monitoring intraday liquidity as part of the active liquidity management via the ECB account. Additional check to see if large cash flows occur that are not from transactions due or other familiar causes of payment flows.
∙ Reviews of models, assumptions and materiality classifications within the scope of the Group's risk inventory processes.
All key subsidiaries as defined in the risk inventory (Risk Management Group) and conduits are transferred via the liquidity risk strategy into a single framework for strategic specifications of the activities involving liquidity risks. This is achieved by, for example, determining requirements for structuring funding or reporting obligations. The liquidity risks for subsidiaries and affiliates are assessed using a regular risk inventory and transferred to the Risk Management Group’s regulatory framework, which matches the regulatory framework in place at LBBW (Bank), according to their materiality.
Risk monitoring and reporting
The regular monitoring of liquidity risks is the responsibility of the LBBW Risk Committee. It prepares decisions for the Group’s Board of Managing Directors. Liquidity Risk Controlling is responsible for daily monitoring at the operational level. All material aspects of liquidity risk, such as liquidity requirements, liquidity buffer and compliance with the specifications on liquidity risk tolerance including the results of the stress tests carried out and the intraday liquidity, are reported in detail in the Risk Committee via the monthly overall risk report. Detailed reports are prepared daily as part of the continuous monitoring, which show the different partial aspects of liquidity and liquidity risk – such as disaggregation of the liquidity gaps by currency – and are distributed to recipients in Group Risk Controlling and Treasury.
Risk management
The Asset Liability Committee (ALCo), which meets on a monthly basis, is the central body for managing liquidity and funding. The ALCo also draws up the liquidity and funding strategy on behalf of the Group's Board of Managing Directors, presents it to the Board for approval and monitors implementation of decisions.
Treasury implements all the decisions to be made by the Asset Liability Committee with the aim of active income and risk optimization while simultaneously ensuring solvency at all times and compliance with the requirements with respect to liquidity risk tolerance. The strategic parameters in terms of liquidity risk tolerance are designed to survive temporary crises in such a way that the Group's solvency in EUR and foreign currency is secured for a sufficiently long period even in extreme market situations and in the event of a marked deterioration of LBBW's credit rating as perceived by market players. This also ensures that in the event of temporary adverse developments an adequate time window is available for adapting the business strategy and considering alternative business policies.
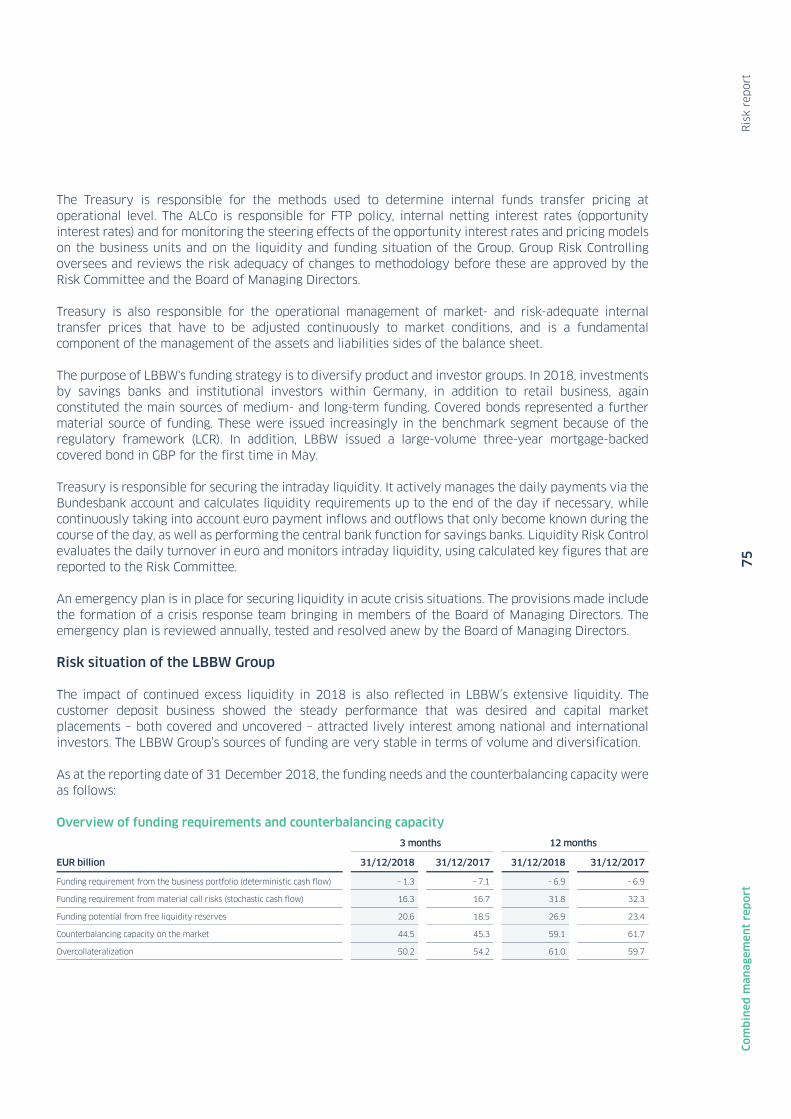
R
isk
report
7
5
Co
mb
ined
ma
na
gem
en
t re
po
rt
The Treasury is responsible for the methods used to determine internal funds transfer pricing at operational level. The ALCo is responsible for FTP policy, internal netting interest rates (opportunity interest rates) and for monitoring the steering effects of the opportunity interest rates and pricing models on the business units and on the liquidity and funding situation of the Group. Group Risk Controlling oversees and reviews the risk adequacy of changes to methodology before these are approved by the Risk Committee and the Board of Managing Directors.
Treasury is also responsible for the operational management of market- and risk-adequate internal transfer prices that have to be adjusted continuously to market conditions, and is a fundamental component of the management of the assets and liabilities sides of the balance sheet.
The purpose of LBBW's funding strategy is to diversify product and investor groups. In 2018, investments by savings banks and institutional investors within Germany, in addition to retail business, again constituted the main sources of medium- and long-term funding. Covered bonds represented a further material source of funding. These were issued increasingly in the benchmark segment because of the regulatory framework (LCR). In addition, LBBW issued a large-volume three-year mortgage-backed covered bond in GBP for the first time in May.
Treasury is responsible for securing the intraday liquidity. It actively manages the daily payments via the Bundesbank account and calculates liquidity requirements up to the end of the day if necessary, while continuously taking into account euro payment inflows and outflows that only become known during the course of the day, as well as performing the central bank function for savings banks. Liquidity Risk Control evaluates the daily turnover in euro and monitors intraday liquidity, using calculated key figures that are reported to the Risk Committee.
An emergency plan is in place for securing liquidity in acute crisis situations. The provisions made include the formation of a crisis response team bringing in members of the Board of Managing Directors. The emergency plan is reviewed annually, tested and resolved anew by the Board of Managing Directors.
Risk situation of the LBBW Group
The impact of continued excess liquidity in 2018 is also reflected in LBBW’s extensive liquidity. The customer deposit business showed the steady performance that was desired and capital market placements – both covered and uncovered – attracted lively interest among national and international investors. The LBBW Group’s sources of funding are very stable in terms of volume and diversification.
As at the reporting date of 31 December 2018, the funding needs and the counterbalancing capacity were as follows:
Overview of funding requirements and counterbalancing capacity
3 months 12 months
EUR billion 31/12/2018 31/12/2017 31/12/2018 31/12/2017
Funding requirement from the business portfolio (deterministic cash flow) – 1.3 – 7.1 – 6.9 – 6.9
Funding requirement from material call risks (stochastic cash flow) 16.3 16.7 31.8 32.3
Funding potential from free liquidity reserves 20.6 18.5 26.9 23.4
Counterbalancing capacity on the market 44.5 45.3 59.1 61.7
Overcollateralization 50.2 54.2 61.0 59.7

R
isk
report
7
6
Co
mb
ined
ma
na
gem
en
t re
po
rt
The funding requirement from the business portfolio was negative at year-end 2018, as liquidity inflows exceeded the outflows and thus de facto resulted in an investment requirement. In the short-term, in particular, this picture is marked by net inflows in EUR (investment requirement), which are offset by funding requirements in key foreign currencies at LBBW (USD and GBP). The funding potential was adequate to compensate for any short-term liquidity outflows and continues to ensure significant overcollateralization on a three month (approximately EUR 50 billion) and 12-month (approximately EUR 61 billion) horizon. In the view of 12 months, the surplus cover from cover registers not required to preserve the covered bond rating is applied towards the free liquidity reserves. Funding potential in the market is approximated on the basis of historical data on the unsecured funds actually raised.
Results of the economic stress scenarios
Funding requirements
(3 months) Funding potential
(3 months)
EUR billion 31/12/2018 31/12/2017 31/12/2018 31/12/2017
Rating downgrade scenario 18.3 13.0 42.7 39.2
Financial market crisis scenario 18.9 13.0 54.8 51.4
Combined scenario of market crisis with downgrade 19.2 13.2 50.3 46.8
The targeted stress resistance was met throughout 2018. The liquidity risk stress scenarios rating downgrade, financial market crisis, and market crisis with downgrade, structured in accordance with the guidelines of MaRisk (BTR 3.2), show that the remaining funding potential via the market, plus the free liquidity buffer, always exceeds the potential funding requirements under stress scenarios for this period. A new stress test for euro intraday liquidity and, due to the materiality of foreign currencies for LBBW’s liquidity, regular USD and GBP stress tests, were also introduced in 2018. These also had a high surplus cover of funding potential in comparison to the funding requirement under stress at all times.
In addition to the requirements for stress resistance, the limits and requirements on LBBW's liquidity risk tolerance set by the senior management also include limits for the maximum funding requirement arising from maturities from the business portfolio and requirements concerning their coverage through funding potential. Total Group limits (EUR plus foreign currencies) were maintained at all times in 2018. The limits for USD and GBP, currencies subject to close monitoring, are designed so as to take account of both risk and return-based management. This caused the USD requirements to be temporarily exceeded in some cases, but these were always brought back within limits very quickly.
The prescribed minimum value of 100% for the European indicator for short-term liquidity »Liquidity Coverage Ratio (LCR)« was observed at all times in 2018. At 114.8%, it was exceeded as at year-end 2018 (31 December 2017: 145.8%).
Risk management system for Pfandbrief (covered bond) operations
A differentiated limit system was put in place to monitor risks from covered bond (Pfandbrief) operations (section 27 of the German Covered Bond Act (Pfandbriefgesetz – PfandBG)). Regular stress tests are conducted with regard to NPV (net present value) overcollateralization. In the event that the fixed limits are reached, a process for then cutting the risk is implemented. The Board of Managing Directors and the Risk Committee are informed on a quarterly basis of compliance with the provisions of the PfandBG and the utilization of legal and internal limits. The statutory requirements were met at all times in 2018. The risk management system is reviewed at least annually.
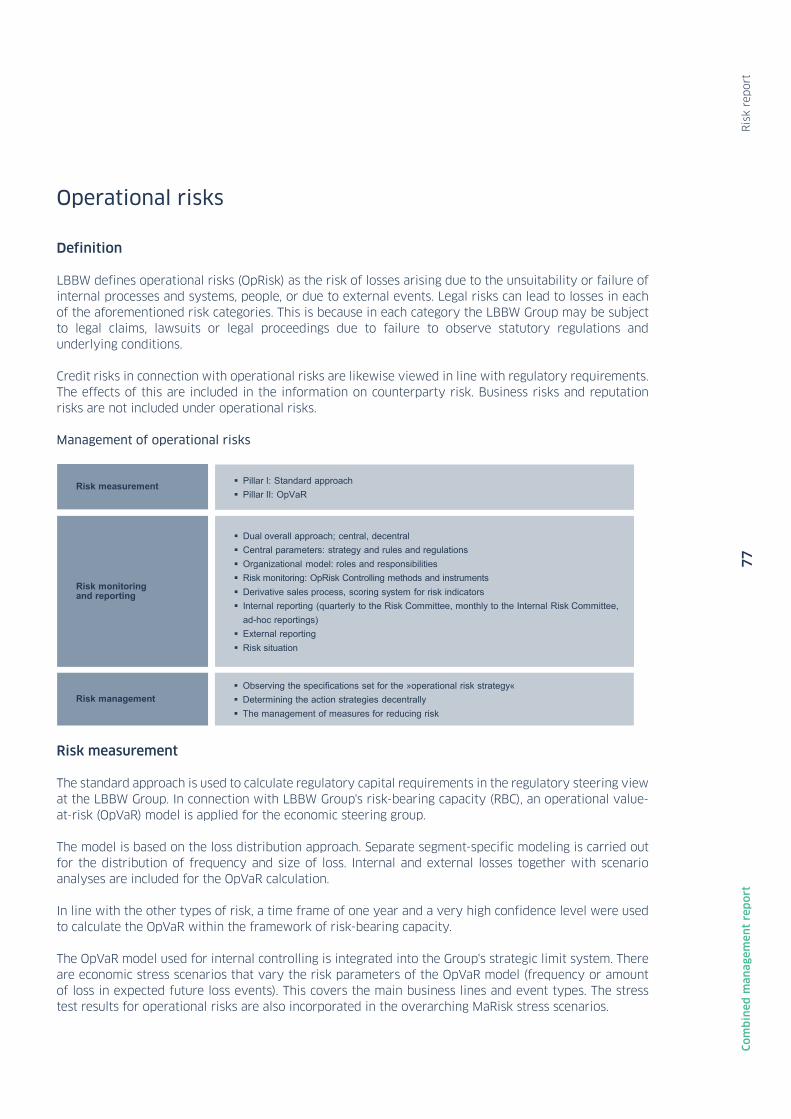
R
isk
report
7
7
Co
mb
ined
ma
na
gem
en
t re
po
rt
Operational risks
Definition
LBBW defines operational risks (OpRisk) as the risk of losses arising due to the unsuitability or failure of internal processes and systems, people, or due to external events. Legal risks can lead to losses in each of the aforementioned risk categories. This is because in each category the LBBW Group may be subject to legal claims, lawsuits or legal proceedings due to failure to observe statutory regulations and underlying conditions.
Credit risks in connection with operational risks are likewise viewed in line with regulatory requirements. The effects of this are included in the information on counterparty risk. Business risks and reputation risks are not included under operational risks.
Management of operational risks
Risk measurement
The standard approach is used to calculate regulatory capital requirements in the regulatory steering view at the LBBW Group. In connection with LBBW Group's risk-bearing capacity (RBC), an operational value-at-risk (OpVaR) model is applied for the economic steering group.
The model is based on the loss distribution approach. Separate segment-specific modeling is carried out for the distribution of frequency and size of loss. Internal and external losses together with scenario analyses are included for the OpVaR calculation.
In line with the other types of risk, a time frame of one year and a very high confidence level were used to calculate the OpVaR within the framework of risk-bearing capacity.
The OpVaR model used for internal controlling is integrated into the Group's strategic limit system. There are economic stress scenarios that vary the risk parameters of the OpVaR model (frequency or amount of loss in expected future loss events). This covers the main business lines and event types. The stress test results for operational risks are also incorporated in the overarching MaRisk stress scenarios.
Risk measurement Pillar I: Standard approach Pillar II: OpVaR
Risk monitoring and reporting
Dual overall approach; central, decentral Central parameters: strategy and rules and regulations Organizational model: roles and responsibilities Risk monitoring: OpRisk Controlling methods and instruments Derivative sales process, scoring system for risk indicators Internal reporting (quarterly to the Risk Committee, monthly to the Internal Risk Committee,
ad-hoc reportings) External reporting Risk situation
Risk management Observing the specifications set for the »operational risk strategy« Determining the action strategies decentrally The management of measures for reducing risk

R
isk
report
7
8
Co
mb
ined
ma
na
gem
en
t re
po
rt
An in-house development based on the Wolfram Mathematica software combined with a web application is used for the OpVaR calculation.
Risk monitoring, reporting and risk management
The LBBW Group has a comprehensive system for the management and controlling of operational risks. On the basis of a dual overall approach, firstly an independent, centralized organizational unit within the Group Risk Controlling division is tasked with further developing and implementing the methods and tools used by OpRisk controlling. Secondly, in the LBBW Group, the execution of the processes implemented for the management of operational risks is mainly the responsibility of the individual divisions and subsidiaries.
The central parameters for handling operational risks are anchored in the Group risk strategy, the risk strategy and policy for operational risks as well as in the framework and instructions. Here the risk strategy and policy regulate the risk profile of the LBBW Group as well as the risk management and controlling process with regard to operational risks.
A »three lines of defense« model describes the roles and responsibilities of those involved in operational risks processes.
As the first line of defense and supporting division management and managing directors, the individual divisions’ and subsidiaries’ operational risk managers play a key role in implementing operational risk controlling tools. They ensure the quality, completeness and timely processing of the operational risk information within the prescribed parameters. At the same time, operational risk managers serve as contacts and multipliers for employees on the topic of operational risks. Central OpRisk Controlling represents the second line of defense in conjunction with downstream controlling processes and is in close contact with the local OpRisk managers. At the same time, the Compliance division carries our further monitoring activities. Group Auditing carries out the process-independent reviews and evaluation (third line of defense).
One of the main goals of operational risk management and controlling activities is to identify operational risks at an early stage, presenting them in a transparent manner and managing them proactively.
Various methods and tools are used to identify and assess the risk situation. In addition to the internal and external loss database, a risk inventory is conducted annually with self-assessments and scenario analyses. The self-assessments record the individual risks of each division and the material subsidiaries of the LBBW Group. The most important risks are aggregated and analyzed extensively in the scenario analysis using standard scenarios. In addition, risk indicators are recorded on a regular basis to identify possible unwanted developments at an early stage.
The overall exposure to operational risks is aggregated using operational value-at-risk (OpVaR) and reported in the LBBW Group's limit system as part of the risk-bearing capacity concept. Various stress tests are also conducted.
The risk data collected are used to create specific analyses, from which extensive control-relevant information can be derived. This forms the basis for drawing up and developing measures to reduce these risks. These play a key role in actively managing operational risks.
Four action strategy options are available for handling operational risks: avoid, transfer, reduce or accept risks. The risks are managed proactively by the divisions and subsidiaries on the basis of the risk strategy for operational risks, and using the recorded and analyzed risk data. The divisions and subsidiaries take the decision on the selection and prioritization of the corresponding measures, which are implemented decentral. Besides the internal control system and an open risk culture, the sensitivity to risks of all staff members and the handling of risks in an open manner play another important role in limiting operational
R
isk
report
7
9
Co
mb
ined
ma
na
gem
en
t re
po
rt
risks. The objective is to minimize or avoid risks, taking cost/benefit aspects into consideration. If it is not possible to completely avoid possible losses the central Legal division obtains insurance policies to cover potential losses – as far as this is possible and reasonable. Continuous improvement of business process, among other things, offers another possibility of reducing potential operational risks further or outsourcing individual processes to specialised companies. Emergency concepts and business continuation plans drawn up within the scope of Business Continuity Management are used to limit losses in the event of an emergency.
The centralized OpRisk Controlling unit provides decision-makers with relevant information as part of regular risk reporting. Ad hoc reports are also made depending on the amount of loss. The Risk Committee also supports the Board of Managing Directors in exercising its supervisory function. The operational risks as well as the risk-bearing capacity monitoring for all risk types are therefore incorporated and integrated in the overall risk management.
Risk situation of the LBBW Group
Existing operational risks in 2018 were always in accordance with the risk-bearing capacity of the LBBW Group. Looking forward, LBBW does not expect any operational risks to its going-concern status. Despite the extensive precautionary measures taken, operational risks can never be entirely avoided.
Legal risks, IT risks and personnel risks are set out below as they are key areas of the operational risk.
Legal risks The definition of operational risks also includes legal risks. Legal risks comprise economic risks due to full or partial failure to comply with the framework of rules established by legal regulations and court rulings. These arise, for example, due to inadequate knowledge of the concrete legal position, insufficient application of the law or failure to react in a timely manner to changes in underlying legal conditions. This also applies if there is no fault or if the situation was unavoidable, for example as a consequence of changes in legislation, jurisdiction and administrative practice, especially at national and European level.
Legal risks are managed especially by LBBW's Legal division, which carries out a legal advisory role for the Group. In addition, its responsibilities include early identification of legal risks in business units and central divisions in cooperation with them, and efforts to limit these in a suitable manner. The Legal division has developed or examined and approved for use by the divisions of LBBW a variety of contract forms and sample contracts in order to minimize legal risks and simplify the business activities of the front office and trading division. In relation to this, LBBW is supported by the cooperation of the German Savings Banks Finance Group (DSGV) and the forms developed in the committees there and made available by the Sparkassenverlag publishing house. Approved, standardized contract materials are used for derivative transactions wherever possible. If legal questions arise in new areas of business or during the development of new banking products, the Legal division supervises and actively shapes these processes.
Furthermore, the Legal division monitors all relevant planned legislation, developments in court rulings, and new standards stipulated by the supervisory authorities in the Group's key areas of activity in close cooperation with the Association of German Public Sector Banks (Bundesverband Öffentlicher Banken Deutschlands – VÖB), the German Savings Banks Finance Group (Deutscher Sparkassen- und Giroverband), and the Association of German Pfandbrief Banks (Verband deutscher Pfandbriefbanken – VdP) in particular.

R
isk
report
8
0
Co
mb
ined
ma
na
gem
en
t re
po
rt
To the extent that this results in LBBW having to take action with regard to legal matters or adapt its policies, the Legal division is instrumental in disseminating information quickly and implementing measures within the Group.
The banking landscape continues to face not inconsiderable legal risks from customer transactions in complex derivatives and the further development of consumer protection. In 2017, the German Federal Court of Justice (Bundesgerichtshof – BGH) also applied principles of consumer rights to commercial customers, to the detriment of banks. The Bank is closely monitoring legal trends relevant to banking law.
Further legal risks exist in fiscal law terms concerning the requirements for deducting capital gains tax. Here, a developed legal position with a retrospective impact on the basis of new legislation or new pronouncements by the revenue authorities cannot be ruled out.
The continuous processes of legal analysis and risk processes initiated by LBBW's Board of Managing Directors in response to this also take account of the aforementioned developments.
As far as is known today, adequate provision has been made to cover legal risks while at the same time the future development of legislation and legal disputes will continue to be of crucial importance for LBBW. Here the provisions formed relate, also against the backdrop of the unclear legislative situation, principally to covering legal risks from certain derivatives transactions as well as risks relating to consumer law.
IT risks Today the principal business processes of the Bank are to a large extent supported by IT or depend on IT solutions. The IT applications are becoming increasingly more complex, the volume of data greater, the degree by which functions are shared and the threat to IT applications continues to grow, which on balance leads to higher IT risks.
Managing IT risks is anchored within the company as a permanent, integrated process and is guided by the risk management and controlling process controlling cycle.
Specific risk analyses, self-assessments and scenario analyses are carried out, threats and weak points from different data sources (e.g. S-Cert computer emergency team, BSI catalog and experts) are analyzed and evaluated in order to get as complete a picture as possible of the Bank's IT risk situation. Measures are taken and monitored in order to reduce risks to an acceptable level.
IT production operations and a part of applications development have been outsourced to a professional service provider specializing in financial institutions.
LBBW has set up a special IT crisis response team to ensure that its business operations are maintained and that it can function if IT applications fail; in the event of an emergency, this team will coordinate all activities and provide centralized communications capabilities, also with the IT service providers, in accordance with defined procedures. The procedure and organizational measures to be taken in the event of a crisis are described in an IT crisis management manual. The IT crisis management manual, the IT crisis rooms and key positions are reviewed on a quarterly basis.
R
isk
report
8
1
Co
mb
ined
ma
na
gem
en
t re
po
rt
Personnel risks LBBW's success depends materially on the commitment of its staff – and is also anchored in LBBW's mission statement: »We as employees drive the success of the Bank; with competence, knowledge and commitment«. Comprehensive personnel risk management aims to identify negative trends (risk monitoring) and evaluate suitable measures to prevent or minimize risks (risk management).
The Human Resources department distinguishes between various types of personnel risk for purposes of risk monitoring and management. The goal is to identify bottleneck, resignation, adjustment and motivation risks early on, and to minimize the resulting costs, such as staff recruitment, termination and staff turnover expenses. These risks are measured by periodically evaluating and analyzing key human resources indicators, such as fluctuation rates, absences, or data concerning personnel development measures, as well as comparing these indicators across the Group.
One focus here is on developing and promoting young employees within the company. In order to address the risk of a shortage of high-performance employees (bottleneck risk), employee potential is systematically documented and analyzed. Changes in LBBW's age structure are observed particularly closely against the backdrop of demographic changes.
Suitable talent management to fill select management and specialist roles looks set to take on increasing importance and so this is being met with a set of measures to attract, develop and retain high-achieving employees.
To counteract the risk of a shortage of suitable management personnel, a systematic process is in place to regularly evaluate potential and performance, in particular in senior management, in order to support development at an early stage with the help of suitable training programs. Particular attention is paid to women’s professional development.
LBBW has already implemented a series of measures to address possible further personnel risks. These measures range from legal protection for LBBW to ensuring that employees are qualified to perform the tasks assigned to them. Among other things, a target group-oriented specialist training program is held annually. In addition, a dedicated department is responsible for providing training in and monitoring of statutory money laundering and compliance regulations. The Code of Conduct of LBBW also applies to all members of staff. These measures should also help to counter possible behavioral risks related to the staff.
R
isk
report
8
2
Co
mb
ined
ma
na
gem
en
t re
po
rt
Other material risks
Investment risks
LBBW invests within the Group in other companies or assigns functions to subsidiaries if this appears to be appropriate in the light of strategic aims or returns.
By investment risks in the narrower sense LBBW understands in particular the risk of a potential loss of value both as a result of default events and due to an insufficient return on investments in subsidiaries and equity investments.
In order to limit the investment risk, subsidiaries and equity investments are only taken on if adequate risk management and appropriate integration in the processes of LBBW are ensured.
Depending on LBBW's possibilities for exerting influence, management of the subsidiaries and equity investments is effected by means of defined measures and processes (including quarterly jour fixes with selected subsidiaries, plausibility checks of the multi-year plans, various reports to the Board of Managing directors and corporate bodies of LBBW and the corporate bodies of the subsidiaries).
The early identification of business and risk development in the subsidiaries and equity investments is particularly important to the management of equity investments. These serve the purpose, especially for the strategically important subsidiaries, of holding regular coordination meetings at the corresponding specialist levels of LBBW. The management and monitoring at the level of these subsidiaries are generally performed by institutionalized supervisory boards or comparable bodies. At Group level management and control is effected by involving the staff, operating and marketing divisions in the decision-making process, taking corporate governance into account.
From the point of view of risk, a distinction is made between three categories of companies in the LBBW portfolio of equity investments (direct LBBW subsidiaries and equity investments and those held via holding companies):
∙ Material subsidiaries from a risk perspective, i.e. companies whose risk potential is classified as material from a Group point of view. These companies form the Risk Management Group
∙ Subsidiaries to be monitored from a risk perspective, i.e. companies of minor importance to LBBW’s risk situation but that could pay a higher risk premium in the future due to their performance
∙ Non-material subsidiaries and equity investments from a risk perspective, i.e. companies whose risk potential is classified as immaterial from a Group point of view.
From a risk perspective, as a rule, material subsidiaries are treated in line with the transparency principle. Accordingly, all material risks at Group level for each subsidiary of the Risk Management Group are quantified separately, using estimation procedures if necessary.
In the case of subsidiaries to be monitored as well as non-material subsidiaries and equity investments from a risk perspective, the risk potential is quantified with the LBBW Group credit portfolio on the basis of the interest held and included as a whole in the Bank's risk management system, using an integrated simulation. This calculation is performed using a ratings-based CVaR approach including stress testing, which is prepared by Group Risk Controlling and serves as the basis for recognition in the risk-bearing capacity.

R
isk
report
8
3
Co
mb
ined
ma
na
gem
en
t re
po
rt
The business and risk trends in the portfolios of the subsidiaries and equity investments that are deemed non-material from a risk perspective and of subsidiaries to be monitored are generally reflected in the value of the investment as used to calculate the investment risk.
LBBW pursues a selective equity investment policy. When acquisitions of companies are planned, a comprehensive risk analysis (legal, financial etc.) is normally conducted in the form of a due diligence exercise with the involvement of specialist divisions of LBBW. Of particular importance here, among other things, is ensuring that inappropriate concentration of risk does not arise in the investment portfolio.
LBBW uses transaction agreements to contractually hedge risks as far as possible. In addition, the buying process includes the valuation of the company, taking into account capital-market-oriented risk premiums.
Enterprise values for the subsidiaries and equity investments of LBBW are calculated annually in accordance with the guidelines issued by the Institute of Public Auditors in Germany (Institut der Wirtschaftsprüfer in Deutschland e. V. – IDW) as part of preparatory work for the annual financial statements. For the half-yearly report, an impairment test of the book values is performed, using the projections for the subsidiaries and equity investments to hand if necessary. A plausibility check of the valuations is performed on selected subsidiaries and equity investments as at 31 March and 30 September.
Besides the risk of a potential decline in value as the result of defaults, there is also a risk that LBBW will receive an insufficient return or no return at all on its investments.However, this risk corresponds to the above-mentioned general book value or fair value risk due to the focus on capitalized income value in the valuation of equity investments. The main drivers here are the large strategic subsidiaries and equity investments. LBBW's equity investment portfolio has a strong financial focus. Accordingly, a disruption in this market segment may lead to significant losses from equity investments.
Risks may also arise from the utilization of the personal liability assumed as shareholder (e.g. guarantor's liability, letter of comfort) for subsidiaries and investments; this also includes revoked letters of comfort or warranty declarations extended to subsidiaries and investments already disposed of. In addition, there is a risk of assuming current losses incurred by subsidiaries due to control and profit and loss transfer agreements.
Management and monitoring systems ensure that LBBW is continually informed about the situation at the subsidiaries and equity investments. In addition, the subsidiaries pursue a conservative risk policy synchronized with LBBW to the extent that LBBW can influence such policies.
The investment portfolio was cut back further in the 2018 financial year, selling or terminating three property leasing companies. The shares in RWE AG were sold and those in Paramount Group Real Estate Fund III L.L.P. were liquidated.
Reputation risks, business risks, pension risks and model risks
Reputation risk is the risk of a loss or foregone profit due to damage to/deterioration of LBBW's reputation in the eyes of owners, customers, employees, business partners or the wider public. Reputation risk is not a component of operational risk. However, reputation risks may be caused by an incident of loss resulting from operational risk or other risk types becoming public knowledge. Reputation risks that have been incurred can impact on the business and liquidity risks.
R
isk
report
8
4
Co
mb
ined
ma
na
gem
en
t re
po
rt
LBBW draws a distinction between transaction-based reputation risk management (measures relating to individual business transactions) and non-transaction-based reputation risk management (press/issue management in particular).
In all business decisions the effect of the transaction on LBBW's reputation is to be considered. Transactions that have a long-term negative impact on LBBW's reputation are avoided. The sustainability policy of the LBBW Group must be observed. It is the LBBW Group's intention to act in the best and long-term interest of its customers and stakeholders. In order to implement the sustainability policy, the Group defines sustainability and environment social governance standards for all business areas. The transaction-based analysis of new transactions with regard to reputation risks is carried out on a decentralized basis by the front office particularly within the context of the New Product Process (NPP) and the credit application process. The Compliance division, the Sustainability group and Environment Social Governance support the relevant front office divisions in their day-to-day business in identifying and assessing reputation risks. In the case of OTC derivatives for interest-rate, currency and commodity management there is a product certification process upstream of the NPP.
Business risk is the risk of unexpected falls in earnings and negative plan variances not caused by other defined risk types. They may be caused by factors including changes in customer behavior or changes to the economic environment, as well as by the impact of reputational damage incurred. It is reflected in particular in lower commission income or net interest spreads as well as in increased costs.
The historical plan/actual variances of selected items in the income statement form the basis for quantifying the business and reputation risks.
The pension risk entails the possible need to increase pension provisions on account of higher anticipated pension expenses and measurement effects in particular. This may particularly be caused by changes in interest rates, pensions, salaries and life expectancy. The risk from interest rate developments is integrated into the market price risk. The remaining risk drivers are quantified by means of scenario analyses on the basis of an actuarial report. At the moment the interest-rate component, for example, is not hedged in full. In the event of material changes the Board of Managing Directors makes a decision with regard to the risk strategy (the resulting pension risk is currently accepted and passively monitored), taking account of income statement and equity volatility.
LBBW defines model risk as the risk of potential loss or damage resulting from decisions based on the results of models that show weaknesses or uncertainties in the model theory/design, the model parameterization/calibration, model implementation, initial model data or the model application As regards the intended use of the models, LBBW differentiates between the following types of model: models to quantify capital risks (economic (ICAAP) and regulatory) and liquidity risks (ILAAP) (»risk and capital models«), models to measure asset and liability items (»valuation models«), models to define parameters relevant to lending such as ratings (probability of default: PD), loss given default (LGD) and credit conversion factor (CCF) (»lending parameter models«) and models that do not fall into these model categories (»other models«).

R
isk
report
8
5
Co
mb
ined
ma
na
gem
en
t re
po
rt
Model risks are a subset of operational risks (OpRisk) similar to legal or behavioral risks, but by virtue of their significance and special characteristics at LBBW they are largely managed in the scope of an independent model risk management process (MRM process). In this MRM process, methods and procedures are used that ensure model risks for individual models and across models are adequately identified, assessed, monitored, communicated and managed. This is based on the annual model inventory, which takes stock of all models used across the LBBW Group and classifies the models identified with regard to their MRM relevance (first model risk evaluation). Depending on the model class and other model-specific factors (e.g. line of defense in which the model was developed), the models are graded in the additional validation process (e.g. validation intensity). In the next stage of the model-specific validation process, model risks are identified and evaluated in terms of their materiality. Group Risk Controlling informs the Group’s Board of Managing Directors of the key results of the model inventory and the model valuation, who then decide on measures to eliminate and reduce model risks. If a serious model risk cannot be eliminated within a reasonable period of time by adjusting the models, it is offset in the risk-bearing capacity, depending on model type, as a deduction from the aggregate risk cover, as a premium in economic capital in the type of risk affected (for risk underwriting model risk), via the economic capital of the operational risk or by booking a fair value adjustment.
Real estate risks
Real estate risks are defined as potential negative changes in the value of own real estate holdings or seed capital for real estate funds managed by LBBW Immobilien due to deterioration in the general situation on the real estate markets or deterioration in the particular attributes of an individual property (possibilities of use, vacancies, reduced income, damage to buildings etc.). This does not include development risks from residential and commercial project development business, which form a separate risk category.
Real estate risks can arise in properties owned by the Group (office buildings) as well as in the commercial buildings used by third parties. The real estate portfolio is managed above all by the LBBW Immobilien Group and LBBW Corporate Real Estate Management GmbH (previously BW-Immobilien GmbH).
Conversely, in the event of a positive change in market conditions opportunities arise for positive changes in value and the generation of further income (higher rents, extensions of leases, possibility of leasing difficult space etc.).
The central principles for weighing up opportunities and risks when assessing investment and divestment decisions, material changes in property planning, concluding rental agreements and to avoid the risk of negative changes in the value of existing real estate holdings are defined in the risk strategy of the LBBW Group and of LBBW Immobilien.
LBBW uses a real estate value-at-risk (IVaR) model to measure real estate risk. Group Risk Controlling calculates IVaR indicators for real estate risks quarterly and incorporates these into the Group's analysis of risk-bearing capacity. The input data in this model are the volatilities and correlations derived from market data histories assigned to the portfolio values.
The operating subsidiaries of LBBW Immobilien Group with operations in asset management are also controlled using special real-estate-specific indicators such as rent increases, vacancy rates and amounts in arrears. The real estate portfolio is monitored and analyzed for risks in the course of the quarterly portfolio valuation using the fair value approach. The goal is to identify at an early stage and analyze any adverse factors occurring as part of or relating to LBBW's activities. Proactive risk management ensures a balanced ratio of opportunities and risks within the portfolio.
The commercial portfolio is diversified by type of use, especially for office and retail property, as well as by size category. The strategic properties are predominantly located in Stuttgart, which is a stable market with relatively low rent fluctuations overall. Furthermore, the real estate owned by LBBW Immobilien is
R
isk
report
8
6
Co
mb
ined
ma
na
gem
en
t re
po
rt
mostly situated in prime locations with low rental risk and leased to tenants of good credit standing. The credit rating of potential tenants is examined carefully when new properties are let and attempts are always made to ensure that the lease is as long as possible. Depending on the underlying real estate strategy (i.e. project development), however, it makes sense and is possible in particular cases to conclude short-term rental agreements. In addition, the performance of the portfolios that are located mainly outside Stuttgart – currently in Munich and Frankfurt am Main – contribute to macro location-specific diversification. These are purchased individual properties or (sub-)portfolios that will continue to be fully let through active asset management. Subsequently, the properties will be sold again (in the medium term). Overall, risks specific to macro locations are therefore considered to be manageable.
In LBBW's asset management segment, investment and divestment decisions are usually made on a case-by-case basis following an in-depth performance audit, given the manageable number of properties. In this process, a comprehensive set of real-estate-relevant criteria, such as the cost/income situation, the Group's strategy for use/growth, the ability of the location to develop, portfolio diversification or representative purposes for the Group are taken into account.
LBBW Corporate Real Estate Management GmbH is responsible for LBBW's owner-occupied real estate. Most of the properties are used for office or bank purposes. The target portfolio is continually adapted to the uses required by the LBBW Group as well as aiming to optimize space utilization at all of the LBBW central offices. This is largely being achieved by concentrating on properties owned by LBBW, by avoiding rented space as much as possible and by optimizing occupancy. As a result, this is not expected to have a significant influence on the holdings LBBW uses itself or the real estate risk.
In addition, the new business area equity real estate fund is included in real estate risk. This relates to seed capital intended to establish LBBW Immobilien Investment Management GmbH as an active real estate investment manager on the market. Investments are concentrated on office and commercial properties in selected locations in Germany. The focus is on Core+ real estate. The real estate VaR ensures inclusion in LBBW’s strategic limit system.
Development risks
Development risks are defined as the bundle of risks that typically arise when implementing commercial and residential project developments. The risks in this field mainly arise from planning and approval, the projected construction costs and deadline, and especially from leasing and selling. Additional risks, such as the credit risk on the part of partners or the implementation of decisions regarding the partners, information flow or the quality of the partner also apply if project developments are implemented in partner projects. The occurrence of these risks may also result in the expected return not being generated, the invested capital not being returned in full – or not at all in extreme cases – or the need for further equity injections, provided it is not non-recourse financing.
Conversely, in the event of a positive change in market conditions opportunities arise for higher exit proceeds, driven by higher rental income as well as higher multiples. At the same time, however, a positive market trend makes it more difficult to purchase suitable development properties at favorable prices.
The central principles for weighing up opportunities and risks before commencement of a project and in all project phases with regard to factors relating to individual projects and the effects on the project portfolio are defined in the Group risk strategy of the LBBW Group and of LBBW Immobilien.
The regional focus is on the core markets of Southern Germany (Baden-Württemberg and Bavaria), Rhineland-Palatinate, the Rhine Main region, Berlin and Hamburg. LBBW Immobilien Group acts as an investor and service provider in commercial and residential real estate on these markets. Existing projects outside these target markets, especially on international markets, have largely been completed. The new projects are running on schedule and there is no evidence at present of any material risks.
R
isk
report
8
7
Co
mb
ined
ma
na
gem
en
t re
po
rt
LBBW Immobilien Group uses a risk model that was validated with the assistance of an auditing company to measure development risks. The model is based on a risk driver tree that identifies risks and shows the ranges in which these can fluctuate even before a construction project begins. From this, mark-ups and mark-downs on all future costs and revenues are determined and applied to the so-called real case calculation. A normal and extreme risk is calculated on the basis of different fluctuation ranges of risk factors. Development risk is calculated quarterly by the Controlling division of the LBBW Immobilien Group. The central Group Risk Controlling division includes this in the LBBW Group’s analysis of risk-bearing capacity.

IC
S w
ith r
egar
d t
o t
he
acco
unti
ng
pro
cess
8
8
Co
mb
ined
ma
na
gem
en
t re
po
rt
The LBBW Group defines the internal control and risk management system (ICS) as a comprehensive system and applies the definitions of the German Institute of Public Auditors in Germany (Institut der Wirtschaftsprüfer in Deutschland e. V., IDW) on the accounting-related internal control system (IDW PS 261 Item 19 et seq.) and the risk management system (IDW PS 340 Item 4). It entails principles, processes and measures that are aimed at the implementation, in organizational terms, of management decisions
∙ to ensure the efficacy and economic efficiency of the business activities (including the protection of assets as well as the prevention and detection of loss of assets)
∙ to safeguard the propriety and reliability of internal and external accounting, and ∙ to observe the statutory rules and regulations of relevance for LBBW.
The ICS for the accounting process and management reporting helps to provide a true and fair view of the net assets, financial position and results of operations of LBBW (Bank) and the LBBW Group. The assessment of the effectiveness of the ICS is carried out on the basis of the Committee of Sponsoring Organizations of the Treadway Commission (COSO) framework. The ICS is made up of five components:
∙ The control environment provides the framework for the introduction and application of the principles, procedures and measures in a company.
∙ Risk assessment serves to recognize and analyze internal and external risks. ∙ The control activities ensure compliance with the management's decisions and address the
corporate risks with suitable measures. ∙ Information and communication guarantee that information is collected for business decisions
and passed on to the responsible divisions in the company. ∙ Monitoring the ICS serves to assess the effectiveness of the system over time.
A key aim is to ensure that all transactions are recorded, processed and documented in full and correctly in accordance with statutory provisions and standards, the provisions of the articles of association, and other guidelines.
It is also ascertained that companies included within the scope of consolidation are incorporated in the processes to ensure that the consolidated financial statements are prepared appropriately and in due time.
The accounting-related internal control and risk management system is an integral component of the ICS for integrated bank management.
Control environment
LBBW has a clear organizational, corporate, control and monitoring structure. Its Board of Managing Directors takes overall responsibility for proper business organization. All organizational units are involved in preparing the annual and consolidated financial statements as well as the management report by means of a clearly defined management and reporting organization. The departments of all Group companies involved in the accounting process conform from the Bank perspective to quantitative and qualitative requirements. The employees tasked with the accounting process are provided with regular training.
ICS with regard to the accounting process
IC
S w
ith r
egar
d t
o t
he
acco
unti
ng
pro
cess
8
9
Co
mb
ined
ma
na
gem
en
t re
po
rt
Risk assessment and control activities
The controls are geared toward ensuring that the annual and consolidated financial statements as well as the management report are prepared in accordance with the applicable provisions of the German Commercial Code (Handelsgesetzbuch, HGB) and the International Financial Reporting Standards (IFRS) as well as proper and timely compliance with internal and external financial reporting requirements. A process portal and framework and operating instructions regulate the scope of the controls and responsibilities integrated into working processes.
Every year, managers of each individual department determine which risks prevent the financial statements from complying with regulations and assess the relevance of these risks. They then document the recognized risks in the risk-control matrix.
In connection with the measures aimed at limiting certain recognized risks, it is worth mentioning the dual-control principle, the separation of functions and the assignment of authorities in line with existing decision-making regulations, among others. These have also been included in the regulations met by the respective Group companies.
Any recognized risks are reviewed using the ICS regulation cycle, which consists of three parts. The first is the ICS Quick-Check, wherein the organizational units concerned perform a self-assessment of the internal control system using a questionnaire. The second is management testing of select key controls using the risk-control matrix as a basis. The final component is the ICS Self-Assessment. Control functions are exercised within each competent department throughout the Group. The control targets defined at LBBW map the identified risks. These are set out in the written policies.
Both the annual financial statements for the Bank and the consolidated financial statements are prepared centrally by the Finance division at LBBW (Bank) with the involvement of the specialist divisions.
Detailed timetables and workflows are in place for the annual and consolidated financial statements (monthly, quarterly, half-yearly and annual financial statements), which are monitored and managed centrally. Responsibilities in all areas of the accounting process are clearly assigned. The relevant activities in terms of risk are distributed across several organizational units within the organization of business processes. The principle of dual control is applied to all processes relevant to accounting, the assignment of authorities complied with and the separation of functions taken into account.
The companies included in the consolidated financial statements have IT-based processes in place for preparing their financial statements (in accordance with local laws). This results in the delivery of the coordinated and, for the most part, audited annual financial statements for the purposes of preparing the consolidated financial statements. The senior management of the respective Group company is responsible for the completeness and accuracy of the results transmitted to the Group Accounting group.
The consolidated financial statements are prepared in accordance with IFRS and take into account the standard accounting and measurement requirements set out in the Group Manual.
Financial instruments measured at fair value at LBBW (Bank and Group) are assessed either on the basis of quoted prices for active markets (stock exchanges, brokers, price service agencies etc.) or on the basis of recognized and standard measurement methods using publicly available input data (e.g. yield curves, volatilities, spreads). In cases where not all the input parameters can be observed directly on the market, fair values are calculated using realistic assumptions, based on market conditions. The prices used for accounting purposes are checked independently of trading and validated by the separate organizational unit, Independent Price Verification, within Group Risk Controlling.
IC
S w
ith r
egar
d t
o t
he
acco
unti
ng
pro
cess
9
0
Co
mb
ined
ma
na
gem
en
t re
po
rt
Higher-level control and coordination of the interdivisional process of preparing the LBBW management report are carried out centrally by the Group Communication division under the overall responsibility of the Finance division. The preparation process is integrated in the timetables and workflows for the half-yearly and annual financial statements. Applying the principle of dual control, the sections of the management report are produced separately by the specialist divisions and approved by the divisional managers. The Group Communication division (internal records office) checks the content of the entire management report for consistency.
Information and communication
The risk principles of the LBBW Group, the organizational structure and procedures and the processes of the accounting-related ICS are set out in manuals and guidelines (e.g. accounting guidelines, operating procedures, specialist concepts etc.), which are, in general, regularly adjusted to current external and internal developments and published on the intranet of LBBW (Bank). This also applies to the Group Manual, which includes the measurement and accounting rules for preparing the consolidated financial statements. Taking the current IFRS rules into account, it is updated regularly and forwarded to the Group companies.
The Finance Principles & NPP group identifies and evaluates all legal changes that have an impact on the accounting process. It informs the specialist divisions and subsidiaries affected and initiates implementation.
New types of products and product variants are examined in detail in the Bank's New Product Process and in the Group companies with regard to their treatment under accounting law. This process also defines the structures and embedded derivatives for each product type. In the case of new types of products, the correct mapping, analysis and recognition of transaction types is also checked in a test phase. If systems and/or processes of the Group head office are required for Group companies' new product types, the Finance Principles & NPP group determines how they should be treated under accounting law.
Group Accounting prepares the figures for the consolidated financial statements using standardized consolidation software on the basis of the information provided by the companies included in the consolidated financial statements. The consistency of the data provided by the Group companies is inspected by checking rules implemented and by comprehensive validation. The content of the data is validated using a matrix organization responsible for various Group companies and various balance sheet items within the Group. The notes to the consolidated financial statements are also prepared using standardized software. Group Accounting guarantees the completeness and accuracy of the relevant explanatory notes on the basis of the information provided by the Group companies.
Financial reports created in connection with accounting and sent to external parties or readers are checked for consistency by the internal records office before being sent.
Furthermore, the Board of Managing Directors has issued rules stipulating that it must be informed immediately if doubts arise in individual divisions or Group companies as to proper business organization (»ad hoc reporting requirement«). The same also applies to accounting. If information is significant in terms of risk aspects, the Group Board of Managing Directors must also forward it to the Risk Committee of the Supervisory Board.

IC
S w
ith r
egar
d t
o t
he
acco
unti
ng
pro
cess
9
1
Co
mb
ined
ma
na
gem
en
t re
po
rt
Monitoring
LBBW's current ICS is characterized by decentralized responsibility of the specialist divisions for essential accounting-relevant processes.
The central, internal ICS Compliance Office regularly monitors the accounting-related ICS as part of the bank-wide ICS monitoring process to evaluate its effectiveness and adequacy. This ensures that potential improvements are identified and processes are adjusted accordingly where required.
All internal and external audit findings are discussed and analyzed with the employees involved in the preparation of the annual and consolidated financial statements and the management report. The findings are processed and monitored in an ongoing process. Measures are derived and incorporated into ongoing processes.
Both the Audit Committee of the Supervisory Board and Group Auditing serve as senior monitoring bodies. Group Auditing is responsible for process-independent monitoring of business operations and, as such, is an instrument used by the entire management. In addition, Auditing carries out process-integrated and process-related monitoring measures. Its remit also includes helping improve the ICS’s effectiveness. The Audit Committee, as a committee of the Supervisory Board, deals with the analysis and preparation of the findings of the audit of the annual accounts and informs the Supervisory Board of these activities.

Fo
reca
st a
nd o
pport
unit
y r
eport
9
2
Co
mb
ined
ma
na
gem
en
t re
po
rt
Anticipated economic performance
2019 is likely to see weaker economic performance in the eurozone and in Germany in comparison to the previous year. Many leading indicators have been in decline for months. The ifo business climate fell five times in a row in the period from September 2018 to January 2019, dropping to 99.1 – its lowest point since February 2016. Indications on financial markets also sparked uncertainty: The DAX index tumbled by around 20% over the year after peaking in January 2018, technically constituting a recession. In the US, 10-year Treasuries’ yield advantage over two-year Treasuries collapsed to just a few basis points. For maturities between two and five years, the US Treasury curve was even inverted. In the past, an inverted yield curve was often a harbinger of a recession. On the other hand, some factors in Germany and the eurozone indicated that growth may pick up again after an interim lull. In Germany, the industry’s orders on hand remain high. The eurozone as a whole is characterized by low interest rates – both nominal and real – and a weaker euro against the US dollar. The latter looks set to boost exports. And finally, the global economy is still in good shape. We expect to see GDP growth of 2.5% in the US in 2019, down from 2.9% in the previous year. Economic output in China is likely to grow by 6.0% in 2019. We expect the world economy to expand by 3.6%. Under these circumstances, GDP is likely to grow by 1.5% in the eurozone and 1.4% in Germany. This is a slower pace than in the last three years but is still some way off stagnation or recession. Nonetheless, the risks in this scenario look likely to be higher than they have been for quite some time. A tide of protectionism is on the rise, led by the US. But disruption to global trade would hurt the eurozone, including Germany.
2019 is unlikely to provide much impetus to monetary policy. In the US, there are signs that the Fed will raise the key interest rate just once or twice at most. The target range for the fed funds rate is currently between 2.25% and 2.50%. The eurozone is still a long way off these kind of interest rates. Although the ECB cautiously signaled its intention to tighten monetary policy by ending net bond purchases, the first interest rate hike will probably take some time to materialize. We do not expect the ECB to make this move until spring 2020.
Inflation is unlikely to be a dominant topic on markets in 2019. Driven by rising energy prices, inflation in the eurozone and Germany broke past the 2% mark in 2018 for the first time since 2012 (with the exception of a brief interlude in early 2017). Meanwhile, basis effects and the slide in the price of oil towards the end of 2018 should provide some relief. We expect to see inflation of 1.6% in Germany and 1.5% in the eurozone in 2019.
Caution will probably prevail on stock markets. We anticipate 11,500 points for the DAX by the end of 2019. The euro looks set to appreciate in 2019, with its exchange rate against the US dollar rising somewhat to USD 1.16 per EUR at the end of 2019. Given this, yields on the capital market have only slight upward potential. We expect yields on 10-year US Treasuries to reach 2.90% by the end of 2019, with 10-year Bunds likely to climb to 0.50% by the end of the year in the wake of the Treasuries. In light of good economic conditions and low interest rates, house prices in Germany look set to continue to rise for the time being, albeit at a slower pace.
Forecast and opportunity report

Fo
reca
st a
nd o
pport
unit
y r
eport
9
3
Co
mb
ined
ma
na
gem
en
t re
po
rt
Industry and competitive situation
The German banking environment will likely remain challenging in 2019. Alongside the ongoing shift in business models, reflected primarily in increasing digitalization resulting from changing customer needs, competitive and margin pressure will likely represent a considerable obstacle when it comes to making significant improvements to profitability. Banks will therefore have additional cost cutting measures on their radar, which could also lead to a further reduction in the number of bank branches in Germany. Nonetheless, general economic conditions in Germany should remain robust despite flagging momentum and, together with the expected ongoing upturn in demand for loans, should bolster sector development. This is complemented by the ECB’s monetary policy, which is gradually becoming less expansive, and so an upward trend in interest rates should shore up banks’ results of operations. Although fundamental data look set to remain largely stable, (geo) political events such as a prolonged trade conflict or the upcoming Brexit could strain the sector in ways that are difficult to assess.
The reform of the banking sector regulatory framework and the adjustment to the Basel III regulations are also likely to have an impact on the sector in 2019 and beyond, with additional adverse effects despite delaying some measures such as the introduction of an output floor when calculating capital backing. It should also be noted that mounting regulation by supervisory authorities and legislators is continuing to put pressure on income. At the same time, as well as the core areas of capital and liquidity, the concept of sustainability is increasingly filtering through into supervisory regulations. The aim here is not to lose sight of regulatory activities’ fundamental objective – maintaining system stability – and at the same time not to ignore the opportunities banks and the financial market have to combat climate change.
The change in business models will by no stretch be completed in 2019. Restructuring will continue and technological change will continue to influence the German banking sector. For customers, this will be most apparent in payment transactions, the very business area in which most fintech companies operate. Given this, what is urgently required in the banking sector is more investment in information technology. Innovation driven by technology will therefore impact market and competitive structures in the years to come, including in Germany, although not every new product or service will catch on in the long run. Nonetheless, this means that individual banks must show agility and be open to a changing market environment.

Fo
reca
st a
nd o
pport
unit
y r
eport
9
4
Co
mb
ined
ma
na
gem
en
t re
po
rt
Company forecast
General conditions
The following statements on LBBW's company forecast are based on the planning produced at the end of 2018.
The forecast period will likely be marked by ongoing low interest rates in the eurozone, despite the ECB having already cautiously begun to tighten monetary policy. The economy should remain robust, although economic growth is likely to cool off somewhat in Germany and the eurozone in the forecast period. Nonetheless, we consider the risks of the economy continuing to drop off to be far higher than the likelihood of an upturn, a result primarily of current protectionism and Brexit developments. Specific to banks, regulatory requirements are likely to continue to weigh heavily, in particular on the back of increasing regulation of business operations. Moreover, the consistently high level of competitive intensity looks likely to continue to put pressure on banks’ results of operations. Advances in digitalization will call for investments in order to adapt to changing requirements, and this brings with it new opportunities as well as risks.
LBBW’s focus
Even under the challenging conditions described, LBBW, a medium-sized universal bank with the highest standards when it comes to the quality of its services and customer focus, considers itself well positioned on the market. Its strong market position is supported by solid capitalization and a good risk profile, which constitute a stable basis for expanding and refining its customer-oriented business model using the four strategic cornerstones of business focus, digitalization, sustainability and agility.
LBBW pursues its business focus strategic objective by strengthening and bolstering existing customer relationships and creating new, long-term contacts. Established product expertise is to be used even more effectively in customer business by stepping up collaboration. At the same time, stronger and more efficient process and IT structures should cut costs. This is systematically supported as part of digitalization. For example, the aim is to boost customer focus by providing bespoke personal consulting using intelligent systems and by expanding the multi-channel offering. Process and IT structures should also be simplified or automated. The sustainability objective aims to grow the selection of sustainable investment and financing solutions for customers and support customers in their transition towards sustainable business models. Our own vision of who we are as a company also draws heavily on sustainability, for example in human resources. Agility aims to benefit customers by providing quick, uncomplicated and innovative solutions. The organization is also made more flexible and dynamic so that we can respond to rising changes more quickly and effectively. This also generates the potential for cost-savings.
All these measures aim to position LBBW on the market so that it is well prepared to handle future market and customer requirements, not least relating to advances in digitalization, and also to ensure that the Bank can successfully respond to current levels of competition. Even in the event of an economic slowdown, LBBW should also be able to build on its longstanding customer relationships. As well as attempts to bolster customer business, tighter monetary policy should have a positive impact on income in the long-term, with developments in process and IT structures being reflected in lower costs.

Fo
reca
st a
nd o
pport
unit
y r
eport
9
5
Co
mb
ined
ma
na
gem
en
t re
po
rt
Outlook for LBBW
The most significant financial performance indicators for LBBW will likely develop as follows in the 2019 financial year at the Group level, in comparison with the previous year:
Customer focus, in the sense of strengthening existing customer relationships and creating new contacts, will again take center stage in the 2019 financial year. Planned growth should span all customer segments. Total assets, and therefore risk weighted assets in accordance with CRR/CRD IV, at the LBBW Group are expected to pick up moderately year on year by the end of 2019 as a result.
In line with the anticipated performance of risk weighted assets, the common equity Tier 1 capital ratio (»fully loaded«) is expected to be down slightly year on year at the end of 2019, with the total capital ratio (»fully loaded«) decreasing marginally in comparison to the previous year. Nonetheless, LBBW should continue to enjoy solid capitalization. The common equity Tier 1 (CET 1) capital ratio is expected to remain well in excess of the CRR/CRD IV minimum requirements and substantially above the requirement of 9.75%, which also includes the Pillar 2 requirements, the capital conservation buffer (Section 10 c KWG) and the capital buffer for other systemically important institutions (Section 10 g KWG). Even taking into account the extra countercyclical capital buffer to be maintained for a marginal share of foreign receivables (Section 10 d KWG) and the availability of extra common equity Tier 1 capital expected by ECB supervisory authorities in the Pillar 2 Guidance capital recommendation, LBBW’s common equity Tier 1 capital ratio should still perceptibly exceed requirements.
In line with expected development in total assets, the unweighted leverage ratio should be down slightly year on year at the end of 2019 although it should be still significantly higher than the minimum level of 3% stipulated by the Basel Committee.
In relation to economic capital management, the utilization of aggregate risk cover in accordance with the current definition should remain at the previous year's level at the end of 2019, and so LBBW should be able to maintain its very comfortable risk-bearing capacity situation and ensure solid capitalization at all times.
In terms of liquidity, LBBW’s liquidity coverage ratio is likely to be far above the minimum target of 100% by the end of 2019. By the end of 2019, LBBW should also have moderately exceeded the future minimum net stable funding ratio target of 100%, which is increasingly at the heart of LBBW’s integrated bank management.
Against the backdrop of a challenging market environment, LBBW generated consolidated profit before tax of EUR 558 million in the past financial year. Although this demanding market environment is not expected to change, LBBW is anticipating consolidated profit/loss before tax to increase slightly year on year in the 2019 financial year. In particular, it is expected that this will be driven by higher interest and fee and commission income generated by attempts to strengthen existing customer relationships and create new contacts. In the forecast period, with regard to allowances for losses on loans and advances LBBW is likely to continue to benefit from the high quality of the Bank’s credit portfolio and its conservative risk policy. On the contrary, non-recurring positive valuation effects and lower income from sales of securities will probably stunt positive developments somewhat. Administrative expenses are expected to rise only marginally in the forecast period despite expenses incurred in order to achieve planned growth and for some investments aimed at adjusting to changing market and customer demands. We expect to see a moderate increase in expenses for the bank levy and deposit guarantee system. In line with the positive development in earnings forecast, return on equity should be moderately higher than in the previous year at the end of 2019. The cost/income ratio should remain close to the previous year's level.

Fo
reca
st a
nd o
pport
unit
y r
eport
9
6
Co
mb
ined
ma
na
gem
en
t re
po
rt
LBBW is forecasting the following developments for the operating segments in the 2019 financial year.
LBBW expects the earnings before tax of the Corporate Customers segment to be up moderately year on year in the 2019 financial year. The ongoing expansion of customer business is likely to be reflected chiefly in higher net interest and fee and commission income. Allowances for losses on loans and advances look set to see a noticeable dip in comparison to the previous year. Administrative expenses will likely be up marginally against the previous year due to growth targets. At the end of 2019, return on equity should be virtually on par with the previous year’s level, reflecting the forecast development of risk weighted assets under CRR/CRD IV. The cost/income ratio should remain close to the previous year's level, in line with opposing developments in cost and income.
In the 2019 financial year, LBBW expects the earnings before tax of the Real Estate/Project Finance segment to be marginally higher than in the previous year. Although net interest income is set to rise moderately in the forecast period thanks to the ongoing expansion of customer business, administrative expenses are also likely to increase somewhat in order to achieve this growth. In addition, allowances for losses on loans and advances should experience a marked upturn in the forecast period, although they will remain at a low level. Nonetheless, the forecast rise in risk weighted assets due to business growth is expected to bring return on equity noticeably below the previous year’s level in 2019, while the cost/income ratio is likely to remain at the previous year's level.
Following an extraordinarily difficult market environment in the previous year, LBBW expects earnings before tax in the Capital Markets Business segment to climb markedly in the 2019 financial year, essentially driven by income from customer business. Income from sales of securities should fall markedly in the forecast period. Administrative expenses are likely to remain close to the previous year's level. Return on equity looks set to pick up markedly year on year by the end of 2019 in line with the projected profit upturn. The cost/income ratio is also likely to be far above the previous year’s level as a result of income growth.
In the Private Customers / Savings Banks segment, LBBW expects earnings before tax to be significantly up on the previous year in the 2019 financial year as a result of growth targets. Both net interest and fee and commission income should see a moderate increase as a result of expanding customer business. However, administrative expenses are also likely to rise marginally due to some adjustments made to take account of changing market and customer requirements. Furthermore, allowances for losses on loans and advances should increase from a level with net reversals towards a normal level and positive extraordinary effects from measurements should not reoccur. Return on equity should be significantly higher year on year by the end of 2019 in line with projected earnings. The cost/income ratio is also likely to improve moderately.
In its annual financial statements according to the German Commercial Code (HGB) for the 2019 financial year, LBBW (Bank) anticipates a net profit/loss for the year significantly above the previous year's figure. This expected development is essentially in line with IFRS consolidated profit/loss before tax. Under HGB, effects that cannot be deducted or that are only partially effective are offset by anticipated HGB-specific negative effects from pension provisions.
Opportunities and risks
Over the course of the 2019 financial year, the statements made could be positively or negatively affected by the opportunities and risks described below:
Protectionism, for example as seen in the ongoing trade dispute between the US and China, as well as current Brexit developments and structural changes in single sectors could have further repercussions for economic development in Germany and the eurozone, which is in any case expected to cool off. Consideration must also be given to the strained financial situation, in particular in Italy. All this could have consequences for LBBW with regard to the Bank’s customers and could for example result in higher

Fo
reca
st a
nd o
pport
unit
y r
eport
9
7
Co
mb
ined
ma
na
gem
en
t re
po
rt
allowances for losses on loans and advances than planned. The terms of Brexit, which are not yet fully resolved, could also affect LBBW, either through the indirect impact on the financial system or due to direct consequences for LBBW’s operations abroad in the United Kingdom. In addition, low interest rates may persist for longer than anticipated in the forecast period and competition may ramp up, squeezing margins. If regulatory requirements were to tighten unexpectedly in the forecast period, this could also hit harder than anticipated. Within the context of membership of the bank-related guarantee fund of the Landesbanks, payments will be incurred to support NordLB. However, current resolutions state that these will be split over several years and so will have only a marginal impact on LBBW’s net profit/loss for the year. The risk of further payments related to its membership of the bank-related guarantee fund of the Landesbanks still stands, as does the risk of payments in connection with the »European bank levy«, which could lead to further unforeseen strain on LBBW’s results of operations, net assets, financial position and liquidity.
Advances in digitalization make it necessary to adapt to changing market and customer requirements. Although this pressure to adjust does entail risks, it also brings with it opportunities if the Bank adapts particularly well in comparison to the market as a whole, which would allow it to expand its market position.
On the other hand, all the general conditions already described could also open up opportunities for LBBW if the factors develop better than expected. The most important of these is stronger economic performance, which could be achieved if political solutions are found to address the tide of protectionism and Brexit. Particular attention should also be drawn to an interest rate hike at a faster than expected pace, with a positive impact on margins and thus on results of operations.

Exp
lanat
ory
note
s on t
he
annual
fin
anci
al s
tate
men
ts o
f LB
BW
(B
ank)
9
8
Co
mb
ined
ma
na
gem
en
t re
po
rt
Results of operations, net assets and financial position
Business development in 2018
The management of the LBBW Group is generally guided by the IFRS key figures. As a significant part of the Group, LBBW (Bank) is managed in accordance with these figures.
Generally stable general economic conditions in Germany formed the basis of a successful business performance for LBBW (Bank) in 2018. In 2018, the year of the Bank’s 200th anniversary, LBBW (Bank) achieved a solid result overall thanks to its sustainable business model. Despite particular challenges including a demanding market environment and ongoing low interest rates, the Bank continued to make successful progress as a medium-sized universal bank, expanding customer business and enjoying growth in lending and deposits.
Total assets at LBBW (Bank) as at the end of 2018 rose moderately by EUR 6.4 billion or 2.9% to EUR 229.0 billion compared with the previous year. The upturn was shaped primarily by lending growth in business with corporate customers and in real estate. At the same time, LBBW (Bank)’s business volume climbed by EUR 10.8 billion or 4.2% to EUR 266.8 billion.
Operating income/expenses before allowances for losses on loans and advances/remeasurement gain or loss came to EUR 397 million, thus falling slightly short of the EUR 438 million from the previous year. This was largely due to a rise in administrative expenses, which were strained by another drop in the discount rate for pension provisions and the use of new mortality tables for measuring post-retirement obligations. These effects were offset only partially by positive growth in net interest income, net fee and commission income and total operating income/expenses from the trading portfolio. Other operating income/expenses fell, primarily a result of lower real estate sales. A significantly higher net expense from allowances for losses on loans and advances and a remeasurement loss on securities played a major role in the drop in the allowances for losses on loans and advances/remeasurement gain or loss item. The fund for general banking risks in accordance with Section 340 g HGB was reversed. It served mainly to compensate for a special tax effect that had a negative impact on profit/loss after tax. After taking into account the extraordinary result, which was characterized by lower restructuring expenses, net profit/loss before profit appropriation increased to EUR 250 million (previous year: EUR 192 million).
Net profit/loss for the year before tax undershot the target figure for the 2018 financial year slightly, attributable primarily to net interest income falling short of the target figure. Furthermore, net fee and commission income and total operating income/expenses from the trading portfolio were noticeably lower than expected. While administrative expenses remained in line with planning, other operating income/expenses were well in excess of the target figure. Lower than anticipated remeasurement gains/losses in the lending business and a higher than anticipated reversal from the fund for general banking risks in accordance with Section 340 g HGB had a positive impact on earnings.
Explanatory notes on the annual financial statements of LBBW (Bank)

Exp
lanat
ory
note
s on t
he
annual
fin
anci
al s
tate
men
ts o
f LB
BW
(B
ank)
9
9
Co
mb
ined
ma
na
gem
en
t re
po
rt
The financial position of LBBW (Bank) throughout the entire year under review was satisfactory at all times due to the good liquidity. The structural funding of LBBW (Bank) is supported by stable sales of a wide array of funding products thanks to the broad and well-established customer base. Corporate customers and institutional investors, both domestic and international, provided a sustained contribution to the diversification of LBBW's funding. The Bank was always able to obtain funding on the market on the requisite scale. Last year, in addition to private placements, successful benchmark issues were placed on the market in the form of covered bonds and uncollateralized bearer debentures, including the first green bond in the form of a mortgage-backed covered bond in a benchmark format.
Results of operations
Performance figures:
1 Jan. 2018 – 31 Dec. 201
8
1 Jan. 2017 – 31 Dec. 201
7 Change
EUR million EUR million EUR million in %
Net interest income 1,414 1,398 16 1.1
of which current hybrid servicing – 13 – 13 0 0.0
Net fee and commission income 402 368 34 9.3
Net fee and commission income without guarantee commission 402 429 – 27 – 6.3
Guarantee commission for the State of Baden-Württemberg 0 – 61 61 – 100.0
Total operating income/expenses from the trading portfolio 294 291 2 0.8
Administrative expenses1 – 1,752 – 1,683 – 68 4.1
Other operating income/expenses 39 64 – 26 – 39.8
Operating income before allowances for losses on loans and
advances/remeasurement gain or loss 397 438 – 42 – 9.5
Allowances for losses on loans and advances/remeasurement gain or loss – 67 – 44 – 23 53.3
Fund for general banking risks 109 – 31 140 -
Operating income/expenses (result from ordinary business activities) 439 364 75 20.5
Extraordinary result – 35 – 65 30 – 45.8
Partial profit transfer – 44 – 44 1 – 1.9
of which current hybrid servicing – 40 – 41 1 – 1.6
Net profit/loss for the year before tax 360 255 105 41.3
Income taxes – 110 – 63 – 47 75.2
Net profit/loss for the year after tax 250 192 58 30.2
Unappropriated profit/loss 250 192 58 30.2
Rounding differences may occur in this and subsequent tables for computational reasons. 1 In addition to staff costs and operating expenses, this item also includes amortization and write-downs of intangible assets and depreciation and write-downs of property and equipment.
Net interest income at LBBW (Bank) increased slightly in the financial year under review by EUR 16 million to EUR 1,414 million. In the lending business, lending to customers was expanded in individual business areas. Volume growth was seen chiefly in business with corporate customers and real estate, and so pressure on margins from intensive competition for customers in the banking sector was balanced out by business expansion. On the other hand, a positive contribution of EUR 31 million was booked as a result of targeted longer-term refinancing operations (TLTRO II) through the European Central Bank. After selling the final remaining Sealink securities and repaying outstanding loans, a residual amount remained to which the banks in question are entitled. Of this, LBBW (Bank) booked a EUR 33 million share of the surplus as at 31 December 2018. Persistently low interest rates continued to put strain on investments of own funds.

Exp
lanat
ory
note
s on t
he
annual
fin
anci
al s
tate
men
ts o
f LB
BW
(B
ank)
1
00
C
om
bin
ed m
an
age
me
nt
rep
ort
Net fee and commission income again improved year on year, rising by EUR 34 million to EUR 402 million (previous year: EUR 368 million). The main reason for this was the cessation of the guarantee commission to be paid to the State of Baden-Württemberg in the amount of EUR 61 million in connection with the funding of loans to the special-purpose entity Sealink. On the other hand, net fee and commission income fell to EUR 402 million (previous year: EUR 429 million) without the guarantee commission. This was influenced by factors including cautious behavior by customers in the securities business due to volatile stock markets, whereas the placement of issues and the deposit business generated stable results. Net fee and commission income from loans and guarantees was also down year on year. However, transaction-based fees and marginal growth in the card business again boosted earnings in payments. A significant upsurge in asset management, especially in fund consulting services, did not offset sharp declines in brokerage business.
At EUR 294 million, total operating income/expenses from the trading portfolio remained around the previous year's level, improving by EUR 2 million. The trading book result remained high despite tough conditions in capital markets business, although it did fall short of the previous year’s figure. After increasing the allocation pursuant to Section 340e (4) no. 4 HGB last year to such an extent that the extraordinary item amounted to over 50% of the average net income of the last five years, allocations were stopped in the current financial year.
Administrative expenses rose slightly year on year (EUR – 1,683 million) by EUR – 68 million to EUR – 1.752 million, due predominantly to another drop in the discount rate for pension provisions and the use of new mortality tables for measuring post-retirement obligations. Staff costs therefore rose by EUR – 75 million to EUR – 941 million as at year-end 2018 despite countering effects from the reduction of the workforce. Administrative expenses were unchanged from the previous year at EUR – 716 million, reflecting strict cost discipline. A major portion of expenses related once again to the modernization of the IT infrastructure and costs were lowered as a result of savings measures that translated into lower spending on advisory services and work equipment. On the other hand, higher expenses for the bank levy and deposit guarantee system resulting from a change to the assessment base, in particular for the bank levy, increased costs. Amortization and write-downs of property and equipment and intangible assets fell to EUR -95 million (previous year: EUR -101 million). This was attributable chiefly to lower write-downs on intangible assets, which were downstream from the previous years' investments.
Other operating income/expenses fell by EUR – 26 million and came to EUR 39 million (previous year: EUR 64 million). Of this, income from selling properties and equity investments remained down year on year, falling by EUR 70 million to EUR 19 million. This was countered by lower net allocations to provisions at EUR – 6 million (previous year: EUR – 54 million).

Exp
lanat
ory
note
s on t
he
annual
fin
anci
al s
tate
men
ts o
f LB
BW
(B
ank)
1
01
C
om
bin
ed m
an
age
me
nt
rep
ort
Allowances for losses on loans and advances and remeasurement gain or loss fell markedly overall year on year by EUR – 23 million to EUR – 67 million (previous year: EUR – 44 million). A differentiated performance was recorded for the individual subitems:
∙ The remeasurement gain or loss on securities fell considerably to EUR – 8 million, after benefiting from sales of treasury portfolios and totaling EUR 30 million in the previous year.
∙ The remeasurement gain or loss from equity investments and affiliates improved by EUR 26 million to EUR 10 million year on year (previous year: EUR -16 million), thanks primarily to higher reversals of impairment losses due to improved valuations.
∙ Gains/losses from the transfer of losses rose by EUR -1 million to EUR -2 million (previous year: EUR – 1 million).
∙ Allowances for losses on loans and advances rose by EUR 10 million to EUR –67 million at the end of 2018. The higher figure reflects a normalization of the development, but this is still well below the long-term average. In accordance with the economic trend, this figure still illustrates the persistently high quality of LBBW's credit portfolio in its core markets.
The fund for general banking risks in accordance with Section 340 g HGB was reversed in 2018, which served mainly to compensate for a special tax effect that had a negative impact on profit/loss after tax.
On balance, the extraordinary result improved by EUR 30 million to EUR – 35 million (previous year: EUR – 65 million). In the past financial year, the net restructuring expense was cut by EUR 27 million to EUR –13 million (previous year: EUR – 40 million). The new planned measures focus on adjusting the organizational setup and monitoring the product portfolio in selected units in Capital Markets Business. The conversion of the allocation of pension provisions pursuant to the Accounting Law Modernization Act (BilMoG) meant that the extraordinary expense of EUR – 26 million was held constant from the previous year.
Net profit/loss before tax for the 2018 financial year amounted to EUR 360 million overall (previous year: EUR 255 million).
As a result of an extraordinary effect from discounting liabilities related to targeted longer-term refinancing operations (TLTRO II) with the ECB, income taxes rose to EUR – 110 million (previous year: EUR – 63 million). This effect will be reversed in full in the next few years when the liability is repaid.
Net profit/loss for the year after tax rose by EUR 58 million to EUR 250 million (previous year: EUR 192 million).
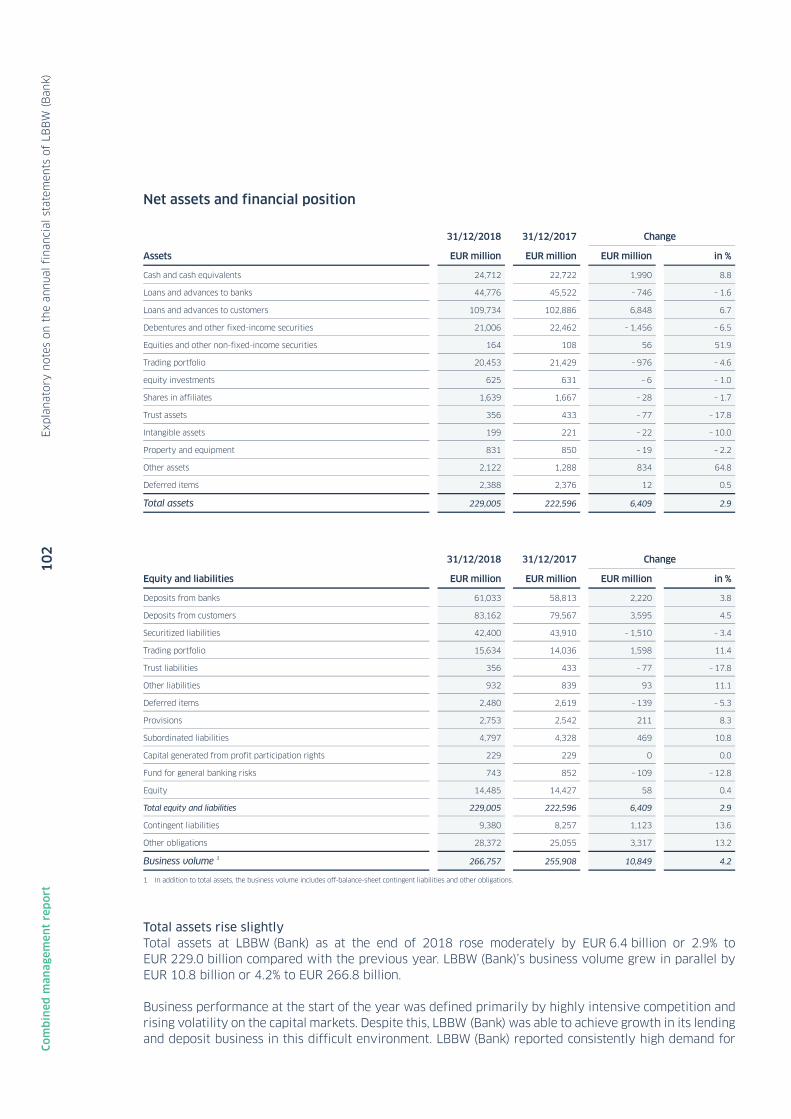
Exp
lanat
ory
note
s on t
he
annual
fin
anci
al s
tate
men
ts o
f LB
BW
(B
ank)
1
02
C
om
bin
ed m
an
age
me
nt
rep
ort
Net assets and financial position
31/12/2018 31/12/2017 Change
Assets EUR million EUR million EUR million in %
Cash and cash equivalents 24,712 22,722 1,990 8.8
Loans and advances to banks 44,776 45,522 – 746 – 1.6
Loans and advances to customers 109,734 102,886 6,848 6.7
Debentures and other fixed-income securities 21,006 22,462 – 1,456 – 6.5
Equities and other non-fixed-income securities 164 108 56 51.9
Trading portfolio 20,453 21,429 – 976 – 4.6
equity investments 625 631 – 6 – 1.0
Shares in affiliates 1,639 1,667 – 28 – 1.7
Trust assets 356 433 – 77 – 17.8
Intangible assets 199 221 – 22 – 10.0
Property and equipment 831 850 – 19 – 2.2
Other assets 2,122 1,288 834 64.8
Deferred items 2,388 2,376 12 0.5
Total assets 229,005 222,596 6,409 2.9
31/12/2018 31/12/2017 Change
Equity and liabilities EUR million EUR million EUR million in %
Deposits from banks 61,033 58,813 2,220 3.8
Deposits from customers 83,162 79,567 3,595 4.5
Securitized liabilities 42,400 43,910 – 1,510 – 3.4
Trading portfolio 15,634 14,036 1,598 11.4
Trust liabilities 356 433 – 77 – 17.8
Other liabilities 932 839 93 11.1
Deferred items 2,480 2,619 – 139 – 5.3
Provisions 2,753 2,542 211 8.3
Subordinated liabilities 4,797 4,328 469 10.8
Capital generated from profit participation rights 229 229 0 0.0
Fund for general banking risks 743 852 – 109 – 12.8
Equity 14,485 14,427 58 0.4
Total equity and liabilities 229,005 222,596 6,409 2.9
Contingent liabilities 9,380 8,257 1,123 13.6
Other obligations 28,372 25,055 3,317 13.2
Business volume 1 266,757 255,908 10,849 4.2
1 In addition to total assets, the business volume includes off-balance-sheet contingent liabilities and other obligations.
Total assets rise slightly Total assets at LBBW (Bank) as at the end of 2018 rose moderately by EUR 6.4 billion or 2.9% to EUR 229.0 billion compared with the previous year. LBBW (Bank)’s business volume grew in parallel by EUR 10.8 billion or 4.2% to EUR 266.8 billion.
Business performance at the start of the year was defined primarily by highly intensive competition and rising volatility on the capital markets. Despite this, LBBW (Bank) was able to achieve growth in its lending and deposit business in this difficult environment. LBBW (Bank) reported consistently high demand for

Exp
lanat
ory
note
s on t
he
annual
fin
anci
al s
tate
men
ts o
f LB
BW
(B
ank)
1
03
C
om
bin
ed m
an
age
me
nt
rep
ort
share-based certificates in its business with banks and savings banks. The cooperation with the savings banks also led to growth in new business in the area of development loans, and there was a marked increase in lending to corporate customers. Furthermore, LBBW (Bank) reported a higher volume in commercial real estate financing with a high share of certified, sustainable real estate.
Sustainability is one of the four strategic cornerstones at LBBW (Bank). LBBW (Bank) was able to underline its strong product expertise in the sustainable issues market segment. In June, it placed its first green Hypothekenpfandbrief with a volume of EUR 500 million and a term of five years. Just in May, LBBW (Bank) became the first continental European bank to issue the largest ever covered bond in the form of a mortgage bond denominated in sterling, with a volume of GBP 750 million and a term of three years.
After the portfolio of the Sealink Funding special purpose entity, in which the securities of the former Sachsen LB were bundled, was sold almost entirely to international investors last year, the final remaining securities from this portfolio were sold in 2018. This allowed Sealink Funding to end the guarantee relationship with the German state of Saxony. LBBW’s guarantee financing loan – which amounted to EUR – 1.8 billion on last count – was repaid in full.
Lending At the end of the year under review cash and cash equivalents came to EUR 24.7 billion. On account of excess liquidity on the money markets, the increase of EUR 2.0 billion was attributable almost exclusively to a high credit balance at central banks.
Loans and advances to banks as at 31 December 2018 declined slightly by EUR – 0.7 billion to EUR 44.8 billion. A fall in business with major European banks led in particular to a EUR – 2.5 billion drop in securities repurchase business and a EUR – 1.5 billion decrease in overnight and term deposits. The stronger development loan business with savings banks resulted in a countervailing effect for public-sector loans, which climbed by EUR 2.2 billion.
The portfolio of loans and advances to customers, in contrast, declined by EUR 6.8 billion and came to EUR 109.7 billion as at the current balance sheet date. The sale of Sealink securities was almost completed at the end of 2017 and the final securities were sold last year. After meeting further conditions, the guarantee finance loan granted to Sealink was then repaid in full, reducing other receivables by EUR – 1.8 billion. By contrast, transactions with corporate customers and real estate financing were particularly expanded.
Debentures and other fixed-income securities declined by EUR – 1.5 billion to EUR 21.0 billion. A EUR 1.5 billion volume increase by private issuers was offset by a decline in bonds and debentures from public-sector issuers of EUR – 2.8 billion.
Trading assets fell compared with the previous year by EUR – 0.9 billion to EUR 20.5 billion. Debentures and other fixed-income securities fell by EUR –0.9 billion and equities and non-fixed income securities by EUR – 0.8 billion due to lower customer activity in the securities business. On the other hand, schuldscheins posted an increase of EUR 1.0 billion.
Funding Compared to year-end 2017, deposits from banks increased by EUR 2.2 billion to EUR 61.0 billion. An upturn in development loans business boosted transmitted loans by EUR 1.4 billion. The volume of overnight and term deposits also saw an upturn of EUR 1.2 billion.

Exp
lanat
ory
note
s on t
he
annual
fin
anci
al s
tate
men
ts o
f LB
BW
(B
ank)
1
04
C
om
bin
ed m
an
age
me
nt
rep
ort
Deposits from customers amounted to EUR 83.2 billion as at 31 December 2018, up EUR 3.6 billion on the previous year. The dissolution of the guarantee relationship with the German state of Saxony in connection with the complete sale of the Sealink portfolio meant that the cash deposits were repaid in full, resulting in a decrease in current account liabilities of EUR –1.8 billion. On the other hand, overnight and term money, in particular, rose by EUR 3.1 billion.
The volume of securitized liabilities declined by EUR – 1.5 billion to EUR 42.4 billion. This drop results primarily from maturing liabilities that were not replaced by corresponding new business in terms of their volume. This caused a EUR– 4.5 billion change in other debentures. Money market transactions are now issued almost solely by the New York branch and saw a rise of EUR 2.9 billion.
Trading liabilities rose against the previous year by EUR 1.6 billion to EUR 15.6 billion. Other financial liabilities increased by EUR 0.7 billion, essentially a result of new business. New issues of structured instruments in the area of derivative financial instruments resulted in a rise of EUR 0.6 billion.
In the reporting year, LBBW (Bank) boosted its subordinate liabilities by EUR 0.5 billion to EUR 4.8 billion, predominantly by way of new issues in far higher volumes than those of the repaid liabilities.
Equity At EUR 14.5 billion as at 31 December 2018, LBBW (Bank)’s equity was virtually unchanged as against 31 December 2017 (previous year: EUR 14.4 billion). Unappropriated profit/loss rose by EUR 0.1 billion. Subscribed capital and retained earnings remained steady year on year after repaying silent partners’ contributions and allocating the profit carryforward.
Financial position The funding strategy at LBBW (Bank) is determined by the Asset Liability Committee (ALCo). Here the Group focuses on ensuring a balanced overall structure in terms of the groups of products and investors used. The financial position of the Group of LBBW (Bank) was satisfactory throughout the entire 2018 reporting year thanks to the good liquidity situation. LBBW (Bank) was always able to obtain funding on the market on the requisite scale.
The Bank has been required to maintain a liquidity coverage ratio (LCR) of 100% since 1 January 2018, and has done so at all times during the year. LBBW (Bank) has outperformed this target substantially at 116.5%.

N
on-f
inan
cial
sta
tem
ent
10
5
Co
mb
ined
ma
na
gem
en
t re
po
rt
Preliminary note
The contents that follow contain the combined non-financial statement for the 2018 financial year of LBBW (Bank) and the LBBW Group within the meaning of sections 289b, 315b of the German Commercial Code (Handelsgesetzbuch – HGB).
LBBW provides comprehensive information on its sustained commitment in its annual Sustainability Report. This report is geared toward the requirements of the Global Reporting Initiative (GRI). The internationally recognized G4 standard was replaced by the latest version of the »GRI Standards« on 1 July 2018. The sustainability report to be published in 2019 will therefore be based on this standard.
In its non-financial statement, LBBW offers a condensed viewpoint on select topics also found in the LBBW Sustainability Report. While the statement follows the model of the GRI, it does not fully comply with the GRI standards.
Business model of LBBW
Information on the LBBW Group's business model can be found on page 27 of the annual report.
Concepts and due diligence processes
Principles and guidelines for implementing LBBW’s sustainability policy and goals
The sustainability policy provides guidelines that form a framework for all sustainability activities at LBBW and forms the basis for integrating economic, ecological and social issues into our business activities as a whole. It encompasses LBBW’s guiding principles for sustainable development in the areas of strategy and management, customers, employees, business operations, social commitment and communication. The sustainability policy is in effect throughout the entire LBBW Group.
For purposes of implementing the sustainability policy, LBBW has defined the following overarching goals:
∙ We want to gradually implement sustainability as an integral part of our business policy. For this reason, we strive for an active focus on projects, products, and services with a positive impact on sustainability.
∙ We offer sustainable investment products to all customer groups and in all asset classes to the greatest extent possible. The goal is to increase the share of sustainable investments in all business areas – including in our own investment portfolio. In credit advisory and credit decision-making, we take into account sustainability risks and earning potential for customers and the Bank. We cultivate a fair, and respectful relationship with our customers based on trust, ensure data protection and transparency, and provide high-quality advice.
∙ We promote the health and performance of our employees with specific measures for this purpose. We ensure a good work-life balance, and promote diversity and equal opportunity within the company. We intend to maintain and further raise the high education and training level in our company.
Non-financial statement

N
on-f
inan
cial
sta
tem
ent
10
6
Co
mb
ined
ma
na
gem
en
t re
po
rt
∙ We will further optimize the use of resources within our organization. Our efforts to reduce the CO2 emissions generated by our business focus on energy usage and business-related travel. We apply sustainability criteria in the selection of products and service providers when procuring materials and awarding contracts.
∙ Beyond providing our banking services, we want to actively contribute to adding value to society. To this end, we are active as a donor and sponsor. In the regions in which we do business, we support education initiatives and a variety of social projects.
∙ We keep our stakeholders informed and engage in a constructive dialog with them.
The overarching goals are broken down into individual targets and specific measures, and put into operation in the annual sustainability program.
Examples from the 2018 Sustainability Program
Measure Date Implementation status
Identification of key performance indicators (KPIs) to measure
sustainability performance in the lending business and regular assessment of these KPIs.
12/2018 The following KPIs were defined for the lending business and
these will also be evaluated in the years ahead:
• Volume of project financing in the renewables portfolio
• Volume of real estate financing with green bond requirements
• Volume of sustainable funds (own business).
Inclusion of another sustainability fund to supplement our sustainable
investments product range: »FOS (family office strategy funds) Yield and Sustainability« (defensive mixed fund from DWS).
12/2018 The sustainability fund »FOS Yield and Sustainability« has been distributed since 11 April 2018.
Seminars: »Healthy leadership for good performance« is designed for
executives and aims to show managers as role models with a knock-on effect in the area of workplace health.
12/2018 Four half-day courses have been held with a total of 20 participants.
The »Principles and guidelines for implementing LBBW’s sustainability policy and goals« serve as concrete guidance when it comes to performing day-to-day activities. In addition to the »sustainability guidelines«, they provide concrete exclusion criteria for individual business ventures and overarching principles such as compliance, human rights and biodiversity. The LBBW climate strategy is also integrated as an overarching principle.

N
on-f
inan
cial
sta
tem
ent
10
7
Co
mb
ined
ma
na
gem
en
t re
po
rt
Management's involvement
LBBW ensures compliance with the sustainability policy through consistent application of a sustainability management system, which covers all divisions and is being implemented in a multistage process throughout the company. At the highest level, LBBW's Board of Managing Directors is responsible for managing the Group sustainably and for complying with its sustainability policy.
Environmental/sustainability management at LBBW is regularly evaluated by top-level management (management review in accordance with ISO 14001). Key issues are presented to the Board of Managing Directors for information or decision-making purposes.
In order to do justice to the increasing importance of sustainability, for a specific time period a central Sustainability project was established in the Group Strategy Department. The following areas of action were defined: Investment Business, Lending Business, Employees, CO2 Footprint, Sustainability Management and Regulatory. The project results were presented in the »Sustainability Steering Committee«. Representatives of Front Office, Back Office and staff units were members of this committee. The project was headed by a member of the BW Bank Board of Managing Directors.
Materiality analysis
LBBW classifies the potential effects of its business activities on its sustainability balance sheet as »slight«, »average«, or »substantial« and bases this on the materiality of the individual issues to its business model and sustainability performance.
Aside from the requirements set by sustainability rating agencies, in particular the expectations and standards of our stakeholders play a material role. The relevant focus areas are aligned to international sustainability standards and to our sustainability policy. The company has defined the respective sustainability measures primarily in areas that have been identified as having a substantial impact on the LBBW sustainability balance.
Sustainability Policy LBBW Group
Umbrella Sustainability Goals
Exclusion criteria Guidelines
General principles Business area-specific guidelines
• Compliance• Human rights• LBBW Climate Strategy• Biodiversity
• Guidelines for Sustainable Investment• Guidelines for Sustainable Financing • Guidelines for Sustainable Human Resources Policy • Guidelines for Sustainable Business Operations P
rin
cip
les
and
Gui
de
lin
es f
or
Imp
lem
enta
tio
n o
f LB
BW
‘s
Sus
tain
abil
ity
Pol
icy
and
Goa
ls

N
on-f
inan
cial
sta
tem
ent
10
8
Co
mb
ined
ma
na
gem
en
t re
po
rt
Some of these key areas are:
∙ sustainability standards in the lending business and financing with a sustainable focus ∙ sustainability standards in the investment business and sustainable investment products ∙ Sustainability in the real estate business ∙ product responsibility/consumer protection ∙ stakeholder dialog
LBBW does not go into greater detail regarding the »use of resources and CO2 emissions« in its nonfinancial statement because these are not deemed to have a substantial effect on LBBW's sustainability balance. It does, however, report on this in more detail in the LBBW sustainability report. This is based on the Bank's environmental management system, which is certified in accordance with ISO 14001 and EMAS. The EMAS regulation calls for this information to be published in the form of an environmental statement, which LBBW has integrated into its sustainability report.
An internal workshop was held in 2014 to direct the focus of sustainability activities even more toward the central topics. The main objective was finding out how future global changes will affect LBBW and what the stakeholders expect of LBBW in this regard. The company delved deeper in 2015 and 2016 and further analyzed the results of the workshop in several rounds of discussions with retail and private banking customers. In 2017, LBBW also carried out a dialog with corporate customers and surveyed the Bank's institutional customers. In 2019, »future dialogs« are to be carried out with customers, politicians, academics and the general public with the aim of developing solutions to the challenges facing the region in future in line with the global sustainability goals.
Sustainable investment products
LBBW actively encourages this interest in sustainable investments and raises public awareness of the concept of sustainability at its in-house and external events. The investment services offered are geared toward the »sustainability guidelines« with the aim of avoiding risks that relate to sustainability and taking advantage of any relevant opportunities. LBBW's goal is ultimately to support its customers to the greatest extent possible when it comes to investing their assets in a responsible, ecological and ethical manner and to prove again and again that financial returns can be combined with value creation for the benefit of society and the environment.
LBBW therefore offers retail, corporate and institutional customers an extensive portfolio of sustainable investment products. The portfolio is geared toward sustainability criteria through voluntary commitments, among other things.
Sustainability PolicySustainability rating agency requirements
Expectations of stakeholdersRegulatory requirements and
sustainability standards
Materiality analysis

N
on-f
inan
cial
sta
tem
ent
10
9
Co
mb
ined
ma
na
gem
en
t re
po
rt
By signing the United Nations’ »Principles for Responsible Investment« (UN PRI), LBBW undertakes to increasingly incorporate aspects of our responsibility for the environment and society as well as corporate governance (environmental, social and corporate governance (ESG)) into analysis and decision-making processes in our investment activities.
In 2018, LBBW expanded its range of sustainable investment solutions, complementing its existing product portfolio in this area.
Green bonds Green bonds finance specific projects related to environmental and climate protection. LBBW aims to actively promote the market development of green bonds and thus launched its own »green bond program« in 2017. Parallel to this, a »Green Bond Committee« was established at LBBW, securing cross-divisional transfer of expertise.
LBBW’s first green bond of EUR 750 million was issued successfully in December 2017. At the time it was the largest green bond from a European commercial bank. With the proceeds, LBBW funds significantly energy-efficient commercial property. LBBW’s second covered bond issue with a volume of EUR 500 million followed in June 2018.
In order to be able to make a substantiated selection of energy-efficient buildings for property portfolios, together with an external real estate expert LBBW developed an approach to measure and compare the carbon intensity of commercial properties when issuing its first green bond.
As the first European commercial bank, in 2018 LBBW obtained certification from the Climate Bonds Initiative (CBI) for recording energy efficiency for exclusively commercial properties. This certification enjoys particular recognition for sustainably oriented investors. Among other things, it confirms compliance of the green bonds with the objectives of the Paris Agreement. Both LBBW green bonds have since been certified in line with the CBI standard.
Asset management in line with ethical, social and ecological criteria
BW Bank offers its customers asset management solutions taking ethical, social and ecological aspects into account. To do this it works with suppliers and asset management companies which assess and classify financial instruments and/or issuers in line with transparent sustainability criteria. With premium mandates the classification as »sustainable« is also made by BW Bank. At the beginning of 2018, a new fund was created especially for foundations (AM Strategy Foundations 30 German Income Tax Act). With the transformation of our AM Strategy Value Strategy 50 to sustainability, BW Bank now also has its first sustainability fund in its asset management range.
At LBBW Asset Management the composition of the investment universe for sustainable funds is based on the ISS-oekom sustainability rating.
Investment business
EUR billion 2018 2017 2016
Volume of sustainable cash investments at LBBW Asset Management Investmentgesellschaft mbH 19.86 19.18 1.02
Volume of sustainable cash investments at BW-Bank-Vermögensverwaltung 0.91 0.79 0.18
The share of sustainably invested or managed assets is approximately 27.6% (LBBW Asset Management) and approximately 12.7% (asset management) of the entire invested capital.
N
on-f
inan
cial
sta
tem
ent
11
0
Co
mb
ined
ma
na
gem
en
t re
po
rt
Sustainable financing
Avoidance of reputation and sustainability risks in financing LBBW is aware of its corporate responsibility in all financing projects. For this reason, we ensure, through mandatory in-house review processes and industry-specific rules, that ecological, social and ethical reputation and sustainability risks are identified, analyzed, and assessed early in the process of deciding on extending credit such as export financing, corporate loans, or project financing. This can result in LBBW rejecting such transactions or terminating business relationships.
Based on the internal lending rules, the respective client advisor also checks loan inquiries in respect to compliance and sustainability risks. In cases of uncertainty or for topics for which there are no binding regulations or checks, the client can request an opinion from Compliance and/or Sustainability Management. To facilitate this, Front Office and Bank Office have specially developed inquiry forms which cover all persons involved, type and purpose of the business relationship, results of previous research, anomalies determined in respect to compliance risks (including money laundering, fraud) or sustainability risks (including topics such as arms, genetic engineering, nuclear power, environmental degradation, protection of species and biodiversity, climate change, labor laws and human rights). After the compliance and/or sustainability experts have made a relevant examination, the responsible client advisor determines if the business is pursued. If this is the case, the relevant sustainability/compliance assessments are integrated into the loan application and appropriate account taken of them in the credit decision.
Our »Principles and Guidelines for Implementation of LBBW's Sustainability Policy and Goals« and the guidelines in the lending business it contains form the basis for sustainability standards for financing.
Alongside legislative requirements and regulations, with its internal policies and instructions LBBW aligns itself to internationally recognized standards and voluntary commitments. In addition to the UN Global Compact, these include the OECD guidelines for multinational enterprises and the performance standards promulgated by the International Finance Corporation (IFC).
The following internal test processes for financing projects, along with others, are implemented at LBBW:
∙ Review process for industry/country risks In order to identify, analyze and assess any sustainability risks in international financing projects, a sustainability review must be carried out for certain loan inquiries in the industries deemed especially relevant, namely mining, petroleum/natural gas, wood/paper and bioenergy, in certain countries sensitive to these industries.
∙ Company exclusion list for controversial weapons systems LBBW does not enter into any business relationships with companies that produce cluster munitions and/or anti-personnel mines, which are prohibited by international conventions. We ensure this at the operational level with a company exclusion list that applies throughout the entire Group at LBBW Bank and all subsidiaries majority owned by LBBW) and is also integrated into the automated embargo monitoring system of the Bank. The exclusion list is updated twice per year based on an external database.
Promotion of renewable energies and energy efficiency LBBW assists retail customers in renovating and modernizing buildings in line with energy-efficiency requirements and arranges related advisory services. It also refers its corporate clients to services to improve energy efficiency upon request.

N
on-f
inan
cial
sta
tem
ent
11
1
Co
mb
ined
ma
na
gem
en
t re
po
rt
In 2018, LBBW again financed projects in the area of renewable energies:
Lending business
EUR billion 2018 2017 2016
Volume of renewable energies project finance (assets) 2.45 2.32 2.34
The share of project financing in the area of renewable energies amounted to approximately 53.2% of the overall portfolio in 2018. This includes not only projects in the area of energy, but also infrastructure and public-private partnership projects.
Product responsibility/consumer protection
The goals and wishes of our customers are the top priority. Integrated advising tailored to customer needs is very important to LBBW. Our customer account managers work with customers to explore their goals – including those beyond investing – and subsequently prepare a personalized »financial plan«. Long-term wealth accumulation and portfolio optimization are at the forefront here.
LBBW offers clear and detailed information on various types of investment and any associated risk. For each investment consultation, we prepare a »Declaration of Suitability«. In the declaration, banks must show in writing how the recommendation given – for example to buy or to sell a product – fits the respective customer and his investment targets, i.e. that it is suitable.
Our advisors are not assigned sales targets for individual securities products. There are no point systems for assessing sales and revenue targets. We are available to provide advice and support to our customers in each phase of life.
Our sustainable approach to financial advising and the rules for systematic implementation and review are set out in the »Leitlinien für die Privatkundenberatung in der BW-Bank« (»Guidelines for retail customer advice at BW-Bank«) (www.bw-bank.de). We foster a business philosophy shaped by sustainability. Fair, responsible and customer-oriented activity is the basis of our business policy. Our advice follows a holistic approach where the focus is the individual requirements of each individual customer. We take up customer suggestions in a continuous improvement process.
Specific work instructions and process guidelines provide the framework for the advising process. Product selection guidelines and review mechanisms aim to ensure that we always focus on the customer’s interests.
Compliance (combating corruption and bribery)
Responsible business activities are based on compliance with external and internal rules and laws. Effective compliance management prevents in particular criminal activities such as money laundering, terrorism financing, fraud, corruption or insider trading and monitors compliance with data protection and finance sanctions.
Compliance training All employees must take tutorials on fraud prevention and sustainability. Tutorials on money laundering and finance sanctions/embargoes and on capital market topics are to be taken in line with the employee’s area of work. Currently the average completion rate of the respective web-based training is approximately 98% (as at December 2018). The low percentage of employees who have not completed tuition results from long-term illnesses or job changes within the divisions.
N
on-f
inan
cial
sta
tem
ent
11
2
Co
mb
ined
ma
na
gem
en
t re
po
rt
Code of conduct Sustainable business success is based on trust. In the long term, LBBW will only be competitive if it meets its responsibility to customers, shareholders, competitors, business associates, supervisory authorities and, not least, its own employees. Therefore, unconditional compliance with all statutory provisions and internal rules as well as the integrity of each individual employee constitute the foundations of sustainable corporate governance. For this purpose, a code of conduct was adopted as an overarching guideline. This code applies to LBBW and its subsidiaries. The aim of the code is to create a reliable, normative frame of reference or guidance for responsible action by each individual that satisfies the legal requirements and is in line with ethical and societal standards. In recent years, digitalization, more stringent regulatory provisions and new ways of working have become part and parcel of the everyday working life at the Bank. The Group Compliance division updated and extended the Code of Conduct in May 2018. The new Code was further enhanced and detailed with topics such as competition and cartel law, a whistleblower system and culture of constructive criticism. In the new Code, LBBW recognizes the United Nations’ Universal Declaration of Human Rights for all people in the world and expects this from its contractual partners. The importance of sustainability opens up a new chapter on responsibility in society and deploys sustainability policy and targets as well as the relevant principles and guidelines for their implementation.
Compliance function pursuant to MaRisk More than ever, it is important that the company react quickly to critical developments and make sound decisions based on reliable data. This means preparing risk information in a timely fashion, providing substantive risk reporting and agile risk management, and above all establishing a culture of corporate compliance that exemplifies a responsible risk culture.
For this purpose, the German Federal Financial Supervisory Authority (BaFin) provided more details on the »minimum requirements for risk management (MaRisk)« of banks and financial service institutions using the German Banking Act as a basis in its Circular 9/2017. LBBW has established a compliance function that meets the requirements in accordance with MaRisk and is directly integrated into its basic procedures. The key legal regulations and stipulations for the Bank are continually identified, including risk-based monitoring to ensure compliance with all appropriate, effective procedures.
Compliance function pursuant to MaComp In line with the »Minimum Requirements for the Compliance Function and Additional Requirements Governing Rules of Conduct, Organization and Transparency for Investment Services Enterprises«, the Compliance function ensures compliance with all legal regulations pertaining to securities products and the relevant stipulations of supervisory authorities. To this end, it issues internal guidelines and work instructions which serve as guiding principles. A risk analysis is performed once a year. Among other factors, this focuses on the relevant statutory regulations and an analysis of individual risks.
Compliance with external and internal conditions is monitored on an ongoing basis. This is done not only on the basis of central examinations of documents, processes and instructions, but also with local checks, e.g. in the branches, the advisory centers and central units. If improvements are required, the Compliance function pursuant to MaComp works together with the areas impacted to achieve implementation in line with regulations.

N
on-f
inan
cial
sta
tem
ent
11
3
Co
mb
ined
ma
na
gem
en
t re
po
rt
The Compliance function pursuant to MaComp retains the task of preventing market abuse and securing the financial market regulations requirements of MiFID II. For this reason, compliance on regulations regarding employee transactions, on avoiding insider transactions and market manipulation are monitored.
In line with the requirements of the Compliance function pursuant to MaComp, conflicts of interest in connection with investment and ancillary (non-core) services are to be avoided. In the matter of identifying, avoiding and managing conflicts of interests, LBBW employees of the Compliance function pursuant to MaComp provide advice.
Compliance function for the avoidance of money laundering In their function as financial intermediaries, banks are particularly exposed to the risk of being abused for money laundering purposes. Accordingly, the LBBW Group developeds appropriate Group-wide business and customer-related security systems and controls for preventing money laundering and terrorism financing. These include, for example, rules on relationships with politically exposed persons, the process for accepting applications from new customers, the updating of customer data and continual monitoring of business relationships as well as the integration of the Anti Money Laundering Officer in the New Product Process.
Compliance function for the prevention of fraud and corruption At LBBW, the purpose of fraud prevention is to prevent criminal acts that could expose the assets of LBBW or its customers to the risk of loss or could harm the LBBW Group's reputation. Risks are analyzed, leading indicators are tracked, and transaction and customer-related security systems and controls are implemented. The annual risk analysis identifies and evaluates all potential internal and external risks relating to criminal offenses that are relevant to the Bank and the Group. Using this as a basis, suitable preventive measures are then developed. At a general level, LBBW aligns itself to the OECD guidelines for multinational enterprises which also includes recommendations on dealing with corruption.
The regulatory framework for combating criminal offenses for the Bank and the Group includes all preventive measures and general organizational requirements (e.g. paths for reporting suspicions). An example of how these regulations are implemented is the policy for acceptance and granting of benefits (gifts, invitations, events). Abuses or suspicious activities can also be reported anonymously via an external ombudsman. This possibility has been implemented across the group in the branches and in the subordinated companies of the LBBW Group.
In 2018, there were no corruption cases against LBBW (Bank) or subsidiaries integrated into sustainability management.
Financial sanctions/embargoes LBBW is obligated to initiate measures to ensure compliance with national and international financial sanctions and embargo regulations. Financial sanctions result in restrictions to capital movements and payments, whereas embargoes limit the freedom of foreign trade.
Measures and organizational requirements for the Bank and the Group are defined in the internal rules. For example, all international payments and the entire LBBW customer portfolio are compared automatically on a daily basis against all national and international sanction and embargo lists. The same applies to the internal company exclusion list on cluster munitions and anti-personnel mines. The necessary processes and IT-supported testing methodology are firmly established internally.

N
on-f
inan
cial
sta
tem
ent
11
4
Co
mb
ined
ma
na
gem
en
t re
po
rt
Employee matters
LBBW is very demanding of itself and hence of its workforce. At the same time, it offers highly attractive workplaces with development potential for ambitious employees who take pleasure in success. As an attractive employer, the Bank has always offered a wide range of training opportunities and extensive solutions for achieving a good work-life balance. It also invests in the health of its workforce. The personal development activity is designed using the »guidelines« of sustainable human resource work as a basis.
Personnel development In order to remain competitive in the future, the conditions are created to leverage potential within the Bank in an even better manner. In the context of its talent management, the Bank also has a particular focus on promoting top talents. Our objective is to considerably strengthen internal senior management candidates in the competition for key positions and thus retain them for the company. To do this, for the first time, the Bank started in 2018 with the development of two top management talent groups, with the objective of providing an attractive range of individual and joint development measures for the internal competition. LBBW (Bank) offers a comprehensive internal training program to ensure the focused qualification of all its employees. This comprises seminars and training opportunities that also include training in methodological and social competence alongside the focus on technical qualifications. These are supplemented by training to optimize foreign language skills together with subject-specific seminars run by external providers. Employees wishing to expand their business management skills also have the option of attending part-time university courses while continuing their employment. At the same time, it includes specific offerings for executives on personnel management and the careful handling of the Bank's own and external resources. LBBW's employees took advantage of the education opportunities on offer approximately 8,600 times in 2018.
A number of individual workshops were held in 2018 for the purpose of making the change processes within LBBW successful. A number of managers and their teams took part. The focus was on general challenges in change management processes, specific requirements in practice and agile work methods.
In addition, managers can take advantage of the LBBW management consulting team's coaching workshop to receive individual consulting and support relating to management and personality.
Key figures for LBBW (Bank)1,2
2018 2017 2016
Average age 45.3 44.8 44.2
Average length of service in years 19.4 18.9 18.3
1 The data basis for the calculation of the HR figures is the number of »active employees« as defined by HGB (excluding interns, student trainees, students at universities of cooperative education, temporary staff, employees on leave and members of controlling bodies).
2 Approximately 82% of Group employees are covered by LBBW (Bank).
Diversity In 2018, LBBW joined »Initiative Chefsache« (www.initiative-chefsache.de), a network to promote a balanced ratio of women and men in management positions. In addition, LBBW (Bank) has been aligned with the »Diversity as Opportunity – German Corporate Diversity Charter« initiative (www.charta-der-vielfalt.de) for years and so has committed itself to ensuring a workplace free of prejudice for all employees.

N
on-f
inan
cial
sta
tem
ent
11
5
Co
mb
ined
ma
na
gem
en
t re
po
rt
Promoting the careers of women LBBW (Bank) plays an active role in supporting women's career opportunities, with the goal of making competition for positions fair and thus significantly increasing the percentage of women in mid to upper management positions. To this end, we have established a comprehensive concept, which includes a mentoring program as well as individual career planning seminars. This guarantees that women's leadership potential and career ambitions are both recognized early on and supported in the long run. In the segment of females senior management candidates, a separate top management potential program was established in which ten women are to be prepared for top management positions over a period extending three years.
Key figures for LBBW (Bank)/diversity1,2
2018 2017 2016
Percentage of female employees 52% 53% 52%
Percentage of women in leadership positions 18.7% 17.2% 16.9%
Percentage of severely disabled employees or equivalent status3 5.0% 5.0% 4.8%
Percentage of employees with a foreign nationality 5.7% 5.6% 5.6%
1 The data basis for the calculation of the HR figures is the number of »active employees« as defined by HGB (excluding interns, student trainees, students at universities of cooperative education, temporary staff, employees on leave and members of controlling bodies).
2 Approximately 82% of Group employees are covered by LBBW (Bank). 3 The number of severely disabled employees or those with equivalent status can vary depending on the date of compilation, due to the retroactive recognition of an employee's status as
severely disabled. This may lead to discrepancies between the information contained in the non-financial statement of the Management Report and the LBBW Sustainability Report.
Additional information on the topic of diversity is available in the Human Rights section (see page 117).
Work-life balance To provide the best possible work-life balance, LBBW offers various options for flexible working hours. As helping parents find childcare services is a matter of course for us as an employee-oriented company, we also allow scope for, for instance, sabbaticals.
Support for employees who are caring for elderly relatives or disabled family members is also becoming increasingly important. Subject to prior consultation with their managers, employees who care for a family member can apply for an additional six months' leave over and above the statutory entitlement of six months. The »Pflegefall, was nun?« (Care required, what now?) seminar, which over 600 employees have attended so far, provides our employees with an overview of issues including long-term care insurance and financing of costs, dealing with home nursing services, legal precautions, and counseling centers.
Support in childcare is another offering. The Bank's employees at all head offices can utilize childcare services. These include children's day care services, emergency childcare and special arrangements during school holidays. We offer all employees an advisory and support program provided by a third-party service provider, pme Familienservice. In addition to the parental leave time guaranteed by law, mothers and fathers who have been employed by LBBW for at least three years prior can take a leave of absence called a »family year«
The conditions underlying HR policy that have been created at LBBW provide an important contribution to ensure that the constantly changing requirements regarding the work-life balance are met. Thus in December 2018 a service agreement was published regulating mobile working.
The effectiveness of the measures offered were confirmed in the audit process conducted by berufundfamilie Service GmbH, an initiative of the non-profit Hertie Foundation. Bearing the seal since 2010, LBBW is audited regularly at three-yearly intervals.
N
on-f
inan
cial
sta
tem
ent
11
6
Co
mb
ined
ma
na
gem
en
t re
po
rt
Company health management LBBW's Company Health Management (CHM) is tasked with promoting the health and wellness of employees in the workplace, thereby maintaining and improving motivation and performance.
Although the generally accepted factors with a major effect on workplace health – ergonomics and occupational psychology – are taken as a starting point, LBBW’s health efforts delve deeper into the structure and design of the working environment. Leadership and communication styles are of central importance in this regard. CHM therefore takes an interdisciplinary approach and answers to the head medical officer of LBBW in his post as the head of the Health Management department.
Occupational health service As the primary point of contact, the Occupational Health Service supports and advises all employees in basically all health-related matters while maintaining strict doctor-patient privilege. In addition to typical workplace and socio-medical issues such as returning to work after a physical or mental illness, the Occupational Health Service is also available for behavioral and environmental prevention, first aid, emergency medical care/services, travel medicine, general medical care and vaccinations. These services are closely integrated with those offered by the Social Services Department and Company Health Management at LBBW to create a model that our employees can access to develop their own personal health strategy.
Welfare department The Welfare department advises employees and executives at the sites in Stuttgart, Karlsruhe, Mannheim, Mainz and Leipzig as well as branch employees on topics such as stress, conflicts and difficult situations at work, mental health issues (burnout, depression), addiction, and personal issues (such as the death of a loved one). Preventive advising on matters like resilience and healthcare is also offered. After an acute crisis situation such as a serious accident, sudden death or bank robbery, the Welfare Department offers immediate emergency psychological care. This can help prevent or mitigate any possible subsequent health consequences or absences. In individual cases, employees can also be referred to external counseling centers, clinics or psychotherapists.
In addition to one-on-one advising, the Welfare Department also offers employees and managers workshops, training courses and presentations covering psychosocial issues such as burnout prevention, dealing with difficult situations with customers or resilience.
LBBW improvement process The challenges of the market mean that ongoing development of our products and business processes is essential. The opportunities resulting from digitalization should and must be leveraged in all segments of the Bank so as to offer customers innovative products with the highest quality standards on a sustainable basis. With the LBBW improvement process, all employees are encouraged to use their ideas to bring LBBW forward, helping to design excellent process and work flows.
In 2018, employees were involved in moving LBBW forward with 5,025 (+16.5%) improvement proposals. These ideas generated a benefit of EUR 36.9 million (up 34.6%). This impacts positively on our products, the work flows and their costs.

N
on-f
inan
cial
sta
tem
ent
11
7
Co
mb
ined
ma
na
gem
en
t re
po
rt
Particularly agility as strategic priority results in employees being involved with transformation on an ongoing basis, thus generating improvements at all levels of work. (Alongside business focus, digitalization, sustainability, agility is one of LBBW’s four strategic cornerstones.) With this plethora of ideas, the LBBW improvement process makes a valuable contribution to the corporate culture and to the business success, and thus to move forward along the path to being the best medium-sized universal bank.
Social matters
Investing in education is investing in the future – and the rewards are the highest when as much practical training as possible is provided. As a public-sector bank with regional roots, LBBW takes its social mandate seriously and actively helps to increase young people’s familiarity with the business world while giving students early guidance in choosing their career. In doing so, we do not only want to convey knowledge but also reinforce social skills and awareness of responsibility for the sustainable development of society.
Donations are an important part of LBBW’s commitment to society. Donations are primarily focused on social, cultural and scientific projects. In keeping with our strong regional roots, we generally support recipients in our regional core markets.
As sponsor LBBW supports projects and cultural instructions in the regions it does business, with a focus in Baden-Württemberg. In addition to musical establishments, such as Stuttgart Opera House and Nationaltheater Mannheim, we also sponsor sporting events including the renowned STUTTGART GERMAN MASTERS equestrian competition. Moreover, LBBW participates in various community projects, a successful example of which is Kinderspielstadt Stutengarten (Stutengarten play city for children).
The Landesbank Baden-Württemberg Foundation has sponsored nearly 10,800 projects since being founded in 1984, with a total of EUR 25.5 million. LBBW’s foundation activities aim to have as broad an effect as possible, to promote young people and to provide help to a continual stream of new initiatives.
Human rights
Company policy To enforce its sustainability Policy and sustainability goals, LBBW has defined principles and guidelines as a basis for orientation. Our commitment to the protection of human rights states, »As part of the international community, we are committed to the United Nations’ Universal Declaration of Human Rights«.
Supply chain
Supplier registration Activities with our suppliers are based on supplier registration. In order to be an approved supplier of LBBW, among other things questions about sustainability issues must be answered on LBBW's supplier portal. Every supplier is additionally required to acknowledge the »Sustainability agreement for LBBW suppliers« when registering with LBBW and sign it when entering into a contract. This agreement compels our suppliers to comply with what we consider to be essential environmental and social criteria. Any supplier violating the social standards contained in the Sustainability Agreement (e.g., prohibition against human rights abuses, such as child labor) must accept such violation as grounds for termination of the Agreement without notice.
LBBW expects from its suppliers that they commit to taking responsibility for environmental, economic, social and community issues in all areas of their business activities to the same degree as LBBW.
N
on-f
inan
cial
sta
tem
ent
11
8
Co
mb
ined
ma
na
gem
en
t re
po
rt
Central purchasing Centrally organized purchasing operations and binding Bank-wide standards enable us to ensure that sustainability issues are factored into investment decisions and, in cases where several product alternatives with comparable quality and cost are available, the best product in terms of sustainability is chosen. On the one hand, this enables us to guarantee that the manufacture and use of products at LBBW meet the highest sustainability standards possible. On the other hand, it allows us to promote environmentally and socially aware policies and business practices by our business partners.
Customer relationships In its guidelines on the loan business and those for retail customer advice, LBBW incorporates sustainability aspects in terms of the observance of human rights (see pages 110 and 111).
Treatment of our employees
Co-determination and representation of employees with disabilities Co-determination at LBBW is based on the State Employee Representation Act for Baden-Württemberg. Staff meetings are held regularly at LBBW’s larger locations. Employees have the right to exercise the freedom of association and assembly throughout the Group. LBBW employees who hold severely disabled status are advised and represented by the General Representative Body for the Severely Disabled (GSBV – Gesamtschwerbehindertenvertretung) and five regional representative bodies for the severely disabled.
Diversity A Diversity Officer is assigned to supervise and support diversity and equal opportunity efforts at LBBW. According to a works agreement on protection from discrimination and a cooperative environment in the workplace, employees who feel discriminated against may turn to the Staff Council, the representative for employees with disabilities, the responsible manager, the Welfare department or the complaints board.
Training All of LBBW's employees must complete the e-learning tool »Fraud prevention and sustainability« and the tool for implementing the General Act on Equal Treatment (Allgemeines Gleichbehandlungsgesetz). The e-learning tools include human rights issues.
Environmental management system
Our environment and sustainability management system is applicable to LBBW (Bank) (including BW Bank and LBBW Rheinland-Pfalz Bank) and the wholly owned subsidiaries GastroEvent GmbH, LBBW Immobilien Management GmbH, BW Immobilien GmbH and LBBW Asset Management Investment-gesellschaft mbH.
Certification EMAS and ISO 14001 LBBW has committed to complying with the standards of the Eco-Management and Audit Scheme (EMAS) and ISO 14001, and has maintained a certified environmental management system since 1998. The implementation of the Scheme and ISO standard is verified once a year by means of an internal and an external audit. Both audits were performed successfully in 2018.
The following are validated according to EMAS and certified according to ISO 14001:
∙ four Am Hauptbahnhof buildings and two buildings located at »Pariser Platz« in Stuttgart, ∙ the »Fritz-Elsas-Strasse 31« building (known as the »Bollwerk« building) in Stuttgart, ∙ the »Königstrasse 3« building in Stuttgart, ∙ the »Kleiner Schlossplatz 11« building in Stuttgart, ∙ the »Augustaanlage 33« building in Mannheim

N
on-f
inan
cial
sta
tem
ent
11
9
Co
mb
ined
ma
na
gem
en
t re
po
rt
Results of the concepts
Sustainability ratings
∙ ISS oekom gave LBBW an overall grade of C+ on a scale of A+ to D-. This result puts LBBW in 4th place out of a total of 88 banks analyzed internationally in the »Financials/Public & Regional Banks« segment as at March 2018. LBBW meets the minimum standards for sustainability management defined by ISS-oekom and is ranked »Prime«.
∙ In imug's Sustainability Rating of Bank Bonds 2017, LBBW was evaluated positively (BB). It was thus ranked No. 1 from 29 within the state and savings bank sector, and No. 4 from 169 banks examined across Europe. In addition, LBBW was assessed very positively as an issuer of public-sector bonds (A) and positively for mortgage-backed covered bonds (BBB) (April 2018).
External and internal audits
During the internal and external audits in 2018, no substantive violations of environmental law were uncovered.
Material risks and how they are handled
Risk Management at LBBW is defined as the use of a comprehensive range of tools to manage risks – including reputation risks – within the scope of LBBW’s potential to bear risk and the strategy laid down by the Board of Managing Directors.
∙ The non-transaction-related management of reputation risk is the responsibility of the »Group Communication/Marketing/Board of Managing Directors' Office« and »Compliance« departments.
∙ The transaction-related management of reputation risks, such as evaluating new business, is conducted peripherally by the front-office units, especially in the course of the New Product Process (NPP) and credit application process. There is a product certification process upstream of the NPP for OTC derivatives relating to interest-rate, currency and commodity management.
∙ The Compliance division and the Sustainability Management group support the relevant front office divisions in their day-to-day business in identifying and assessing transaction-related reputation risks.
The risk management guidelines set out the main principles for the consideration of opportunities and risks within the LBBW Group and form the basis of a uniform Group-wide understanding of the Bank's goals in connection with risk management.
For additional information see page 44.

Consolidated financial statements
Contents Income statement 122 Statement of comprehensive income 123 Balance sheet 125 Statement of changes in equity 126 Cash flow statement 128 Notes and additional disclosures in accordance with Section 315e HGB 130
Basis of Group accounting 130 Accounting policies 130
1. Accounting principles 130 2. Changes and estimates 131 3. Basis of consolidation 142 4. Principles of consolidation 145 5. Currency translation 146 6. Government grants 146 7. Cash and cash equivalents 146 8. Financial instruments 147 9. Shares in investments accounted for using the equity
method 160 10. Non-current assets held for sale and disposal groups 160 11. Intangible assets 161 12. Investment property 161 13. Property and equipment 163 14. Leasing business 164 15. Income taxes 165 16. Other assets and other liabilities 166 17. Provisions 166 18. Equity 171
Segment reporting 173 Notes to the income statement 181
19. Net interest income 181 20. Net fee and commission income 182 21. Net gains/losses on remeasurement and disposal 183 22. Other operating income/expenses 187 23. Administrative expenses 188 24. Net income/expenses from restructuring 189 25. Income taxes 190
Notes to the balance sheet 194 26. Cash and cash equivalents 194 27. Financial assets measured at amortized cost 194 28. Financial assets measured at fair value through other
comprehensive income 196 29. Financial assets designated at fair value 197 30. Financial assets mandatorily measured at fair value
through profit or loss 197
31. Shares in investments accounted for using the equity method 199
32. Non-current assets held for sale and disposal groups 199 33. Intangible assets 200 34. Investment property 202 35. Property and equipment 203 36. Income tax assets 204 37. Other assets 205 38. Financial liabilities measured at amortized cost 205 39. Financial liabilities designated at fair value 210 40. Financial liabilities mandatorily measured at fair value
through profit or loss 210 41. Provisions 211 42. Income tax liabilities 217 43. Other liabilities 217 44. Equity 217
Notes on financial instruments 219 45. Allowances for losses on loans and advances and gross
carrying amounts 219 46. Counterparty risk 221 47. Determining fair value 227 48. Fair value of financial instruments 232 49. Fair value hierarchy 236 50. Financial instruments designated at fair value 251 51. Equity instruments voluntarily measured at fair value
through other comprehensive income 253 52. Net gains/losses from financial instruments 253 53. Maturity analysis 253 54. Issuing activities 254 55. Transfer of financial assets 254 56. Collateral 256 57. Offsetting financial assets and liabilities 256 58. Hedge accounting 259
Other information 261 59. Disclosure of Interests in Other Entities 261 60. Leases 267 61. Related party disclosures 269 62. Off-balance-sheet transactions 271 63. Capital management 273 64. Events after the balance sheet date 276
Additional disclosures in accordance with Section 315e HGB 277
65. List of shareholdings and information on subsidiaries, associates and joint ventures 277
66. Employees 289 67. Executive and supervisory bodies and positions
held 290
Consolidated financial statements

In
com
e st
atem
ent
12
2
Co
nso
lid
ate
d f
ina
nci
al
sta
tem
en
ts
for the period 1 January to 31 December 2018
EUR million Notes 01/01 –
31/12/2018 01/01 –
31/12/2017¹
Interest income and current income from equity instruments 13,966 12,187
Interest expense and current expense from equity instruments – 12,408 – 10,601
Net interest income 19 1,558 1,587
Fee and commission income 643 649
Fee and commission expense – 129 – 115
Net fee and commission income 20 513 534
Net gains/losses on remeasurement and disposal 21 222 289
of which allowances for losses on loans and securities2 – 142 – 93
Other operating income/expenses 22 140 101
Administrative expenses 23 – 1,773 – 1,824
Expenses for bank levy and deposit guarantee system – 89 – 69
Guarantee commission for the State of Baden-Württemberg 0 – 61
Net income/expenses from restructuring 24 – 12 – 41
Consolidated profit/loss before tax 558 515
Income taxes 25 – 139 – 97
Net consolidated profit/loss 420 419
of which attributable to non-controlling interests after tax 0 2
of which attributable to shareholders after tax 420 416
1 The previous year’s figures based on IAS 39 were transferred to the structure of the IFRS 9 scheme without adjustments. 2 Relates to the category »Financial assets measured at amortized cost«. In addition, the allowances for losses on loans and advances for »Financial assets measured at fair value through other
comprehensive income« is attributable to a net reversal of EUR 1 million in the current year and a net addition of EUR 8 million in the previous year.
Income statement

St
atem
ent
of
com
pre
hen
sive
inco
me
12
3
Co
nso
lid
ate
d f
ina
nci
al
sta
tem
en
ts
for the period 1 January to 31 December 2018
EUR million Notes 01/01 –
31/12/2018
Net consolidated profit/loss 420
Net consolidated profit/loss in equity
Items that will not be transferred subsequently to the income statement
Retained earnings 18.44
Actuarial gains/losses before tax – 53
Income taxes 25 16
Measurement gains/losses from own credit rating 18.44
Measurement gains/losses from own credit rating before tax 39
Income taxes 25 – 12
Measurement gains/losses from equity instruments (financial assets measured at fair value through other
comprehensive income) 18.44
Measurement gains/losses before tax – 60
Measurement gains/losses from investments accounted for using the equity method 3
Income taxes 25 5
Items that will be transferred subsequently to the income statement when specific conditions are met
Measurement gains/losses from debt instruments (financial assets mandatorily measured at fair value through
profit or loss) 18.44
Measurement gains/losses before tax – 270
Change in allowances for losses on loans and advances – 1
Transferred to income statement 37
Income taxes 25 71
Changes before tax 3
Total net consolidated profit/loss in equity – 221
Net consolidated total comprehensive income 198
of which attributable to shareholders after tax 198
Statement of comprehensive income

St
atem
ent
of
com
pre
hen
sive
inco
me
12
4
Co
nso
lid
ate
d f
ina
nci
al
sta
tem
en
ts
for the period 1 January to 31 December 2017
EUR million Notes 01/01 –
31/12/2017
Net consolidated profit/loss 419
Net consolidated profit/loss in equity
Items that will not be transferred subsequently to the income statement
Retained earnings
Actuarial gains/losses before tax 20
Income taxes 10 – 5
Measurement gains/losses from own credit rating
Measurement gains/losses from own credit rating before tax – 19
Income taxes 10 5
Items that will be transferred subsequently to the income statement when specific conditions are met
Revaluation reserve
Gains/losses on AfS financial assets before tax 178
Transferred to income statement – 133
Income taxes 10 1
Measurement gains/losses from investments accounted for using the equity method
Changes before tax 2
Currency translation differences
Changes before tax – 12
Total net consolidated profit/loss in equity 38
of which from non-current assets held for sale and disposal groups – 28
Net consolidated total comprehensive income 456
of which attributable to non-controlling interests after tax 2
of which attributable to shareholders after tax 454

B
alan
ce s
hee
t 1
25
C
on
soli
da
ted
fin
an
cia
l st
ate
me
nts
as at 31 December 2018
Assets
EUR million Notes 31/12/2018 31/12/2017¹
Cash and cash equivalents 7.26 24,721 22,729
Financial assets measured at amortized cost 8.27 157,127 157,494
Loans and advances to banks 46,749 48,179
Loans and advances to customers 109,231 107,652
Debentures and other fixed-income securities 1,146 1,663
Financial assets measured at fair value through other comprehensive income 8.28 22,821 21,185
Financial assets designated at fair value 8.29 1,207 732
Financial assets mandatorily measured at fair value through profit or loss 8.30 29,803 30,654
Shares in investments accounted for using the equity method 9.31 266 245
Portfolio hedge adjustment attributable to assets 8 569 606
Non-current assets held for sale and disposal groups 10.32 24 104
Intangible assets 11.33 224 244
Investment property 12.34 697 554
Property and equipment 13.35 463 482
Current income tax assets 15.25.36 142 92
Deferred income tax assets 15.25.36 1,133 1,016
Other assets 16.37 2,017 1,575
Total assets 241,214 237,713
1 The previous year’s figures based on IAS 39 were transferred to the structure of the IFRS 9 scheme without adjustments.
Equity and liabilities
EUR million Notes 31/12/2018 31/12/2017¹
Financial liabilities measured at amortized cost 8.38 190,388 191,105
Deposits from banks 63,585 61,895
Deposits from customers 82,481 79,415
Securitized liabilities 38,827 44,432
Subordinated capital 5,495 5,364
Financial liabilities designated at fair value 8.39 7,613 2,726
Financial liabilities mandatorily measured at fair value through profit or loss 8.40 24,478 25,196
Portfolio hedge adjustment attributable to liabilities 8 297 239
Provisions 17.41 3,916 3,796
Current income tax liabilities 15.25.42 32 47
Deferred income tax liabilities 15.25.42 27 28
Other liabilities 16.43 1,283 1,199
Equity 18.44 13,179 13,377
Share capital 3,484 3,484
Capital reserve 8,240 8,240
Retained earnings 970 820
Other comprehensive income 45 371
Unappropriated profit/loss 420 416
Shareholders’ equity 13,159 13,331
Equity attributable to non-controlling interests 20 46
Total equity and liabilities 241,214 237,713
1 The previous year’s figures based on IAS 39 were transferred to the structure of the IFRS 9 scheme without adjustments.
Balance sheet

St
atem
ent
of
chan
ges
in e
quit
y
12
6
Co
nso
lid
ate
d f
ina
nci
al
sta
tem
en
ts
for the period 1 January to 31 December 2018
EUR million
Share capital Capital reserve
Retained
earnings
Valuation
reserve for
equity
instruments
Valuation
reserve for debt
instruments
Equity as at 31 December 2017 3,484 8,240 820 345 – 52
Reclassification of opening balances due to adoption of IFRS 9 0 0 125 – 80 0
IFRS 9 effects of first-time adoption 0 0 – 167 0 8
IFRS 15 effects of first-time adoption 0 0 2 0 0
Adjusted equity as at 1 January 2018 3,484 8,240 779 266 – 43
Allocation to retained earnings 0 0 416 0 0
Distribution to shareholders 0 0 – 173 0 0
Capital increase/capital decrease 0 0 0 0 0
Changes in the scope of consolidation 0 0 – 17 0 0
Net consolidated profit/loss in equity 0 0 – 37 – 54 – 163
Net consolidated profit/loss 0 0 0 0 0
Net consolidated total comprehensive income 0 0 – 37 – 54 – 163
Other changes in equity 0 0 1 0 0
Equity as at 31 December 2018 3,484 8,240 970 211 – 207
for the period 1 January to 31 December 2017
EUR million
Share capital Capital reserve
Retained
earnings
Equity as at 31 December 2016 3,484 8,240 1,014
Equity as at 1 January 2017 3,484 8,240 1,014
Allocation to retained earnings 0 0 9
Distribution to shareholders 0 0 – 219
Capital increase/capital decrease 0 0 0
Changes in the scope of consolidation 0 0 1
Actuarial gains/losses 0 0 15
Measurement gains/losses from own credit rating 0 0 0
Measurement gains/losses in AfS financial instruments 0 0 0
Measurement gains/losses from investments accounted for using the
equity method 0 0 0
Currency translation differences 0 0 0
Net consolidated profit/loss in equity 0 0 15
Net consolidated profit/loss 0 0 0
Net consolidated total comprehensive income 0 0 15
Other changes in equity 0 0 – 1
Equity as at 31 December 2017 3,484 8,240 820
Statement of changes in equity

St
atem
ent
of
chan
ges
in e
quit
y
12
7
Co
nso
lid
ate
d f
ina
nci
al
sta
tem
en
ts
Measurement
gains/losses
from
investments
accounted for
using the equity
method
Measurement
gains/losses
from own credit
rating
Currency
translation
reserve
Unappropriated
profit/loss
Shareholders’
equity
Equity
attributable to
non-controlling
interests Total
44 11 23 416 13,331 46 13,377
– 44 0 – 2 0 0 0 0
0 – 21 0 0 – 180 0 – 180
0 0 0 0 2 0 2
0 – 11 21 416 13,152 46 13,198
0 0 0 – 416 0 0 0
0 0 0 0 – 173 0 – 173
0 0 0 0 0 8 8
0 0 0 0 – 17 – 30 – 47
3 27 3 0 – 221 0 – 221
0 0 0 420 420 0 420
3 27 3 420 198 0 198
– 3 0 0 0 – 1 – 4 – 5
0 16 25 420 13,159 20 13,179
Revaluation
reserve
Measurement
gains/losses
from
investments
accounted for
using the
equity method
Measurement
gains/losses
from own
credit rating
Currency
translation
reserve
Unappropriated
profit/loss
Shareholders’
equity
Equity
attributable to
non-controlling
interests Total
247 42 24 35 10 13,096 38 13,134
247 42 24 35 10 13,096 38 13,134
0 0 0 0 – 10 – 1 1 0
0 0 0 0 0 – 219 0 – 219
0 0 0 0 0 0 4 4
0 0 0 0 0 1 1 2
0 0 0 0 0 15 0 15
0 0 – 13 0 0 – 13 0 – 13
46 0 0 0 0 46 0 46
0 2 0 0 0 2 0 2
0 0 0 – 12 0 – 12 0 – 12
46 2 – 13 – 12 0 38 0 38
0 0 0 0 416 416 2 419
46 2 – 13 – 12 416 454 2 456
0 0 0 0 0 – 1 0 – 1
293 44 11 23 416 13,331 46 13,377

Cas
h f
low
sta
tem
ent
12
8
Co
nso
lid
ate
d f
ina
nci
al
sta
tem
en
ts
for the period 1 January to 31 December 2018
EUR million 01/01
– 31/12/2018 01/01
– 31/12/2017¹
Net consolidated profit/loss 420 419
Non-cash items in net consolidated profit/loss and reconciliation to cash flow from operating activities
Depreciation, write-downs and reversals of impairment losses on receivables, property and equipment, and financial investments (including equity investments) 140 114
Increase in/reversal of provisions 240 307
Other non-cash expenses/income 297 – 30
Gains/losses from the sale of equity investments, property and equipment and intangible assets – 2 – 85
Other adjustments (net) – 1,458 – 1,493
Subtotal – 363 – 768
Changes in assets and liabilities from operating activities
Financial assets measured at amortized cost
Loans and advances to banks 1,383 – 8,788
Loans and advances to customers – 7,485 2,716
Debentures and other fixed-income securities 517 3,760
Financial assets measured at fair value through other comprehensive income
Debentures and other fixed-income securities 652 – 1,132
Loans and advances – 526 n/a
Equity instruments – 2 6
Financial assets designated at fair value – 183 31
Financial assets mandatorily measured at fair value through profit or loss 6,800 14,163
Shares in investments accounted for using the equity method 8 17
Other assets from operating activities – 394 – 526
Financial liabilities measured at amortized cost
Deposits from banks 2,995 17,363
Deposits from customers 3,369 8,788
Securitized liabilities – 3,465 10,081
Financial liabilities designated at fair value 2,168 25
Financial liabilities mandatorily measured at fair value through profit or loss – 3,602 – 37,778
Other liabilities from operating activities – 128 116
Dividends received 47 40
Interest received 13,268 12,963
Interest paid – 12,772 – 11,587
Income taxes paid – 160 – 71
Cash flow from operating activities 2,126 9,420
Proceeds from the sale of
Equity investments 50 234
Property and equipment 1 2
Intangible assets 1 0
Payments for the acquisition of
equity investments – 55 – 8
Property and equipment – 24 – 21
Intangible assets – 49 – 67
Payments for the acquisition of consolidated companies – 34 – 21
Cash flow from investing activities – 111 120
Dividends paid – 173 – 219
Other payments – 20 – 65
Net change in cash and cash equivalents from other capital 174 – 487
Cash flow from financing activities – 19 – 771
1 The previous year’s figures based on IAS 39 were transferred to the structure of the IFRS 9 scheme without adjustments.
Cash flow statement

Cas
h f
low
sta
tem
ent
12
9
Co
nso
lid
ate
d f
ina
nci
al
sta
tem
en
ts
EUR million 01/01
– 31/12/2018 01/01
– 31/12/2017¹
Cash and cash equivalents at the beginning of the period 22,729 13,532
Cash flow from operating activities 2,126 9,420
Cash flow from investing activities – 111 120
Cash flow from financing activities – 19 – 771
Changes to cash and cash equivalents owing to exchange rates, basis of consolidation and measurement – 4 429
Cash and cash equivalents at the end of the period 24,721 22,729
1 The previous year’s figures based on IAS 39 were transferred to the structure of the IFRS 9 scheme without adjustments.
The cash flow statement shows the change in cash and cash equivalents resulting from cash flows from operating, investing and financing activities during the financial year.
Cash and cash equivalents correspond to the LBBW Group's cash reserve and include cash, balances with central banks, public-sector debt instruments eligible for refinancing operations and bills.
Cash flow from operating activities is determined indirectly from net consolidated profit/loss. Cash flows that are primarily connected with the revenue-producing activities of the LBBW Group or cash flows resulting from activities that cannot be allocated to investing or financing activities are allocated to cash flow from operating activities.
Cash flow from investing activities shows proceeds and payments relating to the disposal or acquisition of non-current assets.
All proceeds and payments from transactions relating to equity and subordinated capital are included in cash flow from financing activities.
In addition to the cash change in equity (dividend payment), cash flow from financing activities includes the cash flows from the silent partners’ contributions and additional subordinated capital. During the period under review, the volume of subordinated capital held increased by EUR 131 million from the previous year. In addition to a cash increase of EUR 149 million, the change resulted from measurement effects of EUR –3 million and the change in deferred interest of EUR 31 million. Furthermore, elements of subordinated capital have been reclassified to designated at fair value as a result of the first-time adoption of IFRS 9. This reclassification reduced the amount of subordinated capital measured at amortized cost by a further EUR 46 million.
Land and land rights of EUR 78 million were acquired due to the acquisition of two fully consolidated subsidiaries in the first half of the year. There was only a small amount of cash. The net outflow of cash (purchase price minus outgoing cash and cash equivalents) is EUR 34 million. As a result of the loss of control of a fully consolidated subsidiary in the first half of the year, the share of minority interests amounting to EUR 32 million and trading assets of EUR 50 million were lost. There was no disposal of cash.
N
ote
s 1
30
C
on
soli
da
ted
fin
an
cia
l st
ate
me
nts
for the 2018 financial year
Basis of Group accounting
Landesbank Baden-Württemberg (LBBW (Bank)), as the parent company of the Group (LBBW), is a public law institution (rechtsfähige Anstalt des öffentlichen Rechts) with registered offices in Stuttgart, Karlsruhe, Mannheim and Mainz. The commercial register numbers at the responsible district court are as follows: district court of Stuttgart HRA 12704, district court of Mannheim HRA 104440 (for Karlsruhe) and HRA 4356 (for Mannheim) and district court of Mainz HRA 40687.
Together with its two customer banks BW-Bank and LBBW Rheinland-Pfalz Bank, it offers the full range of products and services throughout Germany that a mid-sized universal bank provides. In the state capital Stuttgart, BW-Bank fulfills the role of a savings bank for LBBW. LBBW also assists its corporate customers and those of the savings banks in their international operations. Subsidiaries specializing in specific areas of business such as leases, factoring, asset management, real estate or equity finance diversify and supplement LBBW’s portfolio of services.
The consolidated financial statements for the 2018 financial year were prepared in accordance with Section 315e (1) of the German Commercial Code (HGB) and Commission Regulation (EU) no. 1606/2002 of the European Parliament and of the Council dated 19 July 2002 (IAS regulation) in accordance with the regulations of the International Financial Reporting Standards (IFRS) as applicable in the European Union. The standards and interpretations published at the time of preparation of the financial statements, adopted by the European Union and relevant and binding for the Group, are authoritative.
The consolidated financial statements of LBBW were released by the Board of Managing Directors for publication on 8 March 2019.
Accounting policies
1. Accounting principles The consolidated financial statements are based on the going concern principle.
In accordance with IFRS 10.19 and IAS 28.35, financial statements in the LBBW Group are prepared using uniform accounting policies across the Group. These were applied consistently to the reporting periods shown, unless stated otherwise. The annual financial statements of the fully consolidated companies or investments accounted for using the equity method are prepared as at the balance sheet date of the consolidated financial statements of LBBW.
The functional currency and the reporting currency of LBBW is the euro (EUR). The amounts in these consolidated financial statements are generally rounde to EUR millions in accordance with commercial principles. This may result in minor aggregation differences, though these do not have any adverse effect on the quality of reporting. The reporting year is the calendar year.
Notes and additional disclosures in accordance with Section 315e HGB

N
ote
s 1
31
C
on
soli
da
ted
fin
an
cia
l st
ate
me
nts
2. Changes and estimates
IFRS applied for the first time The following IFRS were applied for the first time in the 2018 financial year:
IFRS 9 Financial Instruments/Prepayment Features with Negative Compensation – Amendments to IFRS 9
With the publication of IFRS 9 »Financial instruments« on 24 July 2014, the IASB has provisionally completed the reform of its accounting provisions for financial instruments. The endorsement took place on 29 November 2016 and 26 March 2018 with the publication in the Official Journal of the European Union.
In the 2016 financial year, LBBW already exercised the option of voluntary early application of the provisions on the presentation of gains and losses of financial liabilities at fair value through profit or loss. Aside from the new regulations on hedge accounting, the current financial year is the first time LBBW will apply the remaining requirements of IFRS 9.
As part of the first-time adoption of IFRS 9 Financial Instruments, LBBW is applying the IFRS »Prepayment Features with Negative Compensation – Amendments to IFRS 9« early. This amendment regulates that financial assets with an early repayment option, where the terminating party receives or pays appropriate compensation, can be measured at amortized cost or at fair value through other comprehensive income.
Accounting policies for financial instruments have in part changed substantially due to the first-time adoption of IFRS 9 and the Amendment described above. The most important changes in comparison to IAS 39 are explained in the section »Changes to accounting policies«.
Equity on the balance sheet decreased by EUR 180 million due to the first-time adoption of IFRS 9. This was essentially a result of a change in methodology for allowances for losses on loans and securities compared to IAS 39. The statements of reconciliation for the balance sheet and allowances for losses on loans and securities as at 1 January 2018 in accordance with IFRS 9 are shown under »first-time adoption of IFRS 9«.
Annual Improvements to IFRS 2014 – 2016 Cycle – Amendments to IAS 28 and IFRS 1
This collective standard that was approved within the scope of the annual improvement projects is an IASB tool for implementing necessary but not otherwise urgent amendments to the existing IFRS framework. The changes may be of a purely editorial nature but they may also affect the recognition, measurement and reporting of assets and liabilities or the extent of disclosures.
The first-time adoption of this standard has no material effect on the consolidated financial statements.
IFRS 15 Revenue from Contracts with Customers
This standard contains the new guidance on the realization of revenue and supersedes IAS 18 »Revenue« and IAS 11 »Construction Contracts« and some related interpretations. It comprises contracts with customers for the sale of goods or the provision of services. Exceptions apply to financial instruments and leases, among other things.
At LBBW, IFRS 15 applies predominantly to fees in service business operations. These are recognized in the income statement at the date the service is provided.
Control is transferred to the customer immediately after the service is rendered. If services are provided over a period of time, they are recognized in accordance with the degree to which the business has been performed as at the balance sheet date.

N
ote
s 1
32
C
on
soli
da
ted
fin
an
cia
l st
ate
me
nts
The income to be realized is measured by the contractually agreed transaction fee and, if necessary, is allocated within the meaning of IFRS 15 on the basis of the stand-alone selling prices. LBBW recognizes trade receivables in the »Other assets« balance sheet item for services rendered that have not yet been paid by the customer.
A uniform, principle-based five-step model in accordance with the provisions of IFRS 15 is used to calculate the amount of fees and other income in the Group and its recognition in line with the accrual principle. Revenue is recognized on an accrual basis after performance as at a particular time or over a period of time.
The costs of fulfilling a contract are capitalized. Contract initiation costs, on the other hand, are capitalized when they are written down over more than one year.
The first-time adoption of modified, retrospective recognition has only a small impact. One change relates to selling expenses in the context of development projects, which are to be capitalized following the introduction of IFRS 15. Other than this, additional disclosures in the notes are required.
Clarifications to IFRS 15
The changes include clarifications of various provisions of IFRS 15 and simplifications for the transition to the new standard. Furthermore, two practical expedients have been introduced for first-time adoption. They concern the presentation of contracts amended prior to the start of the earliest presented period or concluded before this period.
The clarifications made by the IASB were taken into consideration in the implementation of IFRS 15.
Classification and Measurement of Share-based Payment Transactions – Amendments to IFRS 2
This standard comprises various clarifications in connection with share-based payments.
Given that LBBW’s remuneration models do not fall within the scope of IFRS 2 »Share-based Payments«, it does not have any impact on the consolidated financial statements.
Applying IFRS 9 Financial Instruments with IFRS 4 Insurance Contracts – Amendments to IFRS 4
This standard sets out the terms for the first-time adoption of IFRS 9 for companies that apply IFRS 4 to existing insurance contracts.
Given that LBBW’s business does not fall within the scope of IFRS 4 »Insurance Contracts«, it does not have any impact on the consolidated financial statements.

N
ote
s 1
33
C
on
soli
da
ted
fin
an
cia
l st
ate
me
nts
IFRIC Interpretation 22 Foreign Currency Transactions and Advance Consideration
The IFRS Interpretations Committee’s interpretation governs the translation of foreign currency transactions in the case of advance consideration paid or received and clarifies the exchange rate to be used.
The first-time adoption had no impact as LBBW already applies these principles.
Transfers of Investment Property – Amendments to IAS 40
This standard comprises clarifications in connection with changes in use for the classification of properties as »owner-occupied« or »investment property«.
The first-time adoption of this standard has no material effect on the consolidated financial statements.
IFRS to be applied in the future The following IFRSs were not yet effective at the time these financial statements were approved for publication. Unless stated otherwise, these IFRS are already recognized in European law and LBBW does not intend to apply them early on a voluntary basis:
IFRS 16 Leases
This standard, effective as at 1 January 2019, contains the new requirements for the recognition of leases and replaces the previous IAS 17 and the associated interpretations IFRIC 4, SIC–15 and SIC–27. While the rules for the lessors are still as under IAS 17, the requirements for the lessees take a completely new approach that provides for the capitalization of the right of use and the recognition of the present value of future lease payments as a lease liability. In accordance, write-downs on rights-of-use and interest expense from the interest accrued on lease liabilities are to be recognized in the income statement in the future, as opposed to the current recognition of expenses from operating leases.
As part of implementing LBBW’s IFRS 16 project, portfolios were analyzed, contract data collected and any effects on the balance sheet or income statement were evaluated. System adjustments were made to reflect continued leases within the meaning of IFRS 16.C3. Leases with low-value underlying assets are implemented in simplified terms. Furthermore, no leasing or non-leasing components for certain asset clusters are separated within the meaning of IFRS 16.15.
For LBBW, there are effects with regard to former operating leases, in particular for real estate, which increase total assets as rights of use and lease liabilities in a range of EUR 250 million to EUR 360 million at the time of initial adoption. The transition to the new standard is carried out in accordance with the modified, retrospective method and results in a first-time adoption effect in the low 8 figure range, which is to be recognized directly in equity through other comprehensive income.
IFRIC 23 Uncertainty over Income Tax Treatments
IFRIC 23 clarifies uncertainty over income tax treatments. The clarification defines the issue at hand, assesses how likely it is to occur, calculates the specific tax values on which the accounting is based and considers new findings.

N
ote
s 1
34
C
on
soli
da
ted
fin
an
cia
l st
ate
me
nts
This change is effective for the first time in the 2019 financial year. The clarification confirms LBBW’s internal approach and thus has no effect on the balance sheet: Income tax is assessed at the level of the individual item, taking any existing interactions into account if necessary. If it is probable that the tax treatment will be accepted, current and deferred taxes are calculated on this basis. If, however, there is uncertainty as to whether the tax treatment will be accepted (not probable), either the most likely amount which would be recognized for tax purposes or the expected value of the various scenarios will be used, depending on which estimate is most appropriate. A full understanding of the circumstances by the tax authorities is always assumed. Finally, the assumptions and decisions made are reviewed at the end of every reporting period and, if necessary, are adjusted to take new information into account.
Long-term Interests in Associates and Joint Ventures – Amendments to IAS 28
This standard governs the consideration of non-voting shares in other enterprises. These must be included in the analysis of material influence but will continue to be assessed in accordance with IFRS 9.
This change is effective for the first time in the 2019 financial year. The first-time adoption of this standard is not expected to have any material effect on the consolidated financial statements.
Annual Improvements to IFRS 2015 – 2017 Cycle – Amendments to IFRS 3, IFRS 11, IAS 12 and IAS 23
This collective standard that was approved within the scope of the annual improvement projects is an IASB tool for implementing necessary but not otherwise urgent amendments to the existing IFRS framework. The changes may be of a purely editorial nature but they may also affect the recognition, measurement and reporting of assets and liabilities or the extent of disclosures.
The changes are expected to be effective for the first time in the 2019 financial year. The first-time adoption of this standard is not expected to have any material effect on the consolidated financial statements. The standard had not yet been endorsed in European law at the date on which these financial statements were approved for publication.
Plan Amendment, Curtailment or Settlement – Amendments to IAS 19
This standard takes into consideration the measurement of pension obligations due to plan amendments, curtailment and settlement on the basis of updated assumptions.
This change is expected to be effective for the first time in the 2019 financial year. Provided there are no plan amendments, curtailments or settlements, the introduction of the changes is not expected to have any impact on the consolidated financial statements. The standard had not yet been endorsed in European law at the date on which these financial statements were approved for publication.
Amendments to References to the Conceptual Framework in IFRS Standards
This standard updates the references to the Conceptual Framework for Financial Reporting in IFRS Standards.
This change is expected to be effective for the first time in the 2020 financial year. The impact of the first-time adoption of this standard is still being reviewed. The standard had not yet been endorsed in European law at the date on which these financial statements were approved for publication.

N
ote
s 1
35
C
on
soli
da
ted
fin
an
cia
l st
ate
me
nts
IFRS 17 Insurance Contracts
This standard includes the new provisions for the recognition of insurance contracts and replaces the previous IFRS 4.
These changes are expected to be effective for the first time in the 2021 financial year. The impact of the first-time adoption of this standard is still being reviewed. The standard had not yet been endorsed in European law at the date on which these financial statements were approved for publication.
Definition of a Business – amendments to IFRS 3
This standard clarifies the definition of a business within the meaning of IFRS 3. An updated definition and additional guidelines and examples have resolved previous ambiguity when it came to providing a definition in practice.
This change is expected to be effective for the first time in the 2020 financial year. The impact of the first-time adoption of this standard is still being reviewed. The standard had not yet been endorsed in European law at the date on which these financial statements were approved for publication.
Definition of Material – amendments to IAS 1 and IAS 8
This standard contains clarifications regarding the definition of materiality, as, in practice, questions are frequently raised about its use when making decisions as to whether information is sufficiently material so as to require its inclusion in the financial statements.
This change is expected to be effective for the first time in the 2020 financial year. The impact of the first-time adoption of this standard is still being reviewed. The standard had not yet been endorsed in European law at the date on which these financial statements were approved for publication.
Sale or Contribution of Assets between an Investor and its Associate or Joint Venture – Amendments to IFRS 10 and IAS 28, Effective Date of Amendments to IFRS 10 and IAS 28
This standard clarifies that the amount recognized as gains or losses resulting from a transaction with an associate or joint venture depends on whether the assets disposed of or acquired constitute a business. After this updated standard was published, however, it emerged that it is not fully consistent with the existing IFRS framework. For this reason, the IASB deferred the date of initial adoption indefinitely, to enable it to again review such transactions within the scope of a research project on the equity method. The process for endorsing this standard into European law was also deferred until further notice.
Therefore, no statement on the date of initial adoption or the effects of the first-time adoption of the future standard can be made at present. However, on the basis of the current standards, this would have no material impact on the consolidated financial statements.

N
ote
s 1
36
C
on
soli
da
ted
fin
an
cia
l st
ate
me
nts
Initial adoption of IFRS 9 As part of the first-time adoption of IFRS 9, the names and content of balance sheet items were partially adapted to the new measurement categories for financial assets:
∙ Financial assets belonging to portfolios with the »Hold« business model and which meet the requirements for a simple loan agreement as defined in IFRS 9 are reported under »Financial assets measured at amortized cost«. The nature of a simple loan agreement is explained in the accounting policies under »Cash flows«. Amortized cost includes allowances for losses on loans and securities. The former practice of reporting allowances for losses on loans and advances separately has thus been discarded.
∙ Financial assets (debt instruments) held in portfolios with the »Hold to collect and sell« business model and which meet the requirements for a simple loan agreement as defined in IFRS 9 are reported under »Financial assets measured at fair value through other comprehensive income«. Financial assets that are equity instruments voluntarily recognized at fair value through other comprehensive income are also shown under this balance sheet item. The recognition of changes in the fair value of equity instruments through other comprehensive income excludes impairment recognized through profit of loss, transfers of components recognized in equity to the income statement (recycling) and the recognition through profit or loss of disposal gains and losses. Only dividends from these financial instruments are recognized in profit or loss.
∙ The item »Financial assets designated at fair value« shows financial assets that are voluntarily recognized at fair value through profit or loss. The balance sheet item exclusively comprises debt instruments that meet the requirements for a simple loan agreement and which belong to portfolios with the »Hold« or »Hold to collect and sell« business models.
∙ Financial assets that either do not meet the requirements of a simple loan agreement or that belong to a portfolio with the »Sell« business model are reported in »Financial assets mandatorily measured at fair value through profit or loss«.
For reasons of consistency, balance sheet items which only include financial liabilities were also brought into line with the measurement categories. This led to the creation of a new balance sheet item »Financial liabilities measured at amortized cost«, under which the previous items »Deposits from banks«, »Deposits from customers«, »Securitized liabilities« and »Subordinated capital« are reported separately.
These voluntary adjustments make it clear that, in LBBW’s balance sheet, financial instruments are grouped according to their measurement category while also improving the clarity of the financial statements. As the IAS 39 balance sheet also included items grouped by their measurement category, the line items from the previous year were compared against the new items in accordance with their measurement category without adjustment.
The following tables provide an aggregate overview of the effects on assets and liabilities as a result of the amended classification and measurement from IAS 39 as at 31 December 2017 to IFRS 9 as at 1 January 2018. For the purposes of reconciliation, the IAS 39 balance sheet items grouped by measurement category were first allocated to an IFRS 9 measurement category. This basic allocation is shown in the following table:

N
ote
s 1
37
C
on
soli
da
ted
fin
an
cia
l st
ate
me
nts
Basic allocation
IAS 39 balance sheet item IFRS 9 measurement category
Loans and advances to banks, loans and advances to customers, financial
investments (LaR) Financial assets measured at amortized cost
Securities, loans and receivables designated as financial investments available for sale
Financial assets measured at fair value through other comprehensive income
Securities, loans and receivables designated at fair value Financial assets designated at fair value
Trading assets, positive fair values from derivative hedging instruments,
equity instruments designated at fair value and financial investments available for sale Financial assets mandatorily measured at fair value through profit or loss
Trading liabilities, financial liabilities designated at fair value, negative fair values from hedging derivatives Liabilities measured at fair value
Deposits from banks, deposits from customers, securitized liabilities,
subordinated capital liabilities measured at amortized cost
In the following reconciliation tables, the »Reclassification« column shows allocations that differ from the basic allocation presented above on account of the classification criteria of IFRS 9 with the carrying amount as at 31 December 2017 (IAS 39). The aggregate measurement effects resulting from the first-time adoption of the measurement provisions of IFRS 9 are shown in the »Revaluation« column.
In the next columns, the carrying amount in accordance with IAS 39, less reclassification plus remeasurement in accordance with IFRS 9, is reconciled to the IFRS 9 measurement categories and thus shows the carrying amount under IFRS 9 as at 1 January 2018. If relevant, deferred taxes were taken into account for all remeasurement in the opening balance sheet. However, the remeasured amounts in the following tables show the effect before deferred taxes.
The tables below reconcile the carrying amount as at 31 December 2017 on the basis of the IAS 39 regulations to the new carrying amount in accordance with IFRS 9 as at 1 January 2018:

N
ote
s 1
38
C
on
soli
da
ted
fin
an
cia
l st
ate
me
nts
Reconciliation of assets
Carrying amount in accordance with
IFRS 9 as at 1 January 2018
EUR million
Carrying amount
under IAS 39 as at
31 December 2017
Reclassifi-cation
Remeasure-ment
Financial assets
mandatorily measured at
fair value through profit or
loss
Financial assets
designated at fair value
Financial assets
measured at fair value
through other
comprehen-sive income
Financial assets
measured at amortized
cost
Assets measured at fair value
Trading assets 28,698 0 – 34 28,663 0 0 0
Derivatives 17,747 0 – 34 17,713 0 0 0
Equity instruments 1,876 0 0 1,876 0 0 0
Securities 6,178 0 0 6,178 0 0 0
Receivables 2,897 0 0 2,897 0 0 0
Financial assets designated at fair value 732 306 0 306 426 0 0
Equity instruments 215 215 0 215 0 0 0
Securities 110 64 0 64 46 0 0
Receivables 408 28 0 28 380 0 0
Positive fair values from
hedging derivatives 1,956 0 0 1,956 0 0 0
Interest rate-linked derivatives 1,946 0 0 1,946 0 0 0
Cross-currency interest rate swaps 10 0 0 10 0 0 0
Financial investments (AfS) 21,185 1,243 19 211 0 20,302 694
Equity instruments 772 566 0 205 0 567 0
Securities 20,413 678 19 5 0 19,736 694
Assets measured at amortized cost
Loans and advances to banks
(before allowances for losses on loans and advances) 48,184 50 1 0 51 0 48,133
Loans and advances to
customers (before
allowances for losses on loans and advances) 108,332 5,562 47 2,765 551 2,279 102,783
Allowances for losses on loans and advances – 684 8 – 184 0 0 0 – 860
Financial investments (LaR)
(after allowances for losses on loans and advances) 1,663 672 8 5 0 679 986
Equity instruments 5 0 0 5 0 0 0
Securitized transactions 399 0 0 0 0 0 399
Other securities 1,259 672 8 0 0 679 588
The end of the obligation to separate embedded derivatives resulted in a remeasurement effect of EUR – 34 million from derivatives measured at fair value.
Some receivables with a fair value of EUR 28 million and securities with a fair value of EUR 64 million were reclassified from »Designated at fair value« to »Financial assets mandatorily measured at fair value

N
ote
s 1
39
C
on
soli
da
ted
fin
an
cia
l st
ate
me
nts
through profit or loss«, as their contractually agreed cash flows meet the requirement for a simple loan agreement.
The option to reclassify equity investments from »AfS financial investments« to »Financial assets measured at fair value through other comprehensive income« was exercised for selected equity investments. The fair value of these equity investments was EUR 567 million. Individual securities under »AfS financial investments« were assigned to the »Hold« business model and accordingly to the measurement category »Financial assets measured at amortized cost«. The carrying amount of these securities was EUR 694 million.
The balance sheet item »Loans and advances to customers« included loans and advances with a fair value of EUR 2,765 million whose contractually agreed cash flows do not meet the requirement for a simple loan agreement. These transactions were therefore allocated to the measurement category »Financial assets mandatorily measured at fair value through profit or loss«. Furthermore, a portfolio of promissory note loans with a fair value of EUR 2,279 million was allocated to the »Hold to collect and sell« business model and correspondingly the measurement category »Financial assets measured at fair value through other comprehensive income«. Due to the phase-out of separate accounting for embedded derivatives in financial assets under IFRS 9, loans and advances to banks and customers were designated at fair value (EUR 602 million) in order to avoid an accounting mismatch. The reclassifications led to a total increase in the carrying amount of EUR 48 million.
Transactions with a fair value of EUR 679 million from other securities in financial investments (LaR) were allocated to the »Hold to collect and sell« business model and correspondingly the measurement category »Financial assets measured at fair value through other comprehensive income«. EUR 8 million of the total increase of EUR 11 million in the carrying amount due to reclassification results from this.
In the context of the transition to IFRS 9, securities measured at fair value through other comprehensive income under IAS 39 were allocated to the category »Financial assets measured at amortized cost«. As at the end of the reporting period, the fair value of these reclassified securities was EUR 487 million. Without the reclassification of the securities, a gain of EUR 47 million due to the change in fair value would have been recognized in other comprehensive income as at 31 December 2018.

N
ote
s 1
40
C
on
soli
da
ted
fin
an
cia
l st
ate
me
nts
Reconciliation of liabilities
Carrying amount in accordance with
IFRS 9 as at 1 January 2018
EUR million
Carrying amount under
IAS 39 as at 31 December
2017 Reclassifi-
cation Remeasure-
ment
Financial liabilities
mandatorily measured at
fair value through profit
or loss
Financial liabilities
designated at fair value
Financial liabilities
measured at amortized cost
Liabilities measured at fair value
Trading liabilities 21,882 0 0 21,882 0 0
Derivatives 15,493 0 0 15,493 0 0
Delivery obligations from short sales of securities 1,289 0 0 1,289 0 0
Deposits 225 0 0 225 0 0
Securitized liabilities 4,874 0 0 4,874 0 0
Other financial liabilities 1 0 0 1 0 0
Financial liabilities designated at
fair value 2,726 0 0 0 2,726 0
Deposits 1,492 0 0 0 1,492 0
Securitized liabilities 1,234 0 0 0 1,234 0
Negative fair values from hedging derivatives 3,315 0 0 3,315 0 0
Interest rate-linked derivatives 3,288 0 0 3,288 0 0
Cross-currency interest rate swaps 27 0 0 27 0 0
liabilities measured at amortized cost
Deposits from banks 61,895 225 8 0 233 61,670
Deposits from customers 79,415 274 22 0 313 79,124
Securitized liabilities 44,432 2,125 39 0 2,163 42,307
Other liabilities – of which finance leases 3 0 0 0 0 3
Subordinated capital 5,364 46 16 0 62 5,318
To avoid an accounting mismatch, »Liabilities at amortized cost« with a total fair value of EUR 2,772 million were designated at fair value. This entailed a total increase of EUR 102 million in the respective carrying amounts, EUR 36 million of which is attributable to own credit spread. Offsetting remeasurement effects in connection with the end of the obligation to separate embedded derivatives resulted in a EUR 17 million decrease in carrying amounts.

N
ote
s 1
41
C
on
soli
da
ted
fin
an
cia
l st
ate
me
nts
Allowances for losses on loans and securities
Allowances for losses on loans and securities for transactions in the following classifications as at
1 January 2018
EUR million
Carrying amount under
IAS 39 as at 31 December
2017 Remeasure-
ment
Financial assets
measured at fair value
through other comprehen-sive income
Financial assets
measured at amortized
cost
Provisions for lending
business
Allowances for losses on loans and securities 757 203 3 866 92
Financial instruments loans and receivables 685 177 0 861 0
Loans and advances to banks 5 1 0 5 0
Loans and advances to customers 679 176 0 855 0
Financial investments 1 0 0 1 0
Provisions for lending business 73 19 0 0 92
Financial instruments available for sale 0 7 3 4 0
The increase in allowances for losses on loans and securities is essentially due to the change from an incurred loss model to an expected credit loss model. Reclassifications of financial instruments whose allowances for losses on loans and securities have been derecognized and incorporated into measurement at fair value and reclassifications of financial instruments within the scope of IFRS 9 provisions on allowances for losses on loans and securities had only insignificant effects. Details on the new model for allowances for losses on loans and securities can be found in the section »Financial instruments«.
Comparative information
In applying IFRS 9 for the first time, LBBW is exercising the option of not calculating the comparative prior-year figures in accordance with IFRS 9. Accordingly, no comparative prior-year figures are reported for disclosures being presented for the first time. For disclosures in accordance with IAS 39 presented prior to the first-time adoption of IFRS 9, comparative prior-year figures have been relocated in line with the structure of the notes in accordance IFRS 9 with no changes to content. If reconciliation is not possible, the prior-year figures are shown in accordance with the structure published in the previous year.
Adjustments Estimates and assumptions were made in accordance with the accounting standards concerned for determining the assets, liabilities, income and expenses recognized in the consolidated financial statements. These are based on historical experiences and other factors such as plans and – as far as can be currently judged – probable expectations and forecasts of future events. Such significant estimates can change from time to time and significantly affect the net assets and financial position, as well as the results of operations.
In addition, discretionary decisions were reached when preparing the financial statements regarding the determination of the scope of consolidation, the classification of the financial instruments, investment property, the leasing relationships and the allocation to the levels pursuant to IFRS 13.
Estimates and assumptions mainly relate to the calculation of the fair value of financial instruments and investment property, the value of assets and the calculation of the allowances for losses on loans and advances, as well as the recognition and measurement of subordinated capital, provisions and deferred taxes. Moreover, estimates and assumptions are made regarding specific cash flows. Where significant estimates and/or complex judgments were required, the assumptions made are explained in detail in the Notes to the corresponding items.
N
ote
s 1
42
C
on
soli
da
ted
fin
an
cia
l st
ate
me
nts
The estimates and assumptions are each based on the level of knowledge currently available about the expected future business performance and trends in the global and sector-specific environment. Where actual values differ from the estimates made, the underlying assumptions and – if necessary – the carrying amounts of the relevant assets and liabilities are adjusted accordingly on a prospective basis.
The following changes in estimates were applied prospectively in accordance with IAS 8.39 in the financial year:
∙ As the generally accepted actuarial rules are to be employed when measuring pension and assistance provisions, the previous »2005 Heubeck mortality tables« were replaced with the »2018 G Heubeck mortality tables« released in 2018. The new tables take into account the latest statistics on statutory pension schemes and those from the Federal Statistical Office, e.g. change in life expectancy. This change results in a EUR 37 million increase in pension and assistance provisions, which is recognized through other comprehensive income in the actuarial result within equity.
∙ LBBW’s external actuary uses a recognized interest rate method to determine the calculatory interest rate used to measure pensions and other obligations to employees in accordance with IAS 19. This was subject to a full review in the 2018 financial year. Adjustments to the calculation of the IFRS calculatory interest rate caused the calculatory interest rate to decrease by 2 basis points as at 31 December 2018. In accordance with the present sensitivities, this results in an effect of EUR 10 million, which is recognized through other comprehensive income in the actuarial result within equity.
The impact of the changes in estimates on future reporting periods that were implemented in the year under review are in particular dependent on the development of market parameters and expectations in the future. A quantitative determination of the effects on future reporting periods is therefore only possible on the basis of models and hence to a limited extent.
As part of the first-time adoption of IFRS 9 it became apparent that maintaining the same level of detail for classifications would expand LBBW’s financial reports considerably. Taking the IASB’s Disclosure Initiative and the proposal that content to be disclosed focuses on relevant information for users of financial statements into consideration, LBBW has decided to avoid overloading future financial reports by placing a reasonable limit on the content to be published in accordance with IFRS 7 and IFRS 13. This will be achieved by using fewer, but more meaningful, classifications.
3. Basis of consolidation In addition to LBBW (Bank) as the parent company, 104 subsidiaries, including eight structured entities (previous year: 103 subsidiaries including nine structured entities), were included in the consolidated financial statements.
A subsidiary is an entity that is controlled by another entity (known as the parent). Control is assumed to exist if the company can exert direct or indirect authority over the relevant activities of a company, obtains variable benefits from a company or has rights to variable benefits, or can use its authority to draw on the account of the company to influence the amount of its variable benefits. In assessing whether LBBW exercises a controlling influence, the purpose and structure as well as the company's relevant activities must be taken into consideration.

N
ote
s 1
43
C
on
soli
da
ted
fin
an
cia
l st
ate
me
nts
If the voting rights are material for the management of the relevant activities, control by LBBW is assumed if it holds more than half of the voting rights in the company, either directly or indirectly, unless there are signs that at least one other investor (for example, due to statutory provisions or agreements) has the practical capability to unilaterally determine the relevant activities.
In cases in which LBBW does not hold a majority of the voting rights but has the practical capability to unilaterally control the relevant activities, power of control is also assumed. This is particularly relevant for structured entities (includes securitization platforms initiated by LBBW or funds launched by LBBW), where voting or comparable rights are not the dominant factor when determining control. The following additional factors are therefore also taken into consideration when assessing the possibility of control:
∙ The voting rights relate solely to administrative duties; the relevant activities, on the other hand, are governed by contractual agreements.
∙ By performing various functions and given the rights it is granted from these, LBBW is given power of control together with the rights of other parties.
∙ LBBW also carries a burden of risk or rights to variable benefits from liquidity lines provided and from interest and fees paid, among other things.
With the securitization platforms controlled by LBBW, the voting rights relate solely to administrative duties; the relevant activities, on the other hand, are governed by contractual agreements. By performing various functions and given the rights it is granted from these, together with the rights of other parties, LBBW is given power of control. It also carries a burden of risk or rights to variable returns from liquidity lines provided and from collection of fees. It was concluded in an overall view that LBBW has power of control over this securitization vehicle.
With regard to some project companies in which LBBW does not hold a majority of the voting rights, LBBW is given power of control together with the rights of other parties because of the financing structure. It also bears a burden of risk or has rights to variable benefits from financing these companies. It was concluded in an overall view that LBBW controls these companies.
Other factors such as a principal-agent relationship can also lead to the assumption of control. If another party with decision-making rights operates as an agent for LBBW, it does not control the company, as it merely exercises decision-making rights that were delegated by LBBW as the principal and are therefore allocated to LBBW. If LBBW operates merely as an agent for another party, LBBW does not assume control over the company.
Subsidiaries are consolidated from the time when the Group acquires a controlling influence and the subsidiary meets quantitative or qualitative materiality criteria. The consolidation ends at the time when there is no longer any possibility for exercising a controlling influence or the regular dissolution of the subsidiary has started.
The appropriateness of the consolidation decisions met previously is reviewed regularly or on a case-by-case basis. Changes to the shareholder and capital structure, as well as changes to contractual agreements in relation to influencing rights result in a reappraisal of the possibility of control. Other motives for a reappraisal are events that lead to a change in the control factors.

N
ote
s 1
44
C
on
soli
da
ted
fin
an
cia
l st
ate
me
nts
The following subsidiaries were included in consolidation for the first time in 2018:
∙ targens GmbH ∙ Carnotstr. 5-7 Berlin Verwaltungs GmbH ∙ Carnotstr. 5-7 Berlin GmbH & Co. KG ∙ Lyoner Quartier Beteiligungs GmbH ∙ zob Esslingen Grundbesitz GmbH ∙ LBBW Immobilien Investment Management GmbH ∙ Projektgesellschaft SMK 69 mbH ∙ Heerdter Landstrasse Düsseldorf GmbH & Co. KG
The following subsidiaries are no longer included in the scope of consolidation due to mergers into other Group companies:
∙ Radon Verwaltungs-GmbH ∙ Rheinpromenade Mainz GmbH & Co. KG ∙ LBBW Immobilien Westend Carree II GmbH & Co. KG ∙ LBBW Immobilien Versicherungsvermittlung GmbH ∙ LBBW Immobilien Westend Carree II Komplementär GmbH ∙ Lyoner Quartier Beteiligungs GmbH
The following structured entity was deconsolidated in the period under review.
∙ LBBW Unternehmensanleihen Euro Offensiv
The following consolidated subsidiaries were renamed:
∙ CFH Beteiligungsgesellschaft mbH became Süd KB Sachsen GmbH ∙ Schockenried GmbH und Co. KG became Eberhardstrasse Stuttgart GmbH & Co. KG. ∙ LBBW Leasing GmbH became LBBW Leasing GmbH i.L.
Seven joint ventures and five associates (unchanged from the previous year) were accounted for using the equity method in the consolidated financial statements.
Joint ventures are joint agreements whereby LBBW and other parties exercise joint control over the agreement and have rights to the net assets of the agreement.
A joint agreement is an agreement where two or more contractual parties are linked by means of a contractual agreement and exercise joint control over the participating interest. A joint agreement can be a joint venture or a jointly controlled operation. LBBW has only joint ventures.
Joints ventures are included in the consolidated financial statements using the equity method from the time when the Group obtains joint control with at least one other party and the joint venture satisfies quantitative or qualitative materiality criteria. The inclusion using the equity method ends at the time when there is no longer any possibility for exercising a controlling influence.
As a joint venture, Sealink Funding DAC is still to be included in the consolidated financial statements of LBBW (Bank) using the equity method as at 31 December 2018. However, the equity method cannot be used for Sealink Funding DAC, due to a lack of equity investment by LBBW.
N
ote
s 1
45
C
on
soli
da
ted
fin
an
cia
l st
ate
me
nts
An associate is a company over which LBBW exercises significant influence but no controlling influence over the financial and operating policy decisions. Associates are companies in which LBBW holds a voting interest of between 20% and 50% (rebuttable presumption of association) or an unambiguous proof of association and an LBBW voting interest of less than 20%. The presumption of association of a minimum 20% voting right held by LBBW may be rebutted by limitations of the influence.
Existing exercisable or convertible potential voting rights, representation in managerial or supervisory bodies, participation in decision-making processes, including participation in decisions about dividends or other distributions, as well as material business transactions with the (potential) associate, are taken into consideration as proof of association or to rebut the presumption of association.
Associates are included in the consolidated financial statements using the equity method from the time when the Group exercises a material influence and the associate satisfies quantitative or qualitative materiality criteria. The inclusion using the equity method ends at the time when there is longer any possibility for exercising a controlling influence.
A total of 57 subsidiaries (previous year: 70 subsidiaries) were not included in the consolidated financial statements because their individual and aggregate influence on the net assets, financial position and results of operations of LBBW is not significant. These comprise mainly real estate and shelf companies, as well as start-up financing. The interests in these entities are measured either at fair value or amortized cost.
4. Principles of consolidation The subsidiaries and SPEs are consolidated according to the purchase method in accordance with IFRS 10.B86 in conjunction with IFRS 3. Accordingly, all of the subsidiaries' assets and liabilities recognized from the acquirer's perspective at the time of acquisition or at the time when controlling influence is acquired are recognized at their fair value. The remeasured assets and liabilities are taken over into the consolidated balance sheet, taking deferred taxes into account, and are treated according to the standards to be applied in the subsequent periods.
Where the cost for the business combination exceeds the fair value of the assets and liabilities at initial acquisition, goodwill (goodwill in proportion with the investment) is recorded under intangible assets. The share of the equity or in the net gain/loss of the fully consolidated companies of LBBW not attributable to shareholders is reported separately in the item Equity attributable to non-controlling interests or Net income/loss of which attributable to non-controlling interest after tax in the income statement.
Intra-group receivables and liabilities, as well as income, expenses and profits and losses resulting from intragroup transactions, were adjusted by adjusting debt and profit or the elimination of the interim result.
Joint ventures and associates are accounted for using the equity method provided they are not of minor significance for the presentation of LBBW's net assets, financial position and results of operations. The pro rata share in profit or loss of investments accounted for using the equity method is recorded in the consolidated financial statements at the same time. Investments accounted for using the equity method are measured on the basis of the Group's share in equity plus goodwill and historical undisclosed reserves.

N
ote
s 1
46
C
on
soli
da
ted
fin
an
cia
l st
ate
me
nts
5. Currency translation The foreign currency translation in the Group is conducted in accordance with IAS 21. Each LBBW Group company determines its functional currency. The items included in the financial statements of the relevant group company are measured using this functional currency and translated into the reporting currency (euro).
A foreign currency transaction must be initially recognized at the spot rate between the functional currency and the foreign currency at the transaction date. Monetary assets and liabilities denominated in foreign currency and unsettled foreign currency spot transactions are always translated into euro at the prevailing closing rate. Nonmonetary items measured at amortized cost are translated at the historical rate at the transaction date. Non-monetary items measured at fair value are translated at prevailing exchange rates on the date of the measurement (closing rate).
Exchange differences are generally recognized in profit or loss in the period in which they occur. Exceptions are non-monetary items for which fair value adjustments are recognized in Other comprehensive income. Resulting translation differences are recognized in the Valuation reserve.
In the consolidated financial statements, the balance sheet items of consolidated companies whose reporting currency is not the euro are translated at the exchange rate on the balance sheet date. Average annual rates are used to translate the expenses and income of these companies. Equity is translated at historic prices. All the resulting translation differences are recognized in Other income (currency translation reserve).
The exchange rates used for the most important currencies at LBBW at the closing date are as follows:
Amount per EUR 1 in the respective currency 31/12/2018 31/12/2017
USD 1.1462 1.1987
SGD 1.5653 1.6023
MXN 22.5462 23.5780
RUB 79.5971 69.3323
RON 4.6634 4.6617
6. Government grants LBBW recognized the ECB’s »targeted longer-term refinancing operations II« (TLTRO II) that, if certain conditions are met, bear interest at a rate below the market rate, in accordance with IAS 20. This benefit will only be recognized if there is reasonable assurance that the company will comply with the conditions attached and that the grant will be received. The benefit is recognized in profit or loss on an accrual basis over the periods in which the regular interest expenses on refinancing to be compensated by the grant are recognized. LBBW uses the net presentation method, whereby grants reduce the reported interest expense.
7. Cash and cash equivalents In addition to cash and balances with central banks due on demand, cash and cash equivalents include public-sector debt instruments and bills due in up to three months. All items are reported at their nominal value.

N
ote
s 1
47
C
on
soli
da
ted
fin
an
cia
l st
ate
me
nts
8. Financial instruments Financial instruments are contracts that give rise to a financial asset of one contracting party and, at the same time, a financial liability or equity instrument of another contracting party.
Recognition of financial instruments Financial assets and financial liabilities are initially recognized when LBBW (Bank) or a subsidiary included in the consolidated financial statements becomes a contractual party of the financial instrument. Spot purchases of financial assets that are delivered not on the trade date but instead within a standard period on the settlement date are recognized on the settlement date, regardless of the category. Derivatives are not recognized in the balance sheet if they prevent the disposal of financial assets when these are transferred.
A financial asset is derecognized when the contractual rights to the cash flows from the financial assets expire. In addition, financial assets can be disposed of by selling them to a third party. Spot sales of financial assets that are delivered not on the trade date but instead within a standard period on the settlement date are also derecognized on the settlement date, regardless of the category. Pass through arrangements may also lead to derecognition. These arrangements are contractually agreed obligations to pass on payments from financial assets to third parties. Material opportunities and risks associated with the ownership of the financial assets must be transferred in order for them to be derecognized. If material opportunities and risks are neither transferred nor retained, derecognition from the balance sheet is conditional upon control of the asset being transferred. In this case, the financial asset is derecognized when the recipient is entitled and also able to sell or pledge the transferred financial asset to third parties without requiring the agreement of the transferring entity or needing to impose restrictions on resale. If control is not transferred, the transferred asset must continue to be recognized in LBBW’s balance sheet in the amount of the continuing involvement and an associated liability must also be recognized. Finally, financial assets are also to be derecognized if the contractual terms and conditions have been substantially modified.
Financial liabilities are derecognized once they have been settled. This means that the obligations stated in the contract must have been met or rescinded or have expired. Financial liabilities are also derecognized if financial liabilities with substantially different contractual terms and conditions are exchanged or if the contractual terms and conditions of financial liabilities are substantially altered. Finally, repurchases of financial liabilities also lead to derecognition.
Initial measurement of financial instruments Financial instruments are recognized at fair value. The initial value is only equal to the transaction price for trade receivables with no significant financing component. The transaction price is the amount which an entity expects to be entitled to in exchange for transferring promised goods or services to a customer, excluding amounts collected on behalf of third parties.
Transaction costs for financial instruments measured at fair value through profit or loss are recognized directly in profit or loss. In all other cases, transaction costs – where material – are distributed on an accrual basis. Transaction costs include additional costs that are directly attributable to the acquisition, issue or disposal of a financial asset or financial liability. These are costs that would not have been incurred if the entity had not acquired, issued or disposed of the financial instrument.

N
ote
s 1
48
C
on
soli
da
ted
fin
an
cia
l st
ate
me
nts
Subsequent measurement of financial instruments The subsequent measurement of financial assets is based on the classification decision at the time of addition. In accordance with IFRS 9, this decision incorporates the objectives of the business model for managing financial assets, an analysis of the contractually agreed cash flows and the exercise of classification options.
Business model
Financial assets at LBBW are managed at portfolio level. These portfolios follow different investment strategies. The business model of a portfolio provides information as to whether or not the assets in the portfolio will be held in the long term. LBBW has three business models: »Hold«, »Hold to collect and sell« and »Sell«.
The IFRS 9 project identified both existing LBBW portfolios and their business models as at 1 January 2018. This was based on portfolio-specific information on remuneration and measuring performance, internal reporting and risks and risk management. At LBBW (Bank), the portfolios were identified and the individual business models determined by the LBBW (Bank) Board of Managing Directors. For subsidiaries included in the consolidated financial statements, this was done by the management of the subsidiary in question. At LBBW (Bank), the business models were determined at segment level, with the exception of the »Capital Markets Business« segment« where the business model was established at a lower level. As opposed to other segments, which (with some exceptions – syndicated loans) use the »Hold« business model, this segment features a diverse variety of portfolios under the business models »Hold«, »Hold to Collect and Sell« and »Sell«.
The »Hold« business model means that the intention is to hold the assets of a portfolio for the foreseeable future and to collect the resulting cash flows over their term. Sales from these portfolios are not intended. Nevertheless, financial assets whose credit risk has increased since initial recognition could still be sold under a »Hold« business model. The same applies to sales made close to maturity, if the proceeds from the sales approximate the collection of the remaining contractual cash flows, and to infrequent sales and sales involving smaller volumes. Sales from portfolios operating under the »Hold« business model are subject to an internal process which monitors holding intent. For this purpose, sales agreements with third parties under civil law are considered sales, which lead to the assets sold being derecognized from the balance sheet.
The »Hold to collect and sell« business model does not involve the strict intention to hold the financial assets in a portfolio in the long term. In addition to collecting cash flows from the financial assets held, the assets can also be sold in line with the investment strategy of the portfolio. These kind of investment strategies can be found, to some extent, in portfolios in the Treasury’s are of responsibility.
The »Sell« business model comprises all investment strategies that do not fall under the other two models. In particular, this includes financial assets acquired for trading and shares of loans intended for syndication. In LBBW Group, loans intended for syndication are allocated to two portfolios with different business models. The part of the loan to be placed on the market is assigned to a »Sell« business model portfolio while the final take is assigned to a »Hold« portfolio. Syndicated loans for which placement was unsuccessful remain in the original »Sell« portfolio permanently.
N
ote
s 1
49
C
on
soli
da
ted
fin
an
cia
l st
ate
me
nts
In rare cases, a portfolio’s business model may change. Nonetheless, there are major obstacles for a change of business model: A change must be agreed upon by the LBBW (Bank) Board of Managing Directors or a subsidiary’s management and must have been prompted by internal or external changes. In addition, these changes must have a not insignificant impact on business activity and be demonstrable to third parties. If all these conditions are met, it is essential to make a new classification decision for the assets in the portfolio. This new classification of a financial asset during its term is considered a reclassification and is permitted only for debt instruments that meet the cash flow criterion.
Cash flows
The analysis of the contractually agreed cash flows looks at whether the financial asset represents a simple loan agreement, thus generating solely payments of principal and interest (SPPI) as defined in IFRS 9. The term »repayment« generally refers to the repayment of capital. For the purpose of classifying financial assets, the capital concept is defined not as the nominal value but as the fair value of the financial asset on initial recognition. The interest term also has its own definition for the purpose of classifying financial assets. It represents consideration for the provision of capital and can only include components which are also reflected in a simple credit agreement. These include:
∙ time value of money; ∙ credit risk premium; ∙ surcharges for other risks associated with a loan (e.g. liquidity risk); ∙ surcharges for costs associated with a loan (e.g. administrative costs); and ∙ profit margin.
Equity instruments and derivatives thus do not constitute financial assets comparable to a simple loan agreement. The same applies to debt instruments with embedded derivatives that generate leverage. Non-recourse financing, which primarily involves an investment risk, also constitutes a breach of a simple loan relationship. At LBBW (Bank), restructuring of this kind of financing occasionally caused loans to be mandatorily recognized at fair value through profit or loss. However, non-leveraged interest rate caps embedded in debt instruments may be compatible with a simple loan agreement.
The analysis of the contractually agreed cash flows is subject to discretion. This applies in particular to LBBW (Bank)’s non-recourse financing. This includes financing of special investment vehicles, which are characterized by the limitation of LBBW (Bank)’s right of recourse to certain assets of the special investment vehicle or payments from these assets. At LBBW (Bank), this method of financing is therefore always in accordance with a simple loan agreement if either the special investment vehicle is able to service its debt without selling the financing object or if sufficient unimpaired collateral has been provided by third parties. As such financing is often tailored to the customer’s specific investment projects, it is assessed taking into account all quantitative and qualitative information on the project in back office to reflect the special features of the respective financing when analyzing its cash flows. An analysis process that has been implemented and standardized at LBBW (Bank) guarantees a consistent, Bank-wide procedure.
Options
The fair value option enables LBBW to voluntarily measure financial assets measured at fair value through profit or loss if this eliminates or at least substantially reduces an accounting mismatch. An accounting mismatch arises when different standards are used for the recognition and measurement of financial assets and related liabilities.
Financial assets that represent an investment in equity instruments can be voluntarily measured at fair value through other comprehensive income. This applies only if they are not held for trading and do not constitute contingent consideration recognized by a purchaser in the context of a business combination.
N
ote
s 1
50
C
on
soli
da
ted
fin
an
cia
l st
ate
me
nts
This option can be exercised separately if the conditions are met for each financial asset and is irrevocable. These options can only be exercised at the time of the financial asset’s initial recognition and are exercised at LBBW.
Which combinations of business model, cash flow criterion and options result in which measurement is explained in the notes on the effects on the items of the balance sheet.
Financial assets measured at amortized cost
Financial assets belonging to portfolios with the »Hold« business model and which meet the requirements for a simple loan agreement are reported in this statement of financial position item. The item exclusively comprises non-derivative debt instruments such as receivables and securities. These financial assets are measured at amortized cost.
Interest income and fees of an interest nature from these financial assets are reported in the income statement in the item »Net interest income and current net income/loss from equity instruments«. Expenses and income resulting from allowances for losses on loans and securities and gains and losses from selling these financial assets can be found in the income statement under the item »Net income/expenses from financial assets measured at amortized cost«.
Financial assets measured at fair value through other comprehensive income
Financial assets (debt instruments) held in portfolios with the »Hold to collect and sell« business model and which meet the requirements for a simple loan agreement are reported here. Fluctuations in the fair value of these assets are recognized through other comprehensive income. Interest and fees of an interest nature from a financial asset measured at fair value through other comprehensive income are also distributed on an accrual basis and changes in default risks from recognizing impairment losses are taken into account.
Interest income from these financial assets is reported in the income statement in the item »Net interest income and current net income/loss from equity instruments«. Expenses and income resulting from allowances for losses on loans and securities and gains and losses from selling these financial assets is shown in the income statement under »Net income/expenses from financial assets measured at fair value through other comprehensive income«. Effects of changes in fair value are recognized directly in »Other comprehensive income«.
Financial assets that are equity instruments voluntarily recognized at fair value through other comprehensive income are also shown under this balance sheet item. Under this option, only distributions from these financial instruments are recognized through profit or loss under »Net interest income and current net income/loss from equity instruments«. All other effects, such as changes in the fair value of gains/losses on disposal, are reported directly in equity under »Other comprehensive income«.

N
ote
s 1
51
C
on
soli
da
ted
fin
an
cia
l st
ate
me
nts
Financial assets designated at fair value
Financial assets designated at fair value comprise financial assets that are voluntarily recognized at fair value through profit or loss by exercising the choice to do so. This offsets or reduces fluctuations in results that are not justified from an economic viewpoint and that arise from countertransactions that must be recognized at fair value through profit or loss. The balance sheet item exclusively comprises debt instruments that meet the requirements for a simple loan agreement and which belong to portfolios with the »Hold« or »Hold to collect and sell« business models. Voluntary subsequent measurement at fair value through profit or loss immediately takes into account all fluctuations in the fair value in the income statement.
Interest income from these financial assets is reported in the income statement in the item »Net interest income and current net income/loss from equity instruments«. Changes to fair value and gains and losses from selling these financial assets can be found in the income statement under »Net income/expenses from financial instruments measured at fair value through profit or loss«.
Financial assets mandatorily measured at fair value through profit or loss
Financial assets which either do not meet the requirements of a simple loan agreement or which belong to a portfolio with the »Sell« business model are reported in this balance sheet item. Subsequent measurement at fair value through profit or loss immediately takes into account all fluctuations in fair value in the income statement.
Interest income from these financial assets and distributions from equity instruments are reported in the income statement under »Net interest income and current net income/loss from equity instruments«. Changes to fair value and gains and losses from selling these financial assets can be found in the income statement under »Net income/expenses from financial instruments measured at fair value through profit or loss«.
Allowances for losses on loans and securities Under IFRS 9, impairment for credit risks is recognized using a three-stage impairment model on the basis of expected credit losses. The scope of provisions for allowances for losses on loans and securities includes financial assets measured at amortized cost or at fair value through other comprehensive income. This essentially includes loans, securities and lease receivables. For outstanding credit commitments and financial guarantee contracts, provisions for credit risks are established in line with the principles, estimation techniques and assumptions described below.
Calculating allowances for losses on loans and securities
A review is carried out on an ongoing basis to assess whether there is any evidence that a financial asset is credit-impaired. The criteria for this review are based on the regulatory definition of default in accordance with the Capital Requirements Regulation (CRR). This definition is also used for internal management. In particular, defaults include substantial financial difficulty for the borrower due to which repayment seems unlikely, breach of contract (default or delinquency in interest or principal payments of over 90 days), an application to open insolvency proceedings, termination or repayment, partial and full write-downs and the borrower entering other financial reorganization. The events described apply to all customers, regardless of rating or scoring procedures.
If there is no evidence of credit-impairment, impairment losses are recognized in the amount of the expected credit losses resulting from possible loss events in the next twelve months (stage 1). In the event of a significant increase in the default risk of a financial asset since its initial recognition to the balance sheet (stage 2), all expected credit losses over the remaining term of the financial instrument are recognized. Each asset is generally measured individually; groupings are established when taking into account special cases as required.

N
ote
s 1
52
C
on
soli
da
ted
fin
an
cia
l st
ate
me
nts
If there is evidence of credit-impairment (stage 3), the impairment loss for significant financial assets is measured as the gross carrying amount of the financial instrument less the present value of the estimated cash flows. To calculate anticipated future cash flows, various probability-weighted scenarios are used to estimate expected proceeds from the financial instrument (payments of principal and interest) and any payments from the liquidation of collateral on the basis of their amount and accrual date. The procedure for financial assets that are not significant is the same as for stage 2 assets (stage 3 based on parameters).
For financial assets allocated to stages 1 and 2 or measured on the basis of parameters under stage 3, the expected credit loss is calculated based on the probability of default (PD), the estimated loss given default (LGD) and the expected exposure at default (EaD). These parameters are standardized at twelve months for stage 1 financial instruments. To calculate life-time expected credit loss, the inputs are standardized at the remaining term of the financial asset.
Regardless of the remaining term, expected credit losses (calculated as the product of the three parameters already described) are discounted to the end of the reporting period using the effective interest rate of the financial instrument or an approximation of this rate. This does not apply to significant financial assets which already show credit-impairment at initial recognition. In this case, the effective interest rate is adjusted by taking into account the life-time expected credit losses, with the result that no further allowances for losses on loans and securities are reported on initial recognition. The credit-adjusted effective interest rate resulting from this is used for subsequent measurement.
LBBW has not used the simplified approach in accordance with IFRS 9.5.5.15 for lease receivables.
Inputs and assumptions
Specific rating and risk classification procedures are used for all relevant business activities. These procedures quantify the probability of default of the individual investments, which is initially standardized to twelve months. In addition, multi-year probabilities of default are determined on the basis of many years of internal rating histories. Historical, current and forward-looking information is considered when determining customer creditworthiness, provided this demonstrably improves the forecast quality. In addition, the regulatory rating for the Bank’s core business areas – corporate customers and real estate financing in Germany – is adjusted for expected economic conditions on the basis of the rate of change in the ifo business climate or gross domestic product.
The loss given default is primarily determined by the probability of recovery and the collateral ratio of the underlying asset. The collateral ratio is the ratio between the expected proceeds from the liquidation of collateral and the expected exposure at default. There are specific forecasts for different types of collateral and customer groups. The estimates of the model inputs are based on pool data gathered by the Bank itself and in cooperation with savings banks and other Landesbanks, in which case it has been ascertained that these data are representative for LBBW. The LGD is initially standardized at twelve months. In addition, multi-year loss rates for defaults are determined using collateral value models and EaD forecasts for each potential default date for the debtor. Similar to the probability of default forward-looking information is also considered.
The expected exposure at default (EaD) is determined using various models on the basis of the characteristics of the underlying financial instrument. The EaD for a fully disbursed, non-revolving financial instrument corresponds to the average exposure in the default year and is calculated taking into account the contractually agreed cash flows. For non-revolving financial instruments that have not yet been fully disbursed at the measurement date, the expected time of full disbursement is determined by means of models that use customer and transaction specific characteristics as risk factors. Disbursements are then estimated up to the full disbursement date using linear interpolation and are thus included in the EaD estimate. A separate class of models has been developed for revolving commitments which forecast the expected use of commitments for any point in the future until the end of the contract in question. If this is not explicitly stipulated, the notice period is used to determine the term. A

N
ote
s 1
53
C
on
soli
da
ted
fin
an
cia
l st
ate
me
nts
performance-based term that extends beyond the notice period is estimated on the basis of historic data only for overdrafts and credit cards. As well as statistical business and customer characteristics, the period until the default date and the credit line’s historical draw-down pattern are all used as inputs for the models. The models are estimated on internal data using different types of regression models. Guarantees, which are not fully used in the event of default, represent a special case. The amount at risk for these transactions is calculated by means of a credit conversion factor (CCF).
The quality of the risk classification procedures used to measure PD, LGD and EaD is reviewed regularly and the procedures are refined if necessary. Most of the portfolio is measured using internal rating procedures that have been approved for the Internal Ratings Based Approach (IRBA) by the banking regulator. The rating grades are not only used for internal management purposes but also to measure the regulatory capital requirements.
Consideration of changes to estimation techniques or assumptions
All models used to calculate expected credit losses in the reporting period were validated regularly and adjusted if necessary. There were no significant changes to methodology that would affect the calculation of expected credit losses.
Consideration of forward-looking information
As well as taking into account future information on a parameter-specific basis, all business areas are also regularly subjected to qualitative and quantitative analysis to determine whether there are special circumstances requiring an adjustment to allowances for losses on loans and advances. Special cases are extraordinary, temporary circumstances in which the models are unable to create parameters suitable for the calculation of allowances for losses on loans and advances set out in IFRS 9 (PD, LGD and EaD including correlations of these parameters) because the modeling may no longer deliver unbiased results. For example, this occurs if major macroeconomic or political fluctuation, technological development, legal conditions or other disruptive elements are anticipated that cannot (yet) be sufficiently accounted for in the ratings (like LGD). In this case, qualitative information, estimates, scenario analyses and simulations are utilized to determinate to what extent allowances for losses on loans and advances must be adjusted so as to adequately cover all risks. If it is not possible to carry out these adjustments for individual financial instruments, suitable clusters are established. A process involving the LBBW Early Warning team was created to recognize and consider special cases. This interdisciplinary group of experts from Research, Front Office, Back Office and Risk Controlling deal with all relevant events that may influence LBBW’s operating activities on both a regular and ad hoc basis. Its aims include identifying crises and developing scenarios for LBBW’s management bodies in the event that they emerge.
N
ote
s 1
54
C
on
soli
da
ted
fin
an
cia
l st
ate
me
nts
Description of transfer criterion
Three criteria (transfer criterion) are used to assess whether to measure impairment on the basis of 12- month expected credit loss (stage 1) or over the lifetime of a financial instrument (stage 2):
∙ Quantitative transfer criterion: First, the expected probability of default at the end of the reporting period is calculated using the initial rating and expected migrations specific to the segment. If the current risk assessment is significantly worse than the expected value at the end of the reporting period, the financial asset is transferred.
∙ »De minimis threshold« criterion: A change in the probability of default by a maximum of 10 basis points in comparison to the initial rating is considered low. In this case, the impairment loss is always measured using the 12-month expected credit loss. This is relevant only for financial instruments with an initial rating of up to 3, as a downgrade of one notch from a rating of 4 or above increases the probability of default by over 10 basis points.
∙ »Warning signal« criterion: If certain warning signals are present, the impairment loss of a receivable is always measured using the life-time expected credit losses. This includes internal warnings (e.g. observation case or seizure), 30-day arrears, actively intensified loan management and forbearance measures.
Securities are exempt from the above criteria; stages are allocated on the basis of the current rating. If this falls under »investment grade«, it is allocated to stage 1. In all other cases, the securities are allocated to stage 2 and the impairment loss is measured on the basis of the life-time expected credit losses. The definition of »investment grade« is based on international standards.
There is another exception for financial assets which already showed credit-impairment at initial recognition. In this case, impairment loss is always measured using the life-time expected credit losses of the financial instrument, even when recovery is expected or actually occurs. There is no stage transfer for these instruments.
For the quantitative aspects of the transfer criterion, the current rating with a timescale for probability of default of twelve months is considered. As shown by analysis in the context of the development of the transfer criterion, this is suitable for measuring the probability of default over the remaining term.
If the requirements for measuring impairment over the lifetime of a financial instrument (stages 2 and 3) are no longer met, impairment is measured on the basis of 12-month expected credit loss (stage 1).
N
ote
s 1
55
C
on
soli
da
ted
fin
an
cia
l st
ate
me
nts
Depreciation, amortization and write-downs
A financial instrument is to be written down directly in the event of an actual, potentially only partial, default or loss. This is considered uncollectible if no surrogate substitutes the defaulted receivable. If no recovery is expected, the receivable is derecognized. This is the case, for example, with:
∙ insolvency, when no further proceeds from the liquidation of collateral or an insolvency ratio are expected
∙ terminated exposures where the residual receivables cannot be settled ∙ the claim is waived fully or partially ∙ sale of receivables with a loss and ∙ private customers who pay small installments on a high outstanding receivable after the collateral
is liquidated because it is assumed that the customers will be unable to repay the receivable in full within the two year reporting period.
Exposures that are still subject to enforcement activity after being written down are serviced centrally. The objective is to collect extraordinary income from these receivables. To this end, negotiations are conducted with customers in order to achieve voluntary repayments or settlements, engage in personal enforcement against the debtor’s assets, accompany insolvency proceedings and account for payment transactions.
Balance sheet recognition
For Financial assets measured at amortized cost, allowances for losses on loans and securities are deducted directly. The amount remaining after the deduction of allowances for losses on loans and securities is reported in the balance sheet. For transactions subject to measurement at fair value through other comprehensive income, the amount reported in the balance sheet is the fair value. Credit losses for off-balance-sheet transactions are shown in the item provisions for credit risks.
Subsequent measurement of financial liabilities In the subsequent measurement, financial liabilities are to be classified at amortized cost. This excludes:
∙ financial liabilities measured at fair value through profit or loss; ∙ financial liabilities that arise when a transfer of a financial asset does not qualify for derecognition
or when the continuing involvement approach applies; ∙ financial guarantee contracts; ∙ commitments to provide a loan at a below-market interest rate; ∙ contingent consideration recognized by an acquirer in a business combination to which IFRS 3
applies.
A financial liability must be measured at fair value if it is held for trading. Held for trading means that the financial liability,
∙ is acquired or incurred principally for the purpose of selling or repurchasing it in the near term; ∙ on initial recognition it is part of a portfolio of identified financial instruments that are managed
together and for which there is evidence of a recent actual pattern of short-term profit-taking; or ∙ is a derivative (with the exception of derivatives that are financial guarantees or designated and
effective hedging instruments).

N
ote
s 1
56
C
on
soli
da
ted
fin
an
cia
l st
ate
me
nts
In addition, a financial liability must be measured at fair value if it includes an embedded derivative which is required to be separated and that cannot be measured separately either at acquisition or at the end of a subsequent financial reporting period.
Options
A financial liability can be irrevocably designated as at fair value through profit or loss on initial recognition provided that doing so results in more relevant information. This is the case when:
∙ it eliminates or significantly reduces a measurement or recognition inconsistency (accounting mismatch) that arise from measuring assets or liabilities or recognizing the gains and losses on them on different bases;
∙ a group of financial liabilities or of financial assets and financial liabilities is managed and its performance is evaluated on a fair value basis, in accordance with a documented risk management or investment strategy, and information about the group is provided internally on that basis to the Board of Managing Directors or the management.
They can also be voluntarily designated as at fair value if the financial liability contains one or more embedded derivatives, provided
∙ the embedded derivative(s) change the contractually stipulated cash flows not insignificantly; or ∙ it is clear with little or no analysis when a similar hybrid instrument is first considered that
separation of the embedded derivative(s) is prohibited.
Financial liabilities measured at amortized cost
Financial liabilities resulting from banking activities are recognized in this balance sheet item. This item includes securitized liabilities and subordinated capital, as well as deposits from banks and customers. These liabilities are measured at amortized cost.
LBBW reports subordinated liabilities (e. g. borrower's note loans or issues), profit participation rights and typical silent partners' contributions under Subordinated capital. In view of the contractually agreed repayment of capital, the subordinated liabilities and profit-participation rights are classified as debt in accordance with the provisions of IAS 32. The silent partners' contributions are also recognized as debt, on account of the existence of a contractual right of termination or repayment to the investor. In supervisory law terms, subordinated liabilities, profit participation rights and silent partners' contributions are considered to form part of own funds in accordance with the CRR.
Interest expenses from these financial liabilities and gains and losses from repurchasing own liabilities are reported in the income statement under »Net interest income and current net income/loss from equity instruments«.
Financial liabilities designated at fair value
Financial liabilities designated at fair value comprise financial liabilities that are voluntarily measured at fair value through profit or loss by exercising the choice to do so. This offsets or reduces fluctuations in results that are not justified from an economic viewpoint and that arise from countertransactions that must be recognized at fair value through profit or loss.

N
ote
s 1
57
C
on
soli
da
ted
fin
an
cia
l st
ate
me
nts
Interest expense from these financial liabilities is reported in the income statement in the item »Net interest income and current net income/loss from equity instruments«. Changes to the fair value of these financial liabilities can be found in the income statement under »Net income/expenses from financial instruments measured at fair value through profit or loss«. However, if the change in fair value is due to a change in own credit rating, the portion of the change in fair value attributable to the change in the own credit rating is recognized in equity in the »Other comprehensive income« balance sheet item. Nonetheless, if measurement inconsistencies were to arise or increase as a result of this, this effect must also be recognized through profit or loss under »Net gains/losses from financial instruments measured at fair value through profit or loss«.
Financial liabilities mandatorily measured at fair value through profit or loss
All financial liabilities that must be recognized at fair value are reported in this balance sheet item.
Interest expense from these financial liabilities is reported in the income statement in the item »Net interest income and current net income/loss from equity instruments«. Changes to the fair value of these financial liabilities can be found in the income statement under »Net income/expenses from financial instruments measured at fair value through profit or loss«.
Embedded derivatives If a hybrid contract contains a host that is an asset within the scope of IFRS 9, the embedded derivative must be taken into account when assessing whether or not there is a simple loan agreement. The embedded derivative is never separated in this case.
On the other hand, in the case of a hybrid contract that, as a host, does not contain any assets within the scope of IFRS 9, the embedded derivative must be separated from the host and accounted for as a derivative under the following conditions:
∙ the economic characteristics and risks of the embedded derivative are not closely related to the economic characteristics and risks of the host contract;
∙ a separate instrument with the same terms as the embedded derivative would meet the definition of a derivative; and
∙ the hybrid contract is not measured at fair value through profit or loss.
The obligation to separate embedded derivatives therefore relates primarily to financial liabilities and some assets that are included in the scope of other IFRSs (e.g. rights under leases). If an embedded derivative is separated, the host contract shall be accounted for in accordance with IFRS in the scope in which it is included.
Hedge accounting LBBW does not apply the new IFRS 9 regulations on hedge accounting. Instead, the decision was made to continue recognizing all hedges in accordance with the previous requirements of IAS 39.
The hedge relationship is documented at the inception of the hedge. The documentation clearly identifies the hedged item and the hedging transaction, it encompasses the definition of the risk being hedged, the description of the hedging strategy and the risk management objective (cf. risk report), and defines the method used to assess the hedging instrument's effectiveness. The Bank uses suitable control instruments, including interest rate swaps, as a hedge to minimize the interest rate risk (e.g. from different fixed interest rates or a change to the yield curve) in the banking book. LBBW uses both micro and portfolio hedge accounting to avoid earnings volatility. In accordance with the provisions of IAS 39, the hedge relationship must be expected to be highly effective at its inception and throughout the entire term. LBBW applies the critical term match method and regression analysis when determining the prospective effectiveness test. In addition, effectiveness must also regularly be reviewed retrospectively. A hedge relationship is considered to be effective if the ratio of the changes in value from the hedging transaction

N
ote
s 1
58
C
on
soli
da
ted
fin
an
cia
l st
ate
me
nts
to the hedged part of the hedged item is between 80% and 125%. The Bank uses the dollar offset method to measure effectiveness retrospectively. An ineffective hedge relationship must be reversed. A reversed hedge relationship can be redesignated for the remaining term provided it is assumed to be effective for the remaining term (prospective test). Inefficiencies are the result primarily of causes including the variable interest rate leg exerting a disproportionate impact on measurement and differing interest payment dates within the hedge relationship.
If the requirements for hedge accounting in accordance with IAS 39.71 et seqq. are met, a decision is made as to whether the hedge relationship will be accounted for as a fair value hedge or as a cash flow hedge. Fair value hedges serve to hedge the exposure to market price risk (mainly interest rate risks) and therefore the related changes in fair value. They exist in the form of micro fair value hedges and portfolio fair value hedges. The Bank uses interest rate swaps and cross-currency interest rate swaps as hedging instruments to hedge the interest rate and exchange rate risk in fair value hedges. This means that certain Bank lending or issuing and securities portfolios are hedged against changes in market value (in relation to the hedged risk). In a micro fair value hedge, the Bank does not designate any partial hedge, i.e. the hedged item and the hedging transaction are always included in a hedge relationship in full.
In a micro fair value hedge the carrying amount of the hedged item is adjusted for the change in the fair value of the hedged risk and recognized in profit or loss. This applies to the financial instruments valued at amortized cost as well as to the hedged item measured at fair value, whose changes in value are recorded in Other income. Changes in the fair value of the hedged item not attributable to the hedged risk are accounted for in accordance with the guidance applicable to the relevant category.
LBBW uses the portfolio fair value hedge to hedge interest rate risks within the meaning of IAS 39. The rules applicable to portfolio fair value hedges on interest rate risks enable LBBW to reproduce internal Bank management of interest rate risks. The portfolios contain both receivables and liabilities that are subject at regular intervals (monthly designation and dedesignation at the end of the month) to prospective and retrospective measurement of effectiveness in a dynamic hedge accounting cycle. The portfolio available for designation changes on a monthly basis due to new business, disposals and early repayments and LBBW uses a monthly hedge cycle to counteract this. The cash flow is allocated to the appropriate time interval for each financial instrument according to the expected maturity.
In the case of portfolio fair value hedges, a separate line item (portfolio hedge adjustment attributable to assets/liabilities) is carried on the face of the balance sheet to record the valuation effect on the hedged items as regards the hedged risk.
The measurement gains and losses resulting from the measurement of the hedging transaction generally offset the measurement effect of the hedged items attributable to the hedged risk. These are recognized under Net gains/loss from financial instruments measured at fair value through profit or loss (subitem »Net gains/losses from hedging transactions«).

N
ote
s 1
59
C
on
soli
da
ted
fin
an
cia
l st
ate
me
nts
A hedging relationship ends when the hedged item or the hedging transaction expires, is sold, is terminated before maturity or is designated for other purposes, or if the hedge no longer meets the criteria to qualify for hedge accounting. If a financial instrument used to hedge changes in the fair value of a hedged item is terminated before maturity or designated for other purposes, the interest-related fair value adjustment included in the carrying amount of the hedged item is amortized over its remaining maturity and netted against interest income or expenses. In the event of disposal or early repayment of the hedged assets or liabilities, the adjustments in the fair value of the hedged item are recognized along with the realized gains/losses from the disposal or repayment.
Securities repurchase and lending agreements To date only genuine repurchase agreements are permitted at LBBW. A genuine repurchase agreement is a contract under which one party (the pledgor) transfers its securities to another party (the pledgee) against payment of a specified amount and in which the parties also agree to return the securities to the pledgor at a specified date for the price received or another price agreed in advance. In addition, the pledgor is generally entitled to current income (e.g. interest or dividends) and other rights (e.g. subscription rights) from the securities. Under genuine repurchase transactions, all opportunities and risks therefore essentially remain with the entity that transferred the securities.
Thus, the pledgor does not derecognize the securities from the balance sheet. However, it must recognize a financial liability in the amount of the payment received. Furthermore, the pledgor must recognize all income from the securities and all expenses incurred as a result of the financial liability in subsequent periods. Any difference between the amount received when the securities were originally transferred and the amount to be paid upon return must be allocated by the pledgor to the liability over the term of the repurchase agreement.
In turn, the pledgee must recognize a receivable in the amount paid for the transfer. This receivable by the pledgee is measured at amortized cost. Any difference between the receivable’s acquisition costs and the amount due upon return must be allocated to the liability over the term of the repurchase agreement.
Securities lending refers to transactions in which ownership of securities is transferred with an obligation on the borrower to retransfer securities of the same type, quality and quantity on expiration of the agreed period of time and pay a fee for the duration of the loan. Securities lending agreements relate to the »loan of a thing« in accordance with Section 607 of the German Civil Code (BGB). The lender bears the market price risk as the borrower is required to retransfer securities of the same type, quality and quantity. The borrower is also generally entitled to current income (e.g. interest or dividends) and other rights (e.g. subscription rights) directly or indirectly through the borrower. There is no balance sheet derecognition as the lender continues to assume all opportunities and risks. If cash collateral is provided, the lender must recognize a financial liability in the amount of the sum received. Furthermore, the lender must recognize all income from the securities and all expenses incurred as a result of the financial liability in subsequent periods. In the event that cash collateral is provided, any difference between the amount received on transfer and the amount to be paid upon return must also be allocated by the lender to the liability over the term of the repurchase agreement. If the borrowed securities/tangible assets are sold on to another party, a gain on disposal is recognized as an asset and an obligation to return the securities is recognized under Trading liabilities at the same time. The consideration paid by the borrower is reported under Net interest income.
Financial guarantee contracts Under IFRS 9, a financial guarantee contract is a contract that requires the issuer to make specified payments to reimburse the holder for a loss it incurs because a specified debtor fails to make payment when due in accordance with the original or modified terms of a debt instrument.

N
ote
s 1
60
C
on
soli
da
ted
fin
an
cia
l st
ate
me
nts
If the LBBW Group is the assignee, financial guarantee contracts are accounted for in the financial statements by taking them into account when determining the allowances for losses on loans and advances for the related secured financial asset as part of the IFRS 9 impairment model. This means that no contingent claims from financial guarantee contracts received are recognized in the LBBW Group’s financial statements. The LBBW Group recognizes commission payments for financial guarantee contracts as a commission expense on an accrual basis in accordance with IFRS 15. In the case of a guarantee event, a claim is recognized against the assignor.
If the LBBW Group is the assignor, financial guarantee contracts are initially recognized at fair value as soon as the LBBW Group becomes a contractual party. The fair value comprises the present value of the anticipated benefits and the current present value of the future fee and commission payments (net method). Financial guarantees concluded at market conditions have a fair value of zero. Financial guarantee contracts issued are to be included in the IFRS 9 impairment model. The amount for allowances for losses on loans and advances attributable to financial guarantees is reported under provisions for credit risks
Offsetting Financial assets and financial liabilities are recognized in the balance sheet on a net basis if, at the balance sheet date, the Group has a legally enforceable right to set off the recognized amounts and intends either to settle on a net basis or to liquidate the respective asset and settle the associated liability simultaneously. In all other cases, they are recorded by way of gross disclosure.
If asset and liabilities, such as own issues repurchased, are reported as offset in the balance sheet, the associated income and expenditure in the income statement must also be offset, unless offsetting is expressly prohibited by an applicable accounting standard.
Accounting policies in the previous year With the exception of the disclosure, the previous year’s figures have not been not adjusted. The previous year’s accounting policies are described in the 2017 annual report, which can be accessed at www.LBBW.de.
9. Shares in investments accounted for using the equity method Investments in associates or joint ventures accounted for using the equity method are carried at cost in the consolidated balance sheet once a significant influence is obtained or on formation of the company. This also comprises goodwill from the acquisition of an associate or a joint venture and hidden reserves. In subsequent years, the amount accounted for using the equity method is adjusted by the Group's share in the associate's equity. The proportion of profit or loss generated by the investment is reported in the income statement as Net income/expenses from investments accounted for using the equity method. Changes in the investment's other comprehensive income are recognized directly and proportionately in LBBW’s Other comprehensive income.
Because of the valuation of the equity investment, the equity value must be adjusted if necessary. The impairment test is conducted on the basis of IAS 36.
Investments in associates and joint ventures that are not incorporated in the consolidated financial statements on account of their immaterial importance, are recognized under »Financial assets mandatorily measured at fair value through profit or loss«.
10. Non-current assets held for sale and disposal groups The carrying amount of non-current assets or groups of assets and debt (disposal groups), whose disposal is planned, is realized largely through the disposal business and not through continued use.

N
ote
s 1
61
C
on
soli
da
ted
fin
an
cia
l st
ate
me
nts
With regard to the cumulative fulfillment of the conditions stated below, the assets or disposal groups in question are classified as held for sale and shown separately from the other assets or debt in the balance sheet. The criteria for classification as held for sale is that the assets or disposal groups can be disposed of in their present condition at prevailing conditions and that the disposal is highly likely. A disposal is highly probable if the plan to sell the asset is completed, an active program to find a buyer and to complete the plan has been initiated, the assets or the disposal group is actively offered at a price that is appropriate relative to the current fair value and the disposal is expected to occure within one year from the date of classification.
Assets classified as held for sale are measured at the lower value comprising carrying amount and fair value less the cost of disposal. The depreciation of the assets is suspended from the date they are classified as held for sale. Assets and liabilities held for sale and disposal groups are generally measured in accordance with IFRS 5. Assets that are subject to the exemptions specified in IFRS 5.5 are measured according to the provisions of the respective standard. Accordingly, the fair value measurement of the relevant assets of this balance sheet item uses the same methods, parameters and approaches as all other assets of LBBW that are measured at fair value. Assets or disposal groups classified as held for sale are recognized separately in the balance sheet item »Non-current assets and disposal groups held for sale and Liabilities from disposal groups«.
Gains/losses from the measurement and gains/losses from the disposal of these assets or disposal groups that are not included in a discontinued operation are contained in the income statement or in the valuation reserve in equity and are not separated. The total profit or loss from discontinued business divisions must be shown separately in the item »Profit or loss from discontinued operations«.
11. Intangible assets Mainly software acquired or developed in-house is recognized under Intangible assets.
Purchased intangible assets are carried at amortized cost, i.e. less their cumulative write-downs and impairment. Internally developed software is capitalized at cost if the recognition criteria in accordance with IAS 38 are met. The capitalized costs mainly include staff costs and expenses incurred for external services during development. As previously, the internally developed or purchased software is amortized over three to ten years on a straight-line basis.
Amortization, write-downs and impairment losses on intangible assets are recognized under Administrative expenses in the income statement. Income from reversals of impairment losses on intangible assets, excluding goodwill due to prohibition of reversal, is recognized under Other operating income.
Intangible assets are derecognized when sold. Gains and losses on disposal are the difference between the net proceeds from the disposal of the asset, if any, and its carrying amount. The profit or loss on the disposal of the asset is recognized through profit or loss at the date of derecognition, and reported under Other operating income/expenses.
12. Investment property Property leased out to third parties for purposes of generating profit is reported separately in the balance sheet as »Investment property« according to IAS 40 as long as it is held to earn rental income and/or for capital appreciation. Where mixed-use properties exist and the non-owner-occupied parts can be sold separately or leased out separately, these parts are accounted for separately. Mixed-use properties with a leased portion of over 80% of the total area are consistently derecognized from property and equipment and classified in their entirety as »Investment property«.

N
ote
s 1
62
C
on
soli
da
ted
fin
an
cia
l st
ate
me
nts
Investment property is measured initially at cost including transaction costs. These can also include direct borrowing costs if the respective properties are so-called qualifying assets. Remeasurement is at fair value on the closing date. This is determined primarily from model-based valuations. Regular actuarial reports are obtained for material investment properties to validate the fair value from the model-based valuations.
In the measurement of investment property, the estimating uncertainties are based on the assumptions used to calculate future cash flows. Changes in parameters such as the inflation rate, interest rate, anticipated cost trends and leasing, market conditions and vacancy rates affect future cash flows and, consequently, the fair value.
The value of investment property is assessed based on cash calculated per property on the basis of the discounted cash flow method. The contributions to earnings determined by this method are checked for plausibility and verified by means of reference figures from broker associations, past experience from LBBW's own disposals and appraisals by external experts. In order to ensure that the appraisals are available at the time the financial statements are drawn up, the management team responsible decides for which properties external appraisals are to be commissioned in the last quarter of each year. In line with internal provisions, it must be ensured that an appraisal of the main properties is conducted at least once every three years by an independent expert.
Fair value is calculated using the discounted cash flow method based on the following assumption. As a valuation object, the respective building serves as an independent, strategic cash-generating unit. The expected cash flows generated per cash-generating unit are calculated assuming income from property management. For a detailed planning period of ten years, the cash generated is calculated as the net amount of payments received and payments made in connection with management of the property. A residual value for the cash-generating unit is forecast for the end of the planning period by capitalizing the cash generated in the tenth year as a perpetual annuity.
For commercial real estate, future income in the planning period is forecast based on the contractually agreed target rent or, after the contract period has expired, the market rent specific to the property. This is calculated using a measurement tool based on the discounted cash flow method.
Future expenditure is determined in different ways: Administrative expenses are based on standard market rates. Costs associated with loss of rental income are calculated at a flat rate on the basis of the target rents, depending on the sales cost and the credit standing of the tenant. Costs associated with vacancies and new rental costs, maintenance costs and maintenance backlogs are calculated for each specific property, supplemented by the Group's own experience if applicable. If ground rent (Erbbauzins) is to be taken into account, this is calculated individually on the basis of existing contracts.
The cash surpluses generated in each period are discounted to the measurement date by applying a market discount rate specific to the property. The discount rate is derived from the capitalization rate plus a percentage-based risk premium. The discount rate takes into account factors such as the quality of the property, the type of property and the macro and micro-location.

N
ote
s 1
63
C
on
soli
da
ted
fin
an
cia
l st
ate
me
nts
All other things being equal, an increase in the underlying market rents would lead to an increase in the fair value, while a decrease in the underlying market rents would lead to a decline in the fair value. All things being equal, an increase in the underlying future expenditure would lead to a decline in the fair value, while a decline in the underlying future expenditure would lead to an increase in the fair value. Higher discount rates would, all other things being equal, lead to lower fair values, while lower discount rates would lead to correspondingly higher fair values.
A change in the assumptions on expected market rents generally leads to a corresponding change in the discount rate and to a reverse change in the vacancy ratios and therefore the vacancy costs.
13. Property and equipment Property and equipment includes commercially used land and buildings, technical equipment and machinery, operating and office equipment, advance payments and assets under construction as well as leased assets.
Property and equipment is initially carried at cost and subsequently at amortized cost. Subsequent expenditure for property and equipment is capitalized if it is deemed to increase the future potential benefit. All other subsequent expenditure is recognized as an expense. Property and equipment is depreciated over its expected economic life, mainly on a straight line basis and sometimes on a diminishing basis. Determination of the economic life reflects expected physical wear and tear, technical obsolescence and legal and contractual constraints.
Estimated useful life in years
31/12/2018 31/12/2017
Buildings 25 – 50 25 – 50
Technical equipment and machinery 5 – 10 5 – 10
Operating and office equipment 1 – 20 1 – 20
Purchased IT systems 3 – 7 3 – 7
The determination of the useful life and depreciation method is reviewed at a minimum at the end of each financial year. After scheduled depreciation, including the review of the depreciation method used, the underlying useful life and the residual value (recoverable amount of a comparable asset) of the asset in question, a check is performed at each balance sheet date as a minimum to ascertain whether there are any indications of impairment. Consequently, any impairments resulting from technical or economic obsolescence, wear and tear or a decline in market prices are taken into account. Where indications of impairment exist, the recoverable amount (the higher of the fair value minus sales costs or the value in use) is calculated and compared with the carrying amount. Impairment losses are charged to profit or loss as unscheduled write-downs.
Impairment losses must be reversed if the calculation of the recoverable amount has increased since the last time an impairment was recorded. Impairment losses are only reversed up to the amount by which the asset would have been depreciated until this date. If the carrying amount is increased by the reversal of impairment losses or reduced by impairment, the depreciation is adjusted over the remaining useful life of the asset.

N
ote
s 1
64
C
on
soli
da
ted
fin
an
cia
l st
ate
me
nts
The gain or loss on the disposal of property or equipment is calculated as the difference between the net proceeds from the disposal of the asset, if any, and its carrying amount.
Depreciation and impairment losses on intangible assets are recognized under Administrative expenses. Gains and losses on the disposal of property and equipment are recorded under Other operating income/expenses.
14. Leasing business Leases are recognized in accordance with IAS 17 on the basis of their classification as a finance or operating lease. This classification takes place at the beginning of a lease and is based on the overall assessment of which risks and rewards lie with the lessor and the lessee. The underlying criteria are reviewed regularly. If a change to the overall assessment takes place, reclassification is necessary.
A finance lease is where essentially all risks and rewards incidental to ownership of an asset are transferred from the lessor to the lessee. In accordance with the principle of substance over form, beneficial ownership, not legal ownership, is the key factor here. An operating lease is referred to in all other constellations.
The lessor and lessee must classify a lease separately and independently of one another. This may lead to diverging representations of the lease by the lessor and lessee.
LBBW’s finance lease contracts include full amortization, partial amortization and hire purchase agreements. Depending on its form, a finance lease can be a cancelable agreement or an agreement with an option to sell. The lease payments must generally be made in advance.
LBBW as the lessor In the case of operating lease transactions concluded at LBBW, beneficial ownership of the leased asset remains with the Group. The leased assets – mainly buildings and land – are recognized as assets and reported in the consolidated balance sheet under Property and equipment or Investment property. The leased assets are recognized in accordance with IAS 16 at (amortized) acquisition or production cost or are measured at fair value in accordance with IAS 40. Both the lease income and received special payments and prepayments are recognized over the lease term. All the depreciation, write-downs and impairment losses and the income earned are reported under Other operating income/expenses.
With a finance lease, the leased asset is derecognized and a receivable due from the lessee equivalent to the net investment value on the date on which the contract is concluded is shown under the item Loans and advances to customers or Loans and advances to banks. Lease payments received are broken down into an interest component recognized in income and a repayment component. While income is recognized on an accrual basis as interest income and is reported in net interest income, the repayment part reduces the receivables carried on the balance sheet.
The direct costs incurred by the lessor on the date on which the contract is concluded are assigned to the leasing contract. The internal interest rate underlying the lease term is determined in such a way that the initial direct costs are included automatically in the lease receivables.
LBBW as the lessee With a lease that is classified as operating lease, the lease payments are recorded as Administrative expenses over the lease term. The breakdown of the lease payments corresponds to the time pattern of the user's benefit from the perspective of LBBW. If the time pattern of the user's benefit differs from the actual payments of the expense to be recognized, the difference is recognized or deferred on the assets or the liabilities side of the balance sheet as appropriate.

N
ote
s 1
65
C
on
soli
da
ted
fin
an
cia
l st
ate
me
nts
If a lease term is classified as finance lease, LBBW is the beneficial owner of the leased property and records this as an asset in the consolidated balance sheet. At the time of acquisition, the leased property is recognized at the fair value or at the present value of minimum lease payments, whichever is lower, and a payable in the corresponding amount is recognized as a liability. In subsequent remeasurement, the asset recognized is depreciated in accordance with IAS 16 or measured at fair value in accordance with IAS 40. If there is no reasonable certainty with property and equipment that LBBW or a consolidated subsidiary (lessee) will obtain ownership by the end of the lease term, the asset is depreciated over the (shorter) lease term (and not its economic life). If the lessee benefits from part of the residual value of the leased asset – essentially, buildings, operating and office equipment – the asset is depreciated to this value. The finance lease installments are apportioned into an interest component and a repayment component using the effective interest rate method. The repayment component is recognized against the liability, not affecting profit or loss while the interest component is recognized as interest expense.
As IAS 17 includes no special requirements for recognition of impairments, the general regulations on impairment (IAS 36) also apply to leases.
15. Income taxes IAS 12 governs the recognition and measurement of income taxes.
LBBW operates in several tax jurisdictions. The tax items shown in the financial statements are calculated taking into account the respective taxation laws and the relevant administrative interpretations. Due to their complexity, their interpretation by taxpayers may differ from that of the local tax authorities. As different interpretations of taxation laws as a result of company audits can lead to subsequent tax payments for past years, these are included in the analysis on the basis of the management's assessment.
Current income tax liabilities and assets are calculated at current tax rates and carried at the expected payment or refund amount. Current income tax assets and liabilities are offset under the requirements of IAS 12.71.
Deferred income tax assets and liabilities are recognized in respect of temporary differences. Taxable and deductible temporary differences are calculated as the difference between the IFRS carrying amount of an asset or liability and its local tax base (adjusted for permanent differences). The tax base is determined based on the tax regulations of the country in which the taxation occurs. Deferred income tax assets and liabilities are calculated at the tax rates that are expected to apply when the asset is realized or the liability is settled. The effect of tax rate changes on deferred taxes is recognized in the tax result during the period in which the changes were approved by legislative bodies.
Deferred tax liabilities are carried for temporary differences that will result in a tax expense when settled. Deferred tax assets are recognized if tax relief is expected and likely to be utilized when temporary differences are reversed. Deferred tax assets on temporary differences in equity are recognized in total comprehensive income in the subitem Valuation reserve or Retained earnings, depending on the underlying situation.
N
ote
s 1
66
C
on
soli
da
ted
fin
an
cia
l st
ate
me
nts
A deferred tax asset is recognized for a tax loss carryforward if it is probable that the carryforward will be used in a future period by reference to budget accounts. The tax planning is derived from current corporate planning approved by the Board of Managing Directors, which regularly covers a planning period of five years. The tax planning takes into account historical insights into profitability and taxable income. In recognizing deferred income tax assets owing to interest carryforwards, the same accounting policies and valuation methods are applied as for deferred income tax assets from tax loss carryforwards. Deferred tax assets arising from temporary differences and loss carryforwards are reviewed for impairment at each balance sheet date.
Deferred tax assets are set off against deferred tax liabilities in accordance with IAS 12.74.
16. Other assets and other liabilities Other assets include assets which, considered separately, are not significant for the disclosure of balance sheet assets and cannot be allocated to any other balance sheet item. This also includes Inventories, which shows activities related to the real estate business of LBBW Immobilien Management GmbH. These include mainly specific land and similar rights with finished and/or unfinished buildings as well as project finance earmarked for sale in the course of ordinary business activities.
In accordance with IAS 2.9, inventories are measured at the lower of costs of inventories and net realizable value. The costs of purchase and production are calculated in accordance with IAS 2.10 et seqq.; the net realizable value is calculated pursuant to IAS 2.28 et seqq. The purchase and production costs of inventories that cannot be exchanged and of goods and products or services created and separated for special projects is calculated through allocation of their individual cost of purchase or production. The acquisition costs include the directly allocable costs of acquisitions and provision, the production costs include all directly allocable costs plus production and material costs. The expected, individually realizable sales proceeds less estimated completion costs and additional costs incurred until the sale are recognized as the net realizable value. The results of these operating activities are recognized under the Other operating income/expenses item, which also includes the changes in value.
The capitalization of borrowing costs on the basis of IAS 23 is conditional upon the property being a qualifying asset. These interest costs are largely incurred in connection with commercial project development, which can be attributed to the acquisition of land or the construction of buildings during the production period. Individual interest rates of between 0.85% p.a. and 2.25% p.a. (previous year: 0.88% and 2.25% p.a.) were applied.
Other liabilities include accruals and obligations which, considered separately, are not significant for the disclosure of balance sheet liabilities and cannot be allocated to any other balance sheet item.
Assets and liabilities in these items are measured at amortized cost.
17. Provisions
Provisions for pensions and other post-employment benefit obligations
General Provisions for pensions and similar obligations primarily consist of provisions for the obligation to pay company pensions, on the occurrence of biometric risks (old age, invalidity, death) based on direct pension commitments. The nature and amount of the pension payable to employees entitled to pension benefits are governed by the applicable pension rules (including total commitments and company agreements), which depend largely on the date that employment commenced. Due to other commitments, further indirect entitlements or claims exist against LBBW's supplementary pension fund (Zusatzversorgungs-kasse – ZVK) and the benevolent fund (Unterstützungskasse LBBW e.V); both facilities are closed for new policies. All of the aforementioned pension commitments are defined benefit plans within the meaning of IAS 19.

N
ote
s 1
67
C
on
soli
da
ted
fin
an
cia
l st
ate
me
nts
A unit-linked commitment (LBBW VorsorgeFonds Plus), which invests via a life-cycle model through a contractual trust arrangement (CTA), was introduced for new entrants after 31 December 2016. LBBW VorsorgeFonds Plus comprises an employer-funded Basiskonto (retirement account financed by the employer) and an employee-funded Aufbaukonto (retirement account to which contributions are made by the employee).
Furthermore there are indirect pension commitments from pension benefits from predecessor institutions which are taken over and continued and recognized as defined contribution plans within the meaning of IAS 19,. To finance this, the relevant Group company contributes set amounts to external pension funds with individual participation by employees.
Employer-funded pension plans within Germany As part of the merger that led to the creation of LBBW in 1999, all existing pension arrangements were closed for new policies and a standard pension fund was introduced for new entrants in the form of a service contract; this is the so-called LBBW capital account plan (2000 and 2005) that is classified and entered as a defined benefit plan within the meaning of IAS 19. The company pensions will be disbursed primarily in the form of a one-off payment or in installments. The lump-sum benefits comprise annual components that are arrived at by multiplying a salary-related contribution with an age-related factors, which takes into account risk and biometric risks. The obligation to extend contributions applies for a limited period of time and features a dynamization proviso.
Following the integration of Landesbank Sachsen, its pension arrangements from 2006 were also closed for new policies as at 31 December 2008 through a service agreement and the active employees were transferred to the LBBW capital account plan with an unlimited period of contribution. The entitlements accrued up to the time of integration were credited to the Basiskonto of the LBBW capital account plan as an initial benefit module.
As at 1 January 2002, persons with compulsory ZVK insurance were transferred to the LBBW capital account plan ZVK by way of a service agreement. To protect the vested rights, the contribution payable to the Basiskonto for this group of employees equates to the minimum contribution payable by the Bank as an apportionment contribution when applying the collective labor agreement on the additional pension provision for public-sector employees in the respective calendar year (minimum contribution).
The capital account plan 2005 that had previously been in place for new entrants was closed for new employees as at 31 December 2016. At the same time, the period of contribution of capital account plans 2000 and 2005 was ended via a declaration of termination to the General Staff Council with effect from 31 December 2025. Employer contributions are made annually in the Basiskonto of LBBW VorsorgeFonds Plus on the effective provision date, since 1 January 2017 for new entrants and as at 1 January 2026 for existing members of staff from the capital account plans 2000 and 2005 that have ended.
The paid-in contributions are paid into a CTA once a year, which invests these in line with an investment concept. The obligation vis-à-vis the employee is guided by the performance of the investment. The paid-in amounts are guaranteed (so-called guaranteed minimum performance). In the event of the benefit case, the funds are divested or the fund units attributable to the employee are calculated and a choice may be made between different payout options (lump sum, installments, retirement). The investment in the CTA (plan assets) measured at fair value is offset against the obligation from the LBBW VorsorgeFonds Plus.
N
ote
s 1
68
C
on
soli
da
ted
fin
an
cia
l st
ate
me
nts
Employer-financed commitments within Germany from predecessor institutions, acquired institutions and integrated institutions Various pension arrangements – closed to new entrants – exist from different predecessor, acquired and integrated institutions. These range from period of service and salary-dependent, total benefit commitments that sometimes relate to individual contractual provisions (retirement pension guidelines), limitation commitment and commitments with a split pension formula, through to pension component plans. Defined benefit plans should therefore be understood as commitments to grant a defined level of benefit in relation to the active salaries, taking into account additional pension payments (e.g. statutory pension), whereas a limitation commitment sets a defined level of benefit that may be not exceeded by the pension payments plus qualifying pension benefits.
Some current and former employees are entitled to aid (medical support). This was entered as defined benefit plans and the corresponding provisions pursuant to IAS 19 were created for employees that are still entitled to post-employment aid.
Employer-financed commitments within Germany In order to establish further entitlements and to implement the legal claim to salary conversion, LBBW offers the so-called Aufbaukonto (retirement account to which contributions are made by the employee) of the LBBW VorsorgeFonds Plus as a direct pension commitment. This has replaced the Aufbaukonto of the previous capital account plan as at 1 January 2018. The converted contributions of the employees are paid into a CTA twice a year, which invests these in line with an investment concept. The obligation vis-à-vis the employee is thus guided by the performance of the investment. The paid-in amounts are guaranteed (so-called guaranteed minimum performance). In the event of the benefit case, the funds are divested or the fund units attributable to the employee are calculated and a choice may be made between different payout options (lump sum, installments, retirement). The investment in the CTA (plan assets) measured at fair value is offset with the obligation from the LBBW VorsorgeFonds Plus.
There are also employer-financed entitlements from earlier conversions of earnings into pension contributions. Reinsurance agreements are also concluded in some cases to fund the pension benefits. There are no provisioning requirements for the deferred compensation option that is also offered, as this is entered as a defined benefit plan within the meaning of IAS 19. Direct insurance agreements are concluded with a provider from the savings banks' environment to secure long-term performance.
Commitments outside of Germany The employees of Landesbank Baden-Württemberg's London Branch were offered a direct final salary pension plan that is based on the number of years in service, which is closed for new policies and was replaced by a defined contribution plan within the meaning of IAS 19 for new employees. The pension plan's pension obligations are backed by plan assets managed by a pension trust. The pension plan as well as the pension trust are subject to UK regulations, according to which the Bank and the trustees responsible for the trust have to develop a funding strategy and plan contributions to the trust. The Bank bears the risks from the pension plan, including investment and demographic risks (longevity risk, in particular). Annuity contracts were concluded in the past to hedge risk when retirement began for those entitled to a pension. Term life insurance policies to cover mortality risk during active service exist for some beneficiaries. The pension plan bears the remaining risk.

N
ote
s 1
69
C
on
soli
da
ted
fin
an
cia
l st
ate
me
nts
The Bank and the trustees review the investment strategy every three years and adjust it if necessary. If there is a shortfall in cover, a contribution plan is agreed to reach the desired degree of cover. Some of the plan assets, such as the annuity contracts, are covered by the expected payment obligations with matching maturities (asset-liability matching).
For reasons of immateriality, the information in Note 41 is not differentiated for the foreign plans.
Valuation and recognition in the balance sheet According to the provisions of IAS 19 and the LBBW VorsorgeFonds Plus, the total obligations for the defined benefit plans are calculated annually by independent actuaries. In this process, the present value of the defined benefit obligation is calculated at each reporting date using the projected unit credit method. This calculation takes into consideration not only the pensions and entitlements known at the balance sheet date, but also the future expected rates of increase of pensionable salaries and pensions, the expected benefit cases (old age, invalidity, death) as well as fluctuation rates. In addition to the benefits trend, it is assumed in the measurement of the pension obligations that the active employees' benefit trend will be slightly higher than the average trend up to their 50th year, on account of career development. The present value of the pension obligations is based on a calculatory interest rate derived from the Towers Watson's RATE:Link methodology. The data basis for determining the interest rate is the AA- rated corporate bonds compiled in Bloomberg for the eurozone by at least half of the rating agencies. Using actuarial methods, a yield curve is derived from this data, and from this a calculatory interest rate of similar maturity to the obligations is established. The probabilities of death, invalidity and probabilities of marriage are found in the mortality tables compiled by Prof. Klaus Heubeck. The age used for the start of retirement is 64 years. The premises described above are reviewed annually and adjusted if necessary.
Deviations from the expected development of the pension obligations as well as changes to the calculation parameters (employee turnover rate, salary increase, pension increase or discount rate) lead to so-called actuarial gains or losses. These are recognized directly in Retained earnings or Other income in their full amount in the year they arise, resulting in corresponding changes in equity.
The amount to be recorded as an asset or liability is calculated from the present value of the defined benefit obligation at the balance sheet date less the fair value of the plan assets (if any) at the balance sheet date. The past service cost arises due to changes in the defined benefit plan that impact on the pension entitlements accrued. Interest expense is the share of the increase in the present value of the defined benefit obligation, or the existing plan assets of the pension provisions, that arise because the benefits are closer to settlement. The staff costs equate to the present value of the annual increase in the pension entitlements accrued plus unrecognized past service costs.
The income expected from the plan assets is offset against the interest expense, so that only net interest expense is recognized. The calculatory interest rate is used for calculating net interest income. Service cost and net interest income are reported under Administrative expenses.
Risks and management In the case of defined benefit plans and the LBBW VorsorgeFonds Plus, the relevant Group company is obligated to grant benefits pledged to former employees and their dependants. The associated risks are borne by the Group company in question. In individual cases the group parent has made commitments to employees of subsidiaries and is reimbursed by the companies for the cost of the setting aside of provisions on an intragroup basis.

N
ote
s 1
70
C
on
soli
da
ted
fin
an
cia
l st
ate
me
nts
Material risks are balance sheet, liquidity and investment risks. In accordance with IAS 19, balance sheet risks arise especially in relation to the impact of pension obligations on equity, as the difference between expected and actual pension obligations is recognized under Other income and leads to changes in equity. The basis and amount of balance sheet risk determine the aforementioned actuarial gains or losses. They can therefore provide relief or be a burden. The main factor in relation to balance sheet risks are the calculatory interest rate, the yield of the plan assets, as well as the other economic and demographic measurement factors.
The calculatory interest rate plays a key role in determining the scope of obligations, not least on account of its volatility. The general lowering of interest rates in the last two years resulted in a markedly lower calculatory interest rate and therefore to a sharp increase in the pension obligations. Furthermore, portfolio and market developments that deviate from the measurement assumptions impact on the obligation amount and therefore on the corresponding balance sheet items. Actual salary and pension increases that are higher or lower than assumed are reflected accordingly in losses or gains. With the general contribution and limit systems, the performance of the entitlements and claims in the event of external providers, such as BVV or the statutory pension scheme, impact on the level of provision to be made by the Group company, which can have a relatively strong impact on the pension obligations, especially with lasting trend changes. Besides the economic risks stated, so-called biometric risks also exist. Since a large proportion of the pension obligations is attributable to lifelong benefit entitlements, the risk of longevity in particular must be stated. Deviations in the actual mortality rates observed from the mortality tables also result in gains or losses.
Sensitivity analyses were carried out for the material parameters. In addition to the calculatory interest rate, the most influential parameters examined were the impact of the salary, pension and career trend, as well as the staff turnover probability. The mortality, salary and pension trend impact on the obligations arising from the capital accounts (Basiskonto and Aufbaukonto) and the fluctuation have comparatively little impact, since life-long benefits are generally not granted and the pension entitlements for active employees do not grow dynamically with the salaries. This will gradually reduce the balance sheet risk for the Group companies over time. This does not generally impact the obligations from the LBBW VorsorgeFonds Plus due to offsetting.
Meeting pension obligations entails the payment of pensions and therefore a capital outflow. Save for the calculatory interest rate, which does not impact on the amount of benefit payments, the balance sheet risk factors described above also affect the liquidity requirements. Since no plan assets were separated for the direct pension obligations, with the exception of the LBBW VorsorgeFonds Plus, the benefit payments must be met from the assets of the Group companies. Plan assets that can be produced from the pension payments are available for the indirect obligations of LBBW's benevolent fund and supplementary pension fund as well as the direct obligations of the LBBW VorsorgeFonds Plus. If sufficient cover is not available, the sponsoring undertakings are required to make additional contributions. The plan assets are subject to investment risk that is countered by careful asset management.
The mandatory protection against the insolvency of LBBW pension obligations applies to commitments given before the elimination of the guarantor's liability in 2005, via the pension insurance association. All pension commitments dating from before this date are insolvency-protected through the guarantor's liability and maintenance obligation.

N
ote
s 1
71
C
on
soli
da
ted
fin
an
cia
l st
ate
me
nts
Other provisions Provisions are recognized for uncertain obligations to third parties and anticipated losses from onerous contracts. Provisions are carried at the best estimate. This is the amount required to settle the present obligation at the balance sheet date (amount that LBBW or a consolidated subsidiary would rationally pay to settle the obligation or to transfer it to a third party) and which is most likely to occur. In doing so, management included empirical values from similar transactions and may have drawn on opinions by independent experts.
The other personnel-related provisions include provisions for staff anniversaries, provisions for early retirement and partial retirement and performance-related remuneration.
According to the provisions governing long service awards, an anniversary bonus is awarded to employees who have been with the Company for 10, 25, 40 and 50 years, the amount of which is guided by company or collective bargaining agreements. The corresponding anniversary provisions are calculated and set aside.
Provisions are also created for concluded partial retirement agreements. The legally required capital preservation of accrued benefits in the case of partial retirement is covered by a two-sided trustee agreement. The appropriated assets held in the custodian accounts is investment in the money market and offset against the corresponding provisions.
Similarly, provisions are created for concluded early retirement agreements.
LBBW offers its employees in the Bank and some subsidiaries a long-term account, the so-called LBBW FlexiWertkonto. It offers employees the opportunity to pay in part of their remuneration in the FlexiWertkonto, which they can use again in the form of time (withdrawal time). A two-sided trustee agreement was drawn up to secure these accrued retirement benefits as prescribed by law. Provisions are created for obligations arising from these accounts and offset against the accrued retirement benefits.
As a rule, the same risks apply to all other provisions as for the post-retirement obligations, albeit to a much lesser extent owing to the shorter obligation period.
Provisions for off-balance-sheet credit risks as well as other provisions that include provisions for restructuring and legal disputes are carried where the LBBW Group has a legal or constructive obligation from a past event where fulfilling the obligation is likely to lead to an outflow of resources embodying economic benefits and a reliable estimate of the amount of the obligation can be made. Please see the risk and opportunity report for further details of the legal risks.
Non-current provisions are discounted where the effect is material.
18. Equity The share capital is the capital paid in by the owners of Landesbank Baden-Württemberg pursuant to Section 5 of the Landesbank Baden-Württemberg Act (Gesetz über die Landesbank Baden-Württemberg) in conjunction with Section 3 of the articles of association of Landesbank Baden-Württemberg. The following entities are holders of the share capital of LBBW:
∙ Sparkassenverband Baden-Württemberg (Savings Bank Association of Baden-Württemberg) with 40.53%,
∙ State of Baden-Württemberg (state) with 24.99%, ∙ State Capital of Stuttgart (city) with 18.93%, ∙ Landesbeteiligungen Baden-Württemberg GmbH (Landesbeteiligungen BW) with 15.55%.
The capital reserve includes the amount in excess of the (theoretical) nominal value that is achieved when issuing units (offering premium).
N
ote
s 1
72
C
on
soli
da
ted
fin
an
cia
l st
ate
me
nts
In addition to transfers from the net consolidated profit/loss, retained earnings include the Group's share in the unappropriated profit/loss of the consolidated subsidiaries to the extent that these profits were generated since their affiliation to the Group. The effects of first-time adoption resulting from the transition to IFRS 9 and IFRS 15 also leads to a change in retained earnings. In addition, the other retained earnings include the effects of the first-time adoption of IFRS as well as actuarial gains/losses and the associated deferred taxes in connection with the recognition of provisions for pensions. This item also includes realized gains and losses from its own credit rating (own credit spread) and the associated deferred taxes.
Other comprehensive income includes valuation reserves from the measurement of debt and equity instruments, which are measured at fair value through other comprehensive income including the offsetting item from the recognition of deferred tax assets and liabilities. The measurement effects from debt instruments that were allocated to a portfolio with the business model Hold to Collect and Sell are transferred to the income statement in profit or loss upon realization. The measurement effects from equity instruments measured at fair value through other comprehensive income are, like current tax effects, also transferred to retained earnings upon realization.
In addition, gains/losses from the measurement of cash flow hedges include the portion of the profit or loss with no effect on the income statement, and the offsetting item from the recognition of deferred tax assets and liabilities on cash flow hedges is also reported in this item. The currency translation reserve is also included in this balance sheet item. The balance of currency translation differences arising due to capital consolidation is allocated to the currency translation reserve. These amounts arise from the translation of the annual financial statements of an economically independent entity into the Group's reporting currency. Another element of Other comprehensive income is the unrealized Measurement gain or loss from the own credit rating (own credit spread) and the opposite item from the setting aside of deferred tax assets and liabilities.
Non-controlling interests are stated as a separate subitem in equity; besides the shareholders of the parent company, other shareholders hold a stake in the equity of individual subsidiaries.

N
ote
s 1
73
C
on
soli
da
ted
fin
an
cia
l st
ate
me
nts
Segment reporting
LBBW’s segment reporting for the 2018 financial year is also drawn up in accordance with the provisions of IFRS 8. Following the »management approach«, segment reporting is therefore based on internal management reporting to the Group's Board of Managing Directors, which, in its function as the chief operating decision-maker, regularly makes decisions about the allocation of resources and the assessment of the performance of the segments on this basis.
Segment definition In the course of refining its business focus, LBBW restructured its segments as at 1 January 2018. This essentially entailed:
∙ The division of the »Corporates« segment into the new »Corporate Customers« and »Real Estate/Project Finance« segments. As a result of the new organizational structure and the associated overall responsibility for real estate lending business, project finance and real estate management were merged to form a separate division, the new »Real Estate/Project Finance« segment.
∙ Business customers (including liberal professions) that were previously included in the »Corporates« and »Retail/Savings Banks« segments and are now bundled in the »Private Customers/Savings Banks« segment (formerly the »Retail/Savings Banks« segment).
∙ The break-up of the »Credit Investments« segment following the complete sale of the guarantee portfolio in 2014 and the non-guaranteed loan portfolio in 2016, and the almost complete sale of the Sealink assets by the administrator as at the end of 2017. The remaining volume and earnings effects are included in the »Corporate Items« segment.
For reasons of comparability, the previous year’s amounts were adjusted in line with the new segment reporting structure.
The Capital Markets segment and »Reconciliation/Consolidation« are virtually unchanged from the descriptions published in the 2017 annual financial statements.
The business segments presented below are defined as product and customer groups – based on the Group’s internal organizational structures – in accordance with the internal management report. Subsidiaries and equity investments are assigned to the individual segments according to their business orientation.
∙ The »Corporate Customers« segment comprises business with SMEs, with a focus on the core markets of Baden-Württemberg, Saxony, Rhineland-Palatinate and neighboring economic areas. Business with our key accounts and the public sector are also bundled in this segment. On the financing side, the solutions offered range from classic to structured and off-balance-sheet financing. Furthermore, this segment provides services in the areas of cash management, interest rate, currency and commodities management in addition to asset and pension management. The results of primary capital market business products and foreign business products sourced from our corporate customers are also reported here. In addition to the product range for corporate customers, the segment primarily includes the following subsidiaries: Süd Beteiligungen, SüdLeasing GmbH, MKB Mittelrheinische Bank GmbH and SüdFactoring GmbH.
∙ The »Real Estate/Project Finance« segment primarily focuses on commercial real estate business, including business with real estate and housing companies in addition to structured project finance. Alongside the core market of Germany, commercial real estate financing focuses on selected metropolitan areas in the US and UK. Property, portfolio and corporate financing structures are offered to real estate clients as an arranger or syndicate bank with a supplementary range of liability and service products for interest rate and currency management. Project Finance offers
N
ote
s 1
74
C
on
soli
da
ted
fin
an
cia
l st
ate
me
nts
financing solutions to real estate and corporate customers for major projects and transport financing. The segment also includes the subsidiary LBBW Immobilien Management GmbH.
∙ The »Capital Markets Business« segment offers products for the management of interest rate, currency and credit risk and liquidity management for institutional, banks and savings banks customer groups. In addition, the segment includes products and services for international business. Equity and debt financing solutions are also offered on the primary market, along with asset management services and custodian bank services. Besides all sales activities with banks, sovereigns, insurance companies and pension funds, the segment also includes trading activities in connection with customer business. The Corporate Customers segment includes all results from financial market transactions with corporate customers. All treasury activities are also allocated to this segment. This essentially comprises the central investment of own funds, lending/deposit-taking operations and balance sheet structure management, liquidity management, the specifics of IFRS in connection with refinancing, FX management and hedge accounting, not to mention the management of strategic investments and cover funds. The subsidiary LBBW Asset Management Investmentgesellschaft mbH is also allocated to this segment.
∙ The »Private Customers/Savings Banks« segment comprises all activities with private customers in retail banking in addition to high net-worth private clients with more extensive customer requirements. Business customers including non-medical practitioners, freelancers and tradespeople are also assigned to this segment. As part of a bundled customer management approach, the segment serves both the business and private requirements of its tradespeople customers. The product range extends from checking accounts and card business to financing solutions, investment advice and special services – in particular for high net-worth private clients – such as financial planning, asset management, securities account management and foundation management. Selected business activities connected with the Bank’s function as the central bank for savings banks are also included in this segment.
∙ The »Corporate Items« segment comprises all business activities not included in the above segments. In particular, these are the financial investments and the management of the Bank’s portfolio of buildings. Moreover, the remaining volume and earnings effects from the former Credit Investment segment are shown here.
∙ The »Reconciliation/Consolidation« column includes purely consolidation adjustments and also shows the reconciliation of internal financial control data to external financial reporting data.
Measurement methods Segment information is based on the internal financial control data documented by Financial Controlling, which combine external financial reporting methods and economic measurement methods. The resulting differences in measurement and reporting compared to the IFRS Group figures are presented in the reconciliation statement.
LBBW’s income and expenses are allocated to the individual segments in which they arise. There is therefore no significant income resulting from transactions between the segments.
Net interest income is calculated using the market interest method. Interest income and expense are netted and shown as net interest income. This also includes capital benefit, i.e. investment income from restricted equity.

N
ote
s 1
75
C
on
soli
da
ted
fin
an
cia
l st
ate
me
nts
»Net gains/losses on remeasurement« consist of net income/expenses from investments accounted for using the equity method, net gains/losses from financial assets measured at amortized cost (above all allowances for losses on loans and advances), net gains/losses from financial instruments measured at fair value through other comprehensive income and net gains/losses from financial instruments measured at fair value through profit or loss. These are assigned to the segments in which they arise.
Net income/expenses from investment property are recognized as part of »other operating income/expenses«.
Besides direct personnel and material expenses, the »administrative expenses« of a segment include expenses assigned on the basis of intragroup cost allocation.
»Expenses for the bank levy and deposit guarantee system«, in addition to »net gains/losses from restructuring«, are allocated to the segments in which they arise. The »guarantee commission to the state of Baden-Württemberg«, which was still incurred in the previous year, is reported under Corporate Items in accordance with the change in segment allocation.
The assets on the balance sheet are reported as segment assets. They are allocated to the segments on the basis of internal management reporting.
The average restricted capital in the segments is calculated on the basis of calculated risk-weighted assets and imputed Tier 1 capital backing. A segment’s return on equity (RoE) is calculated as the ratio of (annualized) consolidated profit/loss before tax to the maximum planned average restricted equity and average tied-up equity in the current reporting period.
For the Group, RoE is calculated from the ratio of (annualized) consolidated profit/loss before tax to average equity on the balance sheet. This figure is adjusted for the unappropriated profit for the current reporting period.
For the segment disclosures below, the cost/income ratio (CIR) is calculated as the ratio of total administrative expenses, expenses for the bank levy and deposit guarantee system, the guarantee commission for the State of Baden-Württemberg and net restructuring income to total net interest income, net commission income, net gains on remeasurement and disposal less allowances for losses on loans and securities and other operating income/expenses.
Segment allocation was refined further in the 2018 financial year as a result of the structural adjustments. The prior-year amounts were adjusted in line with the new reporting method to ensure comparability.

N
ote
s 1
76
C
on
soli
da
ted
fin
an
cia
l st
ate
me
nts
Segment results by business area
01/01 – 31/12/2018 EUR million
Corporate Customers
Real Estate/Project
Finance
Capital Markets
Business
Private Customers/
Savings Banks
Corporate Items/Recon-
ciliation/ Consolidation LBBW Group
Net interest income 789 277 151 315 26 1,558
Net fee and commission income 170 15 131 230 – 32 513
Net gains/losses on
remeasurement and disposal1 – 35 – 5 299 14 – 51 222
of which allowances for losses on loans and securities2 – 85 – 9 2 6 – 56 – 142
Other operating income/expenses 20 101 2 – 1 18 140
Total operating income/expenses 944 388 582 558 – 39 2,433
Administrative expenses – 621 – 142 – 480 – 527 – 3 – 1,773
Expenses for bank levy and
deposit guarantee system – 26 – 12 – 41 – 7 – 2 – 89
Net income/expenses from
restructuring 0 0 – 15 1 2 – 12
Consolidated profit/loss before tax 296 235 46 25 – 43 558
Income taxes – 139
Net consolidated profit/loss 420
Segment assets3 (EUR billion) 60.1 28.0 134.5 13.0 5.6 241.2
Risk weighted assets4 (EUR billion) 36.0 13.1 16.7 8.3 6.2 80.3
Tied-up equity4 (EUR billion) 4.5 1.4 2.5 1.0 3.4 12.9
RoE (in %) 6.6 16.3 1.7 2.1 4.3
CIR (in %) 62.9 38.7 92.5 96.6 72.8
1 Net income/investments from investments accounted for using the equity method allocated to the segments and results from the disposal of such companies amount to EUR 26 million for the »Corporate Customers« segment, EUR 2 million for the »Real Estate/Project« Finance segment and EUR – -4 million for »Corporate Items«.
2 Relates to the category »Financial assets measured at amortized cost«. In addition, the allowances for losses on loans and advances for »Financial assets measured at fair value through other comprehensive income« is attributable to a net reversal of EUR 1 million.
3 The shares of investments accounted for using the equity method allocated to the segments amount to EUR 259 million for »Corporate Customers«, EUR 8 million for »Real Estate/Project Financ«e and EUR 0 million for »Corporate Items«.
4 In accordance with CRR/CRD IV

N
ote
s 1
77
C
on
soli
da
ted
fin
an
cia
l st
ate
me
nts
01/01 – 31/12/2017 EUR million
Corporate Customers
Real Estate/Project
Finance
Capital Markets
Business
Private Customers/
Savings Banks
Corporate Items/Recon-
ciliation/ Consolidation LBBW Group
Net interest income 726 300 321 322 – 82 1,587
Net fee and commission income 195 21 126 236 – 43 534
Net gains/losses on
remeasurement and disposal1 8 30 285 5 – 38 289
of which allowances for losses on loans and securities2 – 99 4 – 1 – 1 4 – 93
Other operating income/expenses 9 62 6 – 6 30 101
Total operating income/expenses 938 412 737 557 – 133 2,511
Administrative expenses – 603 – 131 – 480 – 581 – 29 – 1,824
Expenses for bank levy and
deposit guarantee system – 20 – 8 – 30 – 6 – 6 – 69
Guarantee commission for the
State of Baden-Württemberg 0 0 0 0 – 61 – 61
Net income/expenses from restructuring – 19 – 5 – 8 – 8 – 1 – 41
Consolidated profit/loss before tax 296 268 219 – 38 – 230 515
Income taxes – 97
Net consolidated profit/loss 419
Segment assets3 (EUR billion) 54.1 24.6 140.4 13.2 5.4 237.7
Risk weighted assets4 (EUR billion) 31.6 10.2 18.9 7.9 7.2 75.7
Tied-up equity4 (EUR billion) 2.8 0.9 1.7 0.7 6.8 12.9
RoE (in %) 9.7 23.0 9.9 <0 4.0
CIR (in %) 61.9 35.3 70.2 >100 76.4
1 Net income/investments from investments accounted for using the equity method allocated to the segments and results from the disposal of such companies amount to EUR 27 million for the »Corporate Customers« segment, EUR 8 million for the »Real Estate/Project Finance« segment and EUR – -5 million for »Corporate Items«.
2 Relates to the category »Financial assets measured at amortized cost«. In addition, the allowances for losses on loans and advances for »Financial assets measured at fair value through other comprehensive income« is attributable to a net addition of EUR -8 million.
3 The shares of investments accounted for using the equity method allocated to the segments amount to EUR 238 million for »Corporate Customers«, EUR 7 million for »Real Estate/Project Finance« and EUR 0 million for »Corporate Items«.
4 In accordance with CRR/CRD IV

N
ote
s 1
78
C
on
soli
da
ted
fin
an
cia
l st
ate
me
nts
Details on Corporate Items, Reconciliation and Consolidation
Corporate Items Reconciliation/Consolidation Corporate Items/Reconciliation/
Consolidation
EUR million 01/01 –
31/12/2018 01/01 –
31/12/2017 01/01 –
31/12/2018 01/01 –
31/12/2017 01/01 –
31/12/2018 01/01 –
31/12/2017
Net interest income 42 – 31 – 16 – 51 26 – 82
Net fee and commission income – 10 – 2 – 22 – 42 – 32 – 43
Net gains/losses on remeasurement and disposal1 – 30 24 – 21 – 62 – 51 – 38
of which allowances for losses on loans and securities2 – 56 4 0 0 – 56 4
Other operating income/expenses 18 30 0 0 18 30
Total operating income/expenses 20 21 – 59 – 155 – 39 – 133
Administrative expenses – 3 – 29 0 0 – 3 – 29
Expenses for bank levy and deposit guarantee system – 2 – 6 0 0 – 2 – 6
Guarantee commission for the State of Baden-Württemberg 0 – 61 0 0 0 – 61
Net income/expenses from restructuring 2 – 1 0 0 2 – 1
Consolidated profit/loss before tax 16 – 76 – 59 – 155 – 43 – 230
Segment assets3 (EUR billion) 5.6 6.9 0.0 – 1.5 5.6 5.4
Risk weighted assets4 (EUR billion) 8.2 8.9 – 2.1 – 1.7 6.2 7.2
Tied-up equity4 (EUR billion) 3.6 6.9 – 0.2 – 0.2 3.4 6.8
1 Net income/investments from investments accounted for using the equity method allocated to the segments and results from the disposal of such companies amount to EUR 26 million (previous year: EUR 27 million) for the »Corporate Customers« segment, EUR 2 million (previous year: EUR 8 million) for the »Real Estate/Project Finance« segment and EUR –4 million (previous year: EUR –5 million) for Corporate Items.
2 Relates to the category »Financial assets measured at amortized cost«. In addition, the allowances for losses on loans and advances for »Financial assets measured at fair value through other comprehensive income« is attributable to a net reversal of EUR 1 million in the current year (previous year: Net addition of EUR -8 million).
3 The shares of investments accounted for using the equity method allocated to the segments amount to EUR 259 million for »Corporate Customers« (previous year: EUR 238 million) , EUR 8 million for »Real Estate/Project Finance« (previous year: EUR 7 million) and EUR 0 million for »Corporate Items« (previous year: EUR 0 million).
4 In accordance with CRR/CRD IV
LBBW’s »consolidated profit/loss before tax« amounted to EUR 558 million in the 2018 financial year, somewhat above the previous year's result of EUR 515 million. The operating segments »Corporate Customers«, »Real Estate/Project Finance«, »Capital Markets Business« and »Private Customers / Savings Banks« made a substantial contribution totaling EUR 602 million to consolidated profit/loss before tax in 2018. Despite continued higher spending on future investment in the IT infrastructure, LBBW’s cost/income ratio (CIR) improved slightly to 72.8% (previous year: 76.4%). Business expansion in the »Corporate Customers« and »Real Estate/Project Finance« segments boosted LBBW’s total assets by EUR 3.5 billion to EUR 241.2 billion at the end of 2018, resulting in a moderate upturn in LBBW’s risk weighted assets to EUR 80.3 billion in the 2018 financial year (previous year: EUR 75.7 billion).
»Profit before tax« in the »Corporate Customers« segment was EUR 296 million, unchanged against the previous year. Volume growth in the lending business with SMEs and large corporate customers comfortably offset the ongoing pressure on margins resulting from low interest rates and intense competition. This, combined with the development of cross-selling proceeds, largely counteracted lower net investment income, which was shaped by positive measurement effects and sales proceeds from commercial investment business in the previous year. The segment’s need for allowances for losses on loans and advances was somewhat lower in the 2018 financial year at EUR -85 million (previous year: EUR -99 million) and so continues to reflect the good portfolio quality and favorable economic situation in LBBW's core markets. The segment was strained by the increased use of product specialists from other segments in the 2018 financial year. This resulted in a moderate increase in »administrative expenses« from EUR -603 million to EUR -621 million. »Expenses for the bank levy and deposit guarantee system« rose from EUR -20 million to EUR -26 million. In contrast, the absence of »restructuring expenses« (previous year: EUR -19 million) provided relief for the segment. Overall, this caused the CIR to increase

N
ote
s 1
79
C
on
soli
da
ted
fin
an
cia
l st
ate
me
nts
slightly to 62.9% (previous year: 61.9%). The increase in segment assets from EUR 54.1 billion to EUR 60.1 billion is due mainly to the expansion of financing with SMEs and large corporate customers. Risk weighted assets increased to EUR 36.0 billion (previous year: EUR 31.6 billion) due primarily to this business expansion.
At EUR 235 million, »profit before tax« in the »Real Estate/Project Finance« segment remained below the previous year's result of EUR 268 million, which reflected non-recurring effects. The growth in commercial real estate financing comfortably offset lower margins and the only gradual portfolio expansion in infrastructure and project financing. While allowances for losses on loans and advances were characterized by net reversals in the previous year (EUR +4 million), the segment saw moderate provisioning requirements of EUR -9 million in the 2018 financial year, reflecting the ongoing good portfolio quality. »Administrative expenses« also rose from EUR -131 million to EUR -142 million on account of growth initiatives in infrastructure and project finance, and so the CIR increased from 35.3% to 38.7%. The increase in segment assets from EUR 24.6 billion to EUR 28.0 billion is thanks chiefly to good new business in commercial real estate financing. Risk-weighted assets rose to EUR 13.1 billion (previous year: EUR 10.2 billion), in particular a result of this positive business performance.
In the face of a challenging environment, profit/loss before tax in the Capital Markets Business segment was EUR 46 million in 2018, down significantly on the previous year’s figure of EUR 219 million. Although the segment continues to hold leading positions in the issuing and certificates business, the result was marked by turbulence on the capital markets and low interest rates. Widening credit spreads and margin pressure on interest rate derivatives weighed particularly heavily. In addition, the previous year’s result was marked by higher proceeds from the sales of securities. Administrative expenses held steady at EUR -480 million. The CIR deteriorated from 70.2% to 92.5% on the back of the pronounced fall in income. At EUR 134.5 billion, segment assets were down on the previous year's figure (EUR 140.4 billion). Risk weighted assets during the 2018 financial year decreased in line with the volume development to EUR 16.7 billion (previous year: EUR 18.9 billion).
Profit before tax in the »Private Customers/Savings Banks« segment saw a pronounced improvement of EUR +63 million in the 2018 financial year, making a positive contribution to earnings of EUR 25 million (previous year: EUR -38 million). Administrative expenses saw a substantial year-on-year decline due to the absence of the costs of introducing the new core banking system incurred in the previous year, falling to EUR -527 million (previous year: EUR -581 million). Net reversals in allowances for losses on loans and advances and the absence of restructuring expenses provided additional relief for the segment, while net interest income and net fee and commission income were unable to match the previous year’s level. Changes in expenses brought about a significant improvement to the CIR, which remained just under 100% at 96.6%. At EUR 13.0 billion, segment assets were similar to the previous year's figure (EUR 13.2 billion). The segment’s Group's risk weighted assets increased slightly to EUR 8.3 billion in 2018 (previous year: EUR 7.9 billion).
Profit before tax in the »Corporate Items« segment improved significantly against the previous year to EUR 16 million (previous year: EUR -76 million), essentially a result of the disposal of the final remaining Sealink securities. After repaying outstanding loans, LBBW booked surplus proceeds of EUR 33 million in the 2018 financial year. The guarantee commission for the risk shield was no longer applicable (previous year: EUR -61 million). Lower income from the optimization of the Bank's building portfolio counteracted this development. Segment assets amounted to EUR 5.6 billion (previous year: EUR 6.9 billion). Risk weighted assets during the 2018 financial year came to EUR 8.2 billion (previous year: EUR 8.9 billion).

N
ote
s 1
80
C
on
soli
da
ted
fin
an
cia
l st
ate
me
nts
Reconciliation of segment results to the consolidated income statement In the 2018 financial year, the total of »Reconciliation/Consolidation« on the consolidated profit/loss before tax increased to EUR –59 million (previous year: EUR –155 million) and is essentially due to the following factors:
∙ In internal management reporting, net interest income is calculated on the basis of the market interest method. Differences compared to the income statement therefore result from prior-period net interest income and measurements specific to IFRS not included in internal management reporting (e.g. effects of purchase price allocation in connection with the takeover of Sachsen LB).
∙ Effects from close-out fees and associated derivatives premiums.
Disclosures at the company level Information about products and services
With regard to the allocation of income to products and services required under IFRS 8.32, please refer to the explanations entitled »Notes to the income statement« in the Notes.
Segmentation according to geographical region
The allocation of results to geographical regions is based on the head office of the branch or Group company and is as follows for LBBW:
01/01 – 31/12/2018 EUR million Germany
Europe (excl. Germany) America Asia
Recon-ciliation/
Consolidation LBBW Group
Total operating income/expenses 2,178 76 129 30 20 2,433
Consolidated profit/loss before tax 392 44 88 12 22 558
01/01 – 31/12/2017 EUR million Germany
Europe (excl. Germany) America Asia
Recon-ciliation/
Consolidation LBBW Group
Total operating income/expenses 2,197 131 163 24 – 4 2,511
Consolidated profit/loss before tax 283 100 128 6 – 1 515

N
ote
s 1
81
C
on
soli
da
ted
fin
an
cia
l st
ate
me
nts
Notes to the income statement
19. Net interest income Net interest income also includes interest and dividend income and the associated refinancing expenses for financial instruments mandatorily measured at fair value through profit or loss and for financial instruments designated at fair value. In addition, the payments to typical silent partners are reported under Interest expense due to the classification of silent partners' contributions as debt in accordance with IAS 32.
EUR million 01/01
– 31/12/2018 01/01
– 31/12/2017
Trading derivatives 9,532 7,523
Lending and money market transactions 2,696 2,448
Hedging derivatives 793 1,234
Fixed-income securities and debentures 149 171
Early termination fees 68 59
Leasing business 289 301
Other 392 411
Interest income 13,919 12,148
Equities and other non-fixed-income securities 16 6
Equity investments and affiliates 30 32
Profit transfer agreements 1 2
Income from equity instruments 47 40
Interest income and current income from equity instruments 13,966 12,187
Trading derivatives – 9,258 – 7,176
Hedging derivatives – 720 – 1,172
Deposits – 1,035 – 975
Securitized liabilities – 643 – 582
Leasing business – 40 – 53
Subordinated capital – 221 – 228
Other – 489 – 414
Interest expense – 12,406 – 10,600
Transfer of losses – 2 – 1
Expenses from equity instruments – 2 – 1
Interest expense and current expense from equity instruments – 12,408 – 10,601
Total 1,558 1,587
Despite historically low interest rates in the eurozone, net interest income was stable year-on-year. While the ECB tightened its monetary policy somewhat by discontinuing net purchases in its bond purchasing program at the end of 2018, key interest rates remained negative. Long-term interest rates also eased off over the course of the year, with the yield on 10-year Bunds even dropping 17 basis points year-on-year to 0.25% as a result. This development once again reduced the contribution from the investment of LBBW’s own funds and margins on deposits. In addition, results were negatively impacted by the intense competition within the banking sector, which was reflected by rising margin pressure on new business in particular. Declining margins were balanced out by business expansion, notably with corporate customers and real estate financers.

N
ote
s 1
82
C
on
soli
da
ted
fin
an
cia
l st
ate
me
nts
Net interest income for 2018 financial year included EUR 31 million (previous year: EUR 0 million) in connection with government grants under targeted longer-term refinancing operations II (TLTRO II).
After selling the final remaining Sealink securities and repaying outstanding loans, a residual amount remained to which the banks in question are entitled. Of this, LBBW accounted for a EUR 33 million share of the surplus as at 31 December 2018.
Against the backdrop of negative interest rates, capital commitment also gave rise to offsetting effects that affected interest income in the amount of EUR –230 million (previous year: EUR –210 million) and interest expense in the amount of EUR 220 million (previous year: EUR 184 million) in the past financial year.
Net interest income from financial assets and liabilities not measured at fair value through profit or loss are distributed on an accrual basis and break down as follows:
EUR million 01/01
– 31/12/2018 01/01
– 31/12/2017
Financial assets measured at amortized cost
Interest income 2,709 2,492
Interest expense 0 – 1
Financial assets measured at fair value through other comprehensive income
Interest income 270 166
Financial liabilities measured at amortized cost
Interest expense – 1,825 – 1,682
20. Net fee and commission income
EUR million 01/01
– 31/12/2018 01/01
– 31/12/2017
Securities and custody business 251 242
Payments business 125 123
Brokerage business 53 83
Loans and guarantees1 117 127
Other 96 73
Fee and commission income 643 649
Securities and custody business – 76 – 62
Payments business – 27 – 27
Loans and guarantees1 – 10 – 10
Brokerage business – 6 – 6
Leasing business – 3 – 3
Other – 8 – 7
Fee and commission expense – 129 – 115
Total 513 534
1 Includes lending, trustee, guarantee and credit business.
Income from payment transactions, securities and custody business are recognized on a pro-rata basis over the performance period. The transaction price is determined on the basis of the agreed payment and is recognized in the amount at which no reimbursement is anticipated. These services include providing credit and debit cards and services as part of portfolio management and custodian business.
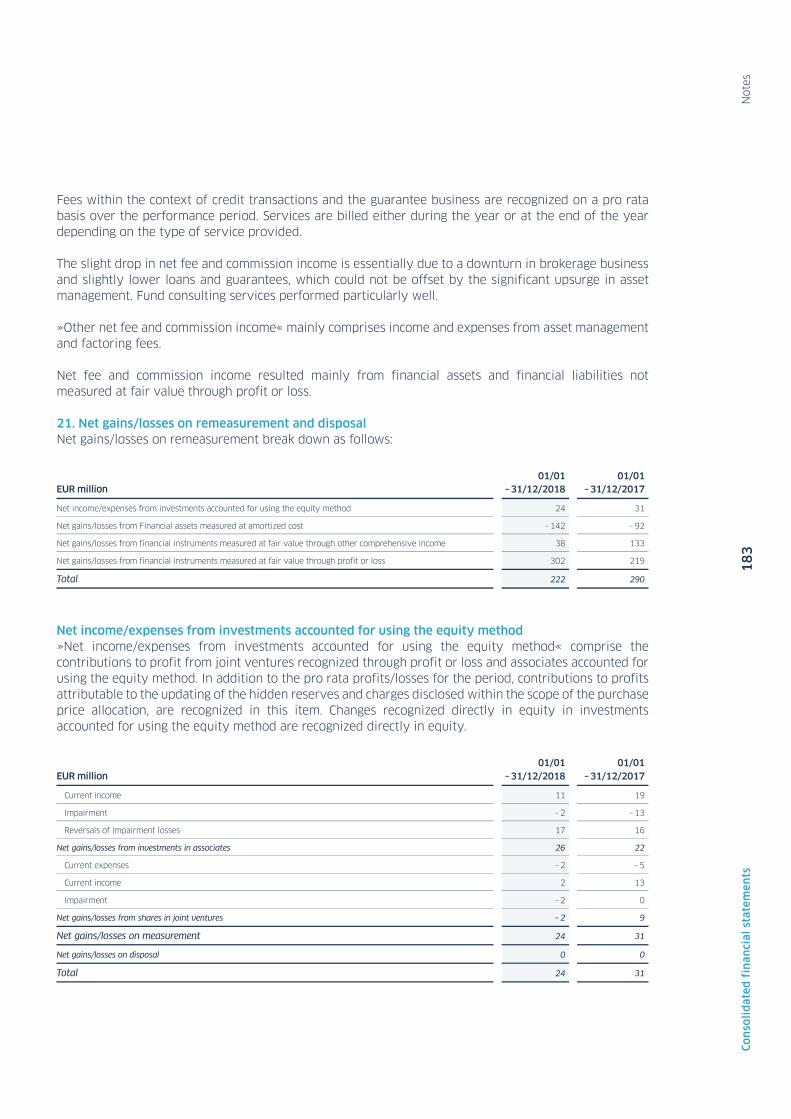
N
ote
s 1
83
C
on
soli
da
ted
fin
an
cia
l st
ate
me
nts
Fees within the context of credit transactions and the guarantee business are recognized on a pro rata basis over the performance period. Services are billed either during the year or at the end of the year depending on the type of service provided.
The slight drop in net fee and commission income is essentially due to a downturn in brokerage business and slightly lower loans and guarantees, which could not be offset by the significant upsurge in asset management. Fund consulting services performed particularly well.
»Other net fee and commission income« mainly comprises income and expenses from asset management and factoring fees.
Net fee and commission income resulted mainly from financial assets and financial liabilities not measured at fair value through profit or loss.
21. Net gains/losses on remeasurement and disposal Net gains/losses on remeasurement break down as follows:
EUR million 01/01
– 31/12/2018 01/01
– 31/12/2017
Net income/expenses from investments accounted for using the equity method 24 31
Net gains/losses from Financial assets measured at amortized cost – 142 – 92
Net gains/losses from financial instruments measured at fair value through other comprehensive income 38 133
Net gains/losses from financial instruments measured at fair value through profit or loss 302 219
Total 222 290
Net income/expenses from investments accounted for using the equity method »Net income/expenses from investments accounted for using the equity method« comprise the contributions to profit from joint ventures recognized through profit or loss and associates accounted for using the equity method. In addition to the pro rata profits/losses for the period, contributions to profits attributable to the updating of the hidden reserves and charges disclosed within the scope of the purchase price allocation, are recognized in this item. Changes recognized directly in equity in investments accounted for using the equity method are recognized directly in equity.
EUR million 01/01
– 31/12/2018 01/01
– 31/12/2017
Current income 11 19
Impairment – 2 – 13
Reversals of impairment losses 17 16
Net gains/losses from investments in associates 26 22
Current expenses – 2 – 5
Current income 2 13
Impairment – 2 0
Net gains/losses from shares in joint ventures – 2 9
Net gains/losses on measurement 24 31
Net gains/losses on disposal 0 0
Total 24 31

N
ote
s 1
84
C
on
soli
da
ted
fin
an
cia
l st
ate
me
nts
This change was driven by a drop in current income from associates and joint ventures that could not be offset by lower impairment.
Net gains/losses from Financial assets measured at amortized cost »Net gains/losses from financial assets measured at amortized cost« includes both net gains/losses on measurement and net gains/losses on disposal for transactions allocated to the business model »Hold« at LBBW that meet the contractual cash flow criterion:
EUR million 01/01
– 31/12/2018 01/01
– 31/12/2017
Reversal of/disposals from allowances for losses on loans and securities 249 164
Net gains/losses from provisions for lending business – 29 – 14
Recoveries on loans and securities previously written off 24 14
Direct loan write-offs – 20 – 24
Additions to allowances for losses on loans and securities – 364 – 229
Other expenses for the lending business – 3 – 3
Net gains/losses on remeasurement (allowances for losses on loans and securities) – 142 – 92
Securities net gains/losses on disposal 0 0
Gains from derecognition 1 0
Losses from derecognition 0 0
Net gains/losses on disposal 0 0
Total – 142 – 92
While the previous accounting standard IAS 39 stipulated that impairment losses are to be recognized only once a previously defined default event occurs, the new Standard IFRS 9, applicable from 1 January 2018 onwards, requires that expected losses are reported as allowances for losses on loans and advances so as to better absorb any economic fluctuations. This may result in situations where the modeling no longer delivers unbiased results, for example in the event of significant disruptive elements due to macroeconomic, political or legal developments that cannot yet be sufficiently accounted for in the ratings on which the allowances for losses on loans and advances are based. As well as taking into account forward-looking information on a parameter-specific basis, qualitative information, estimates, scenario analyses and simulations were therefore used to determinate whether and to what extent allowances for losses on loans and advances must be adjusted. Certain portfolios also required additional allowances for losses on loans and advances, which ultimately meant that total allowances for losses on loans and advances had to be increased. Nonetheless, LBBW continues to enjoy good portfolio quality, as demonstrated by the very high exposure share in the investment grade range.
Gains or losses recognized in profit or loss due to derecognizing financial assets measured at amortized cost resulted from the following:
31/12/2018
EUR million Derecognition
gain Derecognition
loss
Derecognition due to sale 1 0

N
ote
s 1
85
C
on
soli
da
ted
fin
an
cia
l st
ate
me
nts
Net gains/losses from financial instruments measured at fair value through other comprehensive income »Net gains/losses from financial instruments measured at fair value through other comprehensive income« shows allowances for losses on loans and advances to be recognized in profit or loss for net gains/losses from financial instruments allocated to the LBBW business model »Hold to Collect and Sell« that meet the contractual cash flow criterion. The change in the fair value of these financial instruments is recognized through »other comprehensive income«.
EUR million 01/01
– 31/12/2018 01/01
– 31/12/2017
Reversal of/disposals from allowances for losses on loans and securities 2 0
Additions to allowances for losses on loans and securities – 1 – 8
Net gains/losses on remeasurement (allowances for losses on loans and securities) 1 – 8
Net gains/losses on disposal 37 141
Net gains/losses on disposal 37 141
Total 38 133
The marked decline in net income from financial instruments measured at fair value through other comprehensive income was caused by lower contributions from securities and equity investments. Following the introduction of IFRS 9 and from the 2018 financial year onwards, the earnings contributions from equity investments are reported under »net gains/losses from financial instruments measured at fair value through profit or loss«.
Net gains/losses from financial instruments measured at fair value through profit or loss »Net gains/losses from financial instruments measured at fair value through profit or loss« includes the net gains/losses on remeasurement and disposal for financial assets allocated to the business model »Sell« and for transactions that do not meet the contractual cash flow criterion. In addition, this reports net gains/losses from hedging transactions, net gains/losses from financial instruments designated at fair value and net gains/losses from non-consolidated equity investments and affiliates for which the option to measure through other comprehensive income at fair value was not exercised.

N
ote
s 1
86
C
on
soli
da
ted
fin
an
cia
l st
ate
me
nts
EUR million 01/01
– 31/12/2018 01/01
– 31/12/2017
Portfolio fair value hedge – 12 3
of which hedged items 38 – 71
of which hedging instruments – 51 74
Micro fair value hedge 0 1
of which hedged items 45 – 53
of which hedging instruments – 45 54
Net gains/losses from hedge accounting – 12 4
Lending business – 4 107
Equity transactions – 506 243
Foreign exchange transactions 12 – 35
Economic hedging derivatives 128 – 219
Interest rate transactions 604 44
Gains/losses from foreign exchange/commodity products 7 – 12
Net trading gains/losses 241 128
Net gains/losses from financial assets – 3 5
Net gains/losses from financial liabilities 21 82
Net income/loss from financial instruments designated at fair value 18 87
Net gains/losses from bills – 1 n/a
Net gains/losses from credits and loans 24 n/a
Net gains/losses from equity investments 11 n/a
Net gains/losses from investments in affiliates 3 n/a
Net gains/losses from shares and other equity instruments 18 n/a
Net gains/losses from financial instruments measured at fair value through profit or loss not classified as held for
trading and financial investments in equity instruments 55 n/a
Total 302 219
Capital market activities contributed EUR 290 million to the result, while banking book management contributed EUR 25 million. Hedge accounting had a slightly negative effect of EUR –12 million.
In addition to net gains/losses on remeasurement and disposal from transactions that do not satisfy the contractual cash flow criterion, net gains and losses from non-consolidated equity investments and affiliates that were previously measured at fair value through other comprehensive income are now reported under this item in accordance with IFRS 9. Net gains from shares and other equity instruments benefited from a subsequent purchase price payment in connection with a disposal of an equity investment in the 2015 financial year.
Currency translation differences recognized in currency gains/losses from financial instruments not measured at fair value through profit or loss amounted to EUR – 300 million (previous year: EUR – 883 million).

N
ote
s 1
87
C
on
soli
da
ted
fin
an
cia
l st
ate
me
nts
22. Other operating income/expenses The key components of »other operating income/expenses« are income or expenses from investment property, inventories and provisions.
EUR million 01/01
– 31/12/2018 01/01
– 31/12/2017
Disposal of inventories 159 154
Reversal of other provisions 42 32
Revenue from property services 15 16
Income from cost refunds by third parties 32 27
Management of other property portfolios 3 1
Operating leases 20 21
Fixed assets and intangible assets 1 1
Rental income from investment property 52 50
Income from the disposal of investment property 0 13
Net income from the fair value measurement of investment property 32 40
Foreign currency translation on investment property 0 – 2
Miscellaneous operating income 70 95
Other operating income 425 448
Disposal of inventories – 135 – 138
Addition to other provisions – 39 – 85
Operating leases – 6 – 7
Operating expenses for leased properties – 13 – 16
Net losses from the fair value measurement of investment property – 1 – 11
Miscellaneous operating expenses – 91 – 90
Other operating expenses – 285 – 347
Total 140 101
Net reversals amounted to EUR 3 million in the current year, up on net additions to provisions of EUR – 53 million in the previous year.
The income and expenses from the disposal of inventories essentially resulted from the sale of land and buildings in addition to development measures.

N
ote
s 1
88
C
on
soli
da
ted
fin
an
cia
l st
ate
me
nts
23. Administrative expenses LBBW's »administrative expenses« comprise staff costs and other administrative expenses, as well as depreciation and write-downs of property and equipment and amortization and write-downs of intangible assets.
EUR million 01/01
– 31/12/2018 01/01
– 31/12/2017
Wages and salaries – 700 – 716
Expenses for pensions and benefits – 130 – 132
Social security contributions – 111 – 113
Other staff costs – 61 – 65
Staff costs – 1,002 – 1,026
IT costs – 311 – 336
Legal and consulting expenses – 70 – 99
Expenses from operating leases – 52 – 44
Cost of premises – 56 – 51
Association and other contributions – 36 – 30
Advertising, public relations and representation costs – 30 – 26
Audit costs – 12 – 13
Miscellaneous administrative expenses – 99 – 92
Other administrative expenses – 667 – 691
Amortization and write-downs of intangible assets1 – 69 – 71
Depreciation and write-downs of property and equipment1 – 35 – 36
Depreciation, amortization and write-downs – 104 – 108
Total – 1,773 – 1,824
1 This includes scheduled and unscheduled write-downs. The partial amount of the unscheduled write-downs can be found in Notes 33 and 35.
Administrative expenses were down marginally year-on-year. Reflecting the reduction in the number of employees and lower pension expenses, staff costs were down despite offsetting effects from pay-scale adjustments.
Other administrative expenses decreased as well, in particular as a result of a reduction in IT costs, which had included high expenses for the operational launch of the new core banking system in April 2017. Nonetheless, investment in the modernization of IT, not least for more extensive digitalization, was at a high level.
For further explanations on leasing business, please see Note 60.
Expenses for pensions and other benefits included:
EUR million 01/01
– 31/12/2018 01/01
– 31/12/2017
Expenses for defined benefit obligations – 121 – 123
Net interest income from defined benefit plans – 54 – 54
Service cost – 67 – 70
Other income and expenses, including income from the release of provisions for pension plans and currency translation 0 1
Other expenses for pensions and benefits – 6 – 7
Expenses for defined contribution obligations – 2 – 2
Total – 130 – 132

N
ote
s 1
89
C
on
soli
da
ted
fin
an
cia
l st
ate
me
nts
In addition to the expenses for pensions, LBBW paid EUR -57 million (previous year: EUR –59 million) in the 2017 financial year into the German pension fund for employees and recorded this as an expense under social security contributions.
The fee of EUR -12 million (previous year: EUR -13 million) for audit costs comprised the following items:
EUR million 01/01
– 31/12/2018 01/01
– 31/12/2017
Audit services – 11 – 11
Other audit-related services – 1 – 1
Other services 0 – 1
Total – 12 – 13
The audit services related above all to the audits of the annual financial statements and the consolidated financial statements of the parent company, as well as various audits of the annual financial statements of its subsidiaries including mandatory extensions of contract and key points of the audit agreed with the Supervisory Board. Audit reviews of financial statements and project-related audits of IT-supported accounting-related systems and project-related audits on the introduction of new accounting-related standards were integrated in the audit.
The other audit-related services concern the issue of a comfort letter in conjunction with the issue of debentures and mandatory or contractually-agreed audits, such as the audit pursuant to Section 16j (2) sentence 2 of the German Act Establishing the Federal Financial Supervisory Authority (Gesetz über die Bundesanstalt für Finanzdienstleistungsaufsicht – FinDAG), the audit pursuant to Section 36 German Securities Trading Act (Wertpapierhandelsgesetz – WpHG) and Section 68 (7) of the German Capital Investment Code (Kapitalanlagegesetzbuch – KAGB), and the audit for assessing the contribution for the bank-related guarantee system of the Sparkassen-Finanzgruppe, which is recognized as a deposit guarantee system under Section 5 (1) of the German Deposit Guarantee Act (Einlagensicherungsgesetz – EinSiG).
The tax advisory services comprise services rendered in connection with the preparation of tax returns.
Other services include quality assurance activities and training courses.
24. Net income/expenses from restructuring Expenses for restructuring measures are reported in this item. Provisions are only recognized if the general criteria for creating provisions in accordance with IAS 37 are fulfilled.
EUR million 01/01
– 31/12/2018 01/01
– 31/12/2017
Reversal of provisions for restructuring measures 3 3
Additions to restructuring provisions – 15 – 43
Total – 12 – 41
The new measures focus on adjusting the organizational setup and monitoring the product portfolio in selected units in Capital Markets Business. The previous year was marked by measures in back office divisions and retail customer business.

N
ote
s 1
90
C
on
soli
da
ted
fin
an
cia
l st
ate
me
nts
25. Income taxes Income and expenses from income taxes are broken down as follows:
EUR million 01/01
– 31/12/2018 01/01
– 31/12/2017
Current income taxes in the reporting period – 56 – 70
Current income taxes from previous years – 38 – 15
Current income taxes – 94 – 85
of which decrease in actual income tax expense from utilization of previously unrecognized loss carryforwards
and tax credits 7 38
Deferred income taxes – 45 – 12
of which deferred income tax expense/income from change in temporary differences 184 10
of which deferred income tax expense/income from change in deferred tax assets from loss carryforwards – 229 – 22
of which deferred tax expense/income from change in tax rates 0 – 19
of which deferred tax expense from write-downs or the reversal of earlier write-downs 15 – 3
of which decrease in deferred income tax expense from previously unrecognized loss carryforwards and tax
credits 12 34
Total – 139 – 97
The following reconciliation shows the relationship between reported and expected income taxes:
EUR million 01/01
– 31/12/2018 01/01
– 31/12/2017
Consolidated profit/loss before tax 558 515
Applicable tax rate 30.42% 30.42%
Expected income taxes – 170 – 157
Tax effects
from non-deductible operating expenses – 43 – 49
from tax-free income 33 35
from change to value adjustments 2 61
from taxes from the previous year recorded in the financial year 34 – 19
from permanent tax effects 9 3
from changes in tax rates 0 – 19
from differing tax rates affecting on deferred taxes as shown in profit or loss 0 36
from other differences – 3 12
Total – 139 – 97
The applicable tax rate for the reconciliation is calculated as the corporate income tax rate of 15.0% applicable in Germany at the reporting date (previous year: 15.0%), plus the solidarity surcharge of 5.5% (previous year: 5.5%) and the trade tax rate (average: 14.59%, previous year: 14.59%) depending on the relevant multiplier (Hebesatz). This results in a total domestic tax rate of 30.42% for the Group (previous year: 30.42%).
The tax effect of non-deductible operating expenses is influenced primarily by the bank levy and effects from the tax regulations on the interest expense/income of the New York branch (Section 50 d (9) of the German Income Tax Act).
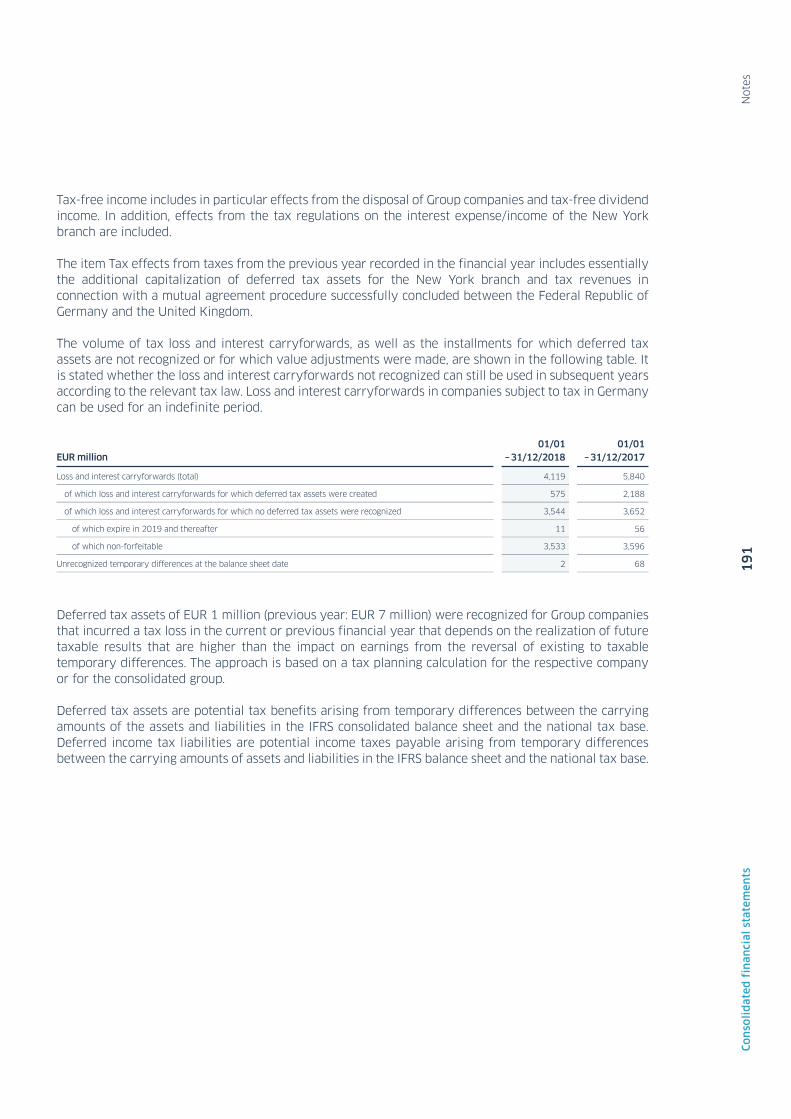
N
ote
s 1
91
C
on
soli
da
ted
fin
an
cia
l st
ate
me
nts
Tax-free income includes in particular effects from the disposal of Group companies and tax-free dividend income. In addition, effects from the tax regulations on the interest expense/income of the New York branch are included.
The item Tax effects from taxes from the previous year recorded in the financial year includes essentially the additional capitalization of deferred tax assets for the New York branch and tax revenues in connection with a mutual agreement procedure successfully concluded between the Federal Republic of Germany and the United Kingdom.
The volume of tax loss and interest carryforwards, as well as the installments for which deferred tax assets are not recognized or for which value adjustments were made, are shown in the following table. It is stated whether the loss and interest carryforwards not recognized can still be used in subsequent years according to the relevant tax law. Loss and interest carryforwards in companies subject to tax in Germany can be used for an indefinite period.
EUR million 01/01
– 31/12/2018 01/01
– 31/12/2017
Loss and interest carryforwards (total) 4,119 5,840
of which loss and interest carryforwards for which deferred tax assets were created 575 2,188
of which loss and interest carryforwards for which no deferred tax assets were recognized 3,544 3,652
of which expire in 2019 and thereafter 11 56
of which non-forfeitable 3,533 3,596
Unrecognized temporary differences at the balance sheet date 2 68
Deferred tax assets of EUR 1 million (previous year: EUR 7 million) were recognized for Group companies that incurred a tax loss in the current or previous financial year that depends on the realization of future taxable results that are higher than the impact on earnings from the reversal of existing to taxable temporary differences. The approach is based on a tax planning calculation for the respective company or for the consolidated group.
Deferred tax assets are potential tax benefits arising from temporary differences between the carrying amounts of the assets and liabilities in the IFRS consolidated balance sheet and the national tax base. Deferred income tax liabilities are potential income taxes payable arising from temporary differences between the carrying amounts of assets and liabilities in the IFRS balance sheet and the national tax base.

N
ote
s 1
92
C
on
soli
da
ted
fin
an
cia
l st
ate
me
nts
Deferred tax assets and liabilities were recognized in connection with the following items in the 2018 financial year:
Deferred tax
assets Deferred tax
liabilities
EUR million 2018 2018
Assets
Financial assets measured at amortized cost 838 – 451
Financial assets measured at fair value through other comprehensive income 85 0
Financial assets designated at fair value 0 – 34
Financial assets mandatorily measured at fair value through profit or loss 2,790 – 163
Portfolio hedge adjustment attributable to assets 0 – 174
Intangible assets 2 – 26
Property and equipment/investment property 21 – 90
Other assets 124 – 7
Equity and liabilities
Financial liabilities measured at amortized cost 591 – 704
Financial assets designated at fair value 224 0
Financial liabilities mandatorily measured at fair value through profit or loss 1 – 2,703
Portfolio hedge adjustment attributable to liabilities 78 – 60
Provisions 644 – 1
Other liabilities 42 – 4
Loss and interest carryforwards 86 0
Outside basis differences 0 – 3
Net amount – 4,393 4,393
Total 1,133 – 27
Change in the balance from deferred taxes 117
of which changes recognized in profit or loss – 45
of which from valuation reserves (from FVOCI financial instruments) 76
of which measurement gains/losses of financial liabilities – 12
of which retained earnings (provisions – actuarial gains/losses) 16
of which other changes recognized directly in equity (first-time adoption IFRS 9) 82
In the financial year, the valuation reserve (gains/losses on financial instruments measured at fair value through other comprehensive income) recognized tax effects totaling EUR 1 million (previous year: EUR 1 million) for deferred tax assets from loss carryforwards.
No deferred tax liabilities were recognized for taxable temporary differences of EUR 5 million (previous year: EUR 4 million) from shares in subsidiaries and joint ventures, since a reversal of the temporary differences is not expected in the near future.

N
ote
s 1
93
C
on
soli
da
ted
fin
an
cia
l st
ate
me
nts
In the previous year, deferred tax assets and liabilities were recognized in connection with the following items:
Deferred tax
assets Deferred tax
liabilities
EUR million 2017 2017
Assets
Loans and advances (including allowances for losses on loans and advances) 51 – 779
Financial assets measured at fair value through profit or loss 2,447 – 57
Financial investments 44 – 27
Intangible assets 3 – 23
Property and equipment/investment property 20 – 87
Other assets 8 – 53
Equity and liabilities
Liabilities 722 – 348
Financial liabilities measured at fair value through profit or loss 0 – 1,793
Provisions 605 – 1
Other liabilities 54 – 111
Loss and interest carryforwards 316 0
Outside basis differences 0 – 3
Net amount – 3,254 3,254
Total 1,016 – 28
Change in the balance from deferred taxes – 17
of which changes recognized in profit or loss – 12
of which from revaluation reserve (financial investments – gains/losses on financial assets (AfS)) 2
of which measurement gains/losses of financial liabilities 4
of which retained earnings (provisions – actuarial gains/losses) – 5
of which other changes recognized directly in equity – 6

N
ote
s 1
94
C
on
soli
da
ted
fin
an
cia
l st
ate
me
nts
Notes to the balance sheet
26. Cash and cash equivalents
EUR million 31/12/2018 31/12/2017
Balances with central banks 24,540 22,565
Cash 181 164
Total 24,721 22,729
Excess liquidity on the money markets led to rising central bank balances within cash and cash equivalents. Balances with central banks included balances with Deutsche Bundesbank of EUR 24,418 million (previous year: EUR 17,410 million).
27. Financial assets measured at amortized cost Financial assets belonging to portfolios with the »Hold« business model and which meet the requirements for a simple loan agreement are reported in this statement of financial position item. The item exclusively comprises non-derivative debt instruments such as receivables and securities.
Loans and advances to banks The breakdown of loans and advances to banks by type of business is as follows:
EUR million 31/12/2018 31/12/2017
Public-sector loans 27,813 26,462
Current account claims 1,169 1,015
Securities repurchase transactions 7,673 10,148
Other loans 2,919 2,340
Borrower’s note loans 70 6
Overnight and term money 5,680 7,189
Mortgage loans 565 298
Other receivables 867 725
Total, gross 46,756 48,184
Allowances for losses on loans and securities – 6 – 5
Total, net 46,749 48,179
The breakdown of loans and advances to banks by region is as follows:
EUR million 31/12/2018 31/12/2017
Banks within Germany 33,541 33,842
Banks outside Germany 13,215 14,341
Total, gross 46,756 48,184
Allowances for losses on loans and securities – 6 – 5
Total, net 46,749 48,179
A fall in business with major European banks led in particular to a drop in securities repurchase business and overnight and term deposits. The stronger development in loan business with savings banks allowed public-sector loans to rise.

N
ote
s 1
95
C
on
soli
da
ted
fin
an
cia
l st
ate
me
nts
Of loans and advances to banks (gross), EUR 22,353 million (previous year: EUR 20,960 million) had a term of over twelve months as at the reporting date.
Loans and advances to customers The breakdown of loans and advances to customers by type of business is as follows:
EUR million 31/12/2018 31/12/2017
Other loans 24,493 22,862
Mortgage loans 32,219 30,506
Public-sector loans 12,308 17,479
Receivables from finance leases 5,307 5,367
Transmitted loans 3,308 3,199
Securities repurchase transactions 11,947 10,830
Current account claims 2,870 2,761
Overnight and term money 6,240 5,599
Borrower’s note loans 6,298 5,413
Other receivables 5,091 4,316
Total, gross 110,080 108,332
Allowances for losses on loans and securities – 849 – 679
Total, net 109,231 107,652
The breakdown of loans and advances to customers by region is as follows:
EUR million 31/12/2018 31/12/2017
Customers within Germany 75,332 76,520
Customers outside Germany 34,748 31,812
Total, gross 110,080 108,332
Allowances for losses on loans and securities – 849 – 679
Total, net 109,231 107,652
»Loans and advances to customers« was up as at 31 December 2018, a result mainly of business activities with corporate customers and real estate financers. In connection with the transition to IFRS 9, transactions that did not satisfy the contractual cash flow criterion on account of adverse collateral agreements were allocated to financial assets mandatorily measured at fair value through profit or loss in the amount of EUR 2.8 billion. A portfolio of EUR 2.3 billion used for short-term liquidity management was allocated to the »Hold to collect and sell« business model, and is therefore reported at fair value through other comprehensive income.
The sale of the final securities from the former Sachsen LB was completed this year. The repayment of the guarantee finance loan reduced other loans by EUR 1.8 billion. This was offset by new business with SME customers and large companies and by real estate financing, resulting in an increase in the »Other loans« item.
Loans and advances to customers (gross) amounting to EUR 69,926 million (previous year: EUR 76,344 million) had a term of over twelve months as at the reporting date.
For explanations on leasing business, see Note 60.

N
ote
s 1
96
C
on
soli
da
ted
fin
an
cia
l st
ate
me
nts
Debentures and other fixed-income securities
EUR million 31/12/2018 31/12/2017
Money market instruments 0 282
Government bonds and government debentures 394 n/a
Other bonds and debentures 762 1,382
Total, gross 1,155 1,663
Allowances for losses on loans and securities – 10 – 1
Total, net 1,146 1,663
The item contains EUR 43 million (previous year: EUR 0 million) in total collateral provided with the protection buyer's right to resell or repledge.
Debentures and other fixed-income securities amounting to EUR 1,027 million (previous year: EUR 1,657 million) had a term of over twelve months as at the reporting date.
28. Financial assets measured at fair value through other comprehensive income The balance sheet item »Financial assets measures at fair value through other comprehensive income« includes debt instruments allocated to the LBBW business model »Hold to Collect and Sell« that meet the contractual cash flow criterion. This item also contains equity instruments for which the option of measurement at fair value through other comprehensive income in accordance with IFRS 9.4.1.4 was exercised.
EUR million 31/12/2018 31/12/2017
Money market instruments 963 1,764
Bonds and debentures 18,523 18,649
Debentures and other fixed-income securities 19,487 20,413
Receivables 2,825 n/a
Investment fund units 0 14
equity investments 507 699
Shares in affiliates 2 59
Equity instruments 509 772
Total 22,821 21,185
The increase in this balance sheet item essentially reflects the reclassification of a portfolio used for short-term liquidity management (LCR) as part of the transition to IFRS 9. As part of the transition to IFRS 9, the majority of equity investments were also reclassified from measurement through other comprehensive income to measurement through profit or loss, causing this item to decrease.
Allowances for losses on loans and securities for financial assets measured at fair value through other comprehensive income are shown under Note 45.
The item contains EUR 825 million (previous year: EUR 1,376 million) in total collateral provided with the protection buyer's right to resell or repledge.
»Financial assets measured at fair value through other comprehensive« income amounting to EUR 19,341 million (previous year: EUR 19,034 million) had a term of over twelve months as at the reporting date.

N
ote
s 1
97
C
on
soli
da
ted
fin
an
cia
l st
ate
me
nts
29. Financial assets designated at fair value »Financial assets designated at fair value« comprise financial assets that are voluntarily recognized at fair value through profit or loss. The balance sheet item exclusively comprises debt instruments that meet the requirements for a simple loan agreement and which belong to portfolios with the »Hold« or »Hold to collect and sell« business models.
EUR million 31/12/2018
Bonds and debentures 44
Debentures and other fixed-income securities 44
Receivables 1,163
Total 1,207
EUR million 31/12/2017
Debentures and other fixed-income securities 110
Bonds and debentures 110
Equities and other non-fixed-income securities 215
Investment fund units 214
Other 408
Borrower’s note loans 408
Total 732
Certain transactions that were still measured at amortized cost under IAS 39 are now designated at fair value under IFRS 9, as accounting mismatches would otherwise occur.
»Financial assets designated at fair value« amounting to EUR 1,146 million (previous year: EUR 403 million) had a term of over twelve months as at the reporting date.
30. Financial assets mandatorily measured at fair value through profit or loss This balance sheet item includes hedging instruments of hedge relationships that are active as at the reporting date with positive market values, financial instruments allocated to the business model »Sell« and transactions that do not meet the contractual cash flow criterion. Non-consolidated equity investments and affiliates for which the option to measure through other comprehensive income at fair value was not exercised are also reported here.
Financial assets mandatorily measured at fair value through profit or loss break down as follows:
EUR million 31/12/2018 31/12/2017
Positive fair values from hedging derivatives 1,969 1,956
Trading assets 26,459 28,698
Financial instruments measured at fair value through profit or loss, not classified as held for trading, and financial investments in equity instruments 1,375 n/a
Total 29,803 30,654

N
ote
s 1
98
C
on
soli
da
ted
fin
an
cia
l st
ate
me
nts
Positive fair values from hedging derivatives The positive fair values from derivatives which are essentially used to secure hedged items against the interest rate risk and meet the requirements of IFRS hedge accounting are included in this item. Interest rate swaps and cross-currency interest rate swaps were designated as hedging instruments.
EUR million 31/12/2018 31/12/2017
Positive fair values from portfolio fair value hedges 1,625 1,560
Positive fair values from micro fair value hedges 344 396
Total 1,969 1,956
Positive fair values from derivative hedging instruments amounting to EUR 1,764 million (previous year: EUR 1,770 million) had a term of over twelve months as at the reporting date.
The »positive fair values from derivative hedging instruments« were broken down by hedged items as follows:
EUR million 31/12/2018 31/12/2017
Assets
Debentures and other fixed-income securities FVOCR 3 5
Equity and liabilities
Derivative hedging instruments on deposits from banks 17 20
Derivative hedging instruments on deposits from customers 80 92
Derivative hedging instruments on securitized liabilities 33 35
Derivative hedging instruments on subordinated liabilities 211 242
Derivative hedging instruments on portfolio fair value hedges 1,625 1,560
Total 1,969 1,956
Trading assets This shows financial assets allocated to the LBBW business model »Sell«.
EUR million 31/12/2018 31/12/2017
Positive fair values from derivative financial instruments 15,498 17,747
Money market instruments 320 382
Bonds and debentures 5,211 5,796
Debentures and other fixed-income securities 5,531 6,178
Borrower’s note loans 3,235 2,704
Other money market transactions 17 34
Other receivables 1,092 159
Receivables 4,344 2,897
Equities 402 718
Investment fund units 685 1,157
Equity instruments 1,087 1,876
Total 26,459 28,698

N
ote
s 1
99
C
on
soli
da
ted
fin
an
cia
l st
ate
me
nts
In particular, netting effects and low customer activity in derivatives led to a decline in the trading portfolio as a result of operating activities. On the other hand, receivables arising from new business rose.
The item contains EUR 283 million (previous year: EUR 110 million) in total collateral provided with the protection buyer's right to resell or repledge.
Trading assets amounting to EUR 19,834 million (previous year: EUR 20,913 million) had a term of over twelve months as at the reporting date.
Financial instruments measured at fair value through profit or loss, not classified as held for trading, and financial investments in equity instruments This subitem includes transactions that do not meet the contractual cash flow criterion and non-consolidated equity investments and affiliates for which the option to measure through other comprehensive income at fair value was not exercised.
EUR million 31/12/2018 31/12/2017
Bonds 13 n/a
Silent partner contributions 5 n/a
Debentures and other fixed-income securities 18 n/a
Loans and advances to customers 890 n/a
Receivables 890 n/a
Equities 12 n/a
Investment fund units 269 n/a
equity investments 155 n/a
Shares in affiliates 31 n/a
Equity instruments 467 n/a
Total 1,375 n/a
Assets of EUR 689 million had a term of over twelve months as at the reporting date.
31. Shares in investments accounted for using the equity method
EUR million 31/12/2018 31/12/2017
Associates 262 240
Joint ventures 5 4
Total 266 245
32. Non-current assets held for sale and disposal groups In the course of the constant optimization of its portfolio, LBBW held or concluded negotiations for the sale of non-current assets held for sale and disposal groups in the period under review.

N
ote
s 2
00
C
on
soli
da
ted
fin
an
cia
l st
ate
me
nts
Compared with the previous year, the following changes arose in relation to the non-current assets and disposal groups classified as held for sale:
∙ An »investment property« was classified as held for sale in the first half of 2017. The intention to sell this property was given up in the first half of 2018. Accordingly, the property was reclassified to »Investment property«. This affects the »Corporates Items« reporting segment.
∙ Sales negotiations for an investment property allocated to the »Real Estate/Project Finance« segment started in the second half of 2017. The property was sold in the first half of 2018.
∙ In addition, sales talks began for three investment properties in the second half of 2018. The contract has already been signed for one property in the »Corporate Items« segment and two further properties in the »Real Estate/Project Finance« segment were sold after the balance sheet date as at 31 December 2018.
∙ Sales talks for two properties reported as property and equipment began in the reporting period. The contract has already been signed for both properties. This relates to the »Corporate Items« reporting segment.
The main groups of assets and liabilities held for sale were as follows:
EUR million 31/12/2018 31/12/2017
Assets
Investment property 23 104
Property and equipment 1 0
Total 24 104
33. Intangible assets Amortization and write-downs, both scheduled and unscheduled – with the exception of »goodwill« (separate item in the income statement) – are recognized in the Amortization and write-downs of intangible assets item under Administrative expenses.

N
ote
s 2
01
C
on
soli
da
ted
fin
an
cia
l st
ate
me
nts
The changes in »intangible assets« are shown in the following tables for 2018 and 2017:
EUR million Purchased
software
Advance payments and
cost for development
and preparation
Other intangible
assets
Internally generated intangible
assets Total
Historical cost
Balance as at 1 January 2018 857 20 88 46 1,010
Changes in the basis of consolidation 1 0 0 0 1
Additions 12 20 0 18 49
Transfers 12 – 19 0 7 0
Disposals – 20 0 – 1 – 1 – 21
Balance as at 31 December 2018 862 20 87 70 1,039
Amortization and impairment losses/reversals of
impairment losses
Balance as at 1 January 2018 – 710 0 – 37 – 19 – 766
Scheduled amortization – 53 0 – 4 – 13 – 69
Disposals 19 0 1 1 21
Balance as at 31 December 2018 – 744 0 – 40 – 31 – 815
Carrying amounts
Balance as at 1 January 2018 147 20 51 27 244
Balance as at 31 December 2018 118 20 47 39 224
EUR million Purchased
software
Advance payments and
cost for development
and preparation
Other intangible
assets
Internally generated intangible
assets Total
Historical cost
Balance as at 1 January 2017 790 69 88 20 968
Additions 44 14 0 8 67
Transfers 47 – 64 0 17 0
Disposals – 24 0 0 0 – 24
Balance as at 31 December 2017 857 20 88 46 1,010
Amortization and impairment losses/reversals of
impairment losses
Balance as at 1 January 2017 – 675 0 – 33 – 11 – 719
Scheduled amortization – 56 0 – 4 – 9 – 69
Unscheduled write-downs – 2 0 0 0 – 2
Disposals 24 0 0 0 24
Balance as at 31 December 2017 – 710 0 – 37 – 19 – 766
Carrying amounts
Balance as at 1 January 2017 115 69 55 10 249
Balance as at 31 December 2017 147 20 51 27 244

N
ote
s 2
02
C
on
soli
da
ted
fin
an
cia
l st
ate
me
nts
Intangible assets of EUR 162 million (previous year: EUR 170 million) had a remaining useful life of more than twelve months as at the reporting date.
34. Investment property The carrying amounts of the investment property measured at fair value developed as follows in the year under review:
EUR million 2018 2017
Carrying amount as at 1 January 554 574
Additions 97 6
Disposals – 25 – 8
Changes in the basis of consolidation 0 78
Reclassification to non-current assets or disposal groups held for sale – 23 – 107
Reclassification from non-current assets or disposal groups held for sale 61 0
Currency translation differences 4 – 14
Changes in fair value from assets (through profit or loss) 28 25
Carrying amount as at 31 December 697 554
For information on reclassification from/to »non-current assets or disposal groups held for sale« see Note 37.
»Investment property« of EUR 697 million (previous year: EUR 554 million) had a remaining useful life of more than twelve months as at the reporting date.
See Note 49 for additional quantitative information, in particular relating to the requirements under IFRS 13.

N
ote
s 2
03
C
on
soli
da
ted
fin
an
cia
l st
ate
me
nts
35. Property and equipment Amortization and write-downs (both scheduled and unscheduled) are recognized under the »depreciation of property and equipment« item in »administrative expenses«.
The following table shows the changes in property and equipment in the year under review and the previous year:
EUR million
Land and
buildings
Technical
equipment
and
machinery
Operating
and office
equipment
Advance
payments
and assets
under
construction
Leased assets
under finance
leases
Leased assets
under
operating
leases Total
Historical cost
Balance as at 1 January 2018 880 132 255 1 9 258 1,535
Changes in the basis of
consolidation 0 0 1 0 0 0 1
Currency translation differences – 1 0 0 0 0 0 – 1
Additions 12 1 9 2 0 0 24
Transfers 61 0 0 0 0 – 61 0
Disposals 0 – 1 – 13 0 0 0 – 14
Transfers to non-current assets and disposal groups held for sale – 3 0 0 0 0 – 1 – 4
Balance as at 31 December 2018 949 132 252 2 9 197 1,541
Amortization and impairment losses/reversals of impairment losses
Balance as at 1 January 2018 – 582 – 119 – 180 0 – 7 – 165 – 1,053
Scheduled amortization – 20 – 3 – 11 0 – 1 – 6 – 40
Unscheduled write-downs – 1 0 0 0 0 0 – 1
Reversals of impairment losses 0 0 0 0 0 0 1
Transfers – 28 0 0 0 0 28 0
Disposals 0 1 12 0 0 0 12
Transfers to non-current assets and disposal groups held for sale 2 0 0 0 0 0 3
Balance as at 31 December 2018 – 627 – 121 – 180 0 – 8 – 143 – 1,078
Carrying amounts
Balance as at 1 January 2018 299 13 75 1 2 93 482
Balance as at 31 December 2018 322 11 72 2 1 54 463

N
ote
s 2
04
C
on
soli
da
ted
fin
an
cia
l st
ate
me
nts
EUR million
Land and
buildings
Technical
equipment
and
machinery
Operating
and office
equipment
Advance
payments
and assets
under
construction
Leased assets
under finance
leases
Leased assets
under
operating
leases Total
Historical cost
Balance as at 1 January 2017 874 138 271 0 9 254 1,547
Currency translation differences – 1 0 0 0 0 0 – 1
Additions 10 0 7 0 0 3 21
Transfers – 1 0 0 0 0 1 0
Disposals – 1 – 7 – 24 0 0 0 – 33
Balance as at 31 December 2017 880 132 255 1 9 258 1,535
Amortization and impairment losses/reversals of impairment losses
Balance as at 1 January 2017 – 563 – 123 – 189 0 – 7 – 158 – 1,040
Currency translation differences 0 0 0 0 0 0 1
Scheduled amortization – 20 – 3 – 12 0 – 1 – 7 – 43
Transfers 0 0 0 0 0 – 1 0
Disposals 1 7 21 0 0 0 30
Balance as at 31 December 2017 – 582 – 119 – 180 0 – 7 – 165 – 1,053
Carrying amounts
Balance as at 1 January 2017 311 15 82 0 2 96 507
Balance as at 31 December 2017 299 13 75 1 2 93 482
As at the reporting date, »property and equipment« in the amount of EUR 366 million (previous year: EUR 423 million) had a remaining useful life of more than twelve months.
36. Income tax assets
EUR million 31/12/2018 31/12/2017
Current income tax assets 142 92
Domestic 138 86
Abroad 4 6
Deferred income tax assets 1,133 1,016
Total 1,275 1,108
Of the current income tax assets, EUR 142 million (previous year: EUR 92 million) is due within one year.
For a detailed description of income tax assets, see Note 25.

N
ote
s 2
05
C
on
soli
da
ted
fin
an
cia
l st
ate
me
nts
37. Other assets Scheduled and unscheduled impairments are reported under the item »other operating income/expenses«.
EUR million 31/12/2018 31/12/2017
Inventories 669 447
Receivables from tax authorities 54 39
Other miscellaneous assets 1,294 1,089
Total 2,017 1,575
»Other assets« included assets amounting to EUR 552 million (previous year: EUR 408 million) with a remaining useful life of more than twelve months.
»Inventories« increased primarily due to additions to various real estate projects and can be broken down as follows:
EUR million 31/12/2018 31/12/2017
Land and land rights, with unfinished buildings 244 139
Work in progress and development measures 77 71
Land and land rights, with finished buildings 1 2
Land and land rights, without buildings 214 112
Other inventories 133 124
Total 669 446
The carrying amount of »inventories« recognized at fair value less costs to sell was EUR 40 million (previous year: EUR 28 million).
The carrying amount of »inventories« pledged as collateral for liabilities amounted to EUR 216 million (previous year: EUR 90 million).
Borrowing costs of EUR 1 million (previous year: EUR 1 million) were capitalized.
LBBW recognizes precious metal portfolios, among other things, under »other inventories«.
38. Financial liabilities measured at amortized cost Financial liabilities resulting from banking activities are recognized in this balance sheet item. As well as deposits from banks and customers, this item includes securitized liabilities and subordinated capital, comprising subordinated liabilities, capital generated from profit-participation rights and typical silent partners’ contributions.
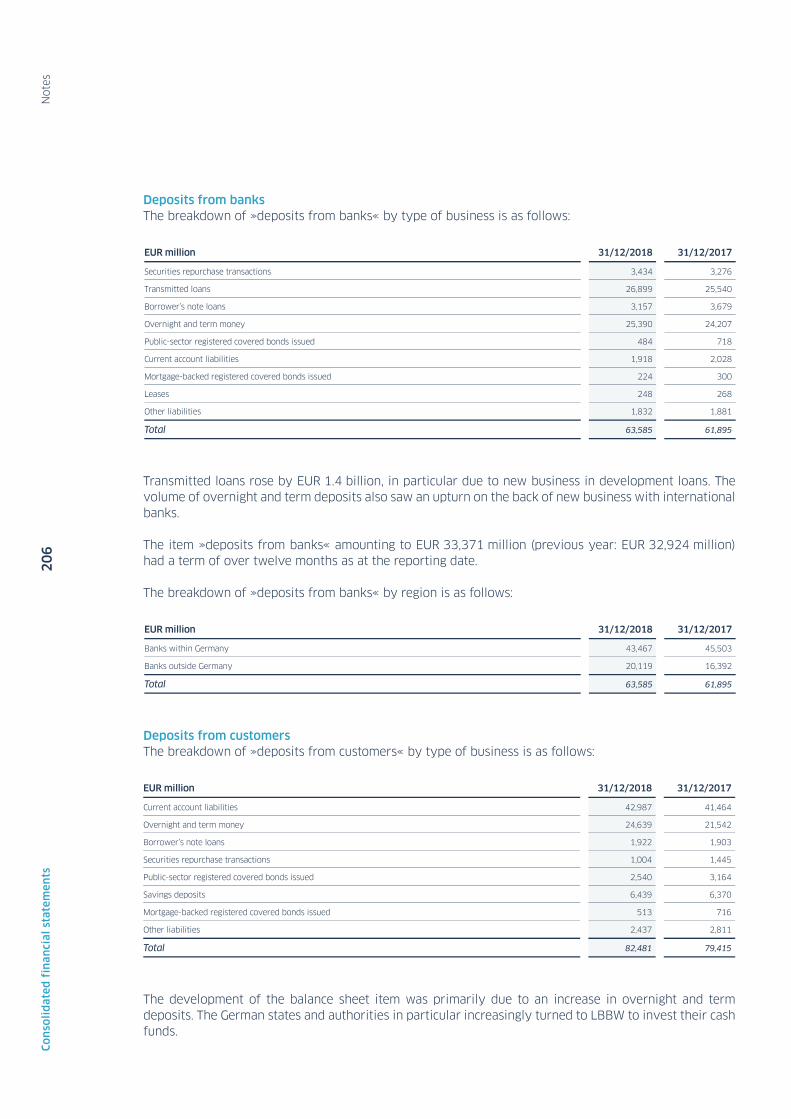
N
ote
s 2
06
C
on
soli
da
ted
fin
an
cia
l st
ate
me
nts
Deposits from banks The breakdown of »deposits from banks« by type of business is as follows:
EUR million 31/12/2018 31/12/2017
Securities repurchase transactions 3,434 3,276
Transmitted loans 26,899 25,540
Borrower’s note loans 3,157 3,679
Overnight and term money 25,390 24,207
Public-sector registered covered bonds issued 484 718
Current account liabilities 1,918 2,028
Mortgage-backed registered covered bonds issued 224 300
Leases 248 268
Other liabilities 1,832 1,881
Total 63,585 61,895
Transmitted loans rose by EUR 1.4 billion, in particular due to new business in development loans. The volume of overnight and term deposits also saw an upturn on the back of new business with international banks.
The item »deposits from banks« amounting to EUR 33,371 million (previous year: EUR 32,924 million) had a term of over twelve months as at the reporting date.
The breakdown of »deposits from banks« by region is as follows:
EUR million 31/12/2018 31/12/2017
Banks within Germany 43,467 45,503
Banks outside Germany 20,119 16,392
Total 63,585 61,895
Deposits from customers The breakdown of »deposits from customers« by type of business is as follows:
EUR million 31/12/2018 31/12/2017
Current account liabilities 42,987 41,464
Overnight and term money 24,639 21,542
Borrower’s note loans 1,922 1,903
Securities repurchase transactions 1,004 1,445
Public-sector registered covered bonds issued 2,540 3,164
Savings deposits 6,439 6,370
Mortgage-backed registered covered bonds issued 513 716
Other liabilities 2,437 2,811
Total 82,481 79,415
The development of the balance sheet item was primarily due to an increase in overnight and term deposits. The German states and authorities in particular increasingly turned to LBBW to invest their cash funds.

N
ote
s 2
07
C
on
soli
da
ted
fin
an
cia
l st
ate
me
nts
The dissolution of the guarantee relationship with the German state of Saxony in connection with the sale of the final securities in the Sealink portfolio meant that the cash deposits were repaid in full, resulting in a decrease in current account liabilities of EUR 1.8 billion.
As at the reporting date, the item included liabilities of EUR 8,773 million (previous year: EUR 9,409 million) with a remaining term to maturity of over twelve months.
The breakdown of »deposits from customers« by region is as follows:
EUR million 31/12/2018 31/12/2017
Customers within Germany 74,029 68,257
Customers outside Germany 8,451 11,158
Total 82,481 79,415
Securitized liabilities »Securitized liabilities« primarily comprise issued debentures and other liabilities securitized in the form of transferable instruments.
EUR million 31/12/2018 31/12/2017
Mortgage-backed covered bonds 9,372 9,591
Public-sector covered bonds 3,900 4,561
Other debentures 13,974 17,432
Issued debentures 27,246 31,584
Other securitized liabilities 11,581 12,848
Total 38,827 44,432
The decline in the item was due to some bonds maturing and, primarily, the transition to IFRS 9, which requires the designation of transactions with accounting mismatches to the fair value option.
The item »securitized liabilities« amounting to EUR 21,682 million (previous year: EUR 24,083 million) had a term of over twelve months as at the reporting date.
Subordinated capital In the event of insolvency proceedings or liquidation, the reported »subordinated capital« may not be repaid until all non-subordinated creditors have been satisfied.
»Subordinated capital« is broken down as follows:
EUR million 31/12/2018 31/12/2017
Typical silent partners’ contributions 1,081 1,104
Subordinated liabilities 4,308 4,158
Capital generated from profit participation rights 106 102
Total 5,495 5,364
During the calendar year subordinated liabilities of EUR 256 million (nominal amount) were newly raised. This figure compared with repayments of EUR 41 million (nominal amount). In addition, silent partners' contributions with a nominal amount of EUR 20 million were repaid.
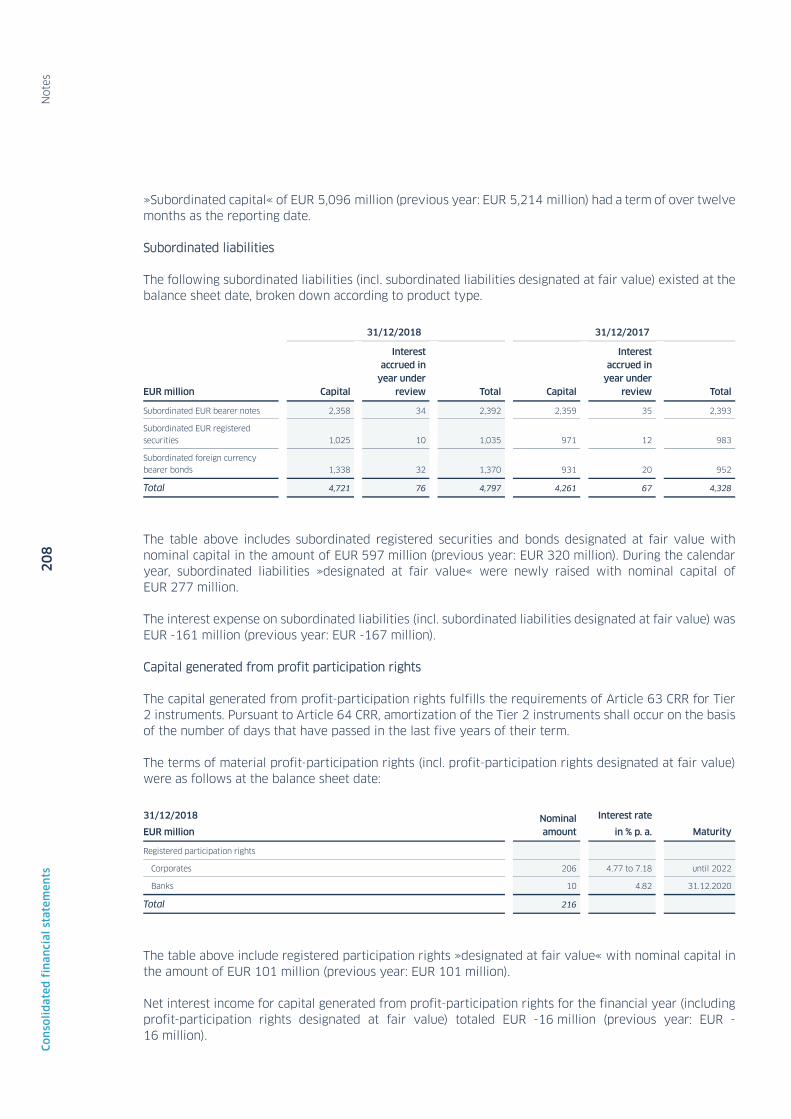
N
ote
s 2
08
C
on
soli
da
ted
fin
an
cia
l st
ate
me
nts
»Subordinated capital« of EUR 5,096 million (previous year: EUR 5,214 million) had a term of over twelve months as the reporting date.
Subordinated liabilities
The following subordinated liabilities (incl. subordinated liabilities designated at fair value) existed at the balance sheet date, broken down according to product type.
31/12/2018 31/12/2017
EUR million Capital
Interest accrued in
year under review Total Capital
Interest accrued in
year under review Total
Subordinated EUR bearer notes 2,358 34 2,392 2,359 35 2,393
Subordinated EUR registered
securities 1,025 10 1,035 971 12 983
Subordinated foreign currency bearer bonds 1,338 32 1,370 931 20 952
Total 4,721 76 4,797 4,261 67 4,328
The table above includes subordinated registered securities and bonds designated at fair value with nominal capital in the amount of EUR 597 million (previous year: EUR 320 million). During the calendar year, subordinated liabilities »designated at fair value« were newly raised with nominal capital of EUR 277 million.
The interest expense on subordinated liabilities (incl. subordinated liabilities designated at fair value) was EUR -161 million (previous year: EUR -167 million).
Capital generated from profit participation rights
The capital generated from profit-participation rights fulfills the requirements of Article 63 CRR for Tier 2 instruments. Pursuant to Article 64 CRR, amortization of the Tier 2 instruments shall occur on the basis of the number of days that have passed in the last five years of their term.
The terms of material profit-participation rights (incl. profit-participation rights designated at fair value) were as follows at the balance sheet date:
31/12/2018
EUR million Nominal amount
Interest rate
in % p. a. Maturity
Registered participation rights
Corporates 206 4.77 to 7.18 until 2022
Banks 10 4.82 31.12.2020
Total 216
The table above include registered participation rights »designated at fair value« with nominal capital in the amount of EUR 101 million (previous year: EUR 101 million).
Net interest income for capital generated from profit-participation rights for the financial year (including profit-participation rights designated at fair value) totaled EUR -16 million (previous year: EUR -16 million).

N
ote
s 2
09
C
on
soli
da
ted
fin
an
cia
l st
ate
me
nts
Typical silent partners’ contributions
The silent partners' contributions do not meet the requirements of Article 52 CRR for additional Tier 1 instruments. However, due to the transitional provisions of Article 484 CRR, they may continue to be included within the limits of Article 486 CRR. The silent partners' contributions of LBBW could still be fully considered in 2018.
At the end of the financial year, the following contributions had been made by silent partners:
Nominal amount
Duration1
Dividend payout as a
percentage of the nominal
amount
31/12/2018
EUR million
31/12/2017
EUR million
31 Dec. 1993 – 31 Dec. 2017 (terminated) 0.30 0.0 19.5
15 Nov. 1999 – 31 Dec. 2019 7.87 10.0 10.0
25 April 1999 – 31 Dec. 2019 5.05 30.0 30.0
29 Oct. 2001 – 31 Dec. 2019 (terminated) 3.92 3.2 3.2
29 Oct. 2001 – 31 Dec. 2019 (terminated) 3.92 86.3 86.3
5 Jan. 2000 – 31 Dec. 2020 8.25 30.0 30.0
19 May 1999 – 31 Dec. 2024 7.11 20.0 20.0
13 July 2001 – 31 Dec. 20262 1.91 15.0 15.0
1 Oct. 1999 – 31 Dec. 2029 8.03 – 8.20 49.0 49.0
10 March 2000 – 31 Dec. 2030 8.05 – 8.25 10.0 10.0
2 July 2001 – 31 Dec. 2031 8.46 20.0 20.0
Silent partners contributions with a fixed end of term 273.5 293.0
Nominal amount
Expiry of the fixed interest period
Dividend payout as a
percentage of the nominal
amount
31/12/2018
EUR million
31/12/2017
EUR million
31.12.2021 3.93 8.9 8.9
31.12.2022 3.74 4.7 4.7
31.12.2023 3.81 222.7 222.7
27.06.2027 2.24 200.0 200.0
No expiry of the fixed interest period3 4.56 300.0 300.0
Silent partners' contributions without a fixed end of term 736.3 736.3
Total 1,009.8 1,029.3
1 Repayment takes place after approval of the annual financial statements in accordance with HGB at a contractually fixed date. Provided the start of the term is stated, the information relates to the first agreement entered into in a group of agreements with similar terms.
2 Annual adjustment of interest rates. 3 Interest rate is fixed. Only specific changes in the tax legislation have an impact on the interest rate.
The interest expense for silent partners' contributions totaled EUR -43 million (previous year: EUR – 45 million).

N
ote
s 2
10
C
on
soli
da
ted
fin
an
cia
l st
ate
me
nts
39. Financial liabilities designated at fair value »Financial liabilities designated at fair value« comprise financial liabilities that are voluntarily measured at fair value through profit or loss. In the event of insolvency proceedings or liquidation, the subordinated liabilities recognized may not be repaid until all non-subordinated creditors have been satisfied.
EUR million 31/12/2018 31/12/2017
Borrower’s note loans 789 687
Securitized liabilities 5,077 930
Subordinated deposits 167 158
Junior bonds 568 304
Money market transactions 100 83
Other 912 563
Total 7,613 2,726
This reason behind the rise in this item was partly the reclassification of transactions with accounting mismatches in the amount of EUR 2.8 billion to the fair value option in accordance with IFRS 9. New issues such as the covered mortgage bond increased these securitized liabilities by a further EUR 2.0 billion in the current financial year.
The item liabilities amounting to EUR 6,237 million (previous year: EUR 2,442 million) had a term of over twelve months as at the reporting date.
40. Financial liabilities mandatorily measured at fair value through profit or loss All financial liabilities that must be recognized at fair value are reported in this balance sheet item. »Financial liabilities mandatorily measured at fair value through profit or loss« break down as follows:
EUR million 31/12/2018 31/12/2017
Negative fair values from hedging derivatives 3,062 3,315
Trading liabilities 21,416 21,882
Total 24,478 25,196
Negative fair values from hedging derivatives The negative fair values from derivatives that are used to secure hedged items against interest rate risks are reported in this item and meet the requirements of IFRS hedge accounting. Interest rate swaps and cross-currency interest rate swaps were designated as hedging instruments.
EUR million 31/12/2018 31/12/2017
Negative fair values from portfolio fair value hedges 2,225 2,434
Negative fair values from micro fair value hedges 838 881
Total 3,062 3,315
»Negative fair values from derivative hedging instruments« amounting to EUR 2,739 million (previous year: EUR 3,063 million) had a term of over twelve months as at the reporting date.
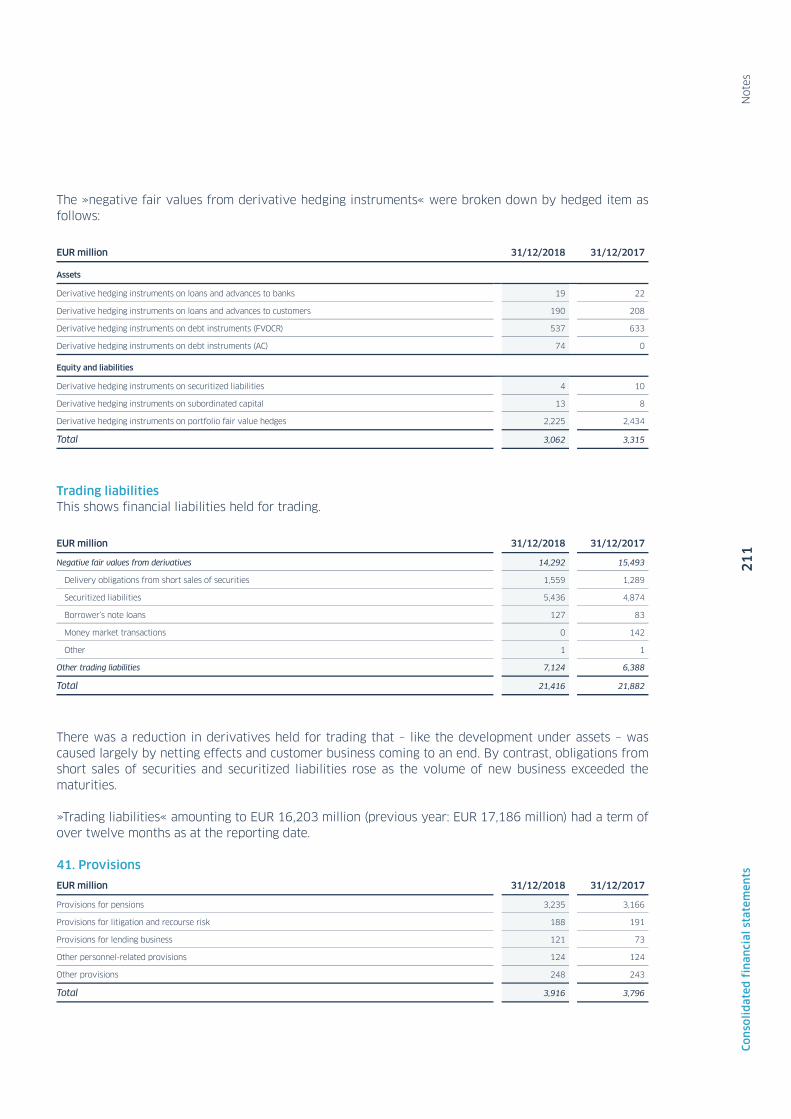
N
ote
s 2
11
C
on
soli
da
ted
fin
an
cia
l st
ate
me
nts
The »negative fair values from derivative hedging instruments« were broken down by hedged item as follows:
EUR million 31/12/2018 31/12/2017
Assets
Derivative hedging instruments on loans and advances to banks 19 22
Derivative hedging instruments on loans and advances to customers 190 208
Derivative hedging instruments on debt instruments (FVOCR) 537 633
Derivative hedging instruments on debt instruments (AC) 74 0
Equity and liabilities
Derivative hedging instruments on securitized liabilities 4 10
Derivative hedging instruments on subordinated capital 13 8
Derivative hedging instruments on portfolio fair value hedges 2,225 2,434
Total 3,062 3,315
Trading liabilities This shows financial liabilities held for trading.
EUR million 31/12/2018 31/12/2017
Negative fair values from derivatives 14,292 15,493
Delivery obligations from short sales of securities 1,559 1,289
Securitized liabilities 5,436 4,874
Borrower’s note loans 127 83
Money market transactions 0 142
Other 1 1
Other trading liabilities 7,124 6,388
Total 21,416 21,882
There was a reduction in derivatives held for trading that – like the development under assets – was caused largely by netting effects and customer business coming to an end. By contrast, obligations from short sales of securities and securitized liabilities rose as the volume of new business exceeded the maturities.
»Trading liabilities« amounting to EUR 16,203 million (previous year: EUR 17,186 million) had a term of over twelve months as at the reporting date.
41. Provisions
EUR million 31/12/2018 31/12/2017
Provisions for pensions 3,235 3,166
Provisions for litigation and recourse risk 188 191
Provisions for lending business 121 73
Other personnel-related provisions 124 124
Other provisions 248 243
Total 3,916 3,796

N
ote
s 2
12
C
on
soli
da
ted
fin
an
cia
l st
ate
me
nts
As at the reporting date, »provisions« of EUR 3,564 million (previous year: EUR 3,591 million) had a remaining term to maturity of over twelve months.
Provisions for pensions The present value of the defined benefit obligations is broken down into the following components:
EUR million 2018 2017
Balance as at 1 January 3,376 3,382
Changes recognized in the income statement 125 128
Interest expense/income 58 58
Current service cost including the release of pension liabilities 67 70
Changes recognized in Other income 46 – 20
Actuarial gains(+)/losses(-) from changes to the demographic assumptions 38 0
Actuarial gains(+)/losses(-) from changes to the financial assumptions – 2 – 4
Experience-based actuarial gains(+)/losses(-) 10 – 15
Changes in exchange rates – 1 – 1
Other changes – 112 – 114
Pension benefits paid – 112 – 114
Balance as at 31 December 3,435 3,376
The present value of the defined pension obligations was classified as follows by the type of beneficiary:
EUR million 01/01
– 31/12/2018 01/01
– 31/12/2017
Present value of the pension obligations for active employers 1,263 1,244
Present value of the pension obligations for candidates 483 489
Present value of the pension obligations for retirees 1,690 1,643
Total 3,435 3,376
This present value was broken down as follows by type of benefit:
EUR million 01/01
– 31/12/2018 01/01
– 31/12/2017
Present value of the accrued but non-vested pension obligations 276 444
Present value of the vested pension obligations 3,159 2,932
Total 3,435 3,376

N
ote
s 2
13
C
on
soli
da
ted
fin
an
cia
l st
ate
me
nts
The present value of the defined benefit plans arose from the following commitments or benefits:
EUR million 01/01
– 31/12/2018 01/01
– 31/12/2017
Present value of the pension obligations based on conditional benefits 3 4
Present value of the pension obligations based on future salary increases 275 439
Present value of the pension obligations based on other benefits 3,156 2,933
Total 3,435 3,376
Obligations under defined benefit plans were calculated using the following actuarial assumptions:
in % 31/12/2018 31/12/2017
Fluctuation 4.00 4.00
Discount rate 1.73 1.73
Expected change in income 1.85 1.85
Expected change in pensions 1.70 1.70
Career dynamics 0.50 0.50
Life expectancy, marriage probability and disability were calculated using the current 2018G Heubeck mortality tables. Commencement of retirement is determined using the retirement age in accordance with actuarial assumptions.
The following overview shows the sensitivity of the pension obligation as at the balance sheet date with regard to each isolated change to important assumptions. A change in the individual parameters of 0.5 percentage points would have had the following impact on the pension obligation at the end of the year under review, if all other assumptions remained constant:
31/12/2018 EUR million
Increase of 0.5 pp
Decrease of 0.5 pp
Defined benefit pensions
Change in discount rate – 242 273
Change in expected income development 85 – 78
Change in expected pension growth 71 – 64
Change in career dynamics 4 – 4
Change in fluctuation – 1 1
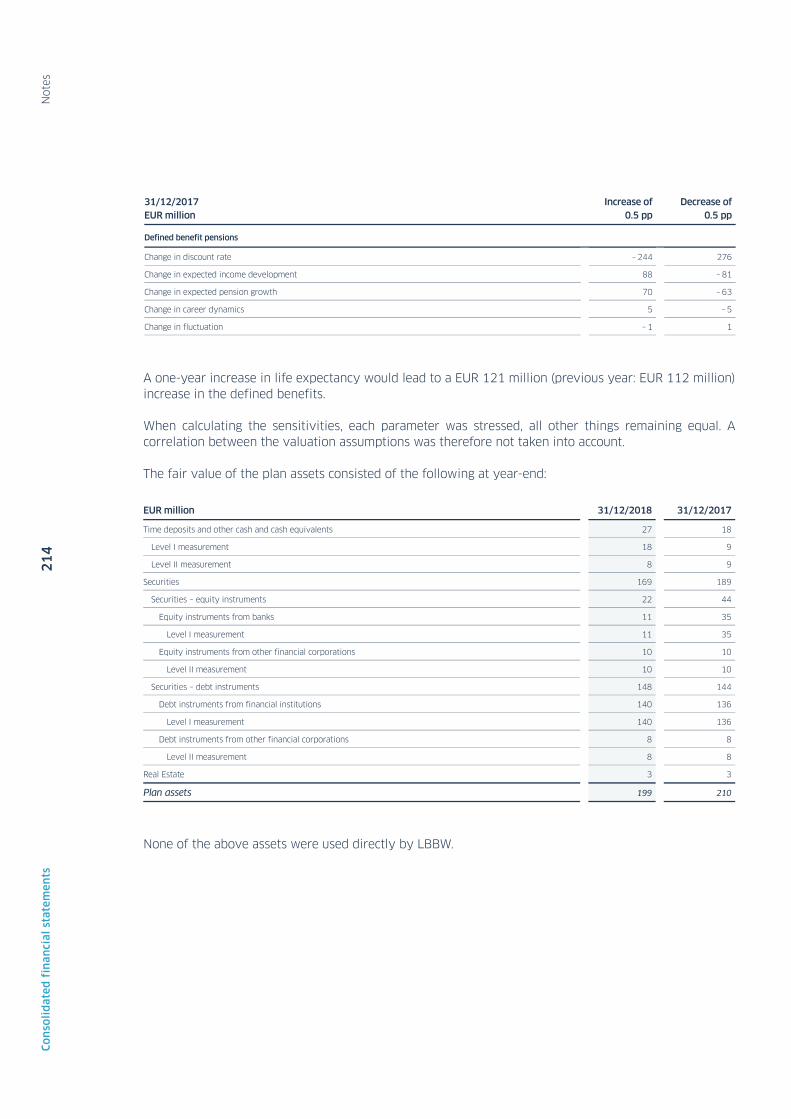
N
ote
s 2
14
C
on
soli
da
ted
fin
an
cia
l st
ate
me
nts
31/12/2017 EUR million
Increase of 0.5 pp
Decrease of 0.5 pp
Defined benefit pensions
Change in discount rate – 244 276
Change in expected income development 88 – 81
Change in expected pension growth 70 – 63
Change in career dynamics 5 – 5
Change in fluctuation – 1 1
A one-year increase in life expectancy would lead to a EUR 121 million (previous year: EUR 112 million) increase in the defined benefits.
When calculating the sensitivities, each parameter was stressed, all other things remaining equal. A correlation between the valuation assumptions was therefore not taken into account.
The fair value of the plan assets consisted of the following at year-end:
EUR million 31/12/2018 31/12/2017
Time deposits and other cash and cash equivalents 27 18
Level I measurement 18 9
Level II measurement 8 9
Securities 169 189
Securities – equity instruments 22 44
Equity instruments from banks 11 35
Level I measurement 11 35
Equity instruments from other financial corporations 10 10
Level II measurement 10 10
Securities – debt instruments 148 144
Debt instruments from financial institutions 140 136
Level I measurement 140 136
Debt instruments from other financial corporations 8 8
Level II measurement 8 8
Real Estate 3 3
Plan assets 199 210
None of the above assets were used directly by LBBW.
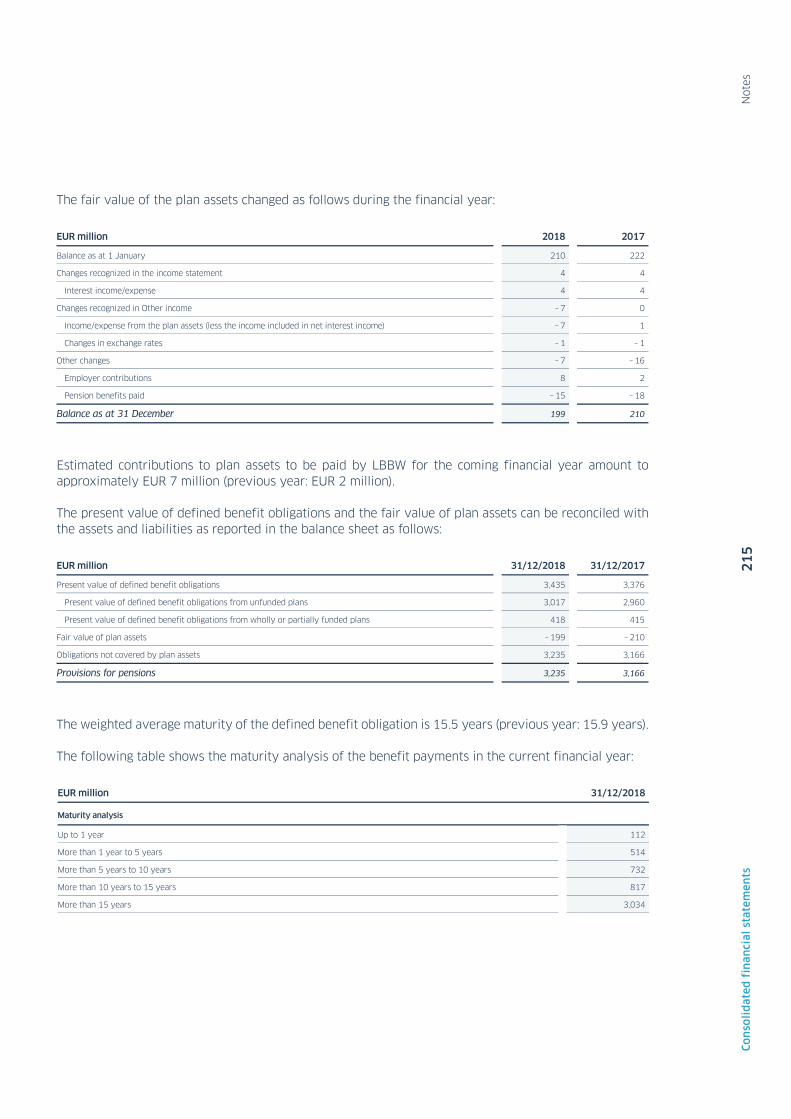
N
ote
s 2
15
C
on
soli
da
ted
fin
an
cia
l st
ate
me
nts
The fair value of the plan assets changed as follows during the financial year:
EUR million 2018 2017
Balance as at 1 January 210 222
Changes recognized in the income statement 4 4
Interest income/expense 4 4
Changes recognized in Other income – 7 0
Income/expense from the plan assets (less the income included in net interest income) – 7 1
Changes in exchange rates – 1 – 1
Other changes – 7 – 16
Employer contributions 8 2
Pension benefits paid – 15 – 18
Balance as at 31 December 199 210
Estimated contributions to plan assets to be paid by LBBW for the coming financial year amount to approximately EUR 7 million (previous year: EUR 2 million).
The present value of defined benefit obligations and the fair value of plan assets can be reconciled with the assets and liabilities as reported in the balance sheet as follows:
EUR million 31/12/2018 31/12/2017
Present value of defined benefit obligations 3,435 3,376
Present value of defined benefit obligations from unfunded plans 3,017 2,960
Present value of defined benefit obligations from wholly or partially funded plans 418 415
Fair value of plan assets – 199 – 210
Obligations not covered by plan assets 3,235 3,166
Provisions for pensions 3,235 3,166
The weighted average maturity of the defined benefit obligation is 15.5 years (previous year: 15.9 years).
The following table shows the maturity analysis of the benefit payments in the current financial year:
EUR million 31/12/2018
Maturity analysis
Up to 1 year 112
More than 1 year to 5 years 514
More than 5 years to 10 years 732
More than 10 years to 15 years 817
More than 15 years 3,034

N
ote
s 2
16
C
on
soli
da
ted
fin
an
cia
l st
ate
me
nts
Other provisions The following table shows changes in other provisions in the year under review:
EUR million
Other personnel-
related provisions
Provisions for litigation and recourse risk
Other provisions Total
Balance as at 1 January 2018 124 191 243 558
Additions 60 41 38 139
Reversals – 4 – 32 – 8 – 45
Utilization – 48 – 13 – 42 – 103
Changes in the basis of consolidation 1 0 0 1
Other changes – 10 1 18 9
Balance as at 31 December 2018 124 188 248 560
The other personnel-related provisions included mainly provisions for staff anniversaries and provisions for performance-related remuneration.
Allowances for losses on loans and securities for financial guarantees and loan commitments recognized in accordance with IFRS 9 are included in provisions for credit risks (for information on calculating allowances for losses on loans see Note 8).
The following table shows the development of provisions for credit risks:
EUR million
Stage 1
12-month expected
credit loss
Stage 2
Life-time expected
credit loss
Stage 3
Credit-impairment
since recognition Total
Balance as at 1 January 2018 21 20 50 92
Changes – 7 19 12 24
Transfer to stage 1 3 – 3 0 0
Transfer to stage 2 – 3 3 0 0
Additions 5 27 43 75
Reversals – 11 – 8 – 32 – 51
Additions 9 0 0 9
Disposals – 1 – 1 – 3 – 5
Balance as at 31 December 2018 23 39 59 121
The Group was faced with various legal proceedings and court actions arising in the ordinary course of business. Provisions were recognized for the risks involved in the management and the Group's legal advisors deem payments to be made by LBBW likely and the amounts involved can be estimated with sufficient reliability. There are other legal disputes where the Board of Managing Directors, after consultation with its legal advisors, holds the view that a payment by the Bank is unlikely (recognition as a contingent liability if necessary) or that the final settlement of these disputes does not affect the present consolidated financial statements in any material way.
In total, Other Provisions with a term of over twelve months in the amount of EUR 332 million were discounted.

N
ote
s 2
17
C
on
soli
da
ted
fin
an
cia
l st
ate
me
nts
42. Income tax liabilities
EUR million 31/12/2018 31/12/2017
Current income tax liabilities 32 47
of which provisions for income tax 29 44
of which income tax liabilities to tax authorities 3 3
Deferred income tax liabilities 27 28
Total 58 75
Of the current income tax liabilities, EUR 32 million (previous year: EUR 47 million) is due within one year.
For a detailed description of income tax liabilities, see Note 25.
43. Other liabilities
EUR million 31/12/2018 31/12/2017
Liabilities from
Other taxes 48 52
Employment 36 36
Trade payables 78 105
Non-controlling interests 2 2
Finance leases 2 3
advances received 96 32
other miscellaneous liabilities 1,021 968
Total 1,283 1,199
Other liabilities with maturities of more than twelve months amounted to EUR 7 million (previous year: EUR 34 million) as at the reporting date.
For a detailed description of leasing business, see Note 60.
44. Equity
EUR million 31/12/2018 31/12/2017
Share capital 3,484 3,484
Capital reserve 8,240 8,240
Retained earnings 970 820
Other comprehensive income 45 371
Unappropriated profit/loss 420 416
Shareholders’ equity 13,159 13,331
Equity attributable to non-controlling interests 20 46
Total 13,179 13,377
The slight decline in equity is essentially due to the first-time effects of the adoption of IFRS 9 of EUR – 0.2 billion and the distribution of dividends to LBBW shareholders of EUR -0.2 billion.
N
ote
s 2
18
C
on
soli
da
ted
fin
an
cia
l st
ate
me
nts
Cumulative actuarial gains and losses after tax of EUR -858 million (previous year: EUR -822 million) were recognized in retained earnings. This was characterized by two effects: Firstly, the change to the Heubeck mortality tables led to a EUR 37 million increase in pension and assistance provisions. Secondly, adjustments to the calculation of the IFRS calculatory interest rate caused the calculatory interest rate to decrease by two basis points as at 31 December 2018, resulting in an effect of EUR 10 million, which is also recognized through other comprehensive income in the actuarial result (see Note 2).
As at the end of the current reporting period, a measurement effect after deferred taxes of EUR 16 million (previous year: EUR 11 million) in connection with the measurement of LBBW’s own credit rating was included in other comprehensive income.
Equity includes taxes recognized in other comprehensive income of EUR 447 million (previous year: EUR 354 million).
The detailed development of the individual components of the »equity« item and information on the effects of first-time adoption of IFRS 9 are shown in statement of changes in equity.

N
ote
s 2
19
C
on
soli
da
ted
fin
an
cia
l st
ate
me
nts
Notes on financial instruments
45. Allowances for losses on loans and advances and gross carrying amounts The allowances for losses on loans and advances recognized break down as follows:
EUR million 31/12/2018 31/12/2017
Loans and advances to banks 6 5
Loans and advances to customers 849 679
Debentures and other fixed-income securities 10 1
Financial assets measured at amortized cost 865 685
Debentures and other fixed-income securities 2 n/a
Financial assets measured at fair value through other comprehensive income 2 n/a
Total 867 685
Financial assets measured at amortized cost The allowances for losses on loans and securities deducted from assets developed as follows:
EUR million
Stage 1
12-month expected
credit loss
Stage 2
Life-time expected
credit loss
Stage 3
Credit-impairment
since recognition
Credit-
impairment at recognition Total
Balance as at 1 January 2018 60 224 551 30 866
Changes – 24 66 – 56 – 11 – 24
Transfer to stage 1 13 – 13 – 1 0 0
Transfer to stage 2 – 13 15 – 2 0 0
Transfer to stage 3 – 3 – 4 7 0 0
Additions 13 140 186 0 338
Reversals – 34 – 72 – 112 – 6 – 224
Utilization 0 0 – 134 – 5 – 139
Additions 25 0 0 0 25
Disposals – 3 – 3 – 19 0 – 25
Other changes 0 0 22 1 24
Balance as at 31 December 2018 59 287 499 21 865
Specific/collective valuation allowance Portfolio valuation allowance
EUR million
Loans and advances to
banks
Loans and advances to
customers
of which from
finance leases
Loans and advances to
banks
Loans and advances to
customers
of which from finance
leases
Balance as at 1 January 2017 1 718 65 10 99 10
Utilization 0 – 183 – 17 0 0 0
Additions 0 181 22 2 46 9
Reversals 0 – 101 – 14 – 8 – 54 – 9
Change in present value brought about by the
change in remaining lifetime (unwinding) 0 – 10 0 0 0 0
Changes resulting from exchange rate fluctuations
and other changes 0 – 15 0 0 – 1 – 1
Balance as at 31 December 2017 1 589 56 4 90 9

N
ote
s 2
20
C
on
soli
da
ted
fin
an
cia
l st
ate
me
nts
Gross carrying amounts developed as follows:
EUR million
Stage 1
12-month expected
credit loss
Stage 2
Life-time expected
credit loss
Stage 3
Credit-impairment
since recognition
Credit-
impairment at recognition Total
Balance as at 1 January 2018 141,814 9,553 1,156 79 152,602
Changes – 17,218 6,381 116 – 8 – 10,729
Transfer to stage 1 1,010 – 1,003 – 8 0 0
Transfer to stage 2 – 8,275 8,300 – 25 0 0
Transfer to stage 3 – 257 – 109 366 0 0
Repayments – 9,696 – 807 – 218 – 8 – 10,729
Additions 94,666 0 0 0 94,666
Disposals – 80,988 – 945 – 171 – 6 – 82,110
Write-downs through profit or loss (direct write-down) 0 0 – 20 0 – 20
Write-downs through other comprehensive income
(use of allowances for losses on loans and advances) 0 0 – 117 – 5 – 122
Changes in the basis of consolidation 1 0 0 0 1
Other changes 4,162 – 452 – 7 0 3,704
Balance as at 31 December 2018 142,436 14,537 957 61 157,991
In accordance with IFRS 9, adjustments to the terms of a transaction that do not have a material impact on its fair value do not mean it must be derecognized from the balance sheet.
Stage 2 and 3 financial assets for which adjustments were made to the contract during the reporting period and that were not derecognized are as follows:
31/12/2018
EUR million
Stage 2
Life-time expected
credit loss
Stage 3
Credit-impairment
since recognition
Credit-
impairment at recognition Total
Amortized cost before contract amendment in the current financial year 82 121 7 210
In the reporting period no financial assets of stage 2 or 3 were allocated to stage 1 after adjustments were made to the contract.
Financial assets measured at fair value through other comprehensive income Allowances for losses on loans and securities developed as follows:
EUR million
Stage 1
12-month expected
credit loss Total
Balance as at 1 January 2018 3 3
Changes – 1 – 1
Additions 1 1
Reversals – 2 – 2
Additions 1 1
Balance as at 31 December 2018 2 2

N
ote
s 2
21
C
on
soli
da
ted
fin
an
cia
l st
ate
me
nts
Gross carrying amounts developed as follows:
EUR million
Stage 1
12-month expected
credit loss
Stage 2
Life-time expected
credit loss
Stage 3
Credit-impairment
since recognition Total
Balance as at 1 January 2018 22,590 115 0 22,705
Changes – 628 – 11 0 – 639
Transfer to stage 1 21 – 21 0 0
Transfer to stage 2 – 10 10 0 0
Transfer to stage 3 – 2 0 2 0
Repayments – 637 0 – 2 – 639
Additions 7,959 0 0 7,959
Disposals – 7,485 – 98 0 – 7,583
Other changes – 134 4 0 – 130
Balance as at 31 December 2018 22,302 10 0 22,312
46. Counterparty risk The quantitative information on credit risk is based on the management approach. By contrast to the basis of consolidation for accounting purposes under IFRS, only the SüdLeasing Group is included in consolidation under the management approach. In line with internal risk management, the primary parameter in the information below is gross/net exposure. As a result of the first-time adoption of IFRS 9, the disclosures on credit-impaired assets, default risk and concentrations are limited to the date 31 December 2018. Detailed information on IFRS 9 can be found in Note 2.
Collateral The LBBW has high standards for collateral. Guidelines and collateral strategy requirements ensure that collateral is of a high quality. In addition to the individual measurement of collateral, its carrying amount is also subject to LGD modeling haircuts (recovery rates).
The combined effect of netting and collateral agreements, credit derivatives (protection buy) and credit collateral (risk mitigation) in relation to the maximum counterparty risk of EUR 317 billion as at 31 December 2018 is EUR 128 billion or 40.5% in total (previous year: 40.9%).

N
ote
s 2
22
C
on
soli
da
ted
fin
an
cia
l st
ate
me
nts
The following table shows the maximum counterparty risk and the effect of risk-mitigating measures.
31/12/2018 EUR million
Gross exposure
Netting/ collateral
Credit derivatives (protection
buy) Credit
collateral Net exposure
Financial assets measured at fair value
Financial assets mandatorily measured at fair value
through profit or loss 62,368 39,970 7,210 481 14,707
Trading assets 57,167 34,987 7,210 458 14,512
Derivatives 45,280 31,705 6,151 391 7,033
Equity instruments 1,087 1,042 0 0 45
Debentures and other fixed-income securities 5,513 886 0 0 4,626
Receivables 5,287 1,353 1,059 67 2,807
Financial instruments measured at fair value
through profit or loss, not classified as held for trading, and equity instruments 1,354 211 0 59 1,084
Equity instruments 610 211 0 0 399
Debentures and other fixed-income securities 12 0 0 0 12
Receivables 731 0 0 59 672
Positive fair values from hedging derivatives 5,201 4,983 0 23 195
Financial assets designated at fair value 1,011 0 0 18 993
Debentures and other fixed-income securities 44 0 0 0 44
Receivables 967 0 0 18 950
Financial assets measured at fair value through other
comprehensive income 23,246 0 0 0 23,246
Equity instruments 1,848 0 0 0 1,848
Debentures and other fixed-income securities 18,994 0 0 0 18,994
Receivables 2,404 0 0 0 2,404
Financial assets measured at amortized cost
Cash and cash equivalents 1,165 0 0 0 1,165
Loans and advances to banks 56,947 19,989 0 661 36,297
Loans and advances to customers 112,526 19,437 0 37,377 55,711
Debentures and other fixed-income securities 1,041 0 0 0 1,041
Total 259,658 79,608 7,210 38,596 134,244
Loan commitments and other agreements 57,584 0 0 2,951 54,633
Total exposure 317,242 79,608 7,210 41,547 188,878

N
ote
s 2
23
C
on
soli
da
ted
fin
an
cia
l st
ate
me
nts
31/12/2017 EUR million
Gross exposure
Netting/ collateral
Credit derivatives (protection
buy) Credit
collateral Net exposure
Financial assets measured at fair value
Financial assets mandatorily measured at fair value
through profit or loss 62,211 40,399 7,828 322 13,664
Trading assets 58,015 36,392 7,828 314 13,482
Financial instruments measured at fair value
through profit or loss, not classified as held for trading, and equity instruments n/a n/a n/a n/a n/a
Positive fair values from hedging derivatives 4,196 4,007 0 8 182
Financial assets designated at fair value 629 213 0 0 416
Financial assets measured at fair value through other
comprehensive income 21,954 0 0 0 21,954
Debentures and other fixed-income securities 21,954 0 0 0 21,954
Financial assets measured at amortized cost
Cash and cash equivalents 6,118 0 0 0 6,118
Loans and advances to banks 55,419 21,119 0 683 33,616
Loans and advances to customers 106,926 15,638 0 36,965 54,324
Debentures and other fixed-income securities 1,657 0 0 0 1,657
Total 254,915 77,368 7,828 37,969 131,749
Loan commitments and other agreements 52,395 0 0 2,518 49,877
Total exposure 307,309 77,368 7,828 40,487 181,625
Securities play a major role as they significantly reduce the counterparty risk. In exceptional cases (< 1% of the portfolio), the securities cover the gross exposure in full, meaning that no impairment losses are recognized.
Of the total portfolio of EUR 317 billion as at 31 December 2018, transactions with a gross exposure of EUR 244 billion are subject to the impairment provisions of IFRS 9. The overwhelming portion of these assets (99.7%) is not credit-impaired.
Credit-impaired assets Credit-Impaired assets in accordance with IFRS 9 are financial instruments in default (rating 16 to 18). These rating classes accounted for gross exposure of EUR 0.8 billion as at 31 December 2018.
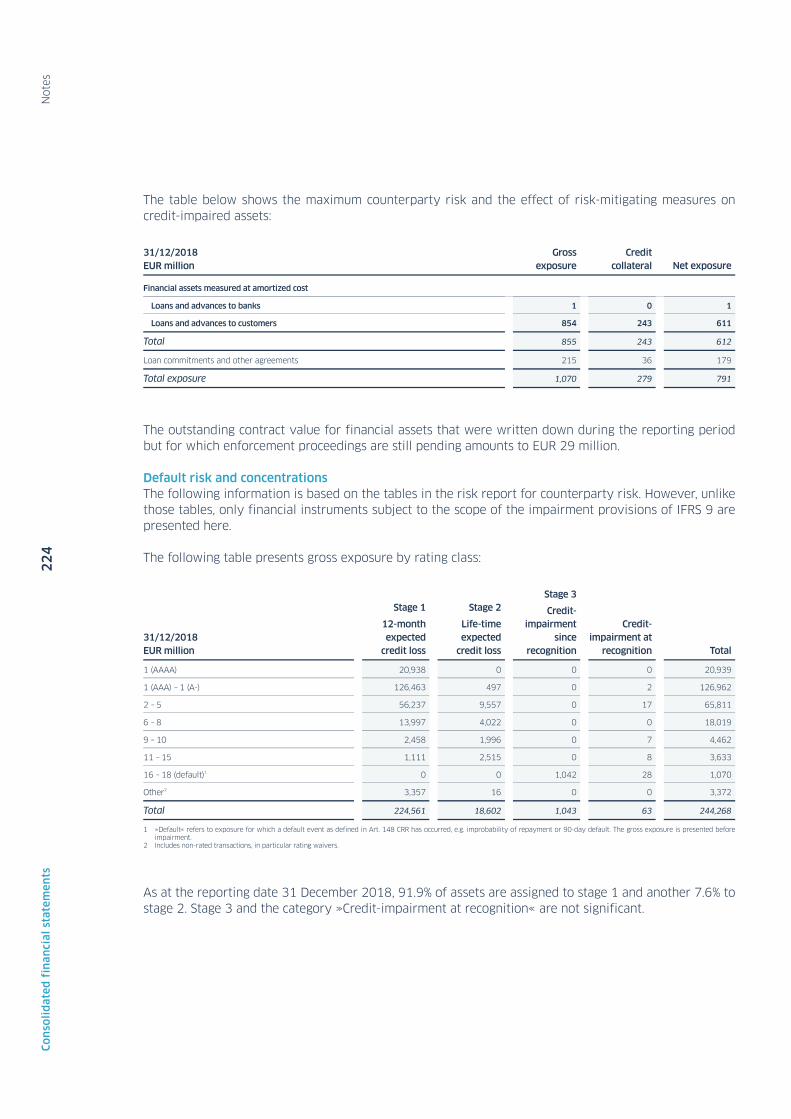
N
ote
s 2
24
C
on
soli
da
ted
fin
an
cia
l st
ate
me
nts
The table below shows the maximum counterparty risk and the effect of risk-mitigating measures on credit-impaired assets:
31/12/2018 EUR million
Gross exposure
Credit collateral Net exposure
Financial assets measured at amortized cost
Loans and advances to banks 1 0 1
Loans and advances to customers 854 243 611
Total 855 243 612
Loan commitments and other agreements 215 36 179
Total exposure 1,070 279 791
The outstanding contract value for financial assets that were written down during the reporting period but for which enforcement proceedings are still pending amounts to EUR 29 million.
Default risk and concentrations The following information is based on the tables in the risk report for counterparty risk. However, unlike those tables, only financial instruments subject to the scope of the impairment provisions of IFRS 9 are presented here.
The following table presents gross exposure by rating class:
31/12/2018 EUR million
Stage 1
12-month expected
credit loss
Stage 2
Life-time expected
credit loss
Stage 3
Credit-impairment
since recognition
Credit-impairment at
recognition Total
1 (AAAA) 20,938 0 0 0 20,939
1 (AAA) – 1 (A-) 126,463 497 0 2 126,962
2 – 5 56,237 9,557 0 17 65,811
6 – 8 13,997 4,022 0 0 18,019
9 – 10 2,458 1,996 0 7 4,462
11 – 15 1,111 2,515 0 8 3,633
16 – 18 (default)1 0 0 1,042 28 1,070
Other2 3,357 16 0 0 3,372
Total 224,561 18,602 1,043 63 244,268
1 »Default« refers to exposure for which a default event as defined in Art. 148 CRR has occurred, e.g. improbability of repayment or 90-day default. The gross exposure is presented before impairment.
2 Includes non-rated transactions, in particular rating waivers.
As at the reporting date 31 December 2018, 91.9% of assets are assigned to stage 1 and another 7.6% to stage 2. Stage 3 and the category »Credit-impairment at recognition« are not significant.

N
ote
s 2
25
C
on
soli
da
ted
fin
an
cia
l st
ate
me
nts
The following table presents gross exposure by sector:
31/12/2018 EUR million
Stage 1
12-month expected
credit loss
Stage 2
Life-time expected
credit loss
Stage 3
Credit-impairment
since recognition
Credit-impairment at
recognition Total
Financials 98,909 1,186 33 2 100,131
of which transactions under specific state liability1 5,860 0 0 2 5,862
Corporates 75,185 10,393 857 35 86,470
Automotive 9,680 3,138 153 0 12,970
Construction 6,473 911 114 3 7,500
Chemicals and commodities 6,120 438 50 0 6,609
of which chemicals 3,141 256 7 0 3,405
of which commodities 2,979 182 43 0 3,204
Retail and consumer goods 14,073 1,764 205 5 16,046
of which consumer goods 10,360 822 84 0 11,268
of which durables 3,712 942 120 4 4,779
Industry 9,022 1,191 118 3 10,334
Pharmaceuticals and healthcare 4,289 445 11 3 4,747
TM and electronics/IT 6,047 514 9 0 6,570
Transport and logistics 6,158 348 66 0 6,572
Utilities and energy 7,104 1,059 84 3 8,251
of which utilities and disposal companies 4,371 294 39 3 4,707
of which renewable energies 2,734 765 46 0 3,544
Other 6,219 585 47 18 6,869
Real Estate 24,378 4,984 75 11 29,447
Commercial real estate (CRE) 17,376 4,606 50 9 22,041
Housing 7,002 377 25 2 7,406
Public sector 16,215 134 0 0 16,349
Private individuals 9,874 1,905 78 14 11,871
Total 224,561 18,602 1,043 63 244,268
1 Item includes transactions with a statutory guarantee (Gewährträgerhaftung) and transactions with central banks and banks with a public-sector background.
The exposures in financials and the public sector (and the German public sector in particular) generally have very good, stable credit quality with a low exposure share in stage 2. There is a slightly higher share of stage 2 exposure in the corporates and real estate portfolio. In the automotive sector, this is rooted in long-term uncertainty regarding change in the industry and the impact on manufacturers and suppliers. In the commercial real estate sector (CRE), the sub-portfolio in the United Kingdom is currently experiencing uncertainty on account of Brexit and subsequent developments.

N
ote
s 2
26
C
on
soli
da
ted
fin
an
cia
l st
ate
me
nts
The following table presents gross exposure by region:
31/12/2018 EUR million
Stage 1
12-month expected
credit loss
Stage 2
Life-time expected
credit loss
Stage 3
Credit-impairment
since recognition
Credit-impairment at
recognition Total
Germany 139,861 11,485 871 33 152,250
Western Europe (excluding Germany) 58,185 4,189 55 23 62,453
North America 16,288 1,266 14 0 17,567
Asia/Pacific 5,715 248 6 0 5,970
Eastern Europe 1,838 1,073 58 0 2,970
Latin America 1,473 277 38 6 1,795
Africa 367 64 0 0 431
Other1 833 0 0 0 833
Total 224,561 18,602 1,043 63 244,268
1 Item includes transactions not allocated to a particular country (e.g. transactions with supranational institutions).
In particular, Eastern Europe has a higher stage 2 exposure share as at 31 December 2018 than the average for the overall portfolio. However, this region accounts for only a small share of the portfolio.
The following table presents gross exposure by size class:
31/12/2018 EUR million
Stage 1
12-month expected
credit loss
Stage 2
Life-time expected
credit loss
Stage 3
Credit-impairment
since recognition
Credit-
impairment at recognition Total
Up to EUR 10 million 26,124 4,733 570 26 31,452
Up to EUR 50 million 27,338 3,936 397 37 31,707
Up to EUR 100 million 20,654 3,049 72 0 23,775
Up to EUR 500 million 74,235 6,632 4 0 80,872
Up to EUR 1 billion 25,183 46 0 0 25,229
Over EUR 1 billion 49,972 125 0 0 50,097
LBBW Group 1,056 79 0 0 1,136
Total 224,561 18,602 1,043 63 244,268
Large-volume exposures in excess of EUR 500 million are almost exclusively allocated to stage 1. Nearly half of the stage 2 financial instruments amount to less than EUR 50 million as at 31 December 2018.

N
ote
s 2
27
C
on
soli
da
ted
fin
an
cia
l st
ate
me
nts
Forbearance As at 31 December 2018, LBBW held assets with a net carrying amount of EUR 556 million (previous year: EUR 783 million) for which forbearance measures were adopted. Concessions to terms and conditions were essentially granted. A EUR 176 million (previous year: EUR 250 million) sub-portfolio of the assets for which forbearance measures have been adopted comprises credit-impaired assets.
LBBW has received guarantees of EUR 43 million (previous year: EUR 132 million) for assets with forbearance measures.
The risk report contains further information on impairment on the portfolio and qualitative disclosures.
47. Determining fair value The disclosures in the following notes essentially satisfy the requirements of IFRS 13 and IFRS 7. Further IFRS 7 disclosures can be found in the risk report.
Fair value is defined in accordance with IFRS 13 as the price at which an asset could be bought and sold at the measurement date in an orderly transaction between market participants.
When determining the fair value, a company specifies the preferred (i.e. the principal) market for the asset or liability or, in the absence thereof, the most advantageous market. LBBW defines the principal market as the market with the highest trading volume and highest level of market activity for the cash-generating unit. This is not necessarily the market on which LBBW’s trading activity is the highest. LBBW sees the most advantageous market as that market on which – taking transaction and transport costs into account – the maximum proceeds can be achieved or the lowest amount must be paid when transferring a liability.
When calculating fair values, LBBW uses prices (if available) from the principal market, provided these represent prices used within the scope of regular and current transactions. These are reviewed on the basis of the following criteria: timely availability, amount, executability and bid-offer spreads.
If no prices quoted in active markets are available, measurement methods, prices for similar assets or liabilities on active markets, prices for identical or similar assets or liabilities on non-active markets are used. Input parameters used for measurement methods are based on inputs observable on the markets if available. The application of these models and the use of these parameters requires assumptions and assessments on the part of the management, the extent of which depends on price transparency with regard to the financial instrument and its market and the complexity of the instrument. A significant amount of subjective assessment is necessary, particularly if there are no inputs observable on the markets.
The aim of the applying measurement methods is to determine the price at which a transaction for a financial asset or liability could take place between knowledgeable third parties at the end of the reporting period. Measurement methods therefore have to include all factors which market participants would take into account when determining prices.
The fair values of holdings measured at fair value are subject to the LBBW Group’s internal controls and processes that set out the standards for the independent review or validation of fair values. These controls and procedures are monitored by the IPV and Market Data organizational unit within the Risk Controlling division. The models, the data used in them and the resulting fair values are regularly reviewed by the Market Risk Controlling Methodology organizational unit.

N
ote
s 2
28
C
on
soli
da
ted
fin
an
cia
l st
ate
me
nts
The following table contains an overview of the measurement models used for financial instruments:
Financial instruments Measurement models Material inputs
Interest rate swaps and options
Net present value method, Black-Scholes,
replication and Copula-based models, Markov functional model and Libor market models
Yield curves, swaption volatility, cap volatility, correlations, mean reversion
Forward rate agreements Net present value method Yield curves
Forward commodity agreements, currency
forwards Net present value method Commodity rates/exchange rates, yield curves
Stock/index options, equity index/dividend futures Black-Scholes, local volatility model, present value method
Equity prices, share volatility, dividends, interest rates (swap, repo)
Currency options Garman-Kohlhagen (modified Black-Scholes) FX rates, yield curves, FX volatility
Commodity options Garman-Kohlhagen (modified Black-Scholes) Commodity rates, yield curves, volatility
Credit derivatives Intensity model, credit correlation model Credit spreads, yield curves, correlations
Money market transactions Net present value method Credit spreads, yield curves
Securities repurchase transactions Net present value method Yield curves
Borrower’s note loans, loans Net present value method Credit spreads, yield curves
Securities, forward security transactions Net present value method Securities prices, credit spreads, yield curves
Own bearer notes and borrower’s note loans issued Net present value method Yield curves, own credit spread
Investments and shares in affiliates Net asset value method, discounted cash flow method, income value method Capitalization rate, projected figures
Securitized transactions Net present value method Liquidity spreads, yield curves, prepayments,
arrears and default rates, loss severity
The valuation and the use of material parameters for non-current assets and disposal groups held for sale, as well as liabilities from disposal groups, is performed in line with the original balance sheet items.
The financial instruments stated above are allocated to the following LBBW risk classes:

N
ote
s 2
29
C
on
soli
da
ted
fin
an
cia
l st
ate
me
nts
Class Financial instruments
Financial assets measured at fair value
Financial assets mandatorily measured at fair value through profit or loss
Trading assets
Derivatives
Currency options, interest rate swaps and interest rate options, credit
derivatives, equity/index options, equity index/dividend futures, commodity options
Equity instruments Investment fund units, equities
Debentures and other fixed-income securities
Securities, forward security agreements, money market transactions, borrower’s note loans
Receivables Borrower’s note loans, money market transactions, loans
Financial instruments measured at fair value through profit or loss, not classified as held for trading, and equity instruments
Equity instruments Investment units, equity investments, shares in affiliates, equities
Debentures and other fixed-income securities Bonds
Receivables Borrower’s note loans, money market transactions, loans
Positive fair values from hedging derivatives Interest rate swaps and cross-currency interest rate swaps
Financial assets designated at fair value
Debentures and other fixed-income securities Money market transactions, bonds and debentures
Receivables Borrower’s note loans, money market transactions, loans
Financial assets measured at fair value through other comprehensive income
Equity instruments Investment units, equity investments, shares in affiliates, equities
Debentures and other fixed-income securities Money market transactions, bonds and debentures
Receivables Borrower’s note loans, money market transactions, loans
Non-current assets held for sale and disposal groups According to the respective balance sheet item
Financial assets measured at amortized cost
Cash and cash equivalents Cash, balances with central banks, public-sector bills and bills of exchange
Loans and advances to banks
Loans, borrower’s note loans, securities repurchase transactions, money market transactions
Loans and advances to customers
Loans, borrower’s note loans, securities repurchase transactions, money market
transactions
Debentures and other fixed-income securities Money market transactions, bonds and debentures
Non-current assets held for sale and disposal groups According to the respective balance sheet item
Financial liabilities measured at fair value
Financial liabilities mandatorily measured at fair value through profit
or loss
Trading liabilities
Derivatives
Currency options, interest rate swaps and interest rate options, credit
derivatives, equity/index options, equity index/dividend futures, commodity options
Delivery obligations from short sales of securities Delivery obligations from short sales of securities
Deposits Borrower’s note loans, money market transactions
Securitized liabilities Issued debentures
Negative fair values from hedging derivatives Interest rate swaps and cross-currency interest rate swaps
Financial liabilities designated at fair value
Securitized liabilities Issued debentures
Other financial liabilities Subordinated deposits, borrower’s note loans, money market transactions
Liabilities from disposal groups According to the respective balance sheet item
Financial liabilities measured at amortized cost
Deposits from banks
Borrower’s note loans, loans, forwards, money market transactions, securities repurchase transactions
Deposits from customers
Borrower’s note loans, loans, forwards, money market transactions, securities
repurchase transactions
Securitized liabilities Issued debentures, money market transactions
Subordinated capital Bonds, participation certificates
Liabilities from disposal groups According to the respective balance sheet item

N
ote
s 2
30
C
on
soli
da
ted
fin
an
cia
l st
ate
me
nts
To the extent possible, the securities in the trading portfolio are measured using market prices or liquid prices of the relevant OTC market. If no active market price is available, fixed-income securities are measured using the discounted cash flow method based on yield curves dependent on the rating or sector and credit spreads derived from market data.
Exchange-traded derivatives are measured using market prices. The fair values of equity-based derivatives are calculated uniformly using models on the basis of the portfolio approach.
The fair value of OTC derivatives is calculated using measurement models. A distinction is made between simple derivatives traded on liquid markets (such as interest rate swaps, cross-currency interest rate swaps and currency options) and complex derivatives that are traded on illiquid markets.
Simple derivatives traded on active markets are valued using recognized valuation measures that resort at most to non-observable parameters on a minor scale.
Derivatives whose fair value is calculated on the basis of complex methods using non-observable parameters with a material influence on the valuation are classified in Level III of the measurement hierarchy. In order to reduce price uncertainty from the unobservable parameters as far as possible, these are calibrated so that measurements from observed transactions or offers for comparable instruments, consensus prices of price service agencies or valuations of other market participants from matching processes match LBBW's own measurements to the extent possible.
For certain complex interest derivatives, the interest-interest correlations required for measurement by reference to option price models are based on expert estimates which are partially gained from historical observations and partially from correlations derived from market prices. The »Correlation« parameter is assumed to be non-observable in this case and a Day One Reserve is formed for these complex interest rate derivatives.
LBBW uses the portfolio exception in accordance with IFRS 13.48 to measure derivatives in the following cases:
∙ The adjustment amount is calculated on the basis of the net risk positions for some fair value adjustments (e.g. close-out costs).
∙ When measuring counterparty risks in relation to OTC derivatives, for which netting agreements were entered into with the counterparty, the credit value adjustments (hereinafter referred to as CVA) were calculated on net positions.
The fair value of securitizations for which the market prices of market services providers are available is measured on the basis of these prices and classified as level II (see fair value hierarchy). The fair values of securitization transactions for which current market prices are not sufficiently available (level III) are calculated using measurement models. These are standard market models based on the discounted cash flow method.
N
ote
s 2
31
C
on
soli
da
ted
fin
an
cia
l st
ate
me
nts
If the fair value of a financial instrument calculated using measurement methods does not sufficiently take into account factors such as bid-offer spreads or close-out costs, liquidity, model, credit or counterparty risk, the Bank calculates valuation adjustments. The methods used do not always take into account inputs observed on the market. Valuation adjustments are currently made within LBBW for the following issues in particular:
∙ Recognition of counterparty default risks from OTC derivatives (CVA). ∙ Adjustment to mid-price based valuations on the use of bid/ask prices, for example, as close-out
valuation adjustments for OTC interest rate and credit derivatives ∙ Weaknesses in the models or inputs used, for example, model valuation adjustments for specific
equities, interest rate and credit derivatives. ∙ Day one profit or loss on specific complex derivatives and loans measured at fair value
If available, quoted prices on active markets are used to calculate the fair value of listed equity investments assigned to the category »Financial assets mandatorily measured at fair value through profit or loss« or »Financial assets measured at fair value through other comprehensive income«. For non-listed equity investments or if prices traded on an active market are not available, the fair value is measured using a measurement method. In these cases, LBBW essentially measures fair value using the net income value, the discounted cash flow or the net asset value method. The valuation method is selected on the basis of a fixed decision tree. The fair value of real estate leasing special purpose vehicles is measured on the basis of the DCF method. The net income value approach is used to measure all other major equity investments. If the application of the net income value approach entails considerable uncertainty or is not reliable due to a lack of data, the net asset value method is used, provided the equity investment’s business activities are stable.
The fair value of assets and liabilities measured at amortized cost is calculated by discounting the future cash flows, taking into account rating-dependent spreads (exception: repurchase transactions). If rating-dependent spreads are derived from rating information obtained from external sources, this constitutes level II classification. Rating information obtained from internal sources constitutes level III classification. The fair values of receivables with a default rating are determined on the basis of expected future cash flows. The carrying amount is stated as the fair value of current assets and liabilities (e.g. current account assets and liabilities).

N
ote
s 2
32
C
on
soli
da
ted
fin
an
cia
l st
ate
me
nts
48. Fair value of financial instruments The following table compares the carrying amounts and fair values of financial instruments:
Assets
31/12/2018
EUR million Carrying amount Fair value
Financial assets measured at fair value
Financial assets mandatorily measured at fair value 29,803 29,803
Trading assets 26,459 26,459
Derivatives 15,498 15,498
Equity instruments 1,087 1,087
Debentures and other fixed-income securities 5,531 5,531
Receivables 4,344 4,344
Financial instruments measured at fair value through profit or loss, not classified as held for trading, and equity
instruments 1,375 1,375
Equity instruments 467 467
Debentures and other fixed-income securities 18 18
Receivables 890 890
Positive fair values from hedging derivatives 1,969 1,969
Financial assets designated at fair value 1,207 1,207
Debentures and other fixed-income securities 44 44
Receivables 1,163 1,163
Financial assets measured at fair value through other comprehensive income 22,821 22,821
Equity instruments 509 509
Debentures and other fixed-income securities 19,487 19,487
Receivables 2,825 2,825
Non-current assets held for sale and disposal groups 23 23
Financial assets measured at amortized cost
Cash and cash equivalents 24,721 24,721
Loans and advances to banks 46,749 46,817
Loans and advances to customers 109,231 117,842
Debentures and other fixed-income securities 1,146 1,134
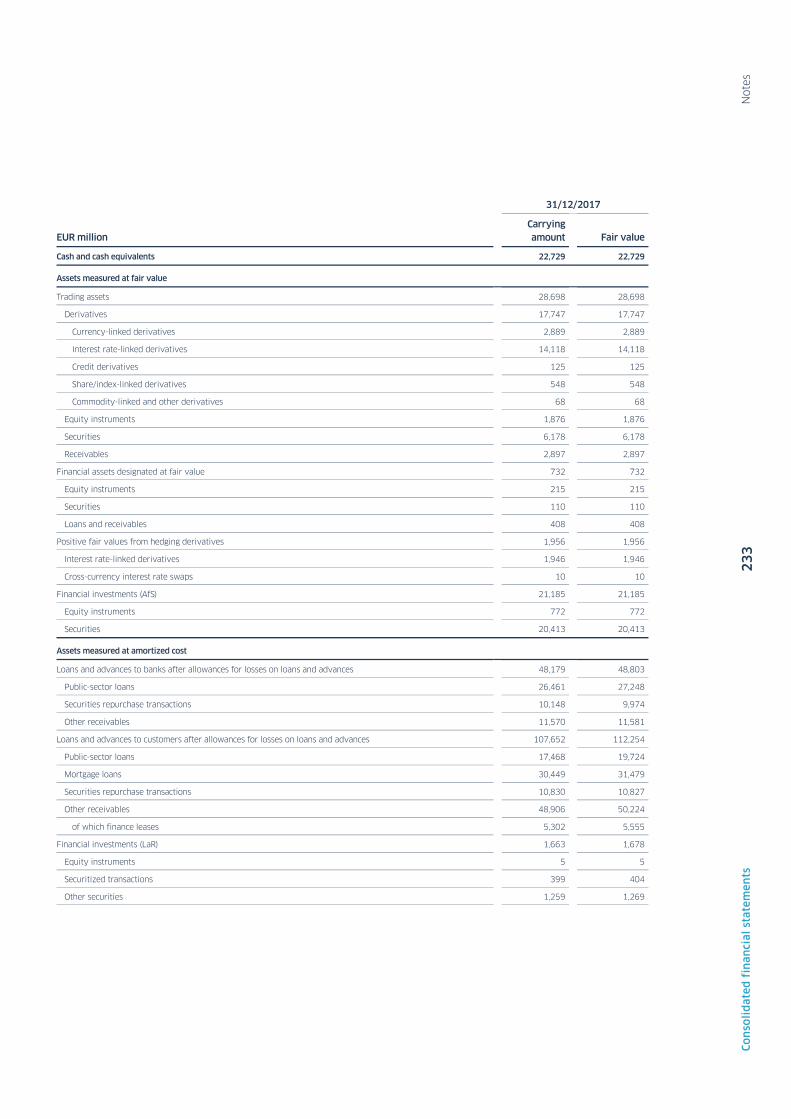
N
ote
s 2
33
C
on
soli
da
ted
fin
an
cia
l st
ate
me
nts
31/12/2017
EUR million Carrying amount Fair value
Cash and cash equivalents 22,729 22,729
Assets measured at fair value
Trading assets 28,698 28,698
Derivatives 17,747 17,747
Currency-linked derivatives 2,889 2,889
Interest rate-linked derivatives 14,118 14,118
Credit derivatives 125 125
Share/index-linked derivatives 548 548
Commodity-linked and other derivatives 68 68
Equity instruments 1,876 1,876
Securities 6,178 6,178
Receivables 2,897 2,897
Financial assets designated at fair value 732 732
Equity instruments 215 215
Securities 110 110
Loans and receivables 408 408
Positive fair values from hedging derivatives 1,956 1,956
Interest rate-linked derivatives 1,946 1,946
Cross-currency interest rate swaps 10 10
Financial investments (AfS) 21,185 21,185
Equity instruments 772 772
Securities 20,413 20,413
Assets measured at amortized cost
Loans and advances to banks after allowances for losses on loans and advances 48,179 48,803
Public-sector loans 26,461 27,248
Securities repurchase transactions 10,148 9,974
Other receivables 11,570 11,581
Loans and advances to customers after allowances for losses on loans and advances 107,652 112,254
Public-sector loans 17,468 19,724
Mortgage loans 30,449 31,479
Securities repurchase transactions 10,830 10,827
Other receivables 48,906 50,224
of which finance leases 5,302 5,555
Financial investments (LaR) 1,663 1,678
Equity instruments 5 5
Securitized transactions 399 404
Other securities 1,259 1,269

N
ote
s 2
34
C
on
soli
da
ted
fin
an
cia
l st
ate
me
nts
Equity and liabilities
31/12/2018
EUR million Carrying amount Fair value
Financial liabilities measured at fair value
Financial liabilities mandatorily measured at fair value 24,478 24,478
Trading liabilities 21,416 21,416
Derivatives 14,292 14,292
Delivery obligations from short sales of securities 1,559 1,559
Deposits 128 128
Securitized liabilities 5,436 5,436
Negative fair values from hedging derivatives 3,062 3,062
Financial liabilities designated at fair value 7,613 7,613
Securitized liabilities 5,645 5,645
Other financial liabilities 1,969 1,969
Financial liabilities measured at amortized cost
Deposits from banks 63,585 63,963
Deposits from customers 82,481 83,651
Securitized liabilities 38,827 39,330
Subordinated capital 5,495 5,432

N
ote
s 2
35
C
on
soli
da
ted
fin
an
cia
l st
ate
me
nts
31/12/2017
EUR million Carrying amount Fair value
Liabilities measured at fair value
Trading liabilities 21,882 21,882
Derivatives 15,493 15,493
Currency-linked derivatives 2,981 2,981
Interest rate-linked derivatives 11,349 11,349
Credit derivatives 306 306
Share/index-linked derivatives 779 779
Commodity-linked and other derivatives 78 78
Delivery obligations from short sales of securities 1,289 1,289
Deposits 225 225
Securitized liabilities 4,874 4,874
Other financial liabilities 1 1
Financial liabilities designated at fair value 2,726 2,726
Deposits 1,492 1,492
Securitized liabilities 1,234 1,234
Negative fair values from hedging derivatives 3,315 3,315
Interest rate-linked derivatives 3,288 3,288
Cross-currency interest rate swaps 27 27
Liabilities measured at amortized cost
Deposits from banks 61,895 62,789
Securities repurchase transactions 3,276 3,153
Borrower’s note loans 3,679 3,798
Other liabilities 54,941 55,838
Deposits from customers 79,415 80,549
Current account liabilities 41,464 41,456
Borrower’s note loans 1,903 2,038
Registered covered bonds 3,880 4,608
Securities repurchase transactions 1,445 1,430
Other liabilities 30,723 31,018
Securitized liabilities 44,432 45,031
Other liabilities – of which finance leases 3 3
Subordinated capital 5,364 5,636
Subordinated liabilities 4,158 4,480
Capital generated from profit participation rights 102 136
Silent partners’ contributions 1,104 1,021

N
ote
s 2
36
C
on
soli
da
ted
fin
an
cia
l st
ate
me
nts
49. Fair value hierarchy In order to satisfy the disclosure requirements as set out in IFRS 13, this Note includes both disclosures on financial instruments and disclosures on investment property.
The fair values used when measuring financial instruments and investment property are assigned to a three-level fair value hierarchy, taking into account the measurement methods and parameters used to carry-out this measurement. If parameters from different levels are used to determine the fair value, the resulting fair value is assigned to the next level whose parameters has a material effect on fair value measurement.
The three-level fair value hierarchy with level I, level II, and level III – the terminology provided for in IFRS 13 – is specified as follows at LBBW:
∙ All financial instruments with unadjusted prices quoted on active markets are assigned to the first group (level I).
∙ Derivatives measured using models, tradable credits, structured Group debt instruments designated at fair value, units in investment funds and certain corporate/financial and government bonds with automatic provision from market information systems (observable parameters) and liquid asset-backed securities are assigned to the second group (level II).
∙ Level III comprises financial instruments for which one or more parameters are not based on observable market data and these data have a more than immaterial effect on the fair value of an instrument. These include complex OTC derivatives, certain private equity investments, certain high-grade structured bonds including illiquid asset-backed securities and structured securitizations.

N
ote
s 2
37
C
on
soli
da
ted
fin
an
cia
l st
ate
me
nts
The following table shows the breakdown of the balance sheet classifications by measurement method:
Assets
31/12/2018
EUR million
Prices traded on active markets (level I)
Measurement method – on the basis of
externally observable parameters
(level II)
Measurement method – on
the basis externally
unobservable parameters
(level III)
Financial assets measured at fair value
Financial assets mandatorily measured at fair value through profit or loss 2,067 26,036 1,700
Trading assets 2,050 23,240 1,169
Derivatives 39 15,302 157
Equity instruments 401 686 0
Debentures and other fixed-income securities 1,610 3,921 0
Receivables 0 3,331 1,012
Financial instruments measured at fair value through profit or loss, not classified as held for trading, and equity instruments 17 827 531
Equity instruments 12 269 186
Debentures and other fixed-income securities 5 7 5
Receivables 0 551 339
Positive fair values from hedging derivatives 0 1,969 0
Financial assets designated at fair value 0 1,054 153
Debentures and other fixed-income securities 0 44 0
Receivables 0 1,010 153
Financial assets measured at fair value through other comprehensive income 15,535 6,861 425
Equity instruments 84 0 425
Debentures and other fixed-income securities 15,451 4,036 0
Receivables 0 2,825 0
Non-current assets held for sale and disposal groups 0 0 23
Investment property 0 0 697
Financial assets measured at amortized cost
Cash and cash equivalents 181 24,540 0
Loans and advances to banks 0 29,246 17,571
Loans and advances to customers 0 23,520 94,323
Debentures and other fixed-income securities 21 710 403

N
ote
s 2
38
C
on
soli
da
ted
fin
an
cia
l st
ate
me
nts
31/12/2017
EUR million
Prices traded on active markets (level I)
Measurement method – on the basis of
externally observable parameters
(level II)
Measurement method – on
the basis externally
unobservable parameters
(level III)
Cash and cash equivalents 164 22,565 0
Assets measured at fair value
Trading assets 2,978 25,385 334
Derivatives 63 17,463 222
Currency-linked derivatives 0 2,816 72
Interest rate-linked derivatives 0 13,974 144
Credit derivatives 0 125 0
Share/index-linked derivatives 0 542 6
Commodity-linked and other derivatives 63 5 0
Equity instruments 707 1,169 0
Securities 2,208 3,970 0
Receivables 1 2,784 112
Financial assets designated at fair value 20 702 10
Equity instruments 0 213 2
Securities 20 82 7
Receivables 0 408 0
Positive fair values from derivative hedging instruments 0 1,956 0
Interest rate-linked derivatives 0 1,946 0
Cross-currency interest rate swaps 0 10 0
Financial investments (AfS) 16,770 4,213 203
Equity instruments 577 0 195
Securities 16,192 4,213 8
Investment property 0 0 554
Assets measured at amortized cost
Loans and advances to banks after allowances for losses on loans and advances 0 33,541 15,262
Public-sector loans 0 14,058 13,190
Securities repurchase transactions 0 9,974 0
Other receivables 0 9,510 2,072
Loans and advances to customers after allowances for losses on loans and advances 0 27,656 84,598
Public-sector loans 0 7,952 11,771
Mortgage loans 0 276 31,203
Securities repurchase transactions 0 10,827 0
Other receivables 0 8,600 41,624
of which finance leases 0 3 5,553
Financial investments (LaR) 0 1,269 409
Equity instruments 0 0 5
Securitized transactions 0 0 404
Other securities 0 1,269 0
Non-current assets held for sale and disposal groups 0 0 104

N
ote
s 2
39
C
on
soli
da
ted
fin
an
cia
l st
ate
me
nts
Equity and liabilities
31/12/2018
EUR million
Prices traded on active markets (level I)
Measurement method – on the basis of
externally observable parameters
(level II)
Measurement method – on
the basis externally
unobservable parameters
(level III)
Financial liabilities measured at fair value
Financial liabilities mandatorily measured at fair value through profit or loss 1,612 22,666 200
Trading liabilities 1,612 19,604 200
Derivatives 53 14,039 200
Delivery obligations from short sales of securities 1,558 2 0
Deposits 1 128 0
Securitized liabilities 0 5,436 0
Negative fair values from derivative hedging instruments 0 3,062 0
Financial liabilities designated at fair value 0 7,112 501
Securitized liabilities 0 5,260 385
Other financial liabilities 0 1,852 116
Financial liabilities measured at amortized cost
Deposits from banks 0 62,751 1,212
Deposits from customers 0 82,961 690
Securitized liabilities 0 36,924 2,406
Subordinated capital 0 5,432 0

N
ote
s 2
40
C
on
soli
da
ted
fin
an
cia
l st
ate
me
nts
31/12/2017
EUR million
Prices traded on active markets (level I)
Measurement method – on the basis of
externally observable parameters
(level II)
Measurement method – on
the basis externally
unobservable parameters
(level III)
Liabilities measured at fair value
Trading liabilities 1,324 20,276 281
Derivatives 37 15,175 281
Currency-linked derivatives 0 2,963 17
Interest rate-linked derivatives 0 11,226 123
Credit derivatives 0 172 135
Share/index-linked derivatives 0 773 6
Commodity-linked and other derivatives 37 41 0
Delivery obligations from short sales of securities 1,287 2 0
Deposits 0 225 0
Securitized liabilities 0 4,874 0
Other financial liabilities 1 0 0
Financial liabilities designated at fair value 0 2,112 613
Deposits 0 1,376 116
Securitized liabilities 0 737 497
Negative fair values from derivative hedging instruments 0 3,315 0
Interest rate-linked derivatives 0 3,288 0
Cross-currency interest rate swaps 0 27 0
Liabilities measured at amortized cost
Deposits from banks 0 61,826 963
Securities repurchase transactions 0 3,153 0
Borrower’s note loans 0 3,798 0
Other liabilities 0 54,875 963
Deposits from customers 0 79,878 671
Current account liabilities 0 41,456 0
Borrower’s note loans 0 2,038 0
Registered covered bonds 0 4,608 0
Securities repurchase transactions 0 1,430 0
Other liabilities 0 30,347 671
Securitized liabilities 0 42,591 2,440
Other liabilities – of which finance leases 0 0 3
Subordinated capital 0 5,636 0
Subordinated liabilities 0 4,480 0
Capital generated from profit participation rights 0 136 0
Silent partners’ contributions 0 1,021 0

N
ote
s 2
41
C
on
soli
da
ted
fin
an
cia
l st
ate
me
nts
Transfers to levels If the main parameters used in fair value measurement change, the classification in the fair value hierarchy is also adjusted. At the end of the reporting period, the necessary reclassifications between Levels I-III is carried out using quality criteria for the market data used in the valuation that are defined by risk controlling. Prompt availability, volume, executability and bid-offer spreads of the market data used play a particular role.
For financial instruments measured using models, Risk Controlling identifies the model parameters necessary for the fair value measurement. The models are subject to a regular validation process and the observability of the necessary model inputs is monitored in Risk Controlling’s price review process. This allows those financial instruments to be identified that must be transferred between levels II and III of the measurement hierarchy.
The following transfers were made between Levels I and II in the fair value hierarchy since the last reporting date:
Assets
Reclassification from
level I to level II Reclassification from
level II to level I
EUR million 31/12/2018 31/12/2017 31/12/2018 31/12/2017
Financial assets measured at fair value
Financial assets mandatorily measured at fair value through profit or
loss 43 28 127 82
Trading assets 43 28 127 82
Equity instruments 0 0 127 1
Debentures and other fixed-income securities 43 28 0 80
Financial assets designated at fair value 19 0 0 0
Debentures and other fixed-income securities 19 0 0 0
Financial assets measured at fair value through other comprehensive
income 319 428 0 16
Debentures and other fixed-income securities 319 428 0 16
Equity and liabilities
Reclassification from
level I to level II
EUR million 31/12/2018 31/12/2017
Financial liabilities measured at fair value
Financial liabilities mandatorily measured at fair value through profit or loss 1 0
Trading liabilities 1 0
Delivery obligations from short sales of securities 1 0
In the year under review, LBBW carried out reclassifications from Level I to Level II, as there were no listed prices from active markets to hand for the corresponding financial instruments. Reclassifications in the opposite direction also took place as listed prices from active markets became available once again for these transactions.
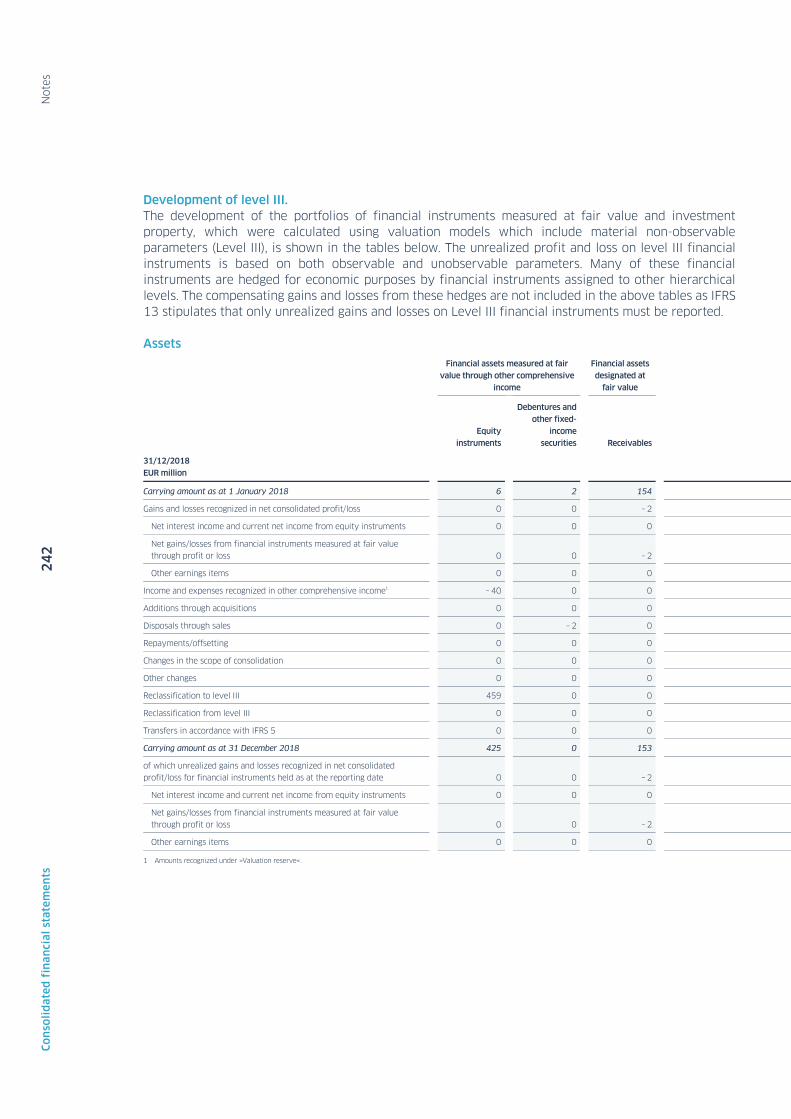
N
ote
s 2
42
C
on
soli
da
ted
fin
an
cia
l st
ate
me
nts
Development of level III. The development of the portfolios of financial instruments measured at fair value and investment property, which were calculated using valuation models which include material non-observable parameters (Level III), is shown in the tables below. The unrealized profit and loss on level III financial instruments is based on both observable and unobservable parameters. Many of these financial instruments are hedged for economic purposes by financial instruments assigned to other hierarchical levels. The compensating gains and losses from these hedges are not included in the above tables as IFRS 13 stipulates that only unrealized gains and losses on Level III financial instruments must be reported.
Assets
Financial assets measured at fair
value through other comprehensive
income
Financial assets
designated at
fair value
Equity
instruments
Debentures and
other fixed-
income
securities Receivables
31/12/2018
EUR million
Carrying amount as at 1 January 2018 6 2 154
Gains and losses recognized in net consolidated profit/loss 0 0 – 2
Net interest income and current net income from equity instruments 0 0 0
Net gains/losses from financial instruments measured at fair value through profit or loss 0 0 – 2
Other earnings items 0 0 0
Income and expenses recognized in other comprehensive income1 – 40 0 0
Additions through acquisitions 0 0 0
Disposals through sales 0 – 2 0
Repayments/offsetting 0 0 0
Changes in the scope of consolidation 0 0 0
Other changes 0 0 0
Reclassification to level III 459 0 0
Reclassification from level III 0 0 0
Transfers in accordance with IFRS 5 0 0 0
Carrying amount as at 31 December 2018 425 0 153
of which unrealized gains and losses recognized in net consolidated profit/loss for financial instruments held as at the reporting date 0 0 – 2
Net interest income and current net income from equity instruments 0 0 0
Net gains/losses from financial instruments measured at fair value
through profit or loss 0 0 – 2
Other earnings items 0 0 0
1 Amounts recognized under »Valuation reserve«.

N
ote
s 2
43
C
on
soli
da
ted
fin
an
cia
l st
ate
me
nts
Financial liabilities mandatorily measured at fair value through profit or loss
Investment
property
Non-current
assets held
for sale and
disposal
groups Total
Trading assets
Financial instruments measured at fair value
through profit or loss, not classified as held for
trading, and financial investments in equity
instruments
Derivatives
Equity
instruments Receivables
Equity
instruments
Debentures
and other
fixed-income
securities Receivables
219 2 112 189 13 460 554 104 1,816
– 30 0 0 6 0 – 6 37 1 6
1 0 0 0 0 0 0 0 1
– 31 0 0 6 0 – 6 0 0 – 33
0 0 0 0 0 0 37 1 38
0 0 0 0 0 0 0 0 – 40
0 0 1,002 44 0 28 97 0 1,170
0 0 – 93 – 34 0 0 – 26 – 46 – 200
– 34 – 1 – 9 0 0 – 143 0 0 – 187
0 0 0 – 19 0 0 0 0 – 19
0 0 0 0 0 0 – 4 1 – 3
2 0 0 0 0 0 0 0 461
0 0 0 0 – 7 0 0 0 – 8
0 0 0 0 0 0 38 – 38 0
157 0 1,012 186 5 339 697 23 2,998
– 30 0 0 6 0 – 6 31 0 – 1
1 0 0 0 0 0 0 0 1
– 31 0 0 6 0 – 6 0 0 – 33
0 0 0 0 0 0 31 0 31

N
ote
s 2
44
C
on
soli
da
ted
fin
an
cia
l st
ate
me
nts
Trading assets
Derivatives Securities Receivables
31/12/2017
EUR million
Currency-linked
derivatives
Interest rate-
linked
derivatives
Equity-/index-
linked
derivatives
Carrying amount as at 31 December 2016 116 213 4 0 538
Restatement of prior year amounts 0 0 0 0 0
Carrying amount as at 1 January 2017 116 213 4 0 538
Gains and losses recognized in net consolidated
profit/loss – 43 – 58 6 5 0
of which net interest income – 2 0 0 0 0
of which net trading income – 42 – 58 6 5 0
of which net gains/losses from financial investments 0 0 0 0 0
of which other earnings items 0 0 0 0 0
Income and expenses recognized in other comprehensive income1 0 0 0 0 0
Additions through acquisitions 0 0 0 0 112
Disposals through sales 0 0 0 – 5 – 529
Repayments/offsetting – 1 – 20 – 4 0 – 9
Changes in the scope of consolidation 0 0 0 0 0
Changes from foreign currency translation 0 0 0 0 0
Reclassification to level III 0 8 0 0 0
Transfers in accordance with
IFRS 5 0 0 0 0 0
Carrying amount as at 31 December 2017 72 144 6 0 112
of which unrealized gains and losses recognized in net
consolidated profit/loss for financial instruments held as at the reporting date – 43 – 58 6 0 0
of which net interest income – 2 0 0 0 0
of which net trading income – 42 – 58 6 0 0
of which net gains/losses from financial investments 0 0 0 0 0
of which other earnings items 0 0 0 0 0
1 Amounts recognized under »Revaluation reserve«.

N
ote
s 2
45
C
on
soli
da
ted
fin
an
cia
l st
ate
me
nts
Financial assets designated at fair
value Financial investments (AfS)
Investment
property
Non-current
assets and
disposal groups
held for sale Total
Equity
instruments Securities
Equity
instruments Securities
4 0 376 8 560 80 1,899
0 0 0 0 13 0 13
4 0 376 8 574 80 1,913
0 0 – 56 0 21 – 23 – 148
0 0 0 0 0 0 – 1
0 0 0 0 0 0 – 88
0 0 – 56 0 0 – 27 – 83
0 0 0 0 21 4 25
0 0 17 0 0 – 1 16
0 0 4 0 6 0 122
– 2 0 – 59 0 – 8 – 59 – 662
0 0 – 87 0 0 0 – 121
0 0 1 0 78 0 79
0 0 0 0 – 10 0 – 10
0 7 0 0 0 0 15
0 0 0 0 – 107 107 0
2 7 195 8 554 104 1,205
0 0 – 1 0 20 4 – 72
0 0 0 0 0 0 – 1
0 0 0 0 0 0 – 94
0 0 – 1 0 0 0 – 1
0 0 0 0 20 4 24
The transactions that were reclassified in the financial year essentially relate to an investment measured at fair value through other comprehensive income.

N
ote
s 2
46
C
on
soli
da
ted
fin
an
cia
l st
ate
me
nts
Equity and liabilities
Financial liabilities designated at fair
value
Financial
liabilities
mandatorily
measured at fair
value through
profit or loss Total
31/12/2018
Securitized
liabilities
Other financial
liabilities
Trading
liabilities
EUR million Derivatives
Carrying amount as at 1 January 2018 497 116 281 895
Gains and losses recognized in net consolidated profit/loss 11 1 – 70 – 58
Net interest income and current net income from equity instruments 3 0 – 2 1
Net gains/losses from financial instruments measured at fair value
through profit or loss 8 1 – 68 – 59
Income and expenses recognized in other comprehensive income1 1 0 0 0
Disposals through sales – 49 0 0 – 49
Repayments/offsetting – 75 0 – 14 – 89
Reclassification to level III 0 0 2 2
Carrying amount as at 31 December 2018 385 116 200 701
of which unrealized gains and losses recognized in net consolidated
profit/loss for financial instruments held as at the reporting date 11 1 – 70 – 58
Net interest income and current net income from equity instruments 3 0 – 2 1
Net gains/losses from financial instruments measured at fair value through profit or loss 8 1 – 68 – 59
1 Amounts recognized under »Valuation reserve«.

N
ote
s 2
47
C
on
soli
da
ted
fin
an
cia
l st
ate
me
nts
Trading liabilities
Financial liabilities designated at
fair value Total
Derivatives Deposits
Securitized
liabilities
31/12/2017
EUR million
Currency-
linked
derivatives
Interest rate-
linked
derivatives
Credit
derivatives
Share/index-
linked
derivatives
Carrying amount as at 1 January 2017 11 194 123 4 38 587 957
Gains and losses recognized
in net consolidated profit/loss 7 – 54 12 6 – 2 – 60 – 91
of which net interest income – 1 0 0 0 0 3 2
of which net trading income 8 – 54 12 6 0 0 – 28
of which net gains/losses
from financial instruments designated at fair value 0 0 0 0 – 2 – 63 – 65
Income and expenses
recognized in other comprehensive income1 0 0 0 0 0 – 2 – 2
Disposals through sales 0 0 0 0 0 – 8 – 8
Repayments/offsetting 0 – 20 0 – 4 0 – 20 – 44
Reclassification to level III 0 4 0 0 79 0 83
Carrying amount as at
31 December 2017 17 123 135 6 116 497 895
of which unrealized gains
and losses recognized in net
consolidated profit/loss for
financial instruments held as at the reporting date 7 – 54 12 6 – 2 – 60 – 91
of which net interest income – 1 0 0 0 0 3 2
of which net trading income 8 – 55 12 6 0 0 – 28
of which net gains/losses
from financial instruments designated at fair value 0 0 0 0 – 2 – 63 – 65
1 Amounts recognized under »Revaluation reserve«.
Sensitivity analysis level III If the model value of financial instruments is based on unobservable market parameters, alternative parameters are used to determine the potential estimation uncertainty. For most of the securities and derivatives classified as Level III only one non-observable parameter is included in the fair value calculation, preventing any interactions between Level III parameters. The overall sensitivity of the products whose fair value calculation includes more than one non-observable parameter is immaterial.A calculation of the interactions between these parameters has therefore been dispensed with.
For the investments classified as level III, sensitivities are essentially calculated by shifting the individual beta factors up or down. If no beta factors are used in measurement, the sensitivities are calculated on the basis of the average percentage change in fair value. This is based on the upward/downward shift of the investments whose measurement is based on a beta factor.

N
ote
s 2
48
C
on
soli
da
ted
fin
an
cia
l st
ate
me
nts
The information is intended to show the potential effects of the relative uncertainty in the fair values of financial instruments, the measurement of which is based on unobservable parameters:
Assets
Positive change in fair value Negative change in fair value
Net gains/losses from financial instruments measured at fair value and valuation reserve
Net gains/losses from financial instruments measured at fair value and valuation reserve
EUR million 31/12/2018 31/12/2017 31/12/2018 31/12/2017
Financial assets measured at fair value
Financial assets mandatorily measured at fair value through profit or
loss 26.9 5.4 – 24.1 – 4.0
Trading assets 15.2 5.4 – 14.0 – 4.0
Derivatives 3.5 4.6 – 2.6 – 3.2
Receivables 11.7 0.8 – 11.4 – 0.7
Financial instruments measured at fair value through profit or loss, not classified as held for trading, and equity instruments 11.7 n/a – 10.1 n/a
Equity instruments 3.8 n/a – 3.3 n/a
Receivables 7.9 n/a – 6.8 n/a
Financial assets measured at fair value through other comprehensive
income 24.0 5.0 – 21.8 – 3.7
Equity instruments 24.0 5.0 – 21.8 – 3.7
Total 50.9 10.4 – 45.9 – 7.7
Equity and liabilities
Positive change in fair value Negative change in fair value
Net gains/losses from financial instruments measured at fair value and valuation reserve
Net gains/losses from financial instruments measured at fair value and valuation reserve
EUR million 31/12/2018 31/12/2017 31/12/2018 31/12/2017
Financial liabilities measured at fair value
Financial liabilities mandatorily measured at fair value through profit or
loss 5.6 7.4 – 6.9 – 9.1
Trading liabilities 5.6 7.4 – 6.9 – 9.1
Derivatives 5.6 7.4 – 6.9 – 9.1
Financial liabilities designated at fair value 0.9 0.1 – 0.6 – 0.1
Securitized liabilities 0.9 0.1 – 0.6 – 0.1
Total 6.5 7.5 – 7.5 – 9.2

N
ote
s 2
49
C
on
soli
da
ted
fin
an
cia
l st
ate
me
nts
Significant unobservable level III parameters The significant unobservable parameters of the financial instruments measured at fair value and classified as level III and investment property are shown in the following tables.
The range shown below depicts the highs and lows in the non-observable parameters on which the valuations in the Level III category were based. As the financial instruments and investment property in question differ significantly, the range of certain parameters can be considerable.
The parameter shifts in the table depict the changes in the unobservable parameters that are tested in the sensitivity analysis.They thus provide information on the range of alternative parameters selected by LBBW for its calculation of fair value.
Assets
31/12/2018 EUR million
Measurement methods
Significant unobservable
parameters Range Parameter shift
Financial assets measured at fair value
Financial assets mandatorily measured
at fair value through profit or loss
Trading assets
Derivatives Option price models Interest rate correlation – 82% – 99% relative – 20%/+ 10%
Currency correlation 28% absolute – 30%/+ 30%
Other model parameters -0.67 – 3.22 relative – 22%/+ 22%
Receivables Net present value
method Credit spread (bp) 73 – 325 relative – 10-30%/+ 10-
30%
Financial instruments measured at fair
value through profit or loss, not
classified as held for trading, and equity instruments
Receivables Net present value method Credit spread (bp) 329 – 799 relative – 30%/+ 30%
Financial assets designated at fair value
Receivables Option price models Interest rate correlation 21% – 99% relative – 20%/+ 10%
Financial assets measured at fair value
through other comprehensive income
Equity instruments Net asset value method n/a n/a n/a
Discounted cash flow
method Capitalization rate 2.32% – 4.15% individually per
instrument
Net income value method Beta factor 1.00 – 1.19 relative + 5%/– 5%
Investment property
Discounted cash flow method
Rent dynamization/ indexing 1.5% n/a
Discounting interest rate 1.5% – 9.0%
Rental loss risk 2.0% – 4.0%
Basic maintenance costs EUR 2.5 – EUR 18/m2
Administrative costs
(% of target rent) 1.0% – 6.5%
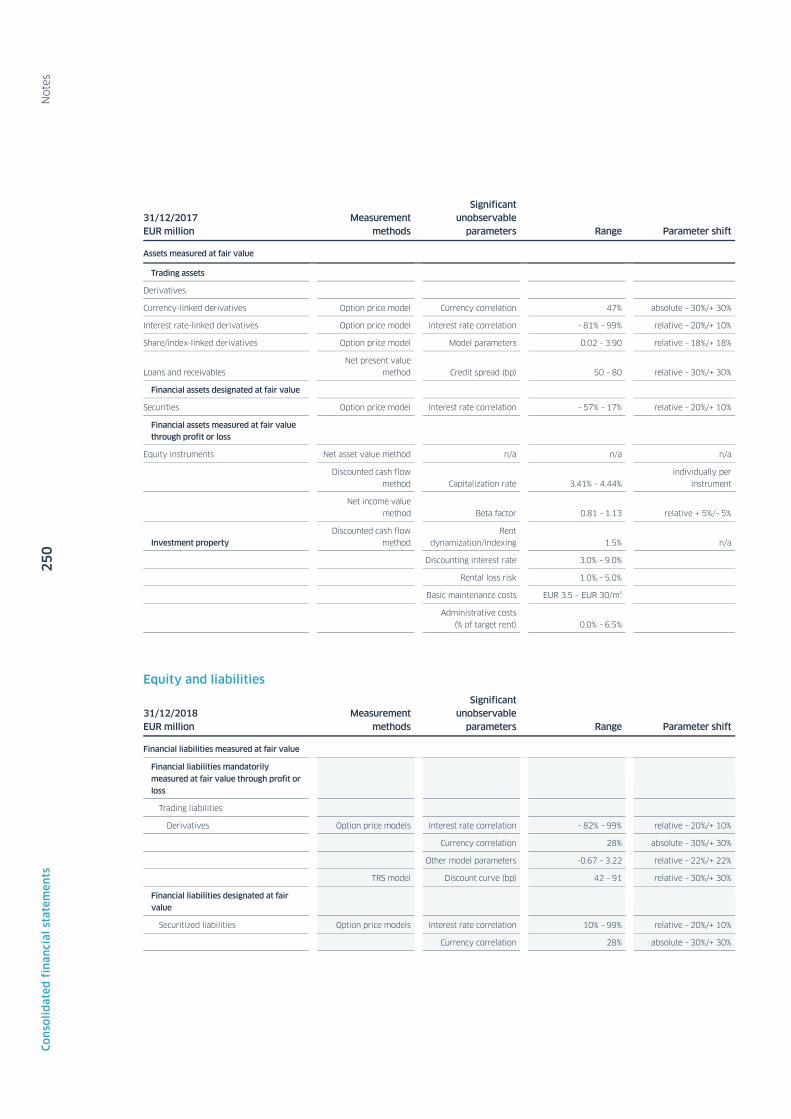
N
ote
s 2
50
C
on
soli
da
ted
fin
an
cia
l st
ate
me
nts
31/12/2017 EUR million
Measurement methods
Significant unobservable
parameters Range Parameter shift
Assets measured at fair value
Trading assets
Derivatives
Currency-linked derivatives Option price model Currency correlation 47% absolute – 30%/+ 30%
Interest rate-linked derivatives Option price model Interest rate correlation – 81% – 99% relative – 20%/+ 10%
Share/index-linked derivatives Option price model Model parameters 0.02 – 3.90 relative – 18%/+ 18%
Loans and receivables Net present value
method Credit spread (bp) 50 – 80 relative – 30%/+ 30%
Financial assets designated at fair value
Securities Option price model Interest rate correlation – 57% – 17% relative – 20%/+ 10%
Financial assets measured at fair value
through profit or loss
Equity instruments Net asset value method n/a n/a n/a
Discounted cash flow
method Capitalization rate 3.41% – 4.44% individually per
instrument
Net income value
method Beta factor 0.81 – 1.13 relative + 5%/– 5%
Investment property
Discounted cash flow method
Rent dynamization/indexing 1.5% n/a
Discounting interest rate 3.0% – 9.0%
Rental loss risk 1.0% – 5.0%
Basic maintenance costs EUR 3.5 – EUR 30/m2
Administrative costs
(% of target rent) 0.0% – 6.5%
Equity and liabilities
31/12/2018 EUR million
Measurement methods
Significant unobservable
parameters Range Parameter shift
Financial liabilities measured at fair value
Financial liabilities mandatorily
measured at fair value through profit or
loss
Trading liabilities
Derivatives Option price models Interest rate correlation – 82% – 99% relative – 20%/+ 10%
Currency correlation 28% absolute – 30%/+ 30%
Other model parameters -0.67 – 3.22 relative – 22%/+ 22%
TRS model Discount curve (bp) 42 – 91 relative – 30%/+ 30%
Financial liabilities designated at fair
value
Securitized liabilities Option price models Interest rate correlation 10% – 99% relative – 20%/+ 10%
Currency correlation 28% absolute – 30%/+ 30%

N
ote
s 2
51
C
on
soli
da
ted
fin
an
cia
l st
ate
me
nts
31/12/2017 EUR million Measurement methods
Significant unobservable
parameters Range Parameter shift
Liabilities measured at fair value
Trading liabilities
Derivatives
Currency-linked derivatives Option price model Currency correlation 47% absolute – 30%/+ 30%
Interest rate-linked derivatives Option price model Interest rate correlation – 81% – 99% relative – 20%/+ 10%
Credit derivatives TRS model Discount curve (bp) 89 – 101 relative – 30%/+ 30%
Share/index-linked derivatives Option price model Model parameters 0.02 – 3.90 relative – 18%/+ 18%
Financial liabilities designated at fair value
Deposits Option price model Interest rate correlation 21% – 99% relative – 20%/+ 10%
Securitized liabilities Option price model Interest rate correlation 21% – 99% relative – 20%/+ 10%
Currency correlation 47% absolute – 30%/+ 30%
The valuation and the use of material parameters for non-current assets held for sale and disposal groups as well as liabilities from disposal groups is performed in line with the original balance sheet items.
Day One Profit or Loss The use of unobservable parameters for the measurement of financial instruments can lead to differences between the transaction price and the fair value. This deviation is referred to as day one profit or loss, which is distributed throughout the term of the financial instrument through profit or loss.
Credit spreads and correlations between interest rates and default risks of different asset classes are not consistently observable on the market or cannot be derived from prices observed on the market. The market participants may have different opinions about the characteristics of the unobservable parameters used in these models. Hence, the transaction price may deviate from what is considered by LBBW to be the fair value.
LBBW recognizes day one profits for trading portfolios of derivatives. The portfolios were of minor importance as at the end of the reporting period.
50. Financial instruments designated at fair value The information on financial assets and liabilities designated at fair value is set out in the following tables.
Assets
31/12/2018 EUR million
Maximum default risk as at the qualifying
date
Cumulative changes in fair value resulting
from the credit spread
Changes in fair value resulting from the
credit spread in the year under review
Debentures and other fixed-income securities 44 – 1 – 1
Receivables 1,163 2 3
Total 1,207 1 1

N
ote
s 2
52
C
on
soli
da
ted
fin
an
cia
l st
ate
me
nts
31/12/2017 EUR million
Maximum default risk as at the qualifying
date
Cumulative changes in fair value resulting
from the credit spread
Changes in fair value resulting from the
credit spread in the year under review
Debentures and other fixed-income securities 110 0 1
Other 622 – 1 2
Total 732 – 1 3
Equity and liabilities
31/12/2018 EUR million
Difference between carrying amount and contractual amount
payable on maturity Cumulative changes in fair value resulting from the credit spread
Borrower’s note loans 267 11
Securitized liabilities 150 – 24
Subordinated liabilities 37 20
Other 0 15
Total 454 23
31/12/2017 EUR million
Difference between carrying amount and contractual amount
payable on maturity Cumulative changes in fair value resulting from the credit spread
Borrower’s note loans 278 7
Securitized liabilities 127 3
Subordinated liabilities 42 – 8
Other 158 12
Total 604 15
LBBW calculates two values to determine the change in credit risk. For one fair value, the currently applicable credit spread is used while for the other, the historical credit spread is applied. The difference between the two values expresses the change in fair value induced by changes to the credit rating since the financial instrument was designated at fair value. The approach chosen ensures that the changes in fair value induced by the credit rating are not distorted by other market price risk-induced effects.
To be able to take into account the instrument-specific credit risk that is decisive for the rating-induced changes in fair value, a spread curve appropriate to the risk profile is used. Primary market prices are used to form the spread curves; in the absence of primary market activity, secondary market prices and approximation methods based on liquid market prices of comparable bonds may be employed.
From an economic aspect, the financial liabilities designated at fair value are regularly immunized against the changes in fair value resulting from the market price risks through the use of derivative financial instruments. Essentially, the gain/loss from the change in own credit rating remains, which is reported in full under Other income. Transfers within equity are made only if the effects are realized gains/losses in connection with the measurement of the own credit rating.

N
ote
s 2
53
C
on
soli
da
ted
fin
an
cia
l st
ate
me
nts
51. Equity instruments voluntarily measured at fair value through other comprehensive income LBBW exercises the fair value through other comprehensive option in accordance with IFRS 9.5.7.5 for some financial investments in equity instruments. These essentially comprise equity investments on banks held with no intention to sell.
Equity instruments measured voluntarily at fair value through other comprehensive income amounted to EUR 509 million (see Note 28). Dividends of EUR 22 million for equity instruments measured voluntarily at fair value through other comprehensive income were recognized in the financial year. These relate entirely to equity instruments held at the reporting date.
In the financial year, an immaterial amount of gains and losses resulting from the disposal of equity instruments voluntarily measured at fair value through other comprehensive income were transferred within equity to retained earnings.
52. Net gains/losses from financial instruments The net gains or losses, broken down by category according to IFRS 9, comprise gains and losses on disposal, changes in fair value, impairments, reversals of impairment losses, gains/losses from foreign currency translation and subsequent income from financial instruments already written off. They also include changes in value from economic hedging derivatives and the income/loss from changes in the value of hedged items from micro fair value hedges.
EUR million 01/01
– 31/12/2018
Financial assets/liabilities mandatorily measured at fair value through profit or loss. 201
Financial assets designated at fair value – 3
Financial liabilities designated at fair value 47
Net gains/losses recognized through profit or loss 18
Net gains/losses recognized in other comprehensive income 27
Financial assets measured at amortized cost – 56
Financial liabilities measured at amortized cost – 142
Equity instruments measured at fair value through other comprehensive income – 54
Financial debt instruments measured at fair value through other comprehensive income 42
Net gains/losses recognized in other comprehensive income 5
Net gains/losses transferred from other comprehensive income to the income statement after derecognition 38
EUR million 01/01
– 31/12/2017
Financial assets measured at amortized cost – 161
Financial liabilities/assets held for trading 128
Financial liabilities/assets designated at fair value 87
Available-for-sale financial assets 33
Financial liabilities measured at amortized cost 70
53. Maturity analysis The following table divides the undiscounted financial liabilities into derivative and non-derivative transactions for the remaining contractual maturities. Given that the reporting is undiscounted and includes interest payments, the figures differentiate in part from the carrying amounts shown in the balance sheet.

N
ote
s 2
54
C
on
soli
da
ted
fin
an
cia
l st
ate
me
nts
Financial liabilities according to contractually agreed maturity structures in accordance with IFRS 7.39 as at the balance sheet date are as follows:
31/12/2018 EUR million
up to 1 month
>1 to 3 months
>3 to 12 months
>1 year to 5 years >5 years
Financial liabilities 54,700 10,788 20,125 41,760 20,672
Liabilities from derivatives 190 242 979 2,842 699
Total 54,890 11,030 21,104 44,602 21,371
Irrevocable loan commitments and guarantees1 49,201 481 1,878 979 966
Savings and demand deposits, securitization from
interbank accounts 51,352
1 Basis: All guarantees and revocable and irrevocable loan commitments included in the IFRS financial statements by the accounting department. The values given are based on the assumption that all guarantees are used and all loan commitments are drawn.
31/12/2017 EUR million
up to 1 month
>1 to 3 months
>3 to 12 months
>1 year to 5 years >5 years
Financial liabilities 39,928 14,656 23,747 43,450 20,052
Liabilities from derivatives 100 125 247 1,212 1,735
Total 40,028 14,781 23,994 44,662 21,787
Irrevocable loan commitments and guarantees1 27,005
Savings and demand deposits, securitization from
interbank accounts 49,626
2 Basis: for the LiqV relevant loan commitments and guarantees, excluding intra-Group commitments, since the funding risk associated with these commitments is already reflected in the consolidation of the inflow and outflow of funds, and not including undisbursed loans.
For explanations on the manner in which LBBW manages liquidity risk, see the section on liquidity risk in the risk report.
54. Issuing activities
EUR million 31/12/2018 31/12/2017
Securitized liabilities 38,827 44,432
Financial liabilities designated at fair value 5,077 930
Securitized liabilities mandatorily measured at fair value through profit or loss 5,436 4,874
Total 49,340 50,236
During the period under review, new issues, essentially short-dated money market paper, with a nominal volume of EUR 817,531 million (previous year: EUR 651,747 million) were issued. Initial sales may fall substantially short of the issued nominal volume. During the same period the volume of buybacks amounted to a nominal amount of EUR 6,017 million (previous year: EUR 16,952 million) and the volume of repayments to a nominal of EUR 503,890 million (previous year: EUR 393,623 million).
55. Transfer of financial assets
Transferred financial assets that are not derecognized in their entirety The transferred assets comprise mainly own assets that LBBW transferred or lent in the development loan business, and in securities lending or repurchase transactions. The receivables transferred within the scope of the development loan business may not be resold by LBBW in the interim. With securities lending or repurchase transactions, the right to use the securities expires with the transfer. The counterparties of the associated liabilities do not have exclusive access to these assets.

N
ote
s 2
55
C
on
soli
da
ted
fin
an
cia
l st
ate
me
nts
The transferred assets continue to be fully recognized in the balance sheet. This can potentially lead to counterparty, default and/or market price risk.
As at the reporting date, there are no issues that would have led to continuing involvement despite the transfer.
Transferred assets continue
to be recognized in full
31/12/2018 EUR million
Carrying amount of transferred assets
Carrying amount of the associated liabilities
Financial assets measured at fair value
Financial assets mandatorily measured at fair value through profit or loss 729 507
Trading assets 729 507
Debentures and other fixed-income securities 505 283
Receivables 224 224
Financial assets designated at fair value 110 110
Receivables 110 110
Financial assets measured at fair value through other comprehensive income 2,470 1,901
Debentures and other fixed-income securities 1,394 825
Receivables 1,076 1,076
Financial assets measured at amortized cost
Loans and advances to banks 20,712 20,702
Loans and advances to customers 8,802 8,800
Debentures and other fixed-income securities 102 43
Transferred assets continue
to be recognized in full
31/12/2017 EUR million
Carrying amount of transferred assets
Carrying amount of the associated liabilities
Financial assets measured at fair value
Financial assets mandatorily measured at fair value 746 493
Trading assets 746 493
Debentures and other fixed-income securities 363 110
Receivables 383 383
Financial assets designated at fair value 40 40
Receivables 40 40
Financial assets measured at fair value through other comprehensive income 2,263 1,376
Debentures and other fixed-income securities 2,263 1,376
Financial assets measured at amortized cost
Loans and advances to banks 19,536 19,533
Loans and advances to customers 9,649 9,648
N
ote
s 2
56
C
on
soli
da
ted
fin
an
cia
l st
ate
me
nts
56. Collateral
Assignor LBBW pledges collateral especially within the scope of the development loan business and repurchase transaction agreements. Collateral is generally provided at commercially available terms that are determined in standard agreements. With securities repurchase agreements, the protection buyer has the right to dispose of or repledge the collateral in the meantime. Overall, assets in the amount of EUR 40,400 million (previous year: EUR 40,234 million) were assigned as collateral for liabilities or contingent liabilities.
Assignee On the basis of securities repurchase transactions, LBBW receives securities pledged as collateral, which it has the right to resell or repledge, provided it returns securities of equal value at the end of the transaction. The fair value of the financial or non-financial assets received as collateral, which LBBW may sell or repledge even if the owner of such collateral is not in default, totals EUR 21,297 million (previous year: EUR 25,504 million). Of the collateral received, LBBW is required to return collateral with a total fair value of EUR 21,297 million (previous year: EUR 25,504 million) to its owners. The fair value of collateral disposed of or forwarded with an obligation to return the securities to the owner amounted to EUR 3,185 million (previous year: EUR 5,080 million).
57. Offsetting financial assets and liabilities The Group is obliged to report financial assets and liabilities that meet the accounting offsetting criteria at their net value in the balance sheet. The following tables contain details about the offsetting effects on the consolidated balance sheet as well as potential effects from master netting agreements.
The featured transactions are usually closed on the basis of master agreements, the conditional or unconditional rights to offset receivables, liabilities and collateral received or pledged. A conditional netting right is given, for example, if the legal claim exists only in the case of insolvency or breach of contract. In accordance with IAS 32.42, transactions for which there is no legal right to netting of receivables and liabilities and/or no settlement on a net basis or no simultaneous settlement is planned, are not netted.
The collateral detailed is pledged mainly on the basis of repurchase agreements and liens, whereby collateral may only be offset in legally agreed cases (e.g. in insolvency). In the case of repurchase agreements, the receiver is obliged to return the transferred financial instruments at the end of the term. However, the receiver has the right to regularly sell or pledge the collateral to third parties.
The net amount of the individual financial instruments recognized in the balance sheet is calculated according to the measures shown in the »Accounting and valuation methods« section. Collateral in the form of financial instruments and the cash collateral are stated at the fair value.

N
ote
s 2
57
C
on
soli
da
ted
fin
an
cia
l st
ate
me
nts
Assets
Amounts that are not subject to offsetting
Collateral received
31/12/2018 EUR million
Gross amount of
financial assets
Offsetting amount
Net amount of
recognized financial
assets
Effect of master netting
agreements Financial
instruments Cash
collateral Net amount
Current account claims 16 – 6 10 0 0 0 10
Receivables from
securities repurchase and lending agreements 23,703 – 2,875 20,828 – 1,568 – 15,781 0 3,479
Derivatives 30,858 – 14,945 15,912 – 8,820 – 2 – 3,054 4,036
Total 54,577 – 17,826 36,750 – 10,388 – 15,783 – 3,054 7,525
Amounts that are not subject to offsetting
Collateral received
31/12/2017 EUR million
Gross amount of
financial assets
Offsetting amount
Net amount of
recognized financial
assets
Effect of master netting
agreements Financial
instruments Cash
collateral Net amount
Current account claims 35 – 6 29 0 0 0 29
Receivables from
securities repurchase and lending agreements 25,396 – 4,143 21,253 – 1,936 – 18,927 0 389
Derivatives 28,773 – 11,245 17,529 – 10,587 – 1 – 3,385 3,556
Total 54,205 – 15,394 38,811 – 12,523 – 18,928 – 3,385 3,975
As at 31 December 2018, the net amount of recognized current account claims given above was shown in full in the balance sheet item loans and advances to customers, as in the previous year.
The respective net amounts of the securities repurchase and lending agreements were broken down in the following balance sheet items: EUR 8,881 million in loans and advances to banks (previous year: EUR 10,358 million) and EUR 11,947 million in loans and advances to customers (previous year: EUR 10,830 million). In the previous year, EUR 65 million was also included in the item Financial assets at fair value through profit or loss.
As in the previous year, the net receivables from derivative transactions were also recognized in full in the balance sheet item »Financial assets mandatorily measured at fair value through profit or loss«.
The cash collateral was shown as at the reporting date at EUR 2,314 million (previous year: EUR 2,717 million) under Deposits from banks and at EUR 741 million (previous year: EUR 668 million) under Deposits from customers.

N
ote
s 2
58
C
on
soli
da
ted
fin
an
cia
l st
ate
me
nts
Equity and liabilities
Amounts that are not subject to offsetting
Pledged collateral
31/12/2018 EUR million
Gross amount of
financial liabilities
Offsetting amount
Net amount of
recognized financial liabilities
Effect of master netting
agreements Financial
instruments Cash
collateral Net amount
Current account liabilities 179 – 6 173 0 0 0 173
Liabilities from securities
repurchase and lending agreements 7,313 – 2,875 4,438 – 1,568 – 2,869 0 1
Derivatives 28,806 – 14,945 13,860 – 8,820 – 1 – 4,194 845
Total 36,297 – 17,826 18,471 – 10,388 – 2,870 – 4,194 1,019
Amounts that are not subject to offsetting
Pledged collateral
31/12/2017 EUR million
Gross amount of
financial liabilities
Offsetting amount
Net amount of
recognized financial liabilities
Effect of master netting
agreements Financial
instruments Cash
collateral Net amount
Current account liabilities 175 – 6 169 0 0 0 169
Liabilities from securities
repurchase and lending agreements 8,864 – 4,143 4,720 – 1,936 – 2,784 0 0
Derivatives 28,027 – 11,245 16,782 – 10,587 – 20 – 4,507 1,669
Total 37,066 – 15,394 21,672 – 12,523 – 2,804 – 4,507 1,839
As at 31 December 2018, the net amount of recognized current account claims was shown entirely in deposits from customers (previous year: EUR 10 million deposits from banks, EUR 159 million deposits from customers).
The respective net amounts of the securities repurchase and lending agreements were broken down in the following balance sheet items: EUR 3,434 million in loans and advances to banks (previous year: EUR 3,276 million) and EUR 1,003 million in loans and advances to customers (previous year: EUR 1,445 million).
As in the previous year, the net liabilities from derivative transactions are also recognized in full in the financial assets at fair value through profit or loss balance sheet item.
The cash collateral was shown as at the reporting date at EUR 3,319 million (previous year: EUR 3,746 million) under Loans and advances to banks and at EUR 875 million (previous year: EUR 762 million) under Loans and advances to customers.
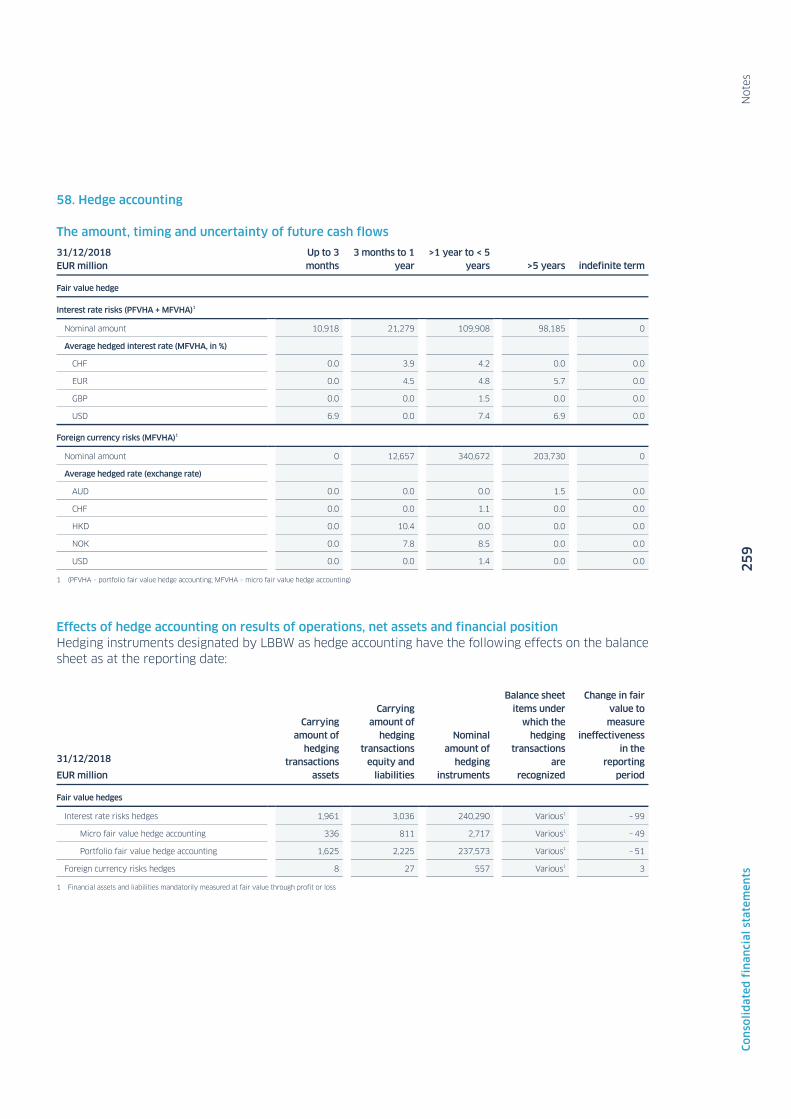
N
ote
s 2
59
C
on
soli
da
ted
fin
an
cia
l st
ate
me
nts
58. Hedge accounting
The amount, timing and uncertainty of future cash flows
31/12/2018 EUR million
Up to 3 months
3 months to 1 year
>1 year to < 5 years >5 years indefinite term
Fair value hedge
Interest rate risks (PFVHA + MFVHA)1
Nominal amount 10,918 21,279 109,908 98,185 0
Average hedged interest rate (MFVHA, in %)
CHF 0.0 3.9 4.2 0.0 0.0
EUR 0.0 4.5 4.8 5.7 0.0
GBP 0.0 0.0 1.5 0.0 0.0
USD 6.9 0.0 7.4 6.9 0.0
Foreign currency risks (MFVHA)1
Nominal amount 0 12,657 340,672 203,730 0
Average hedged rate (exchange rate)
AUD 0.0 0.0 0.0 1.5 0.0
CHF 0.0 0.0 1.1 0.0 0.0
HKD 0.0 10.4 0.0 0.0 0.0
NOK 0.0 7.8 8.5 0.0 0.0
USD 0.0 0.0 1.4 0.0 0.0
1 (PFVHA – portfolio fair value hedge accounting; MFVHA – micro fair value hedge accounting)
Effects of hedge accounting on results of operations, net assets and financial position Hedging instruments designated by LBBW as hedge accounting have the following effects on the balance sheet as at the reporting date:
31/12/2018
EUR million
Carrying amount of
hedging transactions
assets
Carrying amount of
hedging transactions
equity and liabilities
Nominal amount of
hedging instruments
Balance sheet items under
which the hedging
transactions are
recognized
Change in fair value to measure
ineffectiveness in the
reporting period
Fair value hedges
Interest rate risks hedges 1,961 3,036 240,290 Various1 – 99
Micro fair value hedge accounting 336 811 2,717 Various1 – 49
Portfolio fair value hedge accounting 1,625 2,225 237,573 Various1 – 51
Foreign currency risks hedges 8 27 557 Various1 3
1 Financial assets and liabilities mandatorily measured at fair value through profit or loss

N
ote
s 2
60
C
on
soli
da
ted
fin
an
cia
l st
ate
me
nts
The hedged items from fair value hedges designated as hedge accounting have the following effects on the balance sheet as at the reporting date:
31/12/2018
EUR million
Carrying amount of
hedged items assets
Carrying amount of
hedged items equity
and liabilities
Cumulative income or expenses
recognized in the
carrying amount of
the hedged item – assets
Cumulative income or expenses
recognized in the
carrying amount of
the hedged item –
equity and liabilities
Balance sheet items
under which the hedged
items are recognized
Change in fair value to
measure ineffectiven
ess in the reporting
period
Cumulative amount of
the fair value of hedged items that
are no longer adjusted to
hedge gains and losses
Interest rate risks hedges 30,188 27,814 – 126 95 Various1 87 893
Micro fair value hedge accounting 2,152 1,383 – 126 95 Various1 49 462
Portfolio fair value hedge accounting 28,036 26,431 0 0 Various1 38 431
Foreign currency risks
hedges 326 237 – 1 – 4 Various1 – 3 8
Discontinued hedging
relationships 0 0 – 1 0 Various1 0 0
1 Financial assets and liabilities measured at amortized cost; financial assets measured at fair value through other comprehensive income.
The hedge relationships from fair value hedges (PFVHA & MFVHA) mentioned above have the following effects on the income statement and other comprehensive income as at the reporting date:
31/12/2018
EUR million Ineffectiveness recognized in
the income statement
Items in the income statement under which ineffectiveness is
recognized
Interest rate risks hedges – 12 Net gains/losses from hedge
accounting
Foreign currency risks hedges 0 Net gains/losses from hedge
accounting

N
ote
s 2
61
C
on
soli
da
ted
fin
an
cia
l st
ate
me
nts
Other information
59. Disclosure of Interests in Other Entities
Significant restrictions on the Group's ability to access or use the Group assets. Assets are held within the Group that are subject to contractual, legal or regulatory disposal restraints, which can restrict LBBW's ability to access these assets and use them to meet the Group's liabilities. The restrictions result from the cover pools of the covered bond business, assets for the collateralization of liabilities from repurchase transactions and from the pledging of collateral for liabilities from OTC derivative transactions, as well as for liabilities issued by consolidated structured entities. Regulatory requirements, requirements of central banks and local company law rules can restrict the usability of assets.
There are no significant restrictions from property rights of non-controlling interests that restrict the ability of the Group to transfer assets or meet liabilities.
The carrying amounts of the assets with significant restrictions amount to:
EUR million 31/12/2018 31/12/2017
Assets with restrictions on disposal
Financial assets measured at amortized cost 60,023 62,617
Loans and advances to customers 37,419 41,467
Debentures and other fixed-income securities 294 0
Financial assets measured at fair value through profit or loss 6,213 6,436
Financial assets measured at fair value through other comprehensive income 3,962 4,047
Other assets 1,124 1,073
Total 71,028 74,172
The assets with significant restrictions comprise mainly the EUR 30 billion (previous year: EUR 33 billion) in cover assets in the covered bond business, financial assets of EUR 33 billion (previous year: EUR 32 billion) that have been transferred but not fully derecognized, especially in securities repurchase or lending transactions and development loan transactions (see Note 55) and collateral pledged for liabilities from OTC derivative transactions in the amount of EUR 5 billion (previous year: EUR 5 billion).
Shares in consolidated structured entities A total of eight (previous year: nine) structured entities were included in the consolidated financial statements, whose relevant activities are not influenced by voting or comparable rights. LBBW maintains business relationships with these companies and also acquires commercial paper from the consolidated structured entities as part of investment decisions.
As at 31 December 2018, liquidity lines in the amount of EUR 3,490 million (previous year: EUR 3,002 million) were provided to the consolidated structured entities.

N
ote
s 2
62
C
on
soli
da
ted
fin
an
cia
l st
ate
me
nts
Shares in joint agreements and associates Two joint ventures and two associates are of material importance to LBBW due to the carrying amount of the equity investment or the total assets and proportionate earnings and are accounted for using the equity method.
Summarized financial information for each joint venture that is material to LBBW and accounted for using the equity method is shown in the following table:
GIZS GmbH & Co. KG, Frankfurt am Main1,2
EUR million 31/12/2018 31/12/2017
Revenues 21 8
Scheduled amortization – 3 – 2
Profit/loss from continuing operations – 7 – 13
Net consolidated profit/loss in equity 0 1
Net consolidated total comprehensive income – 7 – 12
Current assets 17 8
Cash and cash equivalents 8 6
Other current assets 9 3
Non-current assets 12 12
Current liabilities 7 6
Current financial liabilities 0 6
Other current liabilities 7 0
Non-current liabilities 1 0
Other non-current liabilities 1 0
Net assets of the joint venture 20 15
Share of capital (in %) 33 33
Share of net assets 7 5
Other adjustments – 7 – 5
1 Principal place of business. 2 Strategic equity investment.
The Other adjustments item includes impairments on the equity investments.
GIZS GmbH & Co. KG, in which LBBW holds a 33% stake in the capital and voting rights, holds and manages the equity investment in a joint venture of institutions of the German banking industry, whose purpose is to establish, operate and further develop a process for mobile and online payments.
The structured entity Sealink Funding Designated Activity Company (»Sealink«) with registered offices in Dublin, Ireland, in which LBBW holds no stake in the capital and voting rights, was included as a material joint venture in the consolidated financial statements of LBBW using the equity method. In the absence of an equity investment by LBBW, the equity method cannot be applied for Sealink. Securities of the former Sachsen LB of originally EUR 17.3 billion were bundled in the structured entity. In 2018, the remaining securities from the Sealink portfolio amounting to EUR 63 million were sold in full. There was still cash of EUR 71 million as at 31 December 2018. Additional financial information on Sealink was not to hand as at 31 December 2018. Additional information about the background and effects of the sale of the Sealink portfolio with a view to detailed effects is described in the balance sheet in the financial position.

N
ote
s 2
63
C
on
soli
da
ted
fin
an
cia
l st
ate
me
nts
Summarized financial information for each associate that is material to LBBW is shown in the following table:
BWK GmbH Unternehmensbeteiligungsgese
llschaft, Stuttgart1,2 Hypo Vorarlberg Bank AG,
Bregenz1,2
EUR million 31/12/2018 31/12/2017 31/12/2018 31/12/2017
Revenues 19 16 308 305
Profit/loss from continuing operations 3 7 23 72
Net consolidated profit/loss in equity 0 4 11 0
Net consolidated total comprehensive income 3 12 34 73
Current assets 78 110 3,685 2,398
Non-current assets 274 257 9,815 10,585
Current liabilities 3 5 6,091 4,567
Non-current liabilities 6 7 6,322 7,351
Contingent liabilities 0 1 405 356
Net assets of the associate 343 355 1,087 1,066
Share of capital (in %) 40 40 23 24
Share of net assets 137 142 251 255
Other adjustments – 27 – 27 – 108 – 139
Carrying amount of the equity investment 110 115 143 116
1 Principal place of business. 2 Strategic equity investment.
The summarized financial information represents contributions of the IFRS financial statements of the associated entity, adjusted to the Group-wide accounting rules.
The Other adjustments item includes mainly impairments on the equity investments.
As an investor with a long-term perspective, BWK GmbH Unternehmensbeteiligungsgesellschaft, in which LBBW holds a 40% stake in the capital and voting rights, offers equity solutions to SMEs.
Hypo Vorarlberg Bank AG, in which LBBW has a 23% share of the voting rights, offers banking services for retail and corporate customers.
During the year under review, LBBW received dividends in the amount of EUR 6 million (previous year: EUR 6 million) from its equity investment in BWK GmbH Unternehmensbeteiligungsgesellschaft and EUR 1 million (previous year: EUR 3 million) from Hypo Vorarlberg Bank AG.
The shares in the success and the carrying amount of the share for each joint venture and associate, which are deemed insignificant individually and are accounted for using the equity method, are shown in the following table:
Associates Joint ventures
EUR million 31/12/2018 31/12/2017 31/12/2018 31/12/2017
Portion of the profit or loss from continuing operations 1 1 2 8
Share in net consolidated total comprehensive income 1 1 2 8
Total carrying amounts of the Group shares 8 9 5 4

N
ote
s 2
64
C
on
soli
da
ted
fin
an
cia
l st
ate
me
nts
Other unrecognized liabilities of EUR 2 million (previous year: EUR 2 million) exist in connection with shares in associates and joint ventures.
Shares in non-consolidated structured entities Structured entities are entities designed in a manner that voting and comparable rights do not represent the dominant factor when determining which party exercises controlling influence. This is the case, for example, when the voting rights relate solely to administrative duties and the relevant activities that significantly influence the entities' returns are controlled by contractual agreements or virtual positions of power.
A structured entity is often defined by several or all of the following characteristics:
∙ limited activities; ∙ narrow and clearly defined purpose; ∙ insufficient equity capital to conduct its relevant activities without secondary financial support; ∙ funding through the pooling of credit and other risks (tranches) in the form of multiple contractual
instruments that are linked to the investors.
Accordingly, structured entities are consolidated in the principles shown in Note 3, if LBBW can exercise a controlling influence because of its relationships with the structured entity. The information on the nonconsolidated structured entities is based on structured entities that are not consolidated as LBBW Group cannot exercise any controlling influence over them. This must be reported if LBBW is subject to variable returns from the activities of the structured entities from its contractual and non-contractual relationships (»shares«). Shares in non-consolidated structured entities comprise loans and credits, equity instruments, various types of derivative, guarantees and liquidity facilities.
LBBW has business relationships with the following types of non-consolidated structured entities:
∙ Funds: LBBW provides customers with opportunities to invest in funds established and sponsored by LBBW itself, and invests in funds established and sponsored by third parties. Funds allow investors to make targeted investments in assets in line with a fixed investment strategy. Financing is generally provided through the issue of fund units and usually secured by the assets held by the structured entity. LBBW may operate as manager of the structured entity, investor, trustee for other investors or in another function.
∙ Securitization vehicles: Securitization vehicles offer investment opportunities to investors in diversified portfolios of different assets, such as, for example, leasing, trade receivables and the like. The securitization vehicles are financed through the issue of tranched debentures, whose disbursements are dependent on the performance of the assets of the securitization vehicles and from the position of the respective tranche within the payment waterfall. LBBW participates in the funding or structuring of such vehicles.
∙ Financing companies: Financing companies (including leasing companies) are established for the purpose of funding various assets or transactions. They follow a specific company purpose, which means that the relevant activities are predetermined or not controlled by voting or comparable rights. As a lender, LBBW provides funding for these structured entities that are secured by assets held by the company.
∙ Other: Other structured entities are entities that cannot be assigned to any of the types stated above.

N
ote
s 2
65
C
on
soli
da
ted
fin
an
cia
l st
ate
me
nts
The scope of a structured entity depends on its type:
∙ Funds: Volume of assets under management ∙ Securitizations: Nominal value of the issued securities ∙ Financing companies: Total assets ∙ Other structured entities: Total assets
The scope of non-consolidated structured entities without publicly available data is stated with the nominal value of LBBW's exposure.
The scope of the non-consolidated structured entities is as follows:
Securitization vehicle Funds Financing companies Other Total
EUR million 31/12/2018 31/12/2017 31/12/2018 31/12/2017 31/12/2018 31/12/2017 31/12/2018 31/12/2017 31/12/2018 31/12/2017
Scope of the
structured entities 7,078 9,497 352,600 322,044 7,843 14,988 1,202 737 368,724 347,266
The following table shows the carrying amounts of the assets and liabilities, the nominal values of the off-balance-sheet obligations that concern the shares in non-consolidated structured entities, and the items in the consolidated balance sheet in which these assets and liabilities are recognized, depending on the type of structured entity:

N
ote
s 2
66
C
on
soli
da
ted
fin
an
cia
l st
ate
me
nts
Securitization
vehicle Funds Financing companies Other Total
EUR million
31/12/
2018
31/12/
2017
31/12/
2018
31/12/
2017
31/12/
2018
31/12/
2017
31/12/
2018
31/12/
2017
31/12/
2018
31/12/
2017
Assets
Financial assets measured at amortized cost 1,802 3,364 3,440 3,115 1,469 1,509 1,202 6 7,913 7,995
Financial assets mandatorily
measured at fair value through profit or loss 2 1 727 1,128 12 10 0 10 741 1,149
Trading assets 1 1 718 1,116 12 9 0 10 730 1,136
Positive fair values from hedging
derivatives 1 0 10 12 0 1 0 0 11 13
Financial assets designated at fair value 0 0 0 214 0 0 0 0 0 214
Financial assets measured at fair
value through other comprehensive income 0 399 0 0 0 31 0 0 0 430
Total assets 1,804 3,764 4,167 4,458 1,480 1,550 1,202 16 8,654 9,788
Equity and liabilities
Financial liabilities measured at
amortized cost 35 38 6,401 5,679 182 157 0 0 6,618 5,874
Deposits from banks 0 0 16 0 0 0 0 0 16 0
Deposits from customers 35 38 6,385 5,679 182 157 0 0 6,602 5,874
Financial liabilities mandatorily
measured at fair value through profit or loss 0 0 71 110 0 0 0 0 71 111
Trading liabilities 0 0 71 109 0 0 0 0 71 109
Negative fair values from
hedging derivatives 0 0 0 1 0 0 0 0 0 1
Total equity and liabilities 35 39 6,472 5,789 182 157 0 0 6,689 5,985
Off-balance-sheet obligations 0 0 33 108 345 140 0 0 377 248
The maximum potential losses from shares in non-consolidated structured entities depend on the type of shares. The maximum risk of loss on assets presented in the table corresponds to the balance sheet figures (after allowances for losses on loans and advances if necessary). Of the derivatives with a carrying amount of EUR 81 million (previous year: EUR 37 million) and EUR 71 million (previous year: EUR 111 million) included in the trading assets or trading liabilities, respectively, and the off-balance-sheet obligations, including loan commitments, guarantees and liquidity facilities, the nominal amounts represent the maximum potential losses. The nominal value for derivatives with a positive replacement value is EUR 5,117 million (previous year: EUR 3,115 million) while that for derivatives with a negative replacement value is EUR 5,937 million (previous year: EUR 7,991 million). The maximum risk of loss does not correspond to the expected loss and does not take into account existing collateral and hedge relationships that limit the economic risk.
LBBW received interest income and fee and commission income from financing its shares in these nonconsolidated structured entities. Further income was generated from management fees and possible profit-sharing within the scope of fund management operations by LBBW. In addition, income is realized from the valuation or sale of securities issued by non-consolidated structured entities.

N
ote
s 2
67
C
on
soli
da
ted
fin
an
cia
l st
ate
me
nts
Sponsored non-consolidated structured entities in which LBBW does not hold any shares as at the reporting date. LBBW participated as a sponsor for the launch or marketing of various structured entities in which it held no shares as at the reporting date. A structured entity is considered to be sponsored if it is reasonably associated with LBBW and supported by LBBW. Support in this respect can comprise the following services:
∙ Using the name »LBBW« for the structured entity; ∙ LBBW assets are transferred or sold to this structured entity; ∙ The structured entity was funded by LBBW and/or start-up capital provided by LBBW.
LBBW received gross income of EUR 5 million (previous year: EUR 6 million) from fees and commission from business transactions with sponsored, non-consolidated funds and securitizations in which LBBW holds no shares as at the reporting date. No assets were transferred from third parties to sponsored, non-consolidated structured entities in 2018 (previous year: EUR 1,192 million).
60. Leases
Finance lease – LBBW as a lessor The following reconciliation of the gross investment value to the present value of the minimum leasing payments has been prepared for finance lease transactions which are shown under loans and advances to customers:
EUR million 31/12/2018 31/12/2017
Gross investment value 5,584 5,746
Up to 1 year 1,793 1,827
More than 1 year to 5 years 3,476 3,597
More than 5 years 315 323
./. unrealized financial income – 277 – 380
= Net investment value 5,307 5,367
./. Present value of unguaranteed residual values – 5 – 2
= Present value of receivables from minimum leasing payments 5,302 5,364
Up to 1 year 1,675 1,691
More than 1 year to 5 years 3,319 3,369
More than 5 years 308 304
From the standpoint of the lessor, gross investment in the lease is the aggregate of the minimum leasing payments under a finance lease and any unguaranteed residual value accruing to the lessor. Minimum leasing payments are the payments over the lease term that the lessee is, or can be required, to make excluding contingent rent, costs for services and taxes to be paid by and reimbursed to the lessor, together with any guaranteed residual values. Initial direct costs are included in receivables from finance lease contracts. The net investment value is the present value of the gross investment; the discount is thus based on the interest rate implicit in the lease from the lessor's perspective.
The cumulative write-downs for uncollectible outstanding minimum leasing payments amounted to EUR 49 million on the reporting date (previous year: EUR 56 million).

N
ote
s 2
68
C
on
soli
da
ted
fin
an
cia
l st
ate
me
nts
Finance lease – LBBW as a lessee The leased assets from finance leases shown under property and equipment are comprised of the following types:
EUR million 31/12/2018 31/12/2017
Buildings 0 1
Land 1 1
Total leased assets under finance leases 1 2
The carrying amount of finance lease assets in property and equipment refers mainly to one building with land. A property management company as the lessor and LBBW as the lessee entered into a lease agreement for an administrative building in Mainz, Germany. The lease term is 20 years with one conversion point of 31 August 2020. The lessee has an option to buy at the end of the rental period at the market value of the leased property determined in the contract.
The following reconciliation of the gross investment value to the present value of the minimum lease payments has been prepared for the liabilities from finance lease transactions included in Other liabilities, among other things:
EUR million 31/12/2018 31/12/2017
Future minimum leasing payments 2 3
Up to 1 year 1 1
More than 1 year to 5 years 1 2
= Present value of future minimum leasing payments 2 3
Up to 1 year 1 1
More than 1 year to 5 years 1 2
Operating lease – LBBW as a lessor The carrying amounts of assets leased within operating leases under property and equipment, which mainly constitute agreements concerning leasing of LBBW's own properties and buildings, are broken down as follows:
EUR million 31/12/2018 31/12/2017
Buildings 37 61
Land 17 32
Total operating lease 54 93
The carrying amounts of the investment property that is rented within the scope of operating lease agreements amount to EUR 697 million (previous year: EUR 554 million).

N
ote
s 2
69
C
on
soli
da
ted
fin
an
cia
l st
ate
me
nts
The following payments are expected from the leases mentioned:
EUR million 31/12/2018 31/12/2017
Up to 1 year 52 53
More than 1 year to 5 years 136 159
More than 5 years 79 110
Future minimum leasing payments from non-terminable leasing contracts 267 322
Operating lease – LBBW as a lessee Leases for which LBBW is the lessee yield payment obligations of:
EUR million 31/12/2018 31/12/2017
Up to 1 year 57 62
More than 1 year to 5 years 162 186
More than 5 years 140 63
Future minimum leasing payments from non-terminable leasing contracts 359 311
In the 2018 financial year, minimum leasing payments of EUR -52 million (previous year: EUR -44 million) were recorded as expenses. These items comprise mainly expenses incurred for rent for business premises.
61. Related party disclosures Related party transactions are concluded by LBBW in the ordinary course of business.
These include the shareholders of LBBW (see Note 18), controlled subsidiaries that are however not consolidated for reasons of materiality, structured entities, associates, joint ventures, persons in key positions and their relatives, as well as companies controlled by these individuals. Persons in key positions include the members of the Board of Managing Directors and of the Supervisory Board of LBBW (Bank), including relatives. Other related parties/companies also include equity investments by the shareholders and companies on which persons in key positions and their families can exert a dominant or material influence.
Information on the compensation of and transactions with individuals in key positions is shown in Note 67.
The related party transactions were concluded at arm's length terms in the ordinary course of business. These included loans, overnight and term money, derivatives and securities transactions, among others.

N
ote
s 2
70
C
on
soli
da
ted
fin
an
cia
l st
ate
me
nts
The following table shows the extent of the related party transactions:
31/12/2018 EUR million Shareholders
Members of the Board of
Managing Directors and Supervisory
Board
Non-consolidated subsidiaries Associates
Joint ventures
Other related parties
Financial assets measured at
amortized cost 625 3 4 228 1 1,455
Financial assets measured at fair
value through other comprehensive income 0 0 31 168 0 0
Financial assets designated at fair value 44 0 0 0 0 0
Financial assets mandatorily
measured at fair value through profit or loss 1,340 0 26 117 5 213
Other assets 0 0 1 0 0 0
Total assets 2,009 3 62 514 7 1,668
Financial liabilities measured at amortized cost 2,207 7 61 139 12 10,860
Financial liabilities designated at
fair value 0 0 0 0 0 22
Financial liabilities mandatorily
measured at fair value through profit or loss 0 0 0 48 0 124
Total equity and liabilities 2,207 7 61 187 12 11,006
Off-balance-sheet transactions 326 1 8 66 2 793
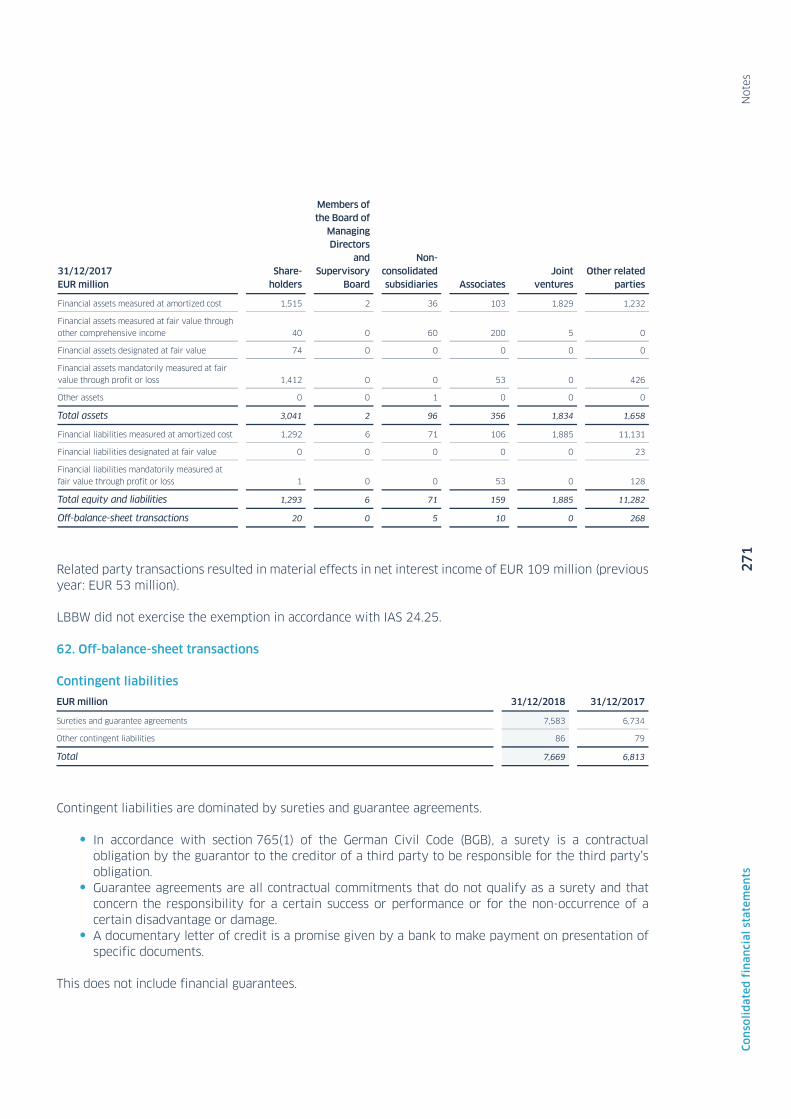
N
ote
s 2
71
C
on
soli
da
ted
fin
an
cia
l st
ate
me
nts
31/12/2017 EUR million
Share-holders
Members of the Board of
Managing Directors
and Supervisory
Board
Non-consolidated subsidiaries Associates
Joint ventures
Other related parties
Financial assets measured at amortized cost 1,515 2 36 103 1,829 1,232
Financial assets measured at fair value through
other comprehensive income 40 0 60 200 5 0
Financial assets designated at fair value 74 0 0 0 0 0
Financial assets mandatorily measured at fair value through profit or loss 1,412 0 0 53 0 426
Other assets 0 0 1 0 0 0
Total assets 3,041 2 96 356 1,834 1,658
Financial liabilities measured at amortized cost 1,292 6 71 106 1,885 11,131
Financial liabilities designated at fair value 0 0 0 0 0 23
Financial liabilities mandatorily measured at
fair value through profit or loss 1 0 0 53 0 128
Total equity and liabilities 1,293 6 71 159 1,885 11,282
Off-balance-sheet transactions 20 0 5 10 0 268
Related party transactions resulted in material effects in net interest income of EUR 109 million (previous year: EUR 53 million).
LBBW did not exercise the exemption in accordance with IAS 24.25.
62. Off-balance-sheet transactions
Contingent liabilities
EUR million 31/12/2018 31/12/2017
Sureties and guarantee agreements 7,583 6,734
Other contingent liabilities 86 79
Total 7,669 6,813
Contingent liabilities are dominated by sureties and guarantee agreements.
∙ In accordance with section 765(1) of the German Civil Code (BGB), a surety is a contractual obligation by the guarantor to the creditor of a third party to be responsible for the third party’s obligation.
∙ Guarantee agreements are all contractual commitments that do not qualify as a surety and that concern the responsibility for a certain success or performance or for the non-occurrence of a certain disadvantage or damage.
∙ A documentary letter of credit is a promise given by a bank to make payment on presentation of specific documents.
This does not include financial guarantees.

N
ote
s 2
72
C
on
soli
da
ted
fin
an
cia
l st
ate
me
nts
In the event of objective indications of impairment, any loss is to be calculated using probability-weighted scenarios. The amount of the provision is determined by the present-value amount at which the Bank expects the beneficiary under a guarantee to make a claim against it, minus expected inflows e.g. from rights (rights of recourse, securities etc.).
In addition to legal risks, other contingent liabilities also include payment obligations towards the restructuring fund (bank levy) payable in part or in full on first demand in the event of resolution measures and for which cash collateral has been provided.
The German Deposit Guarantee Act (Einlagensicherungsgesetz – EinSiG), which came into force on 3 July 2015, governs the future financial resources of statutory and bank-related guarantee systems, including the bank-related guarantee system of the Sparkassen-Finanzgruppe. LBBW makes an irrevocable commitment to the owner of the bank-related guarantee system, German Savings Bank Association (Deutscher Sparkassen- und Giroverband – DSGV), to make further payments on first demand e. g. in the compensation case pursuant to Section 10 EinSiG, in addition to the annual contribution. Other contingent liabilities include collateral provided in this context.
The following liability relationships exist in addition to the contingent liabilities shown in the above table:
∙ Pursuant to Section 5 (10) of the bylaws of the German Deposit Protection Fund, LBBW undertook to indemnify Bundesverband Deutscher Banken e.V., Berlin, against any and all losses incurred by the latter as a result of assistance provided to credit institutions that are majority-owned by Landesbank Baden-Württemberg.
∙ For letters of comfort issued please see the list of shareholdings (Note 65). ∙ Liabilities from the guarantee obligation: LBBW (Bank) is liable indefinitely for the liabilities of
DekaBank Deutsche Girozentrale, Berlin and Frankfurt am Main, and of former LBS Landesbausparkassen Baden-Württemberg, Stuttgart and Karlsruhe created up to 18 July 2001. This also applies externally to the liabilities of the following credit institutions, provided that these liabilities arose during the time when LBBW was a guarantor of these credit institutions: the former Landesbank Schleswig-Holstein Girozentrale, Kiel, and the former LRP Landesbank Rheinland-Pfalz, Mainz.
Other obligations
EUR million 31/12/2018 31/12/2017
Irrevocable loan commitments 25,476 22,412
Total 25,476 22,412
The item consists exclusively of the unutilized amount of the commitment granted that the Bank cannot revoke. If a guarantee is drawn on, there is a risk for LBBW that its claim (for recourse) against the guarantee holder or borrower less the collateral is not valuable (see Note 8 for information on allowances for losses on loans and advances).
Further transactions not included in the balance sheet and other financial obligations
EUR million 31/12/2018 31/12/2017
Payment obligations and joint liability 468 496
Obligations from investment projects started 135 101
Revocable loan commitments 19,409 n/a
Miscellaneous 24 99
Total 20,036 696

N
ote
s 2
73
C
on
soli
da
ted
fin
an
cia
l st
ate
me
nts
The following liability relationships exist in addition to the other financial obligations shown in the above table:
Payment obligations and joint liability consist of additional funding obligations to central counterparties in the amount of EUR 383 million (previous year: EUR 403 million). In addition to the items shown in the table, obligations of EUR 294 million (previous year: EUR 309 million) arise each year from rental and lease agreements.
Contingent claims
EUR million 31/12/2018 31/12/2017
Legal disputes 7 6
Total 7 6
Fiduciary transactions The trust activities which are not carried in the balance sheet involve the following types of assets and liabilities and break down as follows:
EUR million 31/12/2018 31/12/2017
Loans and advances to banks 282 335
Loans and advances to customers 125 157
Financial investments 2 2
Other assets 29 31
Total trust assets1 439 526
Deposits from banks 434 524
Deposits from customers 2 2
Other liabilities 3 0
Total trust liabilities1 439 526
1 Including receivables and liabilities on behalf of others for the account of a third party (administrative loans).
63. Capital management Capital management at LBBW is designed to ensure solid capitalization within the LBBW Group, both in times of normal business operations and under stress conditions. In order to guarantee adequate capital and hence the associated permanent viability of LBBW from various perspectives, the capital ratios and structures are analyzed from an economic, present-value view point as well as from a normative, regulatory perspective. Both control loops focus on achieving the company targets for normal business operations, while making adequate provisions for stress resistance under stress conditions.
The integrated risk and capital management is carried out by the Group's Board of Managing Directors. Among other things, the Asset Liability Committee (ALCo) supports the Board of Managing Directors in structuring the balance sheet, managing capital and liquidity, in funding and in managing market-price risks. The ALCo prepares decisions in this respect that are subsequently met by the Group's Board of Managing Directors.
On matters relating to risk management and capital management under economic aspects, the Risk Committee (RiskCom) helps prepare decisions for the Board of Managing Directors with regard to risk monitoring, the risk methodology and the risk strategy for the Group as a whole, and in relation to compliance with the regulatory requirements.

N
ote
s 2
74
C
on
soli
da
ted
fin
an
cia
l st
ate
me
nts
The coordinating Regulatory/Accounting Committee evaluates at an early stage the requirements of the large number of provisions of banking supervisory law and accounting that are relevant for management purposes and takes the measures required.
Capital allocation and longer-term strategic capital management is carried out during the planning process integrated on an annual basis (with a five-year planning horizon – known as medium-term planning) with the forecast during the year, and is decided and monitored continuously by the Group's Board of Managing Directors. The Supervisory Board approves the business plan submitted for the coming year and takes note of the medium-term planning contained therein.
Economic capital To ensure adequate capitalization from an economic point of view, a Group-wide compilation of risks across all material risk types and subsidiaries, and the comparison of these with the capital calculated from an economic perspective (aggregate risk cover). This calculation of risk-bearing capacity (RBC) is carried out at a very high confidence level and with comprehensive classification of the definition of capital taking into consideration subordinated liabilities.
The internal monitoring of this key figure using binding targets and tolerance levels ensures LBBW Group has adequate economic capital both in times of normal business operations as well as under stress conditions.
See the risk report for details.
Regulatory capital LBBW Group's capital ratios are calculated according to the provisions of Article 92 CRR in conjunction with Article 11 CRR. Accordingly, the ratios to be fulfilled at all times are:
∙ Common equity Tier 1 capital ratio (basis: CET1 capital) of 4.5%, plus relevant capital buffer ∙ Tier 1 ratio (basis: common equity Tier 1 capital and additional Tier 1 capital) of 6.0% ∙ Total capital ratio (basis: common equity Tier 1 and additional Tier 1 capital, as well as
supplementary capital) of 8.0%
The ECB is conducting the Supervisory Review and Evaluation Process (SREP). Based on this process, the ECB determined that, beyond the minimum requirements under Article 92 CRR, LBBW is required to maintain a CET1 capital ratio of 8.80% at all times on a consolidated basis in 2018. This ratio includes the aforementioned common equity Tier 1 capital ratio and the capital conservation buffer, the buffer for other systemically relevant banks and the additional regulatory capital requirements within the scope of the SREP process.
Furthermore, a bank-specific countercyclical capital buffer must be held. This capital buffer can be imposed by countries in the European Economic Area and by third-party states for the major risk exposures in their country. In addition to this, the Bank has to meet the requirements of the Pillar II Capital Guidance (P2G) as additional capital guidance.
The ratios result from the relevant capital components in relation to the total exposure amount, expressed in percent. The total exposure amount is calculated as the risk weighted exposure amounts for the credit and dilution risk, the counterparty risk from the trading book business, market price risk (position, foreign currency and commodity position risks), the risks of credit valuation adjustments for OTC derivatives and operational risk. These ratios required by the supervisory authorities were maintained at all times during the 2018 financial year.
The own funds derive from the sum of Tier 1 and Tier 2 capital.

N
ote
s 2
75
C
on
soli
da
ted
fin
an
cia
l st
ate
me
nts
Tier 1 capital consists of common equity Tier 1 capital and additional Tier 1 capital, whereby the common equity Tier 1 capital comprises the paid-in capital, associated premiums (capital reserves), retained earnings and cumulative other income.
The additional Tier 1 capital comprises the silent partners' contributions. Due to the transitional provisions that will be in place until the end of 2021, they may continue to be included this capital heading within the ranges applicable in accordance with Article 486 CRR in conjunction with Article 31 SolvV. Amounts that are no longer included in these ranges may be included in this capital heading, provided the conditions for consideration as supplementary capital are met.
Supplementary capital comprises long-term securitized subordinated liabilities as well as long-term subordinated loans and profit participation rights that meet the requirements of Article 63 CRR and the associated premiums. The supplementary capital instruments are subject to a day specific reduction in the last five years of their term.
Intangible assets, deferred tax claims from loss carryforwards dependent on future profitability and the value adjustment deficit for receivables that were calculated pursuant to the IRB approach, must be deducted from the common equity Tier 1 capital. In addition, the gains or losses from own liabilities measured at fair value due to changes in the credit ratings of LBBW Group, gains and losses from derivative liabilities recognized at fair value resulting from the Bank's own credit risk, as well as value adjustments due to the requirements for a prudent valuation must be deducted when calculating the own funds. Additional deductible items include irrevocable payment obligations towards the deposit guarantee system of the German Savings Bank Association (Deutscher Sparkassen- und Giroverband – DSGV) and towards the Single Resolution Board’s resolution fund.
Transitional provisions in accordance with Article 469 ff. CRR may be applied here for the deductible item »deferred tax claims from loss carryforwards dependent on future profitability« for the final time. Deductions of 80% from the CET1 capital were taken into account in 2018, while the remaining 20% is to be recognized as risk weighted assets with a risk weight of 0%.
As part of market-smoothing operations, supplementary capital components securitized in securities may be repurchased within the applicable limits. Some directly or indirectly held supplementary capital instruments that have been repurchased must be deducted from the supplementary capital. The fixed ceiling was complied with at all times in 2018.
LBBW applies the internal ratings-based approach (basic IRB approach) approved by the German Federal Financial Supervisory Authority (BaFin) for calculating capital backing for counterparty risks arising from the main exposure classes. Equity requirements for receivables for which permission has not been received to use a rating procedure are calculated in accordance with the credit risk standardized approach (CRSA).
The own funds in accordance with CRR are calculated based on the IFRS financial statements of the entities included in the regulatory scope of consolidation.
In a notification dated 31 December 2018 and for the first time, LBBW submitted an application to the European Central Bank to partially include the current profit for the year in common equity Tier 1 capital in this year’s annual financial statements. This application was granted.
The following table shows the structure of the LBBW Group's own funds as at the reporting date 31 December 2018:

N
ote
s 2
76
C
on
soli
da
ted
fin
an
cia
l st
ate
me
nts
EUR million 31/12/2018 31/12/2017
Own funds 17,690 16,869
Tier 1 capital 13,039 12,795
of which common equity Tier 1 capital (CET1) 12,119 11,955
of which additional Tier 1 capital (AT 1) 920 840
Supplementary capital (Tier 2) 4,651 4,075
Total amount at risk 80,348 75,728
Risk weighted exposure amounts for credit, counterparty and dilution risk, and advance payments 69,249 63,684
Total exposure amount for position, foreign exchange and commodity risk 5,145 5,608
Total risk exposure amount for operational risks 4,685 4,514
Total amount of risk due to CVA 1,269 1,922
Total capital ratio (in %) 22.0 22.3
Tier 1 capital ratio (in %) 16.2 16.9
Common equity Tier 1 (CET 1) capital ratio (in %) 15.1 15.8
EUR million 31/12/2018 31/12/2017
Tier 1 capital 13,039 12,795
Paid-in capital instruments 3,484 3,484
Premium 8,240 8,240
Additional Tier 1 capital (AT 1) 920 840
Retained profits, cumulative result and other reserves 1,072 1,289
Deductibles from CET 1 capital in accordance with CRR, taking into account transitional provisions – 677 – 1,058
Explanation of the changes in 2017 versus 2018 The common equity Tier 1 (CET 1) of the LBBW Group increased against the previous year. This was driven mainly by earnings retention, the recognition of intermediate profits for the 2018 financial year in accordance with Article 26(1) CRR and the decrease in deductible items. The effect of this was countered by the decline in the cumulative result on account of remeasurement, the transition to IFRS 9 and the end of the transitional provisions, under which it was still permitted to partially take deductible items into account in additional Tier 1 (AT 1) capital and supplementary capital (T2).
The transitional provisions expired, causing the additional Tier 1 capital (AT 1) to rise. Deductibles must now be taken into account exclusively in CET 1. Supplementary capital (T 2) was strengthened in 2018 through the new issue of two subordinated bonds within the scope of the MTN program, amounting to USD 185 million and AUD 450 million respectively. In addition, subordinated liabilities of EUR 95 million were placed on the market. Another positive effect for subordinated capital was due to the end of the transitional provisions. The amortization of Tier 2 capital components on the basis of the number of days that have passed had the opposite effect.
The changes impacting on CET 1 capital have an effect on all capital ratios. An increase in AT 1 capital influences the Tier 1 capital ratio and the total capital ratio, while the issue of Tier 2 capital only has a positive effect on the total capital ratio.
The total amount of risk increased as against the end of the previous year, due primarily to the upturn in new business in the IRB exposure classes Other entities and Special financing as well as adjusted ratings for transactions reported in the exposure class Other entities.
64. Events after the balance sheet date There were no events after the end of the reporting period.

N
ote
s 2
77
C
on
soli
da
ted
fin
an
cia
l st
ate
me
nts
Additional disclosures in accordance with Section 315e HGB
65. List of shareholdings and information on subsidiaries, associates and joint ventures The share of the associates and joint ventures in the aggregate assets and liabilities, as well as revenues and profits/losses for the period are presented in Note 59.
LBBW Immobilien-Holding GmbH, Stuttgart, and LBBW Service GmbH, Stuttgart, availed of the exemption according to Section 264 (3) HGB.
The following overview shows the full list of shareholdings of LBBW in accordance with Section 313 (2) HGB in the consolidated financial statements and Section 285 (11) HGB in the annual financial statements of Landesbank Baden-Württemberg including the statements pursuant to Section 285 (11a) HGB as at the reporting date. The list of shareholdings shows the companies for which a letter of comfort has been issued.
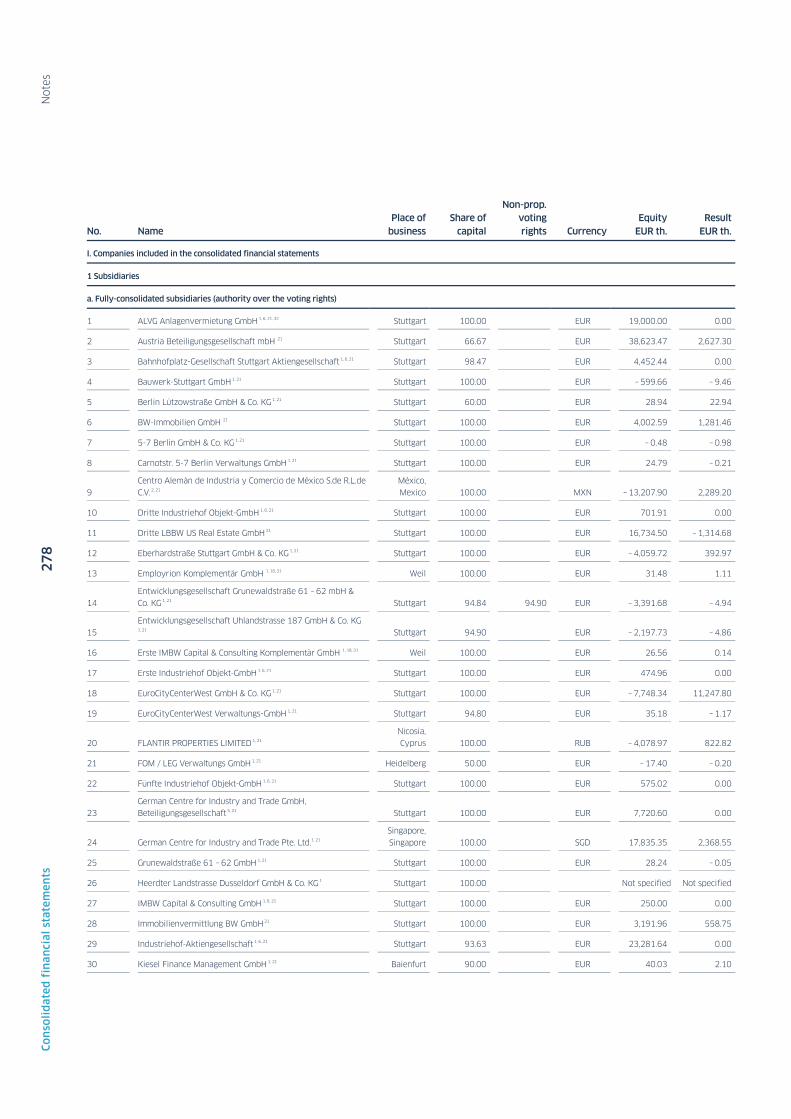
N
ote
s 2
78
C
on
soli
da
ted
fin
an
cia
l st
ate
me
nts
No. Name Place of
business Share of
capital
Non-prop. voting rights Currency
Equity EUR th.
Result EUR th.
I. Companies included in the consolidated financial statements
1 Subsidiaries
a. Fully-consolidated subsidiaries (authority over the voting rights)
1 ALVG Anlagenvermietung GmbH 1, 6, 21, 32 Stuttgart 100.00 EUR 19,000.00 0.00
2 Austria Beteiligungsgesellschaft mbH 21 Stuttgart 66.67 EUR 38,623.47 2,627.30
3 Bahnhofplatz-Gesellschaft Stuttgart Aktiengesellschaft 1, 6, 21 Stuttgart 98.47 EUR 4,452.44 0.00
4 Bauwerk-Stuttgart GmbH 1, 21 Stuttgart 100.00 EUR – 599.66 – 9.46
5 Berlin Lützowstraße GmbH & Co. KG 1, 21 Stuttgart 60.00 EUR 28.94 22.94
6 BW-Immobilien GmbH 21 Stuttgart 100.00 EUR 4,002.59 1,281.46
7 5-7 Berlin GmbH & Co. KG 1, 21 Stuttgart 100.00 EUR – 0.48 – 0.98
8 Carnotstr. 5-7 Berlin Verwaltungs GmbH 1, 21 Stuttgart 100.00 EUR 24.79 – 0.21
9 Centro Alemán de Industria y Comercio de México S.de R.L.de C.V. 2, 21
México, Mexico 100.00 MXN – 13,207.90 2,289.20
10 Dritte Industriehof Objekt-GmbH 1, 6, 21 Stuttgart 100.00 EUR 701.91 0.00
11 Dritte LBBW US Real Estate GmbH 21 Stuttgart 100.00 EUR 16,734.50 – 1,314.68
12 Eberhardstraße Stuttgart GmbH & Co. KG 1, 21 Stuttgart 100.00 EUR – 4,059.72 392.97
13 Employrion Komplementär GmbH 1, 18, 31 Weil 100.00 EUR 31.48 1.11
14 Entwicklungsgesellschaft Grunewaldstraße 61 – 62 mbH & Co. KG 1, 21 Stuttgart 94.84 94.90 EUR – 3,391.68 – 4.94
15 Entwicklungsgesellschaft Uhlandstrasse 187 GmbH & Co. KG
1, 21 Stuttgart 94.90 EUR – 2,197.73 – 4.86
16 Erste IMBW Capital & Consulting Komplementär GmbH 1, 18, 31 Weil 100.00 EUR 26.56 0.14
17 Erste Industriehof Objekt-GmbH 1, 6, 21 Stuttgart 100.00 EUR 474.96 0.00
18 EuroCityCenterWest GmbH & Co. KG 1, 21 Stuttgart 100.00 EUR – 7,748.34 11,247.80
19 EuroCityCenterWest Verwaltungs-GmbH 1, 21 Stuttgart 94.80 EUR 35.18 – 1.17
20 FLANTIR PROPERTIES LIMITED 1, 21 Nicosia, Cyprus 100.00 RUB – 4,078.97 822.82
21 FOM / LEG Verwaltungs GmbH 1, 21 Heidelberg 50.00 EUR – 17.40 – 0.20
22 Fünfte Industriehof Objekt-GmbH 1, 6, 21 Stuttgart 100.00 EUR 575.02 0.00
23 German Centre for Industry and Trade GmbH, Beteiligungsgesellschaft 5, 21 Stuttgart 100.00 EUR 7,720.60 0.00
24 German Centre for Industry and Trade Pte. Ltd.1, 21 Singapore,
Singapore 100.00 SGD 17,835.35 2,368.55
25 Grunewaldstraße 61 – 62 GmbH 1, 21 Stuttgart 100.00 EUR 28.24 – 0.05
26 Heerdter Landstrasse Dusseldorf GmbH & Co. KG 1 Stuttgart 100.00 Not specified Not specified
27 IMBW Capital & Consulting GmbH 1, 6, 21 Stuttgart 100.00 EUR 250.00 0.00
28 Immobilienvermittlung BW GmbH 21 Stuttgart 100.00 EUR 3,191.96 558.75
29 Industriehof-Aktiengesellschaft 1, 6, 21 Stuttgart 93.63 EUR 23,281.64 0.00
30 Kiesel Finance Management GmbH 1, 21 Baienfurt 90.00 EUR 40.03 2.10
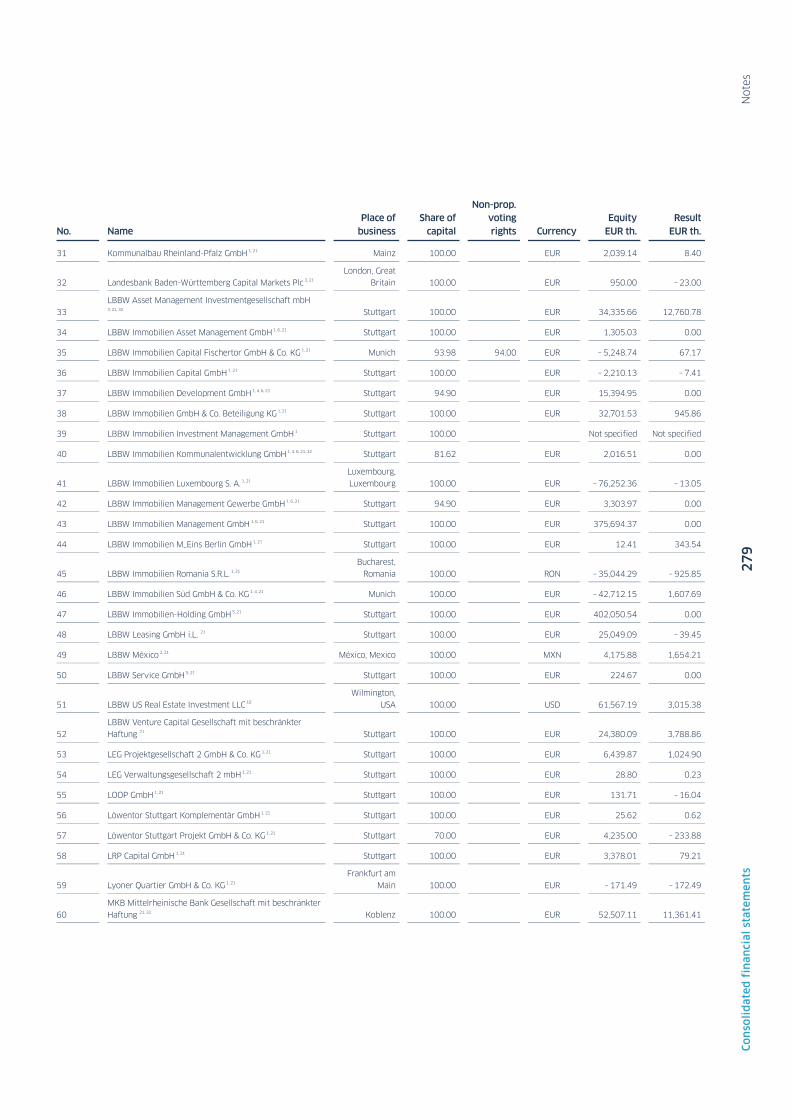
N
ote
s 2
79
C
on
soli
da
ted
fin
an
cia
l st
ate
me
nts
No. Name Place of
business Share of
capital
Non-prop. voting rights Currency
Equity EUR th.
Result EUR th.
31 Kommunalbau Rheinland-Pfalz GmbH 1, 21 Mainz 100.00 EUR 2,039.14 8.40
32 Landesbank Baden-Württemberg Capital Markets Plc 3, 21 London, Great
Britain 100.00 EUR 950.00 – 23.00
33 LBBW Asset Management Investmentgesellschaft mbH
3, 21, 32 Stuttgart 100.00 EUR 34,335.66 12,760.78
34 LBBW Immobilien Asset Management GmbH 1, 6, 21 Stuttgart 100.00 EUR 1,305.03 0.00
35 LBBW Immobilien Capital Fischertor GmbH & Co. KG 1, 21 Munich 93.98 94.00 EUR – 5,248.74 67.17
36 LBBW Immobilien Capital GmbH 1, 21 Stuttgart 100.00 EUR – 2,210.13 – 7.41
37 LBBW Immobilien Development GmbH 1, 4, 6, 21 Stuttgart 94.90 EUR 15,394.95 0.00
38 LBBW Immobilien GmbH & Co. Beteiligung KG 1, 21 Stuttgart 100.00 EUR 32,701.53 945.86
39 LBBW Immobilien Investment Management GmbH 1 Stuttgart 100.00 Not specified Not specified
40 LBBW Immobilien Kommunalentwicklung GmbH 1, 4, 6, 21, 32 Stuttgart 81.62 EUR 2,016.51 0.00
41 LBBW Immobilien Luxembourg S. A. 1, 21 Luxembourg, Luxembourg 100.00 EUR – 76,252.36 – 13.05
42 LBBW Immobilien Management Gewerbe GmbH 1, 6, 21 Stuttgart 94.90 EUR 3,303.97 0.00
43 LBBW Immobilien Management GmbH 1, 6, 21 Stuttgart 100.00 EUR 375,694.37 0.00
44 LBBW Immobilien M_Eins Berlin GmbH 1, 21 Stuttgart 100.00 EUR 12.41 343.54
45 LBBW Immobilien Romania S.R.L. 1, 21 Bucharest,
Romania 100.00 RON – 35,044.29 – 925.85
46 LBBW Immobilien Süd GmbH & Co. KG 1, 4, 21 Munich 100.00 EUR – 42,712.15 1,607.69
47 LBBW Immobilien-Holding GmbH 5, 21 Stuttgart 100.00 EUR 402,050.54 0.00
48 LBBW Leasing GmbH i.L. 21 Stuttgart 100.00 EUR 25,049.09 – 39.45
49 LBBW México 2, 21 México, Mexico 100.00 MXN 4,175.88 1,654.21
50 LBBW Service GmbH 5, 21 Stuttgart 100.00 EUR 224.67 0.00
51 LBBW US Real Estate Investment LLC 10 Wilmington,
USA 100.00 USD 61,567.19 3,015.38
52 LBBW Venture Capital Gesellschaft mit beschränkter Haftung 21 Stuttgart 100.00 EUR 24,380.09 3,788.86
53 LEG Projektgesellschaft 2 GmbH & Co. KG 1, 21 Stuttgart 100.00 EUR 6,439.87 1,024.90
54 LEG Verwaltungsgesellschaft 2 mbH 1, 21 Stuttgart 100.00 EUR 28.80 0.23
55 LOOP GmbH 1, 21 Stuttgart 100.00 EUR 131.71 – 16.04
56 Löwentor Stuttgart Komplementär GmbH 1, 21 Stuttgart 100.00 EUR 25.62 0.62
57 Löwentor Stuttgart Projekt GmbH & Co. KG 1, 21 Stuttgart 70.00 EUR 4,235.00 – 233.88
58 LRP Capital GmbH 1, 21 Stuttgart 100.00 EUR 3,378.01 79.21
59 Lyoner Quartier GmbH & Co. KG 1, 21 Frankfurt am
Main 100.00 EUR – 171.49 – 172.49
60 MKB Mittelrheinische Bank Gesellschaft mit beschränkter
Haftung 21, 32 Koblenz 100.00 EUR 52,507.11 11,361.41

N
ote
s 2
80
C
on
soli
da
ted
fin
an
cia
l st
ate
me
nts
No. Name Place of
business Share of
capital
Non-prop. voting rights Currency
Equity EUR th.
Result EUR th.
61 MKB Versicherungsdienst GmbH 1, 6, 21 Koblenz 100.00 EUR 27.05 0.00
62 MMV Leasing Gesellschaft mit beschränkter Haftung 1, 6, 21, 32 Koblenz 100.00 EUR 21,000.00 0.00
63 MMV-Mobilien Verwaltungs- und Vermietungsgesellschaft mbH 1, 6, 21, 32 Koblenz 100.00 EUR 26.00 0.00
64 Nagatino Property S.à.r.l. 1, 21 Luxembourg, Luxembourg 100.00 EUR – 27,688.42 – 5.64
65 Nymphenburger Straße München GmbH & Co. KG 1, 21 Stuttgart 100.00 EUR – 78.65 146.31
66 Nymphenburger Straße München Komplementär GmbH 1, 21 Stuttgart 100.00 EUR 21.69 – 1.66
67 Pasing Projekt GmbH & Co. KG 1, 21 Stuttgart 100.00 EUR – 23,993.22 – 4.52
68 Projekt 20 Verwaltungs GmbH 1, 21 Munich 100.00 EUR 40.32 1.24
69 Projektgesellschaft SMK 69 mbH 1, 21 Eschborn 94.90 EUR – 52.61 – 77.61
70 Rheinallee V GmbH & Co. KG 1, 21 Stuttgart 100.00 EUR – 60.24 – 56.84
71 Rheinallee V Komplementär GmbH 1, 21 Stuttgart 100.00 EUR 25.22 0.15
72 Schlossgartenbau Objekt-GmbH 1, 6, 21 Stuttgart 100.00 EUR 18,560.61 0.00
73 Schlossgartenbau-Aktiengesellschaft 1, 6, 21 Stuttgart 92.68 EUR 6,592.42 0.00
74 Schockenriedverwaltungs GmbH 1, 21 Stuttgart 100.00 EUR 27.63 0.35
75 SG Management GmbH 1, 21 Stuttgart 100.00 EUR 13,260.54 307.64
76 SGB – Hotel GmbH & Co. KG 1, 21 Stuttgart 100.00 EUR – 1,565.90 – 95.50
77 Signaris GmbH 1, 21 Stuttgart 94.90 EUR 9,112.72 – 67.65
78 SLN Maschinen-Leasing Verwaltungs-GmbH 1, 21 Stuttgart 100.00 EUR 575.54 386.44
79 SLP Mobilien-Leasing Verwaltungs GmbH 1, 21 Mannheim 100.00 EUR 1,979.41 138.43
80 Süd Beteiligungen GmbH 21 Stuttgart 100.00 EUR 173,371.62 11,026.63
81 Süd KB Sachsen GmbH 1, 21 Stuttgart 100.00 EUR 30,450.12 – 321.83
82 Süd KB Unternehmensbeteiligungsgesellschaft mbH 1, 21 Stuttgart 100.00 EUR 50,772.82 502.35
83 SüdFactoring GmbH 3, 5, 21, 32 Stuttgart 100.00 EUR 70,000.00 0.00
84 Süd-Kapitalbeteiligungs-Gesellschaft mbH 1, 6, 21 Stuttgart 100.00 EUR 61,181.86 0.00
85 SüdLeasing Agrar GmbH 1, 21 Mannheim 100.00 EUR 1,156.38 965.20
86 SüdLeasing GmbH 5, 21, 32 Stuttgart 100.00 EUR 35,520.81 0.00
87 targens GmbH 21 Stuttgart 100.00 EUR 5,108.57 1,739.62
88 Turtle Portfolio GmbH & Co. KG 1, 4, 21, 31 Frankfurt am Main 100.00 EUR 41,819.70 3,542.51
89 Turtle 1. Verwaltungs-GmbH 1, 21, 31 Frankfurt am Main 100.00 EUR 68.35 – 1.26
90 Uhlandstraße 187 GmbH 1, 21 Stuttgart 100.00 EUR 30.52 0.95

N
ote
s 2
81
C
on
soli
da
ted
fin
an
cia
l st
ate
me
nts
No. Name Place of
business Share of
capital
Non prop. voting rights Currency
Equity EUR th.
Result EUR th.
91 Vermietungs- und Verwaltungsgesellschaft Sendlinger
Straße mbH 1, 4, 21 Stuttgart 100.00 EUR – 1.38 – 5.63
92 Vierte Industriehof Objekt-GmbH 1, 6, 21 Stuttgart 100.00 EUR 1,176.78 0.00
93 zob Esslingen Grundbesitz GmbH 1, 21 Stuttgart 100.00 EUR 15.84 – 4.79
94 Zweite IMBW Capital & Consulting Komplementär GmbH 1, 21 Stuttgart 100.00 EUR 20.81 – 0.56
95 Zweite Industriehof Objekt-GmbH 1, 6, 21 Stuttgart 100.00 EUR 19,825.72 0.00
96 Zweite LBBW US Real Estate GmbH 21 Leipzig 100.00 EUR 48,195.85 3,158.37
b. Fully consolidated subsidiaries (authority over contractual agreements)
97 Employrion Immobilien GmbH & Co. KG 1, 18 Weil 35.00 50.00 EUR 8.00 – 158.17
98 Erste IMBW Capital & Consulting Objektgesellschaft mbH & Co. KG 1, 18 Weil 40.00 50.00 EUR – 34.14 0.00
99 FOM / LEG Generalübernehmer GmbH & Co. KG 1, 21 Heidelberg 50.00 EUR – 8,941.54 – 9.37
100 Grundstücksgesellschaft Einkaufszentrum Kröpeliner-Tor-Center Rostock mbH & Co. KG 1, 21 Berlin 39.94 50.00 EUR – 8,329.30 – 95.26
101 PALS Funding 2 LLC 21, 31 Dover, USA USD 0.09 0.00
102 Turtle Vermögensverwaltungs-GmbH & Co. KG 1, 21 Frankfurt am Main 49.00 50.00 EUR – 37,679.68 3,540.99
103 Weinberg Capital Designated Activity Company 21, 31 Dublin, Ireland EUR 87.00 0.00
104 Weinberg Funding Ltd. 21, 31 St. Helier, Jersey, United Kingdom EUR 3.60 0.00
2 Joint ventures accounted for using the equity method
105 ARGE ParkQuartier Berg 1, 21 Stuttgart 50.00 EUR 234.94 238.05
106 Bad Kreuznacher Entwicklungsgesellschaft mbH (BKEG) 1, 21 Bad Kreuznach 50.00 EUR 3,794.12 1,015.84
107 GIZS GmbH & Co. KG 21 Frankfurt am Main 33.33 EUR 14,923.96 – 12,039.23
108 OVG MK6 GmbH & Co. KG 1, 4, 21 Berlin 49.60 50.00 EUR 4,658.75 17,542.49
109 OVG MK6 Komplementär GmbH 1, 21 Berlin 50.00 EUR 25.62 0.61
110 Parcul Banatului SRL 1, 21 Bucharest,
Romania 50.00 RON 159.28 – 1,834.68
111 SGB – Hotel – Verwaltung GmbH 1, 21 Stuttgart 50.00 EUR 35.13 3.92
3 Associates accounted for using the equity method
112 Altstadt-Palais Immobilien GmbH & Co. KG 1, 18 Weil 40.00 50.00 EUR – 253.27 – 104.02
113 BWK GmbH Unternehmensbeteiligungsgesellschaft 21 Stuttgart 40.00 EUR 252,343.47 7,150.61
114 BWK Holding GmbH Unternehmensbeteiligungsgesellschaft 21 Stuttgart 40.00 EUR 9,713.79 845.31
115 EGH Entwicklungsgesellschaft Heidelberg GmbH & Co. KG
1, 21 Heidelberg 33.33 EUR 6,194.04 1,228.02
116 Hypo Vorarlberg Bank AG 1, 21, 32 Bregenz, Austria 23.13 EUR 1,020,433.45 49,726.16
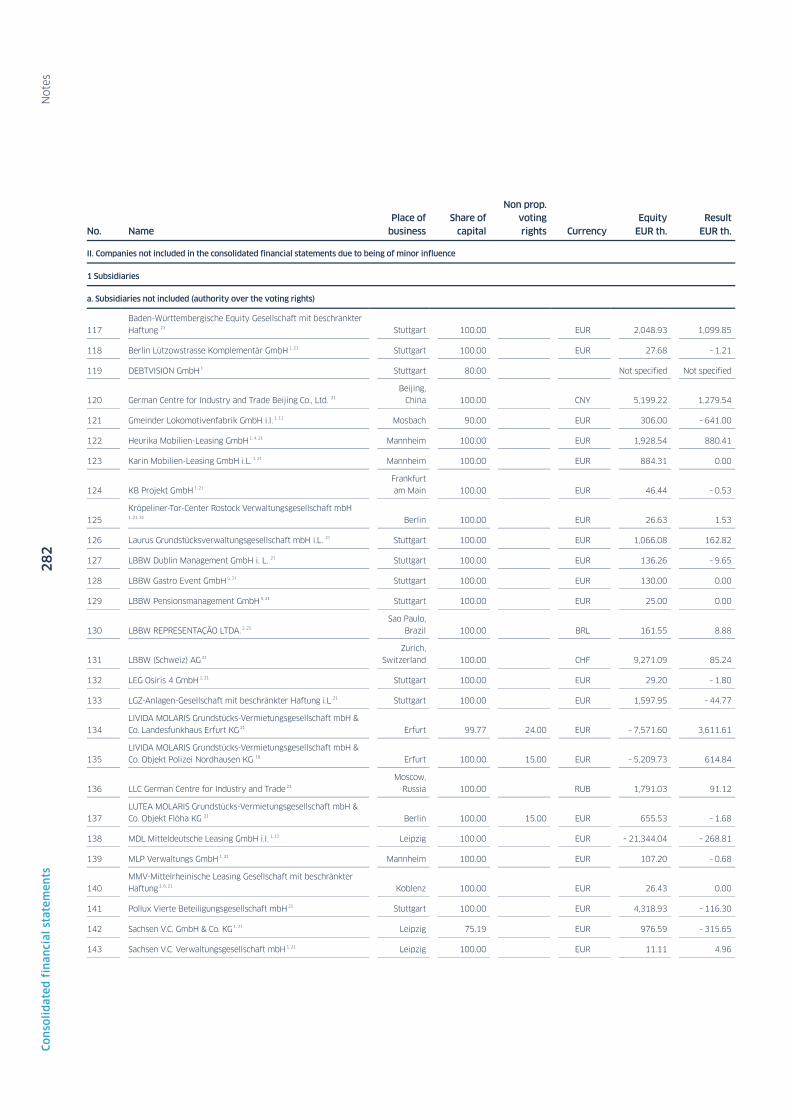
N
ote
s 2
82
C
on
soli
da
ted
fin
an
cia
l st
ate
me
nts
No. Name Place of
business Share of
capital
Non prop. voting rights Currency
Equity EUR th.
Result EUR th.
II. Companies not included in the consolidated financial statements due to being of minor influence
1 Subsidiaries
a. Subsidiaries not included (authority over the voting rights)
117 Baden-Württembergische Equity Gesellschaft mit beschränkter
Haftung 21 Stuttgart 100.00 EUR 2,048.93 1,099.85
118 Berlin Lützowstrasse Komplementär GmbH 1, 21 Stuttgart 100.00 EUR 27.68 – 1.21
119 DEBTVISION GmbH 1 Stuttgart 80.00 Not specified Not specified
120 German Centre for Industry and Trade Beijing Co., Ltd. 21 Beijing,
China 100.00 CNY 5,199.22 1,279.54
121 Gmeinder Lokomotivenfabrik GmbH i.I. 1, 11 Mosbach 90.00 EUR 306.00 – 641.00
122 Heurika Mobilien-Leasing GmbH 1, 4, 21 Mannheim 100.00 EUR 1,928.54 880.41
123 Karin Mobilien-Leasing GmbH i.L. 1, 21 Mannheim 100.00 EUR 884.31 0.00
124 KB Projekt GmbH 1, 21 Frankfurt am Main 100.00 EUR 46.44 – 0.53
125 Kröpeliner-Tor-Center Rostock Verwaltungsgesellschaft mbH 1, 21, 31 Berlin 100.00 EUR 26.63 1.53
126 Laurus Grundstücksverwaltungsgesellschaft mbH i.L. 21 Stuttgart 100.00 EUR 1,066.08 162.82
127 LBBW Dublin Management GmbH i. L. 21 Stuttgart 100.00 EUR 136.26 – 9.65
128 LBBW Gastro Event GmbH 5, 21 Stuttgart 100.00 EUR 130.00 0.00
129 LBBW Pensionsmanagement GmbH 5, 21 Stuttgart 100.00 EUR 25.00 0.00
130 LBBW REPRESENTAÇÃO LTDA. 2, 21 Sao Paulo,
Brazil 100.00 BRL 161.55 8.88
131 LBBW (Schweiz) AG 21 Zurich,
Switzerland 100.00 CHF 9,271.09 85.24
132 LEG Osiris 4 GmbH 1, 21 Stuttgart 100.00 EUR 29.20 – 1.80
133 LGZ-Anlagen-Gesellschaft mit beschränkter Haftung i.L. 21 Stuttgart 100.00 EUR 1,597.95 – 44.77
134 LIVIDA MOLARIS Grundstücks-Vermietungsgesellschaft mbH &
Co. Landesfunkhaus Erfurt KG 21 Erfurt 99.77 24.00 EUR – 7,571.60 3,611.61
135 LIVIDA MOLARIS Grundstücks-Vermietungsgesellschaft mbH &
Co. Objekt Polizei Nordhausen KG 18 Erfurt 100.00 15.00 EUR – 5,209.73 614.84
136 LLC German Centre for Industry and Trade 21, Moscow,
Russia 100.00 RUB 1,791.03 91.12
137 LUTEA MOLARIS Grundstücks-Vermietungsgesellschaft mbH & Co. Objekt Flöha KG 21 Berlin 100.00 15.00 EUR 655.53 – 1.68
138 MDL Mitteldeutsche Leasing GmbH i.I. 1, 13 Leipzig 100.00 EUR – 21,344.04 – 268.81
139 MLP Verwaltungs GmbH 1, 21 Mannheim 100.00 EUR 107.20 – 0.68
140 MMV-Mittelrheinische Leasing Gesellschaft mit beschränkter
Haftung 1, 6, 21 Koblenz 100.00 EUR 26.43 0.00
141 Pollux Vierte Beteiligungsgesellschaft mbH 21 Stuttgart 100.00 EUR 4,318.93 – 116.30
142 Sachsen V.C. GmbH & Co. KG 1, 21 Leipzig 75.19 EUR 976.59 – 315.65
143 Sachsen V.C. Verwaltungsgesellschaft mbH 1, 21 Leipzig 100.00 EUR 11.11 4.96

N
ote
s 2
83
C
on
soli
da
ted
fin
an
cia
l st
ate
me
nts
No. Name Place of
business Share of
capital
Non prop. voting rights Currency
Equity EUR th.
Result EUR th.
144 SachsenFonds International Equity Holding I GmbH 1, 21 Stuttgart 100.00 EUR 1,439.37 132.20
145 SachsenFonds International Equity I GmbH & Co. KG i.L. 1, 21 Leipzig 96.15 EUR 2,263.95 120.74
146 SBF Sächsische Beteiligungsfonds GmbH 1, 21 Leipzig 100.00 EUR 216.16 112.10
147 SDD Holding GmbH i.L. 1, 20 Stuttgart 100.00 EUR – 3,357.73 – 5.09
148 SL Bayern Verwaltungs GmbH 1, 21 Mannheim 100.00 EUR 67.93 4.15
149 SL Bremen Verwaltungs GmbH 1, 21 Mannheim 100.00 EUR 1,988.32 276.97
150 SL BW Verwaltungs GmbH i.L. 1, 21 Mannheim 100.00 EUR 39.64 – 0.08
151 SL Düsseldorf Verwaltungs GmbH 1, 21 Mannheim 100.00 EUR 607.46 3.31
152 SL Financial Services Corporation 21 North Salem,
USA 100.00 USD 92.44 – 110.33
153 SL Mobilien-Leasing GmbH & Co. Hafis KG 1, 21, 31 Mannheim 0.00 51.00 EUR 1,998.75 – 6.32
154 SL Operating Services GmbH i.L. 1, 21 Mannheim 100.00 EUR 80.41 0.00
155 SL RheinMainSaar Verwaltungs GmbH 1, 21 Mannheim 100.00 EUR 509.04 – 1.17
156 SL Schleswig-Holstein Verwaltungs GmbH i.L. 1, 21 Mannheim 100.00 EUR 91.56 0.00
157 SL Ventus GmbH & Co. KG 1, 21 Mannheim 100.00 EUR 502.30 5.39
158 Städtische Pfandleihanstalt Stuttgart Aktiengesellschaft 21 Stuttgart 100.00 EUR 3,900.45 321.65
159 Süd Mobilien-Leasing GmbH 1, 21 Stuttgart 100.00 EUR 28.28 0.00
160 Süd Verwaltung Schweiz GmbH 21 Zurich,
Switzerland 100.00 CHF 51.05 6.50
161 SüdLeasing Finance-Holding GmbH i.L. 1, 21 Stuttgart 100.00 EUR 174.58 – 0.43
162 Yankee Properties II LLC 31 Wilmington,
USA 0.00 100.00 Not specified Not specified
163 Yankee Properties LLC 16 New York,
USA 100.00 USD 567.20 – 23.02
164 Zenon Mobilien-Leasing GmbH i.L. 1, 21 Mannheim 100.00 EUR 35.32 1.92
165 Zorilla Mobilien-Leasing GmbH i.L. 1, 21 Mannheim 100.00 EUR 33.79 8.40
166 Zweite Karl-Scharnagl-Ring Immobilien Verwaltung GmbH
1, 18 Munich 100.00 EUR 39.65 1.78
b. Subsidiaries not included (authority over contractual agreements)
167 Germany Diversified Core+ 31 Stuttgart 0.00 Not specified Not specified
168 Humboldt Multi Invest B SICAV-FIS Sachsen LB Depot A i.L. 14 Luxembourg, Luxembourg 100.00 EUR 5,897.89 – 248.71
169 LBBW Global Equity 19, 31 Stuttgart EUR 13,127.37 272.26
170 LBBW Multi Global Plus 31 Stuttgart Not specified Not specified
171 Platino S.A. i.L. 25, 31 Luxembourg,
Luxembourg EUR 1.67 1.24
172 SSKM Invest 31 Stuttgart Not specified Not specified
173 Weinberg Capital LLC 31 Wilmington,
USA Not specified Not specified

N
ote
s 2
84
C
on
soli
da
ted
fin
an
cia
l st
ate
me
nts
No. Name Place of
business Share of
capital
Non prop.
voting rights Currency
Equity EUR th.
Result EUR th.
2 Joint ventures not accounted for using the equity method
174 addfinity testa GmbH 1, 18 Hartha 49.85 EUR 3,302.60 539.73
175 EPSa Holding GmbH 1, 21 Saalfeld 45.00 EUR 2,844.92 2,205.13
176 German Centre for Industry and Trade India Holding-GmbH 1, 21 Munich 50.00 EUR 919.89 – 1,300.19
177 GIZS Verwaltungs-GmbH 21,
Frankfurt am
Main 33.33 EUR 17.53 7.42
178 LBBW Immobilien Verwaltung GmbH 1, 21 Stuttgart 50.00 EUR 59.46 1.12
179 SEALINK FUNDING DESIGNATED ACTIVITY COMPANY 18, 31 Dublin, Ireland EUR – 248,201.00 145,460.00
180 SHS Gesellschaft für Beteiligungen mbH & Co. Mittelstand KG 1, 21 Tübingen 75.02 EUR 3,728.67 – 85.49
3 Associates not accounted for using the equity method
181 AGVS Holding GmbH 1, 21
Villingen-
Schwenningen 45.00 EUR 15,705.09 3,364.62
182 aiP Isarauen Verwaltungs GmbH i. L. 1, 21 Oberhaching 45.00 EUR 18.49 – 11.80
183 Cäcilienpark am Neckar GbR 1, 21 Heilbronn 33.33 EUR 324.00 24.00
184 Deharde GmbH 1, 21 Varel 39.47 EUR 9,660.63 594.10
185 DUO PLAST Holding GmbH 1, 21 Lauterbach 49.18 EUR 20,131.80 3,209.36
186 EURAMCO Immobilien GmbH 1, 21
Aschheim-
Dornach 49.00 EUR 28.85 – 29.97
187 FABMATICS Holding GmbH 1, 21 Dresden 50.00 EUR 5,737.70 407.36
188
Grundstücks-, Vermögens- und Verwaltungs- GbR 34, Wolfstor 2,
Esslingen i.L. 1, 16 Stuttgart 30.39 EUR 9,348.49 405.61
189
Grundstücks-, Vermögens- und Verwaltungs- GbR 36,
Stuttgart/Leinfelden-Echterdingen 1, 21 Stuttgart 28.11 EUR 29,175.17 – 217.73
190
Grundstücks-, Vermögens- und Verwaltungs- GbR 39, Stuttgart-
Fellbach i.L. 1, 16 Stuttgart 42.03 EUR 25,472.67 – 604.44
191
Grundstücks-, Vermögens- und Verwaltungs-GbR 40, Ludwigsburg
»Am Schloßpark» i.L. 1, 16 Stuttgart 44.59 EUR 24,564.47 160.25
192 INULA Grundstücks-Verwaltungsgesellschaft mbH & Co. KG i.L. 21, 33 Grünwald 80.00 18.25 EUR 25.56 19,315.87
193 Janoschka AG 1, 21 Kippenheim 39.80 EUR 19,156.90 6.98
194 Kiesel Finance GmbH & Co. KG 1, 21, 31 Baienfurt 0.00 75.00 EUR 166.79 131.79
195 KKL Holding GmbH 1 Dusseldorf 48.27 47.20 Not specified Not specified
196
Kreditgarantiegemeinschaft in Baden-Württemberg Verwaltungs-
GmbH 21 Stuttgart 20.00 EUR 1,022.58 0.00
197 M Cap Finance Deutsche Mezzanine Fonds Zweite GmbH & Co. KG i. L. 1, 21 Leipzig 49.75 EUR 1,205.92 764.32
198 Mittelständische Beteiligungsgesellschaft Sachsen mbH 21 Dresden 25.27 EUR 46,694.14 1,965.20
199
MOLWANKUM Vermietungsgesellschaft mbH & Co. Objekt
Landkreis Hildburghausen KG 21 Dusseldorf 94.00 49.00 EUR – 1,582.79 452.29
200 Ritterwand Metall-Systembau Beteiligungs GmbH 1, 21 Nufringen 49.97 EUR 9,833.37 603.99
201 Siedlungswerk GmbH Wohnungs- und Städtebau 21, 32 Stuttgart 25.00 EUR 243,494.09 24,521.53
202 SL Mobilien-Leasing GmbH & Co. ENERCON KG 1, 21, 31 Mannheim 0.00 80.00 EUR 35,878.29 2,678.02
203 SLN Maschinen Leasing GmbH & Co. OHG 1, 21, 31 Stuttgart 0.00 75.00 EUR – 1,769.92 – 358.01
204 SLP Mobilien-Leasing GmbH & Co. OHG 1, 21, 31 Mannheim 0.00 75.00 EUR 612.28 265.24
205 Stollmann Entwicklungs- und Vertriebs GmbH i.L. 1, 21 Schenefeld 34.00 EUR 1,075.61 – 38.52
206 Xavin GmbH 1 Stuttgart 24.50 Not specified Not specified
207 1. yourTime Solutions AbwicklungsGmbH 1, 13 Potsdam 20.11 EUR – 478.00 – 1,317.00
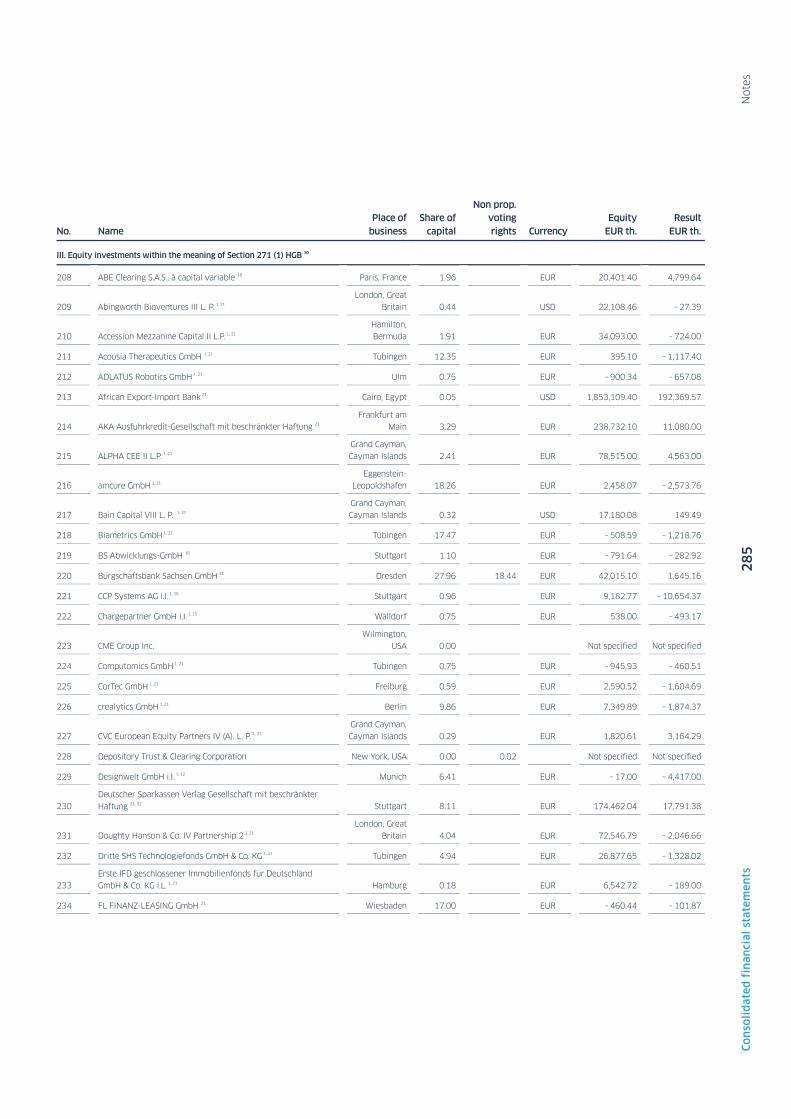
N
ote
s 2
85
C
on
soli
da
ted
fin
an
cia
l st
ate
me
nts
No. Name Place of
business Share of
capital
Non prop. voting rights Currency
Equity EUR th.
Result EUR th.
III. Equity investments within the meaning of Section 271 (1) HGB 30
208 ABE Clearing S.A.S., à capital variable 18 Paris, France 1.96 EUR 20,401.40 4,799.64
209 Abingworth Bioventures III L. P. 1, 21 London, Great
Britain 0.44 USD 22,108.46 – 27.39
210 Accession Mezzanine Capital II L.P. 1, 21 Hamilton, Bermuda 1.91 EUR 34,093.00 – 724.00
211 Acousia Therapeutics GmbH 1, 21 Tübingen 12.35 EUR 395.10 – 1,117.40
212 ADLATUS Robotics GmbH 1, 21 Ulm 0.75 EUR – 900.34 – 657.08
213 African Export-Import Bank 21 Cairo, Egypt 0.05 USD 1,853,109.40 192,369.57
214 AKA Ausfuhrkredit-Gesellschaft mit beschränkter Haftung 21 Frankfurt am
Main 3.29 EUR 238,732.10 11,080.00
215 ALPHA CEE II L.P. 1, 21 Grand Cayman, Cayman Islands 2.41 EUR 78,515.00 4,563.00
216 amcure GmbH 1, 21 Eggenstein-
Leopoldshafen 18.26 EUR 2,458.07 – 2,573.76
217 Bain Capital VIII L. P. 1, 21 Grand Cayman, Cayman Islands 0.32 USD 17,180.08 149.49
218 Biametrics GmbH 1, 21 Tübingen 17.47 EUR – 508.59 – 1,218.76
219 BS Abwicklungs-GmbH 16 Stuttgart 1.10 EUR – 791.64 – 282.92
220 Bürgschaftsbank Sachsen GmbH 21 Dresden 27.96 18.44 EUR 42,015.10 1,645.16
221 CCP Systems AG i.I. 1, 15 Stuttgart 0.96 EUR 9,182.77 – 10,654.37
222 Chargepartner GmbH i.I. 1, 15 Walldorf 0.75 EUR 538.00 – 493.17
223 CME Group Inc. Wilmington,
USA 0.00 Not specified Not specified
224 Computomics GmbH 1, 21 Tübingen 0.75 EUR – 945.93 – 460.51
225 CorTec GmbH 1, 21 Freiburg 0.59 EUR 2,590.52 – 1,604.69
226 crealytics GmbH 1, 21 Berlin 9.86 EUR 7,349.89 – 1,874.37
227 CVC European Equity Partners IV (A). L. P. 1, 21 Grand Cayman, Cayman Islands 0.29 EUR 1,820.61 3,164.29
228 Depository Trust & Clearing Corporation New York, USA 0.00 0.02 Not specified Not specified
229 Designwelt GmbH i.I. 1, 12 Munich 6.41 EUR – 17.00 – 4,417.00
230 Deutscher Sparkassen Verlag Gesellschaft mit beschränkter
Haftung 21, 32 Stuttgart 8.11 EUR 174,462.04 17,791.38
231 Doughty Hanson & Co. IV Partnership 2 1, 21 London, Great
Britain 4.04 EUR 72,546.79 – 2,046.66
232 Dritte SHS Technologiefonds GmbH & Co. KG 1, 21 Tübingen 4.94 EUR 26,877.65 – 1,328.02
233 Erste IFD geschlossener Immobilienfonds für Deutschland GmbH & Co. KG i.L. 1, 21 Hamburg 0.18 EUR 6,542.72 – 189.00
234 FL FINANZ-LEASING GmbH 21 Wiesbaden 17.00 EUR – 460.44 – 101.87

N
ote
s 2
86
C
on
soli
da
ted
fin
an
cia
l st
ate
me
nts
No. Name Place of
business Share of
capital
Non prop. voting rights Currency
Equity EUR th.
Result EUR th.
235 Fludicon GmbH i.I. 1, 15 Darmstadt 7.88 EUR 516.90 – 2,184.41
236 GbR VÖB-ImmobilienAnalyse 26 Bonn 25.00 20.00 Not specified Not specified
237 GLB GmbH & Co. OHG 21, 27 Frankfurt am Main 30.05 EUR 5,658.17 453.35
238 GLB-Verwaltungs-GmbH 21, 27 Frankfurt am Main 30.00 EUR 53.71 1.96
239 Grundstücks-, Vermögens- und Verwaltungs- GbR 35, Sillenbucher Markt i.L. 1, 16 Stuttgart 0.02 EUR 45,833.47 408.40
240 Grundstücks-, Vermögens- und Verwaltungs- GbR 31,
Esslingen/ Stuttgart i.L. 1, 16 Stuttgart 13.18 EUR 503.46 28.96
241 Grundstücks-Vermögens- und Verwaltungs- GbR Nr. 32,
Leonberg/ Ditzingen i.L. 1, 13 Stuttgart 0.37 EUR 34,995.90 – 951.56
242 Grundstücks-Vermögens- und Verwaltungs-GbR Nr. 27, Stuttgart-Mitte II i.L. 1, 16 Stuttgart 0.13 EUR 8,467.53 45.06
243 Grundstücksverwaltungsgesellschaft Sonnenberg mbH & Co. Betriebs-KG i.I. 1 Wiesbaden 5.52 Not specified Not specified
244 HANSA TREUHAND Dritter Beteiligungsfonds GmbH & Co. KG
1, 21 Hamburg 0.03 EUR 23,875.57 2,920.32
245 HANSA TREUHAND Zweiter Beteiligungsfonds GmbH & Co. KG i.I. 1, 18 Hamburg 0.16 EUR – 9,582.96 – 129.00
246 Heidelberg Innovation BioScience Venture II GmbH & Co. KG
i.L. 1, 21 Leimen 3.83 EUR 5,020.48 3,722.22
247 HGA Mitteleuropa V GmbH & Co. KG 1, 16 Hamburg 0.05 EUR 1,923.39 – 547.69
248 HSBC Trinkaus & Burkhardt AG 21, 32 Dusseldorf 18.66 EUR 1,889,315.35 116,520.13
249 Humboldt Multi Invest B S.C.A., SICAV-FIS i.L. 1, 14, 28 Luxembourg, Luxembourg 99.93 EUR 6,928.35 – 165.43
250 Icon Brickell LLC 1, Miami, USA 13.35 Not specified Not specified
251 ImmerSight GmbH 1, 21 Ulm 0.85 EUR – 177.08 – 280.13
252 KanAm USA XXII Limited Partnership 1, 21 Atlanta, USA 0.04 USD 38,239.25 – 58.04
253 Kreditgarantiegemeinschaft der Freien Berufe Baden-
Württemberg Verwaltungs-GmbH 21 Stuttgart 4.76 EUR 153.39 0.00
254
Kreditgarantiegemeinschaft der Industrie, des
Verkehrsgewerbes und des Gastgewerbes Baden-Württemberg Verwaltungs-GmbH 21 Stuttgart 15.28 EUR 1,299.87 0.00
255 Kreditgarantiegemeinschaft des Gartenbaus Baden-Württemberg Verwaltungs-GmbH 21 Stuttgart 4.50 EUR 138.31 0.00
256 Kreditgarantiegemeinschaft des Handels Baden-Württemberg Verwaltungs-GmbH 21 Stuttgart 9.14 EUR 1,021.91 0.00
257 Kreditgarantiegemeinschaft des Handwerks Baden-Württemberg Verwaltungs-GmbH 21 Stuttgart 9.76 EUR 1,001.05 0.00
258 Kunststiftung Baden-Württemberg gGmbH 21 Stuttgart 2.00 0.61 EUR 10,461.97 7,562.60
259 Maehler & Kaege AG i. I. 1, 7 Ingelheim 7.50 9.26 EUR – 2,041.59 67.06
260 MAT Movies & Television Productions GmbH & Co. Project IV i.L. 1, 21 Grünwald 0.22 EUR 530.25 – 13.32
261 MBG Mittelständische Beteiligungsgesellschaft Baden-Württemberg Gesellschaft mit beschränkter Haftung 21 Stuttgart 9.94 EUR 72,488.13 5,540.22
262 NAVALIA 11 MS »PORT MENIER» GmbH & Co. KG 1, 16 Bramstedt 0.15 EUR 590.33 – 40.72
263 NESTOR Grundstücks-Vermietungsgesellschaft mbH & Co. Objekt Villingen-Schwenningen KG 18, 33 Dusseldorf 5.00 EUR – 2,575.31 416.20

N
ote
s 2
87
C
on
soli
da
ted
fin
an
cia
l st
ate
me
nts
No. Name Place of
business Share of capital
Non prop. voting rights Currency
Equity EUR th.
Result EUR th.
264 Notion Systems GmbH 1, 21 Schwetzinge
n 0.75 EUR 521.10 – 987.71
265 Novoplant Gesellschaft mit beschränkter Haftung 1, 8 Gatersleben 18.77 EUR – 5,574.00 – 1,853.00
266 Otego GmbH i.I. 1, 21 Karlsruhe 6.25 EUR 375.85 – 151.80
267 OXID eSales AG 1, 21 Freiburg 19.92 EUR 888.48 700.00
268 PARAMOUNT GROUP, INC. 1, 21 Baltimore,
USA 0.50 USD 4,381,507.59 75,362.94
269 Paramount Group Operating Partnership LP 1 Wilmington,
USA 2.46 0.00 Not specified Not specified
270 Phenex Pharmaceuticals AG 1, 21 Ludwigshafe
n 8.90 EUR 20,298.35 17,875.78
271 Poldergesellschaft Neumühlen-Westkai mbH 1 Hamburg 16.67 EUR 106.96 Not specified
272 PolyAn Gesellschaft zur Herstellung von Polymeren für spezielle Anwendungen und Analytik mbH 1, 21 Berlin 9.93 EUR – 5.46 – 24.47
273 PressMatrix GmbH 1, 21 Berlin 14.08 EUR – 970.62 – 188.16
274 Probiodrug AG 1, 21 Halle/Saale 2.38 EUR 9,246.00 – 7,729.00
275 Reha-Klinik Aukammtal GmbH & Co. Betriebs-KG i.I. 1 Wiesbaden 5.54 Not specified Not specified
276 RSU Rating Service Unit GmbH & Co. KG 21 Munich 18.80 EUR 14,030.22 909.36
277 RW Holding AG i.L. 22 Dusseldorf 1.36 EUR 459,635.10 68,109.36
278 RWSO Grundstücksgesellschaft TBS der Württembergischen Sparkassenorganisation GbR 21 Stuttgart 10.00 8.87 EUR 6,101.93 160.93
279 S CountryDesk GmbH 21 Cologne 2.50 EUR 448.83 44.01
280 Schiffahrts-Gesellschaft »HS ALCINA» / »HS ONORE» / »HS OCEANO» mbH & Co. KG 1, 21 Hamburg 0.04 EUR 20,838.43 2,503.58
281 Schiffahrts-Gesellschaft »HS MEDEA» mbH & Co. KG i.L. 1, 21 Hamburg 0.16 EUR 15,202.91 1,249.09
282 SE.M.LABS GmbH i.I. 1, 18 Stuttgart 0.75 EUR – 143.25 – 221.00
283 Sensitu GmbH 1, 21 Bendorf 14.29 EUR 344.14 – 83.68
284 SI-BW Beteiligungsgesellschaft mbH & Co KG 21 Stuttgart 4.00 3.96 EUR 43,756.63 1,209.93
285 SimuForm GmbH i.I. 1, 13 Dortmund 6.84 EUR 235.00 – 300.00
286 Society for Worldwide Interbank Financial Telecommunication (S.W.I.F.T.) 21
La Hulpe, Belgium 0.14 EUR 394,698.39 81,079.47
287 stimOS GmbH 1, 21 Konstanz 0.75 EUR – 132.04 – 159.57
288 Synapticon GmbH 1, 21 Schönaich 0.77 EUR 1,244.40 – 3,046.63
289 tado GmbH 1, 21 Munich 1.59 EUR 10,899.42 – 32,941.34
290 Technologiegründerfonds Sachsen Plus GmbH & Co. KG 1, 21 Leipzig 8.48 EUR 7,242.57 – 1,652.76
291 Technologiegründerfonds Sachsen Seed GmbH & Co. KG 1, 21 Leipzig 3.34 EUR 5,222.64 20.19
292 Technologiegründerfonds Sachsen Start up GmbH & Co. KG 1, 21 Leipzig 10.83 EUR 16,081.84 – 1,806.05
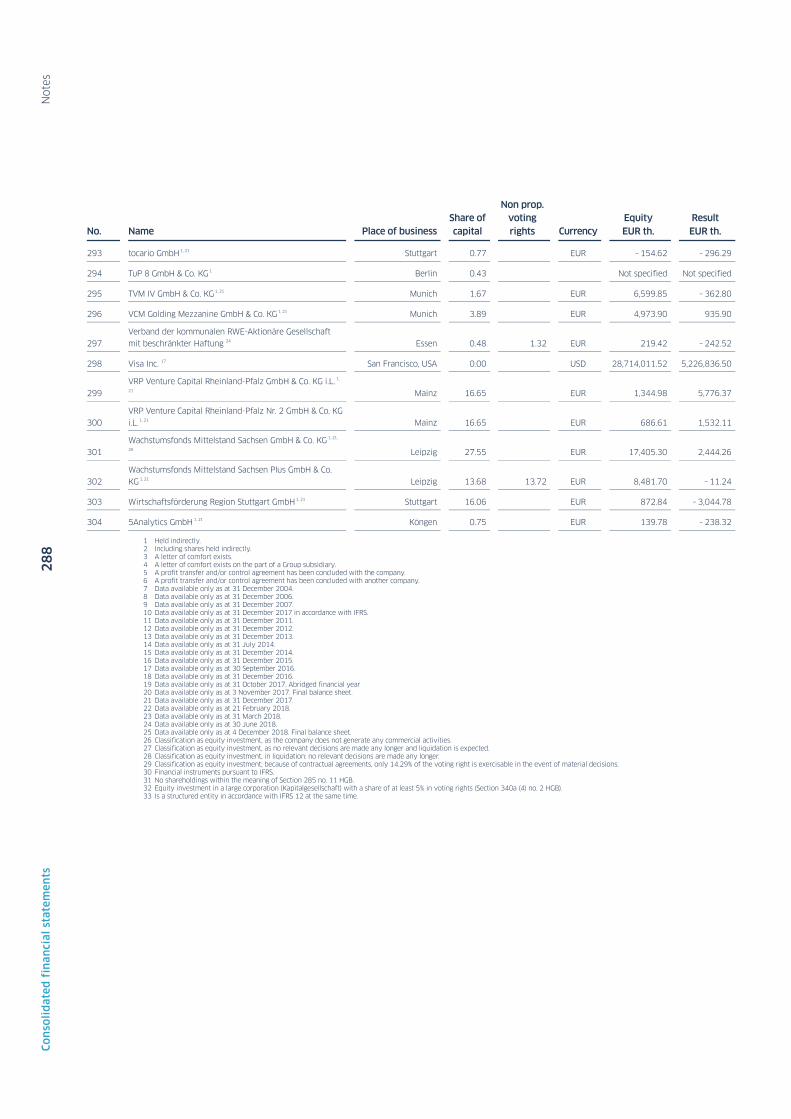
N
ote
s 2
88
C
on
soli
da
ted
fin
an
cia
l st
ate
me
nts
No. Name Place of business Share of capital
Non prop. voting rights Currency
Equity EUR th.
Result EUR th.
293 tocario GmbH 1, 21 Stuttgart 0.77 EUR – 154.62 – 296.29
294 TuP 8 GmbH & Co. KG 1 Berlin 0.43 Not specified Not specified
295 TVM IV GmbH & Co. KG 1, 21 Munich 1.67 EUR 6,599.85 – 362.80
296 VCM Golding Mezzanine GmbH & Co. KG 1, 21 Munich 3.89 EUR 4,973.90 935.90
297 Verband der kommunalen RWE-Aktionäre Gesellschaft mit beschränkter Haftung 24 Essen 0.48 1.32 EUR 219.42 – 242.52
298 Visa Inc. 17 San Francisco, USA 0.00 USD 28,714,011.52 5,226,836.50
299 VRP Venture Capital Rheinland-Pfalz GmbH & Co. KG i.L. 1,
21 Mainz 16.65 EUR 1,344.98 5,776.37
300 VRP Venture Capital Rheinland-Pfalz Nr. 2 GmbH & Co. KG i.L. 1, 21 Mainz 16.65 EUR 686.61 1,532.11
301 Wachstumsfonds Mittelstand Sachsen GmbH & Co. KG 1, 21,
29 Leipzig 27.55 EUR 17,405.30 2,444.26
302 Wachstumsfonds Mittelstand Sachsen Plus GmbH & Co. KG 1, 21 Leipzig 13.68 13.72 EUR 8,481.70 – 11.24
303 Wirtschaftsförderung Region Stuttgart GmbH 1, 21 Stuttgart 16.06 EUR 872.84 – 3,044.78
304 5Analytics GmbH 1, 21 Köngen 0.75 EUR 139.78 – 238.32
1 Held indirectly. 2 Including shares held indirectly. 3 A letter of comfort exists. 4 A letter of comfort exists on the part of a Group subsidiary. 5 A profit transfer and/or control agreement has been concluded with the company. 6 A profit transfer and/or control agreement has been concluded with another company. 7 Data available only as at 31 December 2004. 8 Data available only as at 31 December 2006. 9 Data available only as at 31 December 2007. 10 Data available only as at 31 December 2017 in accordance with IFRS. 11 Data available only as at 31 December 2011. 12 Data available only as at 31 December 2012. 13 Data available only as at 31 December 2013. 14 Data available only as at 31 July 2014. 15 Data available only as at 31 December 2014. 16 Data available only as at 31 December 2015. 17 Data available only as at 30 September 2016. 18 Data available only as at 31 December 2016. 19 Data available only as at 31 October 2017. Abridged financial year 20 Data available only as at 3 November 2017. Final balance sheet. 21 Data available only as at 31 December 2017. 22 Data available only as at 21 February 2018. 23 Data available only as at 31 March 2018. 24 Data available only as at 30 June 2018. 25 Data available only as at 4 December 2018. Final balance sheet. 26 Classification as equity investment, as the company does not generate any commercial activities. 27 Classification as equity investment, as no relevant decisions are made any longer and liquidation is expected. 28 Classification as equity investment, in liquidation: no relevant decisions are made any longer. 29 Classification as equity investment; because of contractual agreements, only 14.29% of the voting right is exercisable in the event of material decisions. 30 Financial instruments pursuant to IFRS. 31 No shareholdings within the meaning of Section 285 no. 11 HGB. 32 Equity investment in a large corporation (Kapitalgesellschaft) with a share of at least 5% in voting rights (Section 340a (4) no. 2 HGB). 33 Is a structured entity in accordance with IFRS 12 at the same time.

N
ote
s 2
89
C
on
soli
da
ted
fin
an
cia
l st
ate
me
nts
66. Employees On average, the number of employees (heads) is as follows:
2018 2017
Male Female Total Male Female Total
Full-time 4,553 2,736 7,289 4,641 2,861 7,503
Part-time 253 2,559 2,812 336 2,630 2,967
Trainees1 179 90 270 192 111 303
Total 4,985 5,385 10,370 5,169 5,603 10,772
1 Including students at universities of cooperative education.

N
ote
s 2
90
C
on
soli
da
ted
fin
an
cia
l st
ate
me
nts
67. Executive and supervisory bodies and positions held
Members of the Board of Managing Directors and supervisory bodies
Board of Managing Directors
Chairman
RAINER NESKE
Deputy Chairman
MICHAEL HORN
Members
KARL MANFRED LOCHNER
DR. CHRISTIAN RICKEN
THORSTEN SCHÖNENBERGER
VOLKER WIRTH
Supervisory Board
Chairman
CHRISTIAN BRAND
Former chairman of the Board of Management of L-Bank
Deputy Chairperson
EDITH SITZMANN MDL
Minister of Finance and Economics of the State of Baden-Wurttemberg
Members
WOLFGANG DIETZ
Lord Mayor of the town of Weil am Rhein
UTA-MICAELA DÜRIG
Managing Director of Robert Bosch Stiftung GmbH
WALTER FRÖSCHLE
Employee Representative of Landesbank Baden-Württemberg
HELMUT HIMMELSBACH
Lord Mayor (retired)
CHRISTIAN HIRSCH
Employee Representative of Landesbank Baden-Württemberg
MARC-OLIVER KIEFER
since 1 February 2019 Employee Representative of Landesbank Baden-Württemberg
BETTINA KIES-HARTMANN
Employee Representative of Landesbank Baden-Württemberg
FRITZ KUHN
Lord Mayor of the State Capital Stuttgart
SABINE LEHMANN
Employee Representative of Landesbank Baden-Württemberg
KLAUS-PETER MURAWSKI
State Secretary (retired)
DR. FRITZ OESTERLE
Attorney at law
MARTIN PETERS
Managing Partner of the Eberspächer group of companies
CHRISTIAN ROGG
Employee Representative of Landesbank Baden-Württemberg
CLAUS SCHMIEDEL
CEO of Critalog GmbH
B. JUTTA SCHNEIDER
Executive Vice President Global Services Delivery, SAP SE & Co. KG
PETER SCHNEIDER
President of the Sparkassen-verband Baden-Württemberg (Savings Bank Association of Baden-Württemberg)
DR. JUTTA STUIBLE-TREDER
Managing Partner of Evers-heimStuible Treuberater GmbH
DR. BRIGITTE THAMM
until 31 January 2019 Employee Representative of Landesbank Baden-Württemberg
BURKHARD WITTMACHER
Chairman of the Board of Managing Directors of Kreissparkasse Esslingen-Nürtingen
NORBERT ZIPF
Employee Representative of Landesbank Baden-Württemberg

N
ote
s 2
91
C
on
soli
da
ted
fin
an
cia
l st
ate
me
nts
The remuneration of and defined benefit pension commitments to members of the committees are broken down as follows:
Board of Managing Directors Supervisory Board
EUR million 2018 2017 2018 2017
Remuneration
Salaries, remuneration and short-term benefits1 6.4 6.6 0.0 1.0
Post-employment benefits (total obligations from defined benefit obligations) 2 18.1 20.8 0.0 0.0
Remuneration for former members and their dependents
Salaries, remuneration and short-term benefits 13.3 11.2 0.0 0.0
Post-employment benefits (total obligations from defined benefit obligations) 2 161.9 147.8 0.0 0.0
1 Including attendance allowance. 2 Provisions for pensions including assistance provisions
As at 31 December 2018, loans granted to and contingent liabilities assumed in favor of members of the Board of Managing Directors and members of the Supervisory Board came to EUR 3 million (previous year: EUR 3 million) of which EUR 2 million (previous year: EUR 1 million) were accounted for by members of the Board of Managing Directors and EUR 1 million (previous year: EUR 2 million) by members of the Supervisory Board.
The loans were extended with an interest rate of between 1.25% and 9.89% and have a remaining term extending from a few months to 39 years. The banking transaction were concluded with all of the cited persons at arm's length terms and collateral requirements.
As in the previous year, no advances were made in the 2018 financial year.

N
ote
s 2
92
C
on
soli
da
ted
fin
an
cia
l st
ate
me
nts
Positions held Offices held by legal representatives of LBBW and members of the AidA1; Board of Managing Directors on statutory supervisory boards and similar supervisory bodies of large companies and banks, as well as offices held by employees of LBBW on statutory supervisory boards of large companies and banks are listed below:
Company Position Incumbent
Boerse Stuttgart GmbH, Stuttgart Deputy Chairman of the Supervisory Board
Dr. Christian Ricken
BS PAYONE GmbH, Frankfurt Supervisory Board Helmut Dohmen
(until 31 Dec. 2018)
Deutscher Sparkassenverlag GmbH, Stuttgart Supervisory Board Michael Horn
EUREX Clearing Aktiengesellschaft, Frankfurt am Main Supervisory Board Dr. Thilo Roßberg (from 27 June 2018)
Euwax AG, Stuttgart Deputy Chairman of the Supervisory Board
Dr. Christian Ricken
Grieshaber Logistik GmbH, Weingarten Supervisory Board Michael Horn
Hypo Vorarlberg Bank AG, Bregenz Supervisory Board Michael Horn
LBBW Asset Management Investmentgesellschaft mbH, Stuttgart Chairman of the Supervisory Board Dr. Christian Ricken
Supervisory Board Frank Hagenstein (until 13 April 2018)
Supervisory Board Michael Nagel
Supervisory Board Thomas Rosenfeld
(from 1 Aug. 2018)
LBBW (Schweiz; AG, Zurich) Chairman of the Board of Directors Michael Horn
(until 30 Sept. 2018)
Mainzer Stadtwerke AG, Mainz Supervisory Board Hannsgeorg Schönig
MKB Mittelrheinische Bank GmbH, Koblenz Chairman of the Supervisory Board Karl Manfred Lochner
Deputy Chairman of the Supervisory Board
Volker Wirth
Supervisory Board Peter Hähner
MMV Leasing GmbH, Koblenz Chairman of the Advisory Board Karl Manfred Lochner
Deputy Chairman of the Advisory
Board
Volker Wirth
Advisory Board Peter Hähner
Siedlungswerk GmbH Wohnungs- und Städtebau, Stuttgart Deputy Chairman of the Supervisory Board
Michael Horn
Supervisory Board Thorsten Schönenberger
Supervisory Board Thomas Christian Schulz
SüdFactoring GmbH, Stuttgart Chairman of the Supervisory Board Karl Manfred Lochner
Deputy Chairman of the Supervisory
Board
Volker Wirth
Supervisory Board Norwin Graf Leutrum von Ertingen
SüdLeasing GmbH, Stuttgart Chairman of the Supervisory Board Karl Manfred Lochner
Deputy Chairman of the Supervisory Board
Volker Wirth
Supervisory Board Norwin Graf Leutrum von Ertingen
VPV Lebensversicherungs-Aktiengesellschaft, Stuttgart Supervisory Board Claudia Diem
1; »institution within the institution«.

Further Information

R
esponsi
bilit
y s
tate
men
t 2
94
F
urt
he
r in
form
ati
on
To the best of our knowledge, and in accordance with the applicable financial reporting framework, the consolidated financial statements give a true and fair view of the net assets, financial position and results of operations of the Group, and the combined management report gives a true and fair view of the development and performance of the business and the position of the Group, together with a description of the principal opportunities and risks associated with the expected future development of the group.
Stuttgart, Karlsruhe, Mannheim and Mainz, 28 February 2019
The Board of Managing Directors
RAINER NESKE
Chairman
MICHAEL HORN
Deputy Chairman
KARL MANFRED LOCHNER
DR. CHRISTIAN RICKEN
THORSTEN SCHÖNENBERGER
VOLKER WIRTH
Responsibility statement

In
dep
enden
t A
udit
or’
s re
port
2
95
F
urt
he
r in
form
ati
on
To Landesbank Baden-Württemberg, Stuttgart, Karlsruhe, Mannheim and Mainz
Report on the audit of the consolidated financial statements and the combined management report
Audit opinion We have audited the consolidated financial statements prepared by Landesbank Baden-Württemberg, Stuttgart, Karlsruhe, Mannheim and Mainz, and its subsidiaries (the Group) comprising the income statement as at 31 December 2018, total comprehensive income, statement of changes in equity and cash flow statement for the financial year from 1 January 2018 to 31 December 2018 as well as the Notes, including a summary of significant accounting methods. Furthermore, we audited the combined management report of Landesbank Baden-Württemberg, Stuttgart, Karlsruhe, Mannheim and Mainz for the financial year from 1 January 2018 to 31 December 2018. In accordance with German statutory regulations, we have not audited the contents of the combined non-financial statement included in the combined management report.
According to our assessment on the basis of the knowledge acquired in the course of the audit,
∙ the accompanying consolidated financial statements comply in all material respects with the IFRS applicable within the EU and the additional requirements of German commercial law pursuant to Section 315e (1) of the German Commercial Code (HGB) and give a true and fair view of the net assets and financial position of the Group as at 31 December 2018 and its results of operations for the financial year from 1 January 2018 to 31 December 2018 in accordance with these requirements and
∙ the accompanying combined management report accurately represents the Group's position. The combined management report is consistent in all material respects with the consolidated financial statements and in accordance with German statutory provisions, and accurately presents the opportunities and risks of future development. Our audit opinion on the combined management report does not refer to the contents of the abovementioned combined non-financial statement.
In accordance with Section 322 (3) sentence 1 HGB we state that our audit has not led to any objections to the correctness of the consolidated financial statements and the combined management report.
Basis for our audit opinion We conducted our audit of the consolidated financial statements and the combined management report in accordance with Section 317 HGB and the EU Audit Regulation (No. 537/2014) as well as the German generally accepted standards for the audit of financial statements promulgated by the German Institute of Public Auditors (IDW). Our responsibility in accordance with these provisions and principles is described in more detail in the section »Responsibility of the statutory auditor for the audit of the consolidated financial statements and the combined management report« of our auditor's report. We are independent from the Group companies in accordance with the provisions of European law and German commercial and professional law, and we have also met our other German professional obligations in accordance with these requirements. We furthermore state in accordance with Article 10 (2) (f) of the EU Audit Regulation that we have not provided any prohibited non-audit services as defined in Article 5 (1) of the EU Audit Regulation. We believe that the audit evidence we obtained is sufficient and appropriate to provide a basis for our audit opinion on the consolidated financial statements and the combined management report.
Independent Auditor’s report

In
dep
enden
t A
udit
or’
s re
port
2
96
F
urt
he
r in
form
ati
on
Key audit matters in the audit of the consolidated financial statements Key audit matters are such audit matters that, after due consideration, are the most significant for the audit of the consolidated financial statements for the financial year from 1 January to 31 December 2018. These matters were taken into account in our audit of the consolidated financial statements as a whole and in forming our audit opinion thereof. We are not issuing a separate audit opinion on these matters.
Calculation of the fair values of financial instruments based on valuation models (Levels II and III) With regard to the accounting and valuation methods applied by Landesbank Baden-Württemberg, please refer to Notes 8 and 47.
RISK TO THE FINANCIAL STATEMENTS
For the fair value within the meaning of IFRS 13 there are some financial assets mandatorily measured at fair value through profit or loss (EUR 29,803 million) and liabilities mandatorily measured at fair value through profit or loss (EUR 24,478 million), financial assets designated at fair value (EUR 1,207 million) and liabilities designated at fair value (EUR 7,613 million) and financial assets measured at fair value though other comprehensive income (EUR 22,821 million) for which no market prices are observable.
Their fair values must therefore be determined based on generally accepted valuation methods. The choice of valuation models and their parameterization are, in part, discretionary. It was therefore particularly important for our audit that the calculation of the fair values be based on appropriate valuation models and parameters.
APPROACH ADOPTED IN THE AUDIT
Based on our risk assessment and the assessment of the risk of error, we derived our audit opinion from both control-based audit procedures and substantive audit procedures. Accordingly, we performed the following audit procedures, amongst others:
As a first step, we obtained an insight into the development of the financial instruments in the trading portfolio, the associated risks and the internal control system with regard to the measurement of the financial instruments in the trading portfolio.
Moreover, we satisfied ourselves that LBBW had implemented appropriate and effective risk management. Our main goal was to determine whether the valuation is consistent with the written policy on the model-based calculation of the fair value.
The assessment of the appropriateness and effectiveness of the control system covered in particular that the valuation models implemented and the valuation parameters involved are validated independent of trading, both when they are introduced as well as regularly and on an ad hoc basis. On the basis of a random sample of transactions, we also examined if the model valuations were performed and documented appropriately, if the valuation models implemented were appropriate and if the valuation parameters involved were also validated on a regular basis. In addition, we audited the control of the revaluation of the trading transactions independently of trading by an organizational unit which is independent of trading.

In
dep
enden
t A
udit
or’
s re
port
2
97
F
urt
he
r in
form
ati
on
In addition, our internal KPMG valuation specialists implemented a revaluation of products on the basis of a deliberate selection of materiality and risk aspects and compared the results with the values calculated by LBBW. In the revaluation, price and market information observed on the market were used.
For a representative random sample of all products, we examined the parameters relevant for the valuation on the reporting date.
OUR CONCLUSIONS
The valuation models used to calculate the fair values of the trading portfolios for which no market prices are observable are appropriate. The valuation parameters underlying the valuation are derived appropriately.
Calculation of specific loan loss provision (Level 3) for loans and advances to customers in the case of significant loans With regard to the accounting and valuation methods applied by Landesbank Baden-Württemberg, please refer to Notes 8 and 45.
RISK TO THE FINANCIAL STATEMENTS
In line with requirements, LBBW applied the new »IFRS 9 – Financial Instruments« accounting standard for the first time to the start of the 2018 financial year. Key innovations from IFRS 9 include measuring loan loss provisions on debt instruments at risk of default (Level 3 loan loss provisions) on the basis of probability-weighted scenarios. As at 31 December 2018, there were loans and advances to customers (before allowances for losses on loans and advances) of EUR 110,080 million. The specific loan loss provisions (Level 3) and portfolio loan loss provisions (Level 3) for loans and advances to banks and customers and for debentures and other fixed-income securities measured at amortized cost totaled EUR 499 million as at 31 December 2018. The overwhelming portion of these specific loan loss provisions relates to loans and advances to customers (significant loans).
In accordance with IFRS 9, it must be determined at each balance sheet date if a financial asset is credit-impaired. This is the case when one or more events that have a detrimental impact on the estimated future cash flows of that financial asset have occurred. The determination of specific loan loss provisions (Level 3) for loans and advances to customers in the case of significant loans is discretionary, as it requires assumptions on possible scenarios, the consideration of macroeconomic factors within the scenarios, their probabilities and the amount of contractual cash flows still expected per scenario and/or the amount of cash flows expected from the realization of the loan collateral provided per scenario. The assumptions are made depending on the selected restructuring and liquidation strategy.
It was therefore important for our audit that necessary specific loan loss provisions are recognized in a timely manner and that appropriate criteria are applied to identify objective financial assets with indications of impairment. In addition, it was important for our audit that appropriate assumptions were made when determining the specific loan loss provision. Incorrect assumptions mean that counterparty risks are not taken adequately into account and hence receivables are not measured in line with accounting principles.

In
dep
enden
t A
udit
or’
s re
port
2
98
F
urt
he
r in
form
ati
on
APPROACH ADOPTED IN THE AUDIT
Based on our risk assessment and the assessment of the risk of error, we derived our audit opinion from both control-based audit procedures and substantive audit procedures. Accordingly, we performed the following audit procedures, amongst others:
As a first step, we obtained an insight into the development of loans and advances to customers, the associated risks and the internal control system with regard to the management, monitoring and valuation of loans and advances to customers for significant loans.
To assess the appropriateness of the internal control system with regard to the identification, management, monitoring and evaluation of loans and advances to customers, we have audited the relevant organizational guidelines and conducted surveys. Moreover, we satisfied ourselves of the appropriateness, implementation and effectiveness of the relevant controls that the Bank has set up to identify credit-impaired exposures and to comply with the system for determining specific loan loss provision. With regard to the IT systems used, we examined the operating effectiveness of the relevant IT application controls with the involvement of our IT specialists.
We examined the recoverability of loans and advances to customers on the basis of a deliberate selection of individual exposures based on materiality and risk aspects. First of all, we satisfied ourselves that the existence of events which indicate credit impairment were duly identified. For credit-impaired exposures we subsequently assessed whether the underlying restructuring or liquidation strategy and resulted determination of possible scenarios and the considered macroeconomic factors and the determined probability per scenario provide a true and fair view and are adequately substantiated. On this basis, we examined in particular the assumptions regarding the expected contractual cash flows per scenario and/or the expected cash flows from the realization of the loan collateral provided per scenario, and assessed whether the assumptions used in the past were correct. If loan collateral was provided for an exposure which is taken into account in the valuation, we assessed the legal validity and the fair value of this collateral. In this context, we used, where applicable, independent expert valuations as a basis for our opinion and assessed, on the basis of publicly available information, whether their assumptions were derived from suitable internal and external sources in an appropriate manner. To this end, we used information such as market studies, market prices and yield analyses. In this matter we involved our real estate valuation specialists for selected collateral real estate. Finally, we verified whether the required specific loan loss provision was accurately calculated and recorded in the accounting system.
In addition, we examined a random sample of individual commitments that had not been included in our specific item testing and checked whether the criteria for identifying exposures requiring specific loan loss provision were applied appropriately and, if necessary, led to the recognition of a specific loan loss provision (Level 3).

In
dep
enden
t A
udit
or’
s re
port
2
99
F
urt
he
r in
form
ati
on
OUR CONCLUSIONS
The criteria to identify exposures requiring specific loan loss provisions are appropriate. The assumptions on possible scenarios, the considered macroeconomic factors and their probabilities, the amount of contractual cash flows still expected per scenario and/or the amount of cash flows expected from the realization of the loan collateral provided per scenario were derived appropriately and used in accordance with the accounting principles applicable for the measurement of specific loan loss provision (Level 3).
Other information The legal representatives are responsible for other information. Other information comprises:
∙ the combined non-financial statement and ∙ the other parts of the annual report, with the exception of the audited consolidated financial
statements and combined management report as well as our auditor's report.
Our audit opinion on the consolidated financial statements and the combined management report does not include other information. We therefore do not offer an audit opinion nor any other form of audit conclusion regarding this.
In connection with our audit, it is our responsibility to read the other information and to assess whether the other information is free of
∙ material inconsistencies with the consolidated financial statements, the combined management report or our knowledge gained during the audit, or
∙ otherwise appears to be materially incorrect.
Responsibility of the legal representatives and the Supervisory Board for the consolidated financial statements and the combined management report The legal representatives are responsible for the preparation of the consolidated financial statements in accordance, in all material respects, with the IFRS applicable within the EU and the additional requirements of German law pursuant to Section 315e (1) HGB and for the presentation of a true and fair view of the net assets, financial position and results of operations of the Group in the consolidated financial statements in accordance with these requirements. The legal representatives are also responsible for internal controls they have identified as necessary to allow the preparation of consolidated financial statements which are free from material misstatement, whether intentional or not.
In preparing the consolidated financial statements, the legal representatives are responsible for assessing the Group's ability to continue as a going concern. They are also responsible for disclosing, where relevant, matters relating to the going-concern assumption for the Group. In addition, they have responsibility for accounting on the basis of the going concern principle, unless there is the intention to liquidate the Group or to discontinue operations or there is no realistic alternative.
The legal representatives are also responsible for the preparation of the combined management report, which as a whole provides an accurate picture of the Group's position, is consistent in all material respects with the consolidated financial statements, complies with German law and adequately depicts the opportunities and risks presented in the future performance. Furthermore, the legal representatives are responsible for the precautions and measures (systems) which they have deemed necessary to enable the preparation of a combined management report in accordance with German statutory requirements and to provide sufficient suitable evidence for the statements in the combined management report.

In
dep
enden
t A
udit
or’
s re
port
3
00
F
urt
he
r in
form
ati
on
The Supervisory Board is responsible for monitoring the Group's accounting process for the preparation of the consolidated financial statements and the combined management report.
Responsibility of the statutory auditor for the audit of the consolidated financial statements and the combined management report Our objective is to obtain reasonable assurance as to whether the consolidated financial statements as a whole are free from material misstatements, whether intentional or not, and whether the combined management report as a whole provides an accurate picture of the Group's position and, in all material respects, is in accordance with the consolidated financial statements and the findings of our audit, the IFRS applicable within the EU, and the additional requirements of Section 315e (1) HGB and accurately depicts the opportunities and risks presented by the future performance, and to issue an audit report that includes our audit opinion on the consolidated financial statements and the combined management report.
Reasonable assurance represents a high degree of certainty, but no guarantee that an audit conducted in accordance with Section 317 HGB and the EU Audit Regulation as well as the generally accepted standards for the audit of financial statements promulgated by the German Institute of Public Auditors (IDW) will always reveal a material misstatement. Misstatements may result from infringements or inaccuracies and are considered material if it could reasonably be expected that they will, individually or collectively, influence the economic decisions of addressees made on the basis of these consolidated financial statements and the combined management report.
During our audit we exercise professional judgment and due skepticism. Moreover,
∙ we identify and assess the risks of material misstatements, whether intentional or not, in the consolidated financial statements and the combined management report, plan and perform audit procedures in response to these risks, and obtain audit evidence which is sufficient and appropriate to form the basis for our audit opinion. The risk that material misrepresentations are not detected is higher in the case of violations than in the case of inaccuracies, since violations may involve fraudulent interaction, forgery, intentional incompleteness, misleading representations or the repeal of internal controls.
∙ we gain an understanding of the internal control system relevant to the audit of the consolidated financial statements and the arrangements and measures relevant to the audit of the combined management report that are appropriate in the circumstances, but not for the purpose of expressing an audit opinion on the effectiveness of these systems.
∙ we express an opinion on the appropriateness of the accounting policies used by the legal representatives and the reasonableness of the estimated amounts and related information presented by the legal representatives.
∙ we draw conclusions about the appropriateness of the going concern principle applied by the legal representatives and assess, based on the audit evidence obtained, whether there is material uncertainty in connection with events or circumstances that could raise significant doubts about the Group's ability to continue as a going concern. If we come to the conclusion that there is material uncertainty, we are obliged to draw attention to the relevant information in the consolidated financial statements and the combined management report in our audit report or, if this information is inadequate, to modify our audit opinion. We draw our conclusions based on audit evidence obtained by the date of our audit opinion. However, future events or circumstances may prevent the Group from continuing its business activities in the future.
∙ we express an opinion on the overall presentation, structure and content of the consolidated financial statements, including the disclosures, and assess whether the consolidated financial statements present the underlying transactions and events such that the consolidated financial statements give a true and fair view of the net assets, financial position and results of operations of the Group in accordance with the IFRS applicable within the EU and the additional requirements of German law in accordance with Section 315e (1) HGB.

In
dep
enden
t A
udit
or’
s re
port
3
01
F
urt
he
r in
form
ati
on
∙ we obtain sufficient suitable audit evidence for the accounting information of the companies or business activities within the Group to enable us to express an opinion on the consolidated financial statements and the combined management report. We are responsible for guiding the audit of the consolidated financial statements, its supervision and execution. We have sole responsibility for our audit opinions.
∙ we assess the consistency of the combined management report with the consolidated financial statements, its compliance with the law and the picture it portrays of the Group's position.
∙ we conduct audit procedures on the forward-looking statements presented by the legal representatives in the combined management report. Based on sufficient, appropriate audit evidence, we retrace in particular the significant assumptions underlying the forward-looking statements made by the legal representatives and assess the appropriate derivation of the forward-looking statements from these assumptions. We do not issue a separate audit opinion on the forward-looking statements and the underlying assumptions. There is significant unavoidable risk that future events could differ materially from the forward-looking statements.
We discuss with those responsible for governance issues such as the planned scope and timing of the audit and significant audit findings, including any deficiencies in the internal control system that we identify during our audit.
We make a statement to those responsible for governance that we have complied with the relevant independence requirements and discuss with them all relationships and other matters that can reasonably be expected to affect our independence, and the safeguarding measures taken in this respect.
From the matters that we discussed with those responsible for governance, we determine those matters that were most significant in the audit of the consolidated financial statements for the current reporting period and are therefore considered key audit matters. We describe these matters in the auditor's report, unless laws or other statutory provisions prohibit a public disclosure of such facts.

In
dep
enden
t A
udit
or’
s re
port
3
02
F
urt
he
r in
form
ati
on
Other statutory and regulatory requirements
Other disclosures in accordance with Article 10 EU of the Audit Regulation We were appointed statutory auditors of the consolidated financial statements by the annual general meeting on 4 June 2018. We received our mandate from the Audit Committee on 19 June 2018. We have been in continuous practice as statutory auditors of the consolidated financial statements of Landesbank Baden-Württemberg, Stuttgart, Karlsruhe, Mannheim and Mainz since the 2010 financial year.
We state that the audit opinions contained in this audit report are consistent with the additional report to the Supervisory Board in accordance with Article 11 of the EU Audit Regulation (audit report).
Responsible statutory auditor
The statutory auditor responsible for the audit is Klaus-Ulrich Pfeiffer.
Stuttgart, 8 March 2019
KPMG AG
Wirtschaftsprüfungsgesellschaft
signed Pfeiffer signed Kühn
Responsible statutory auditor Responsible statutory auditor
Li
mit
ed A
ssura
nce
Rep
ort
3
03
F
urt
he
r in
form
ati
on
Limited Assurance Report of the Independent Auditor regarding the Combined Non-financial statement1
To the Supervisory Board of Landesbank Baden-Württemberg, Stuttgart, Karlsruhe, Mannheim and Mainz
We have performed an independent limited assurance engagement on the Combined Non-financial statement of Landesbank Baden-Württemberg and the Group (hereinafter »LBBW«) as well as the by reference qualified part »Structure and business activities« of the Combined Management Report (hereinafter »Statement») according to Sections 315b and 315c in con-junction with 289b to 289e German Commercial Code (HGB) for the business year from Janu-ary 1 to December 31, 2018.
Management’s Responsibility
The legal representatives of LBBW are responsible for the preparation of the Statement in accordance with Sections 315b and 315c in conjunction with 289b to 289e HGB.
This responsibility of the legal representatives includes the selection and application of ap-propriate methods to prepare the Statement and the use of assumptions and estimates for individual disclosures which are reasonable under the given circumstances. Furthermore, this responsibility includes designing, implementing and maintaining systems and processes rele-vant for the preparation of the Statement in a way that is free of – intended or unintended – material misstatements.
Independence and Quality Assurance on the Part of the Auditing Firm
We are independent from the entity in accordance with the requirements of independence and quality assurance set out in legal provisions and professional pronouncements and have ful-filled our additional professional obligations in accordance with these requirements.
Our audit firm applies the national statutory provisions and professional pronouncements for quality assurance, in particular the professional code for German Public Auditors and Char-tered Accountants (in Germany) and the quality assurance standard of the German Institute of Public Auditors (Institut der Wirtschaftsprüfer, IDW) regarding quality assurance requirements in audit practice (IDW QS 1).
1 Our engagement applied to the German version of the Statement 2018. This text is a translation of the In-dependent Assurance Report issued in the German, whereas the German text is authoritative.

Li
mit
ed A
ssura
nce
Rep
ort
3
04
F
urt
he
r in
form
ati
on
Practitioner’s Responsibility
Our responsibility is to express a conclusion on the Statement based on our work performed within our limited assurance engagement.
We conducted our work in accordance with the International Standard on Assurance Engage-ments (ISAE) 3000 (Revised): »Assurance Engagements Other than Audits or Reviews of His-torical Financial Information« published by IAASB. This Standard requires that we plan and perform the assurance engagement to obtain limited assurance of whether any matters have come to our attention that cause us to believe that the Statement for the period from January 1 to December 31, 2018, has not been prepared, in all material respects in accordance with Sections 315b and 315c in conjunction with 289b to 289e HGB. We do not, however, provide a separate conclusion for each disclosure. In a limited assurance engagement the evidence gathering procedures are more limited than in a reasonable assurance engagement and there-fore significantly less assurance is obtained than in a reasonable assurance engagement. The choice of audit procedures is subject to the auditor’s own judgement.
Within the scope of our engagement, we performed amongst others the following procedures:
∙ Inquiries of personnel on the group level who are responsible for the materiality analysis to get an understanding of the process for identifying material topics and respective report boundaries for LBBW
∙ A risk analysis, including a media search, of relevant information about the sustainability performance of LBBW in the reporting period
∙ Evaluation of the design and implementation of systems and processes for the collection, processing and monitoring of information on environmental, employee and social matters, respect for human rights, and combating corruption and bribery, including data consolida-tion
∙ Inquiries of personnel on the group level who are responsible for the collection of the in-formation to concepts, due diligence processes, results and risks, the conduction of inter-nal controls and the information consolidation
∙ Evaluation of selected internal and external documents ∙ Analytical evaluation of data and trends of quantitative information which are reported by all
entities on the group level ∙ Assessment of the overall presentation of the information
Conclusion
Based on the procedures performed and the evidence obtained, nothing has come to our attention that causes us to believe that the Statement of LBBW for the business year from January 1 to December 31, 2018 is not prepared, in all material respects, in accordance with Sections 315b and 315c in conjunction with 289b to 289e HGB.

Li
mit
ed A
ssura
nce
Rep
ort
3
05
F
urt
he
r in
form
ati
on
Restriction of Use / Clause on General Engagement Terms
This report is issued for the purposes of the Supervisory Board of Landesbank Baden-Württemberg, Stuttgart, Karlsruhe, Mannheim and Mainz only. We assume no responsibility with regard to any third parties.
Our assignment for the Supervisory Board of Landesbank Baden-Württemberg, Stuttgart, Karlsruhe, Mannheim and Mainz, and professional liability is governed by the General Enga-gement Terms for Wirtschaftsprüfer and Wirtschaftsprüfungsgesellschaften (Allgemeine Auf-tragsbedingungen für Wirtschaftsprüfer und Wirtschaftsprüfungsgesellschaften) in the version dated January 1, 2017 (https://www.kpmg.de/bescheinigungen/lib/aab_english.pdf). By read-ing and using the information contained in this report, each recipient confirms having taken note of provisions of the General Engagement Terms (including the limitation of our liability for negligence to EUR 4 million as stipulated in No. 9) and accepts the validity of the above mentioned General Engagement Terms with respect to us.
Munich, March 8, 2019
KPMG AG Wirtschaftsprüfungsgesellschaft
[Original German version signed by:]
Hell ppa. Auer

N
ote
reg
ardin
g fo
rwar
d-l
ooki
ng
stat
emen
ts
30
6
Fu
rth
er
info
rma
tio
n
Note regarding forward-looking statements
This Annual Report contains forward-looking statements. Forward-looking statements are identified by the use of words such as »expect«, »intend«, »anticipate«, »plan«, »believe«, »assume«, »aim«, »estimate«, »will«, »shall«, »forecast« and similar expressions. These statements are based on the current estimates and forecasts by the Board of Managing Directors and on currently available information. Forward-looking statements are not deemed to be guarantees of the future developments and results set out therein and involve a number of risks and uncertainties. If any of these or other risks or uncertainties occur, or if the assumptions underlying any of these statements prove incorrect, the actual results may differ materially from those expressed or implied by such statements.
LBBW assumes no obligation to continuously update any forward-looking statements, as these are based solely on the circumstances valid on the day of publication.
FURTHER INFORMATION ON LANDESBANK BADEN-WÜRTTEMBERG
www.LBBW.de
PUBLISHER'S INFORMATION
Published by: Landesbank Baden-Württemberg Am Hauptbahnhof 2 70173 Stuttgart, Germany
Concept & Realization: Landesbank Baden-Württemberg Created using
www.LBBW.de [email protected]
The German version of this Annual Report is the authoritative version and only the German version of the Combined Management Report and the Consolidated Financial Statements was audited by the auditors.

N
on-f
inan
cial
sta
tem
ent
30
8
Co
mb
ined
ma
na
gem
en
t re
po
rt
Breaking new ground
Landesbank Baden-Wü[email protected]
Headquarters
StuttgartAm Hauptbahnhof 270173 Stuttgart, GermanyPhone + 49 (0) 711 127-0Fax + 49 (0) 711 127-43544
KarlsruheLudwig-Erhard-Allee 476131 Karlsruhe, GermanyPhone + 49 (0) 721 142-0Fax + 49 (0) 721 142-23012
MannheimAugustaanlage 3368165 Mannheim, GermanyPhone + 49 (0) 621 428-0Fax + 49 (0) 621 428-72591
MainzGroße Bleiche 54–5655116 Mainz, GermanyPhone + 49 (0) 613164-37800 Fax + 49 (0) 613164-35701


