30
Gordon MacAulay BRI Australia What the World Wants from Australian Wheat
Gordon MacAulayBRI Australia
What the World Wants from Australian Wheat
OutlineOutline
2
• Scale of the World Wheat Industry• Competition is tough—Black Sea Ports
– Price is important• Wheat markets are risky—why?
– The nature of supply and demand– Risk management is essential
• Our biggest customer—Indonesia– This market wants our wheat—’look after it’
• Baked goods sector most important– Baking type wheat is wanted
• Quality versus yield—consistency– Product differentiation and market servicing costs– Consistency a major issue
• Internationalisation– Economies of scale and scope and the competitive fringe
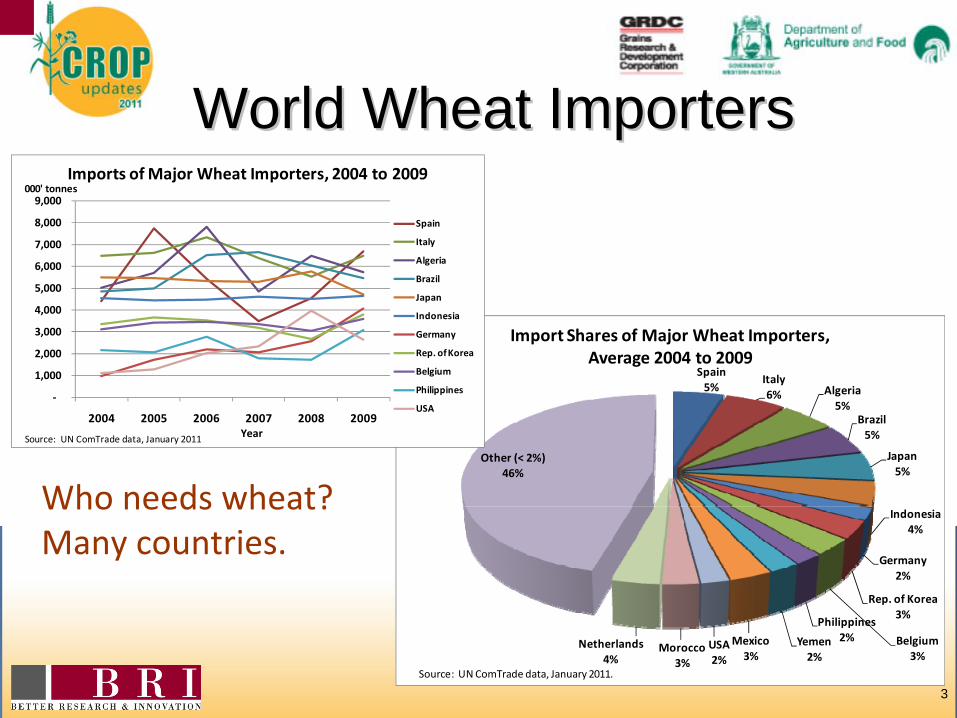
World Wheat ImportersWorld Wheat Importers
3
Who needs wheat?Many countries.
Spain5%
Italy6% Algeria
5%Brazil5%
Japan5%
Indonesia4%
Germany2%
Rep. of Korea3%
Belgium3%
Philippines2%Yemen
2%Mexico3%
USA2%
Morocco3%
Netherlands4%
Other (< 2%)46%
Import Shares of Major Wheat Importers, Average 2004 to 2009
Source: UN ComTrade data, January 2011.
‐
1,000
2,000
3,000
4,000
5,000
6,000
7,000
8,000
9,000
2004 2005 2006 2007 2008 2009
Imports of Major Wheat Importers, 2004 to 2009
Spain
Italy
Algeria
Brazil
Japan
Indonesia
Germany
Rep. of Korea
Belgium
Philippines
USA
Source: UN ComTrade data, January 2011 Year
000' tonnes
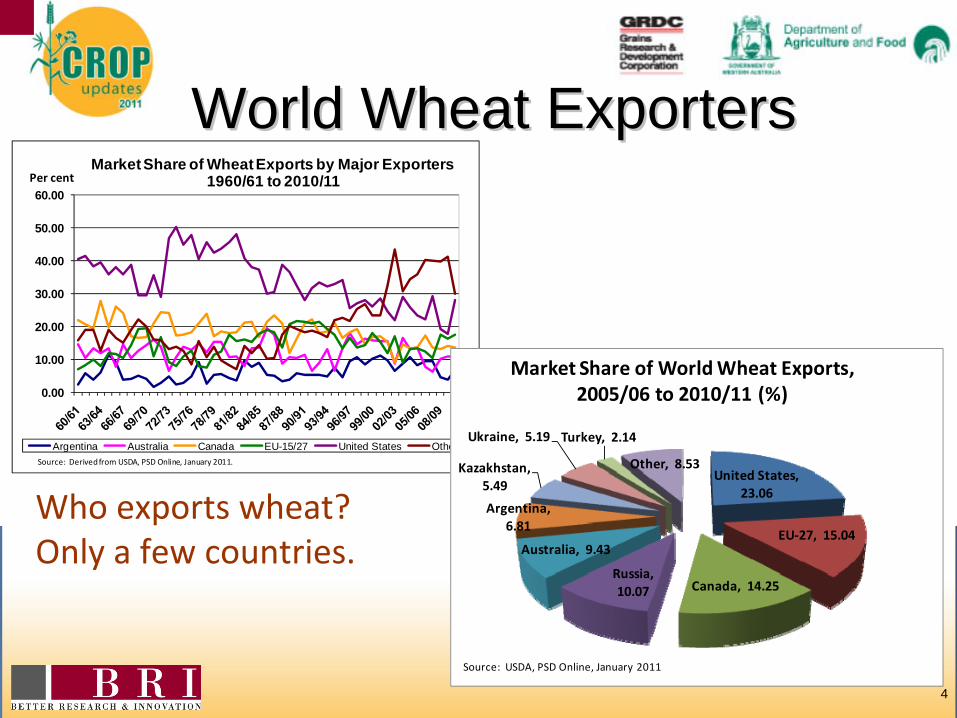
World Wheat ExportersWorld Wheat Exporters
4
Who exports wheat?Only a few countries.
0.00
10.00
20.00
30.00
40.00
50.00
60.00
Market Share of Wheat Exports by Major Exporters 1960/61 to 2010/11
Argentina Australia Canada EU-15/27 United States OtherSource: Derived from USDA, PSD Online, January 2011.
Per cent
United States, 23.06
EU‐27, 15.04
Canada, 14.25 Russia, 10.07
Australia, 9.43
Argentina, 6.81
Kazakhstan, 5.49
Ukraine, 5.19 Turkey, 2.14
Other, 8.53
Market Share of World Wheat Exports,2005/06 to 2010/11 (%)
Source: USDA, PSD Online, January 2011
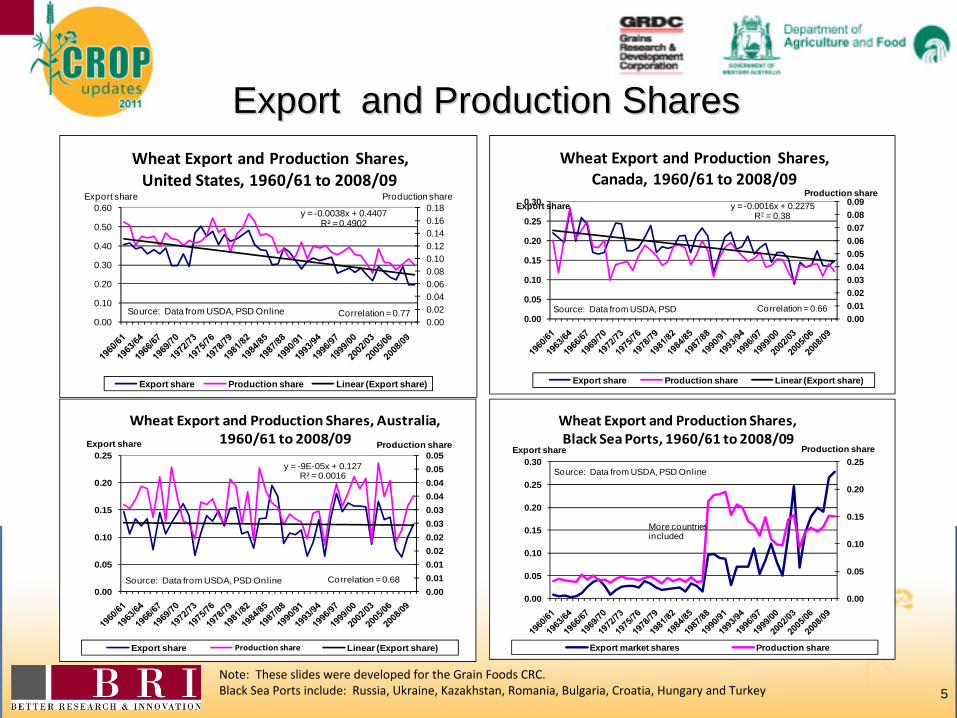
Export and Production SharesExport and Production Shares
5Note: These slides were developed for the Grain Foods CRC.Black Sea Ports include: Russia, Ukraine, Kazakhstan, Romania, Bulgaria, Croatia, Hungary and Turkey
y = -0.0038x + 0.4407R² = 0.4902
0.000.020.040.060.080.100.120.140.160.18
0.00
0.10
0.20
0.30
0.40
0.50
0.60
Wheat Export and Production Shares, United States, 1960/61 to 2008/09
Export share Production share Linear (Export share)
Export share Production share
Source: Data from USDA, PSD Online Correlation = 0.77
y = -0.0016x + 0.2275R2 = 0.38
0.000.010.020.030.040.050.060.070.080.09
0.00
0.05
0.10
0.15
0.20
0.25
0.30
Wheat Export and Production Shares, Canada, 1960/61 to 2008/09
Export share Production share Linear (Export share)
Export shareProduction share
Source: Data from USDA, PSD Correlation = 0.66
y = -9E-05x + 0.127R² = 0.0016
0.000.010.010.020.020.030.030.040.040.050.05
0.00
0.05
0.10
0.15
0.20
0.25
Wheat Export and Production Shares, Australia, 1960/61 to 2008/09
Export share Production share Linear (Export share)
Export share Production share
Source: Data from USDA, PSD Online Correlation = 0.68
0.00
0.05
0.10
0.15
0.20
0.25
0.00
0.05
0.10
0.15
0.20
0.25
0.30
Wheat Export and Production Shares, Black Sea Ports, 1960/61 to 2008/09
Export market shares Production share
Export share Production share
Source: Data from USDA, PSD Online
More countries included
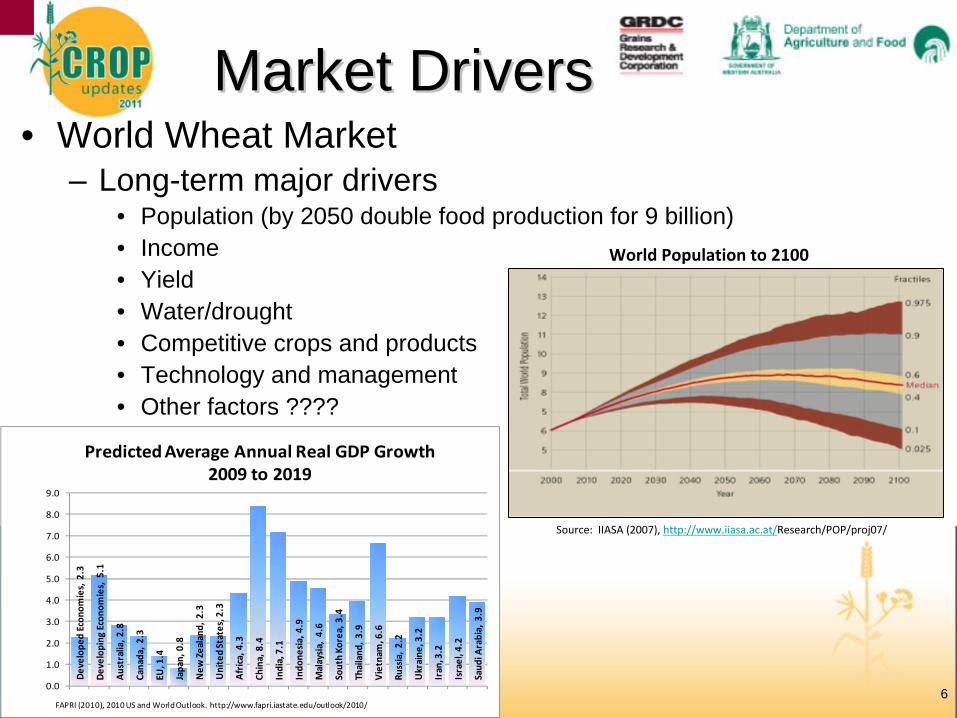
Market DriversMarket Drivers
6
• World Wheat Market– Long-term major drivers
• Population (by 2050 double food production for 9 billion)• Income• Yield• Water/drought• Competitive crops and products• Technology and management• Other factors ????
World Population to 2100
Source: IIASA (2007), http://www.iiasa.ac.at/Research/POP/proj07/
Develop
ed Econo
mies, 2.3
Develop
ing Econ
omies, 5.1
Australia, 2
.8
Canada, 2.3
EU, 1.4
Japan, 0.8
New
Zealand
, 2.3
United States, 2.3
Africa, 4.3
China, 8.4
India, 7.1
Indo
nesia, 4.9
Malaysia, 4.6
South Ko
rea, 3.4
Thailand
, 3.9
Vietnam
, 6.6
Russia, 2.2
Ukraine
, 3.2
Iran, 3.2
Israel, 4.2
Saud
i Arabia, 3.9
0.0
1.0
2.0
3.0
4.0
5.0
6.0
7.0
8.0
9.0
Predicted Average Annual Real GDP Growth 2009 to 2019
FAPRI (2010), 2010 US and World Outlook. http://www.fapri.iastate.edu/outlook/2010/
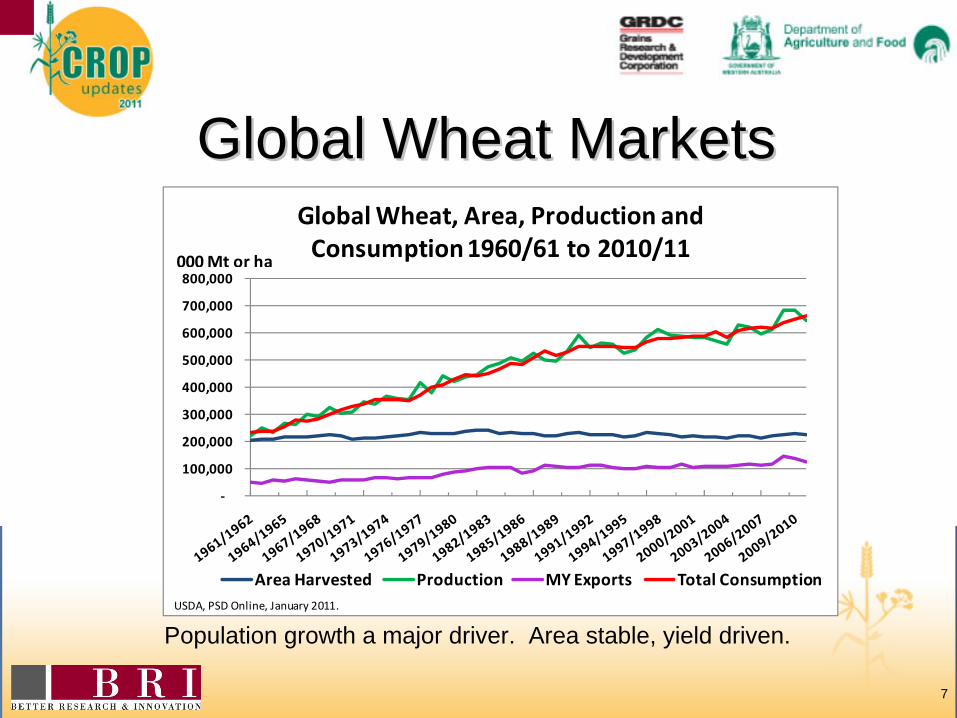
Global Wheat MarketsGlobal Wheat Markets
7
Population growth a major driver. Area stable, yield driven.
‐
100,000
200,000
300,000
400,000
500,000
600,000
700,000
800,000
Global Wheat, Area, Production and Consumption 1960/61 to 2010/11
Area Harvested Production MY Exports Total ConsumptionUSDA, PSD Online, January 2011.
000Mt or ha
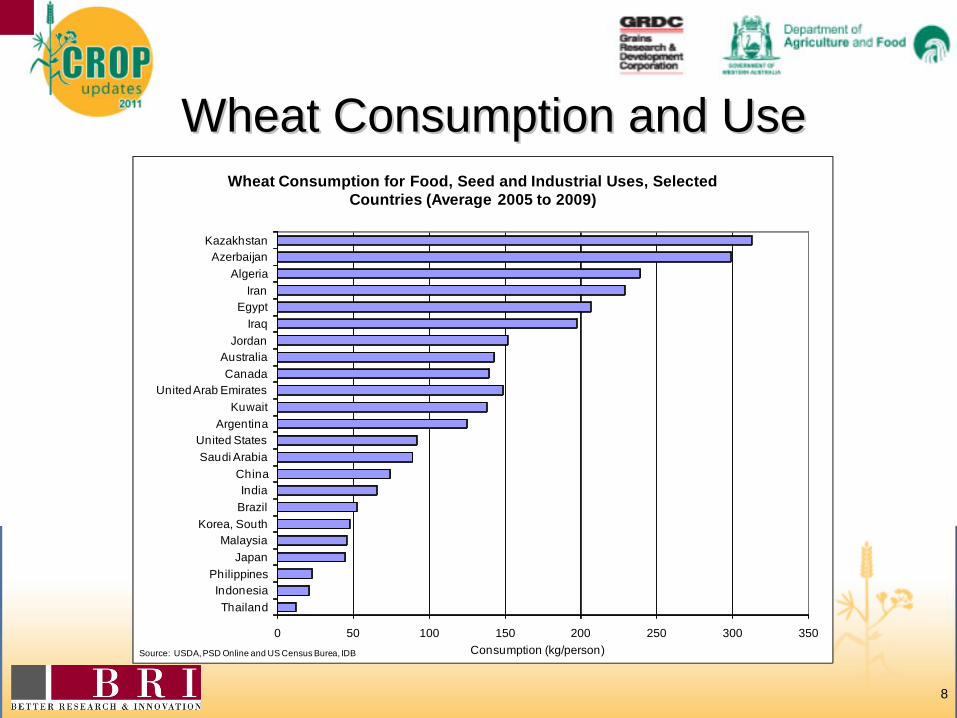
Wheat Consumption and UseWheat Consumption and Use
8
0 50 100 150 200 250 300 350
KazakhstanAzerbaijan
AlgeriaIran
EgyptIraq
JordanAustraliaCanada
United Arab EmiratesKuwait
ArgentinaUnited StatesSaudi Arabia
ChinaIndia
BrazilKorea, South
MalaysiaJapan
PhilippinesIndonesiaThailand
Consumption (kg/person)
Wheat Consumption for Food, Seed and Industrial Uses, Selected Countries (Average 2005 to 2009)
Source: USDA, PSD Online and US Census Burea, IDB
Market DriversMarket Drivers
9
• What do you think determines the market price for wheat (milling wheat)? (Rank your answers)– Exchange rate– Weather– Income– Futures traders– Supply and demand– Energy prices– Population growth– Other …..
Changing World MarketsChanging World Markets
10
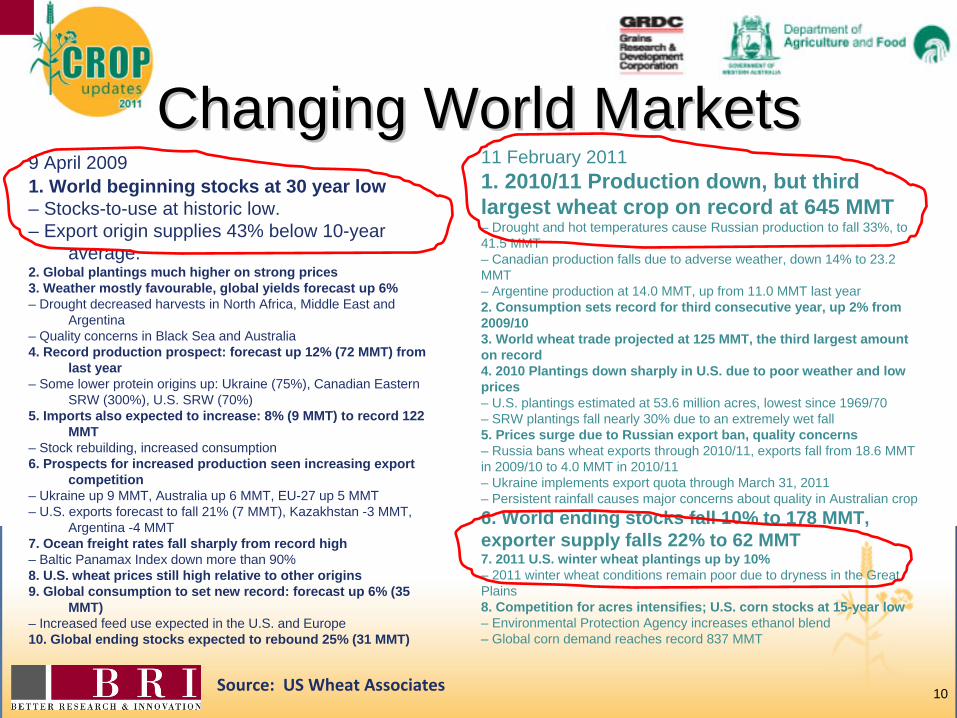
9 April 20091. World beginning stocks at 30 year low– Stocks-to-use at historic low.– Export origin supplies 43% below 10-year
average.2. Global plantings much higher on strong prices3. Weather mostly favourable, global yields forecast up 6%– Drought decreased harvests in North Africa, Middle East and
Argentina– Quality concerns in Black Sea and Australia4. Record production prospect: forecast up 12% (72 MMT) from
last year– Some lower protein origins up: Ukraine (75%), Canadian Eastern
SRW (300%), U.S. SRW (70%)5. Imports also expected to increase: 8% (9 MMT) to record 122
MMT– Stock rebuilding, increased consumption6. Prospects for increased production seen increasing export
competition– Ukraine up 9 MMT, Australia up 6 MMT, EU-27 up 5 MMT– U.S. exports forecast to fall 21% (7 MMT), Kazakhstan -3 MMT,
Argentina -4 MMT7. Ocean freight rates fall sharply from record high– Baltic Panamax Index down more than 90%8. U.S. wheat prices still high relative to other origins9. Global consumption to set new record: forecast up 6% (35
MMT)– Increased feed use expected in the U.S. and Europe10. Global ending stocks expected to rebound 25% (31 MMT)
11 February 20111. 2010/11 Production down, but third largest wheat crop on record at 645 MMT– Drought and hot temperatures cause Russian production to fall 33%, to 41.5 MMT– Canadian production falls due to adverse weather, down 14% to 23.2 MMT– Argentine production at 14.0 MMT, up from 11.0 MMT last year2. Consumption sets record for third consecutive year, up 2% from 2009/103. World wheat trade projected at 125 MMT, the third largest amount on record4. 2010 Plantings down sharply in U.S. due to poor weather and low prices– U.S. plantings estimated at 53.6 million acres, lowest since 1969/70– SRW plantings fall nearly 30% due to an extremely wet fall5. Prices surge due to Russian export ban, quality concerns– Russia bans wheat exports through 2010/11, exports fall from 18.6 MMT in 2009/10 to 4.0 MMT in 2010/11– Ukraine implements export quota through March 31, 2011– Persistent rainfall causes major concerns about quality in Australian crop6. World ending stocks fall 10% to 178 MMT, exporter supply falls 22% to 62 MMT7. 2011 U.S. winter wheat plantings up by 10%– 2011 winter wheat conditions remain poor due to dryness in the Great Plains8. Competition for acres intensifies; U.S. corn stocks at 15-year low– Environmental Protection Agency increases ethanol blend– Global corn demand reaches record 837 MMT
Source: US Wheat Associates
50
100
150
200
250
300
350
400
15%
20%
25%
30%
35%
40%
1980 1982 1984 1986 1988 1990 1992 1994 1996 1998 2000 2002 2004 2006 2008 2010
USD
per
Ton
ne
Stoc
ks to
Use
Rat
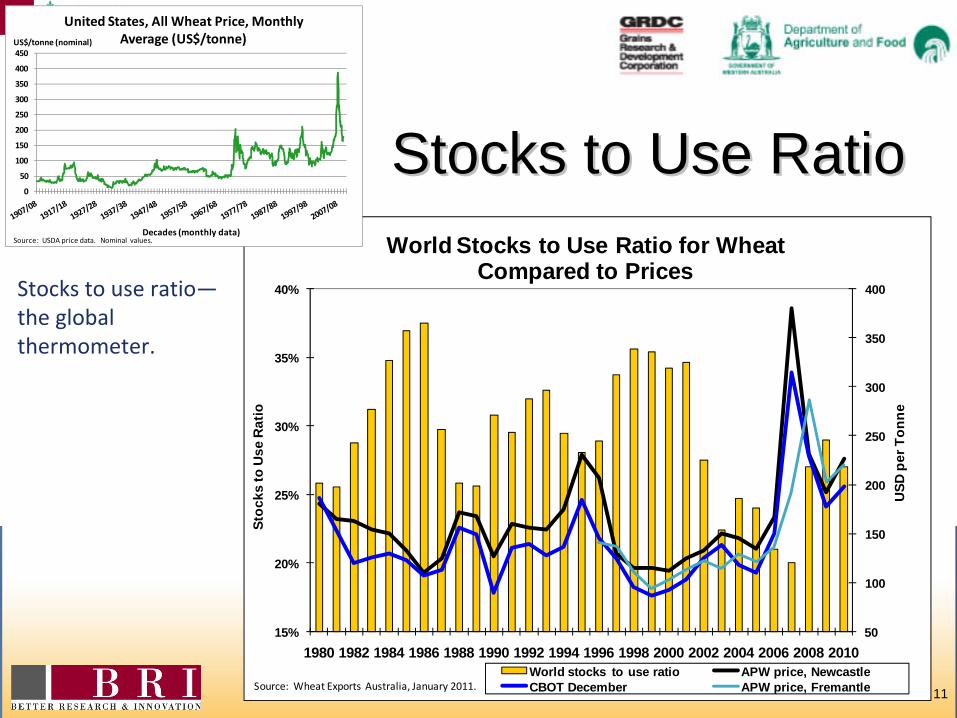
ioWorld Stocks to Use Ratio for Wheat
Compared to Prices
World stocks to use ratio APW price, NewcastleCBOT December APW price, FremantleSource: Wheat Exports Australia, January 2011.
Stocks to Use RatioStocks to Use Ratio
11
Stocks to use ratio—
the global
thermometer.
0
50
100
150
200
250
300
350
400
450
Decades (monthly data)
United States, All Wheat Price, Monthly Average (US$/tonne)US$/tonne (nominal)
Source: USDA price data. Nominal values.
World Supply and DemandWorld Supply and Demand
12
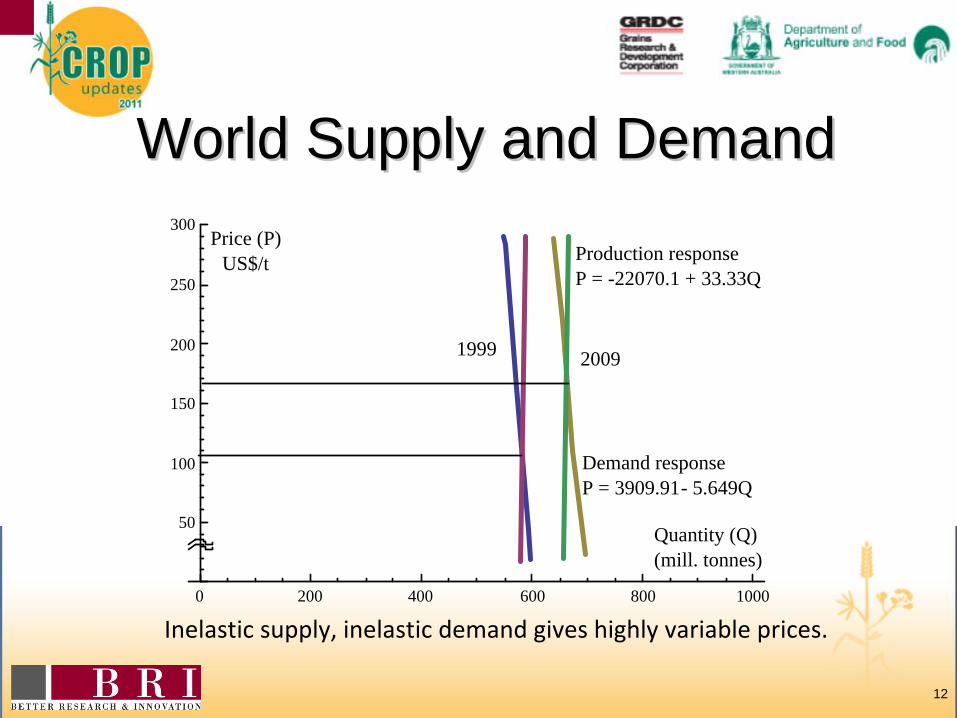
Inelastic supply, inelastic demand gives highly variable prices.
Demand responseP = 3909.91- 5.649Q
Production responseP = -22070.1 + 33.33Q
1999 2009
Price (P) US$/t
Quantity (Q)(mill. tonnes)
0 200 400 600 800 1000
50
100
150
200
250
300
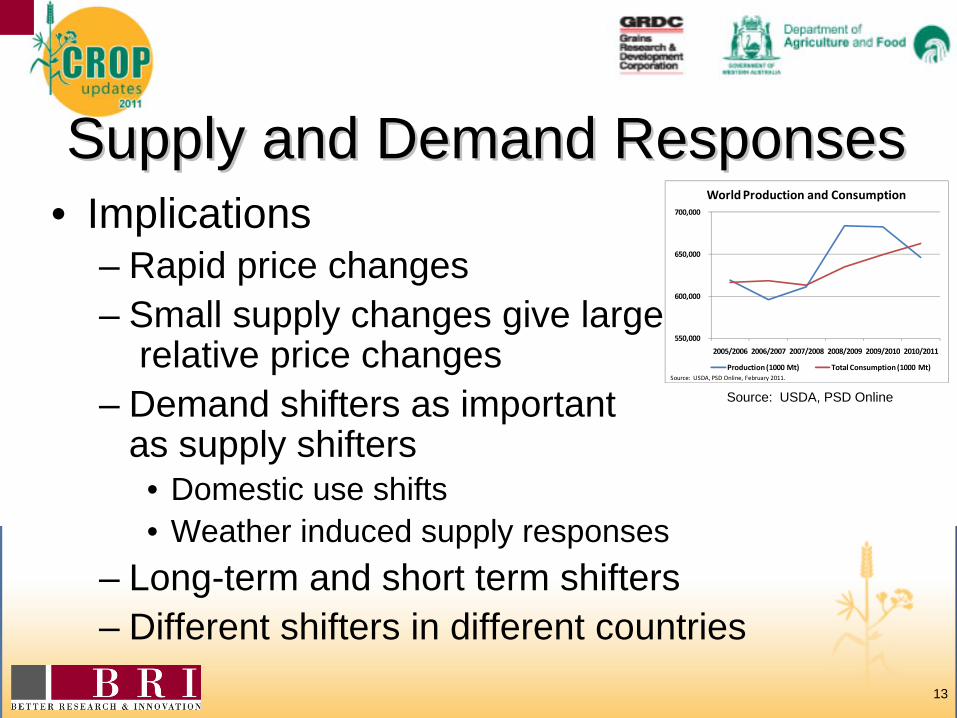
Supply and Demand ResponsesSupply and Demand Responses
13
• Implications– Rapid price changes– Small supply changes give large
relative price changes– Demand shifters as important
as supply shifters• Domestic use shifts• Weather induced supply responses
– Long-term and short term shifters– Different shifters in different countries
Source: USDA, PSD Online
550,000
600,000
650,000
700,000
2005/2006 2006/2007 2007/2008 2008/2009 2009/2010 2010/2011
World Production and Consumption
Production (1000 Mt) Total Consumption (1000 Mt)Source: USDA, PSD Online, February 2011.
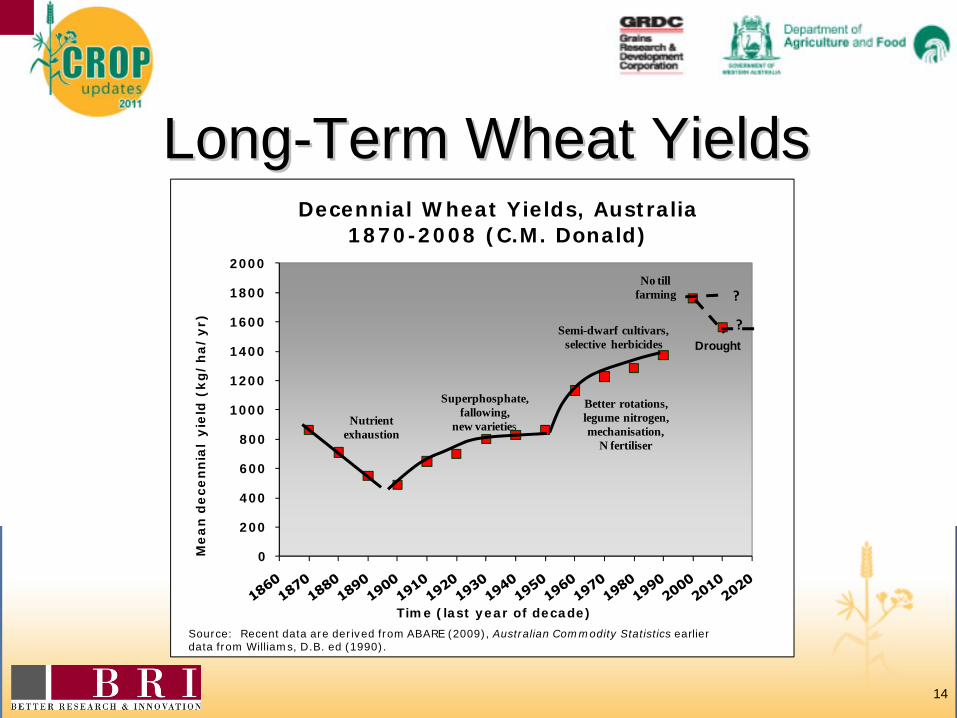
LongLong--Term Wheat YieldsTerm Wheat Yields
14
0
200
400
600
800
1000
1200
1400
1600
1800
2000
Me
an
de
ce
nn
ial
yie
ld (
kg
/h
a/
yr)
Time (last year of decade)
Decennial Wheat Yields, Australia 1870-2008 (C.M. Donald)
Nutrient exhaustion
Superphosphate,fallowing,
new varieties
Better rotations, legume nitrogen, mechanisation,
N fertiliser
No tillfarming
Semi-dwarf cultivars, selective herbicides Drought
Source: Recent data are derived from ABARE (2009), Australian Commodity Statistics earlier data from Williams, D.B. ed (1990).
?
?
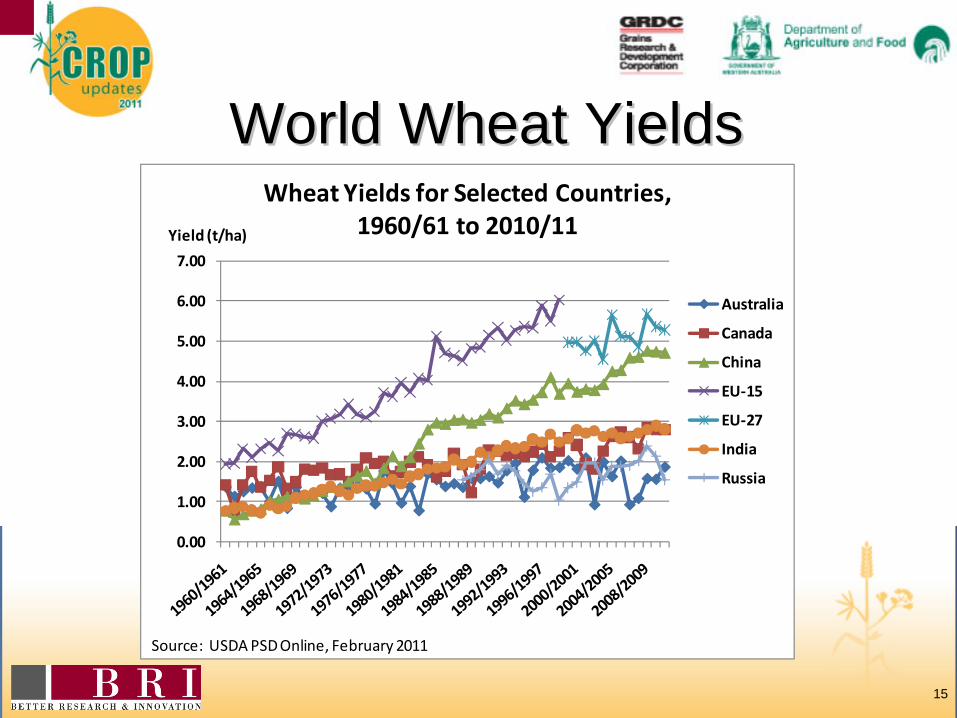
World Wheat YieldsWorld Wheat Yields
15
0.00
1.00
2.00
3.00
4.00
5.00
6.00
7.00
Wheat Yields for Selected Countries, 1960/61 to 2010/11
Australia
Canada
China
EU‐15
EU‐27
India
Russia
Source: USDA PSD Online, February 2011
Yield (t/ha)
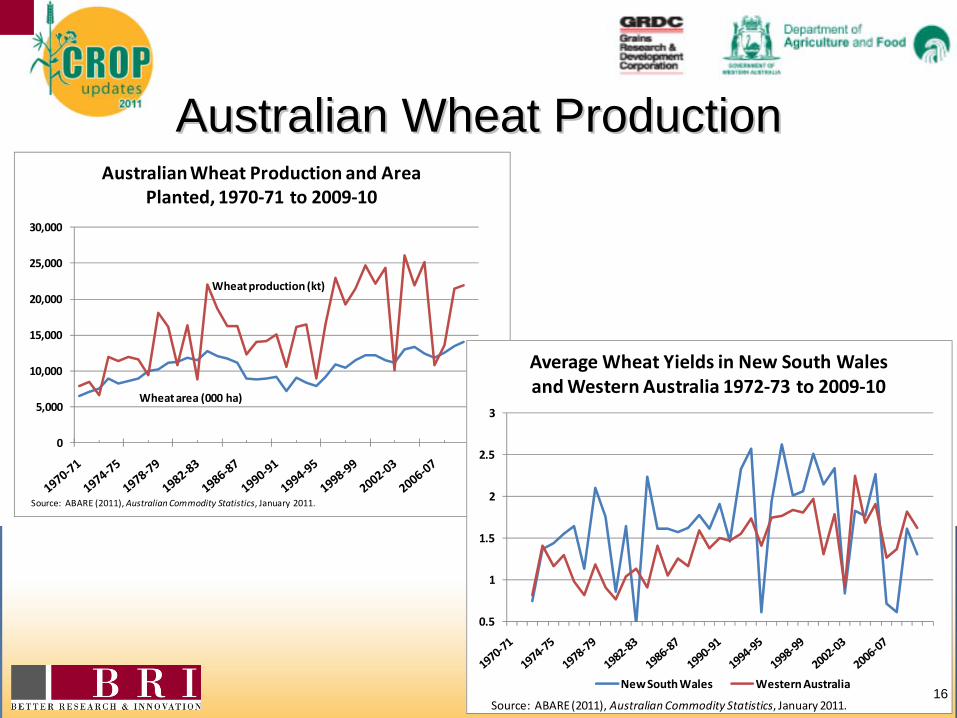
0
5,000
10,000
15,000
20,000
25,000
30,000
Australian Wheat Production and Area Planted, 1970‐71 to 2009‐10
Wheat production (kt)
Wheat area (000 ha)
Source: ABARE (2011), Australian Commodity Statistics, January 2011.
0.5
1
1.5
2
2.5
3
Average Wheat Yields in New South Wales and Western Australia 1972‐73 to 2009‐10
New South Wales Western Australia
Source: ABARE (2011), Australian Commodity Statistics, January 2011.
Australian Wheat ProductionAustralian Wheat Production
16
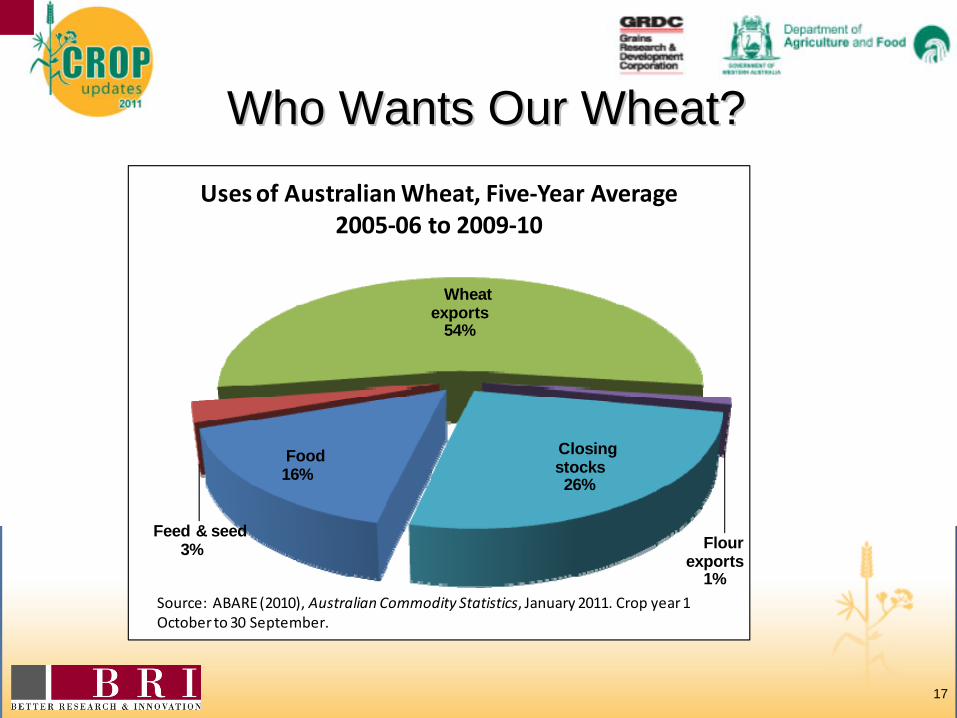
Who Wants Our Wheat?Who Wants Our Wheat?
17
Food16%
Feed & seed3%
Wheat exports
54%
Flour exports
1%
Closing stocks26%
Uses of Australian Wheat, Five‐Year Average 2005‐06 to 2009‐10
Source: ABARE (2010), Australian Commodity Statistics, January 2011. Crop year 1 October to 30 September.
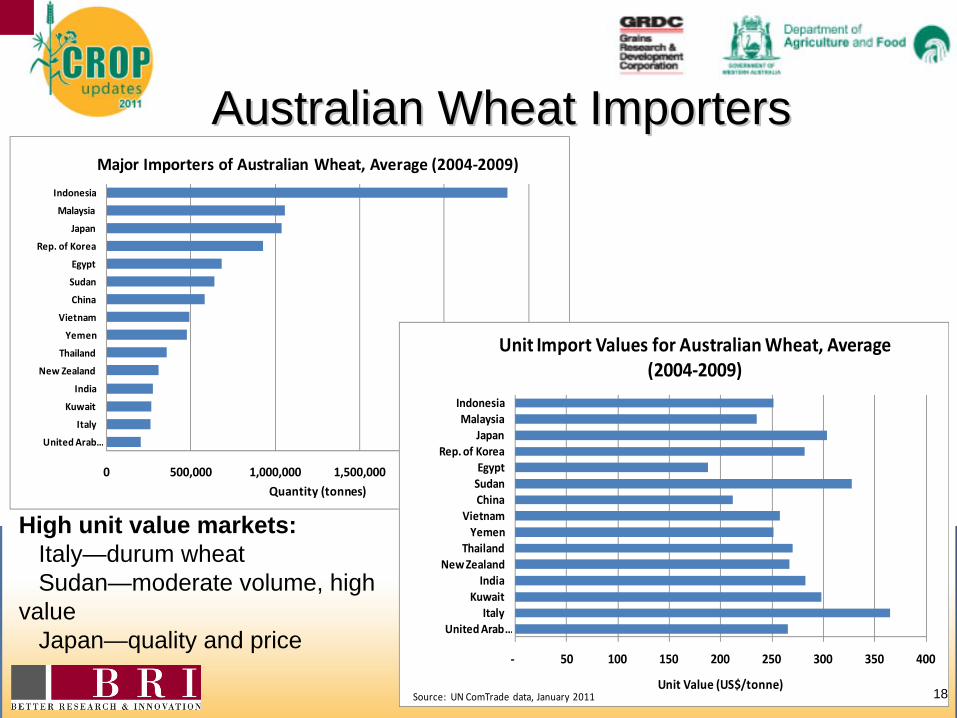
0 500,000 1,000,000 1,500,000 2,000,000 2,500,000
Indonesia
Malaysia
Japan
Rep. of Korea
Egypt
Sudan
China
Vietnam
Yemen
Thailand
New Zealand
India
Kuwait
Italy
United Arab …
Quantity (tonnes)
Major Importers of Australian Wheat, Average (2004‐2009)
‐ 50 100 150 200 250 300 350 400
IndonesiaMalaysia
JapanRep. of Korea
EgyptSudanChina
VietnamYemen
ThailandNew Zealand
IndiaKuwait
ItalyUnited Arab …
Unit Value (US$/tonne)
Unit Import Values for Australian Wheat, Average (2004‐2009)
Source: UN ComTrade data, January 2011
Australian Wheat ImportersAustralian Wheat Importers
18
High unit value markets:Italy—durum wheatSudan—moderate volume, high
valueJapan—quality and price
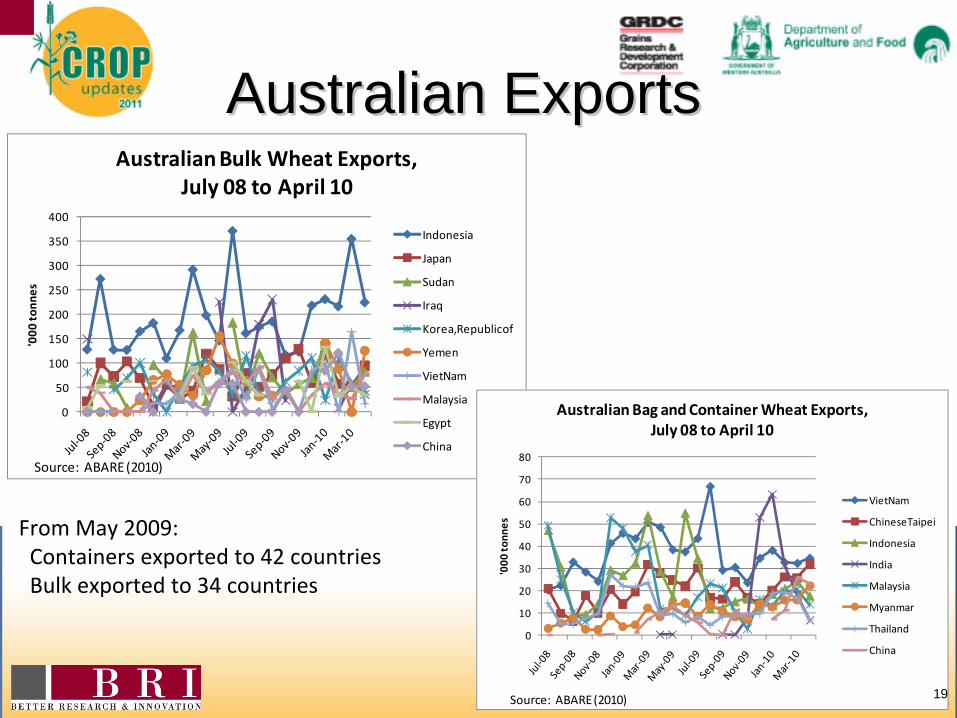
0
50
100
150
200
250
300
350
400
'000
tonn
es
Australian Bulk Wheat Exports, July 08 to April 10
Indonesia
Japan
Sudan
Iraq
Korea,Republicof
Yemen
VietNam
Malaysia
Egypt
China
Source: ABARE (2010)
0
10
20
30
40
50
60
70
80
'000
tonn
es
Australian Bag and Container Wheat Exports, July 08 to April 10
VietNam
ChineseTaipei
Indonesia
India
Malaysia
Myanmar
Thailand
China
Source: ABARE (2010)
Australian ExportsAustralian Exports
19
From May 2009:Containers exported to 42 countriesBulk exported to 34 countries
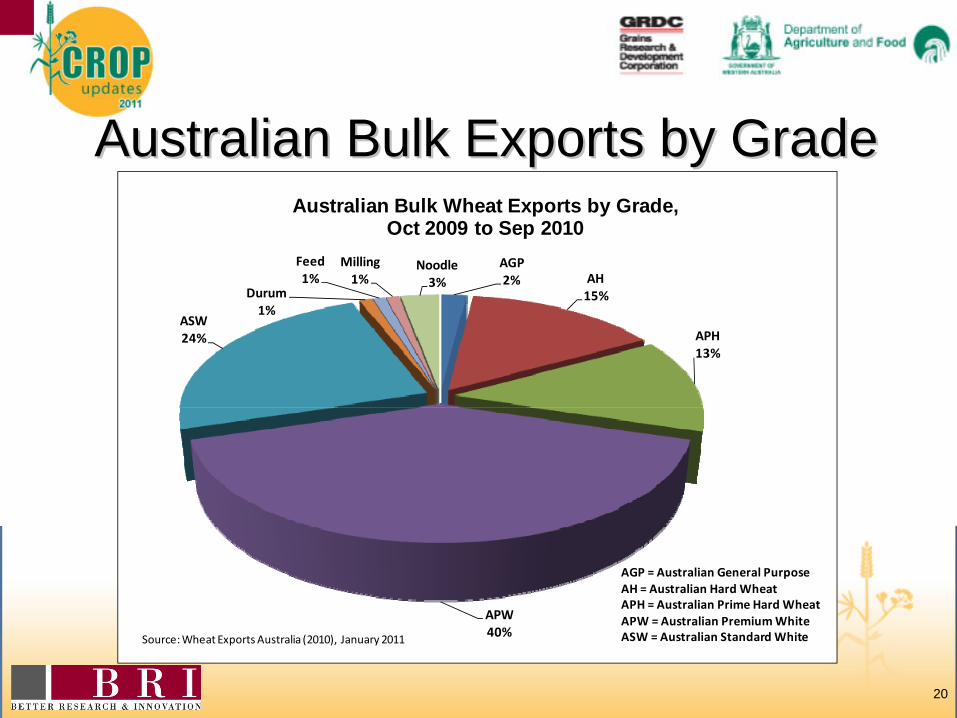
Australian Bulk Exports by GradeAustralian Bulk Exports by Grade
20
AGP2% AH
15%
APH13%
APW40%
ASW24%
Durum1%
Feed1%
Milling1%
Noodle3%
Australian Bulk Wheat Exports by Grade, Oct 2009 to Sep 2010
Source:Wheat Exports Australia (2010), January 2011
AGP = Australian General PurposeAH = Australian Hard WheatAPH = Australian Prime Hard WheatAPW = Australian Premium WhiteASW = Australian Standard White
0
500
1000
1500
2000
2500
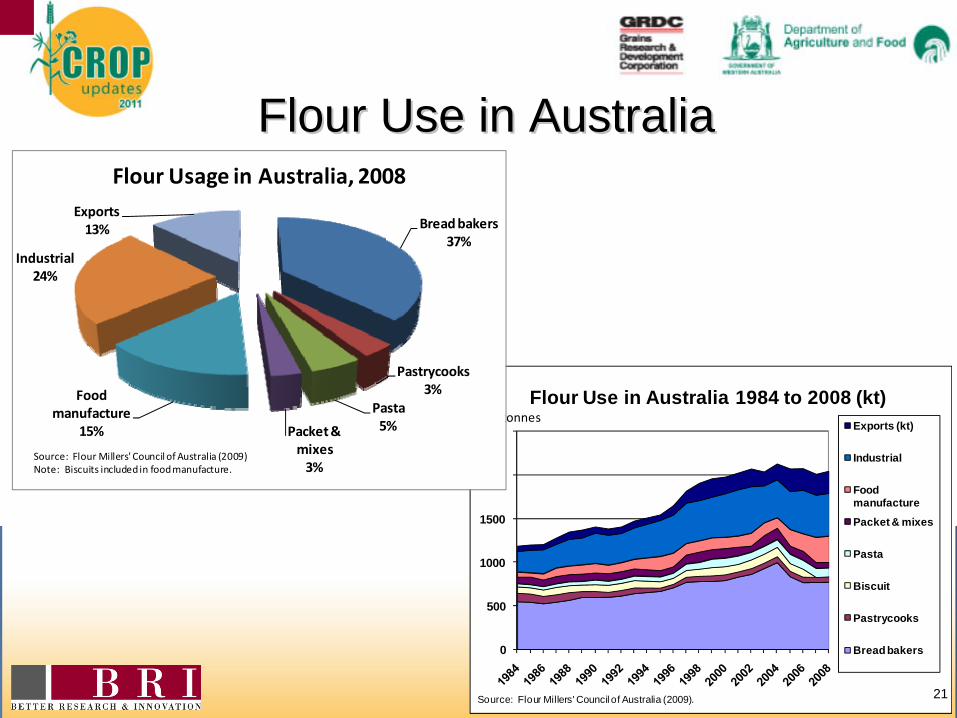
Flour Use in Australia 1984 to 2008 (kt)Exports (kt)
Industrial
Food manufacture
Packet & mixes
Pasta
Biscuit
Pastrycooks
Bread bakers
Source: Flour Millers' Council of Australia (2009).
000 tonnes
Flour Use in AustraliaFlour Use in Australia
21
Bread bakers37%
Pastrycooks3%
Pasta 5%Packet &
mixes3%
Food manufacture
15%
Industrial24%
Exports13%
Flour Usage in Australia, 2008
Source: Flour Millers' Council of Australia (2009)Note: Biscuits included in food manufacture.
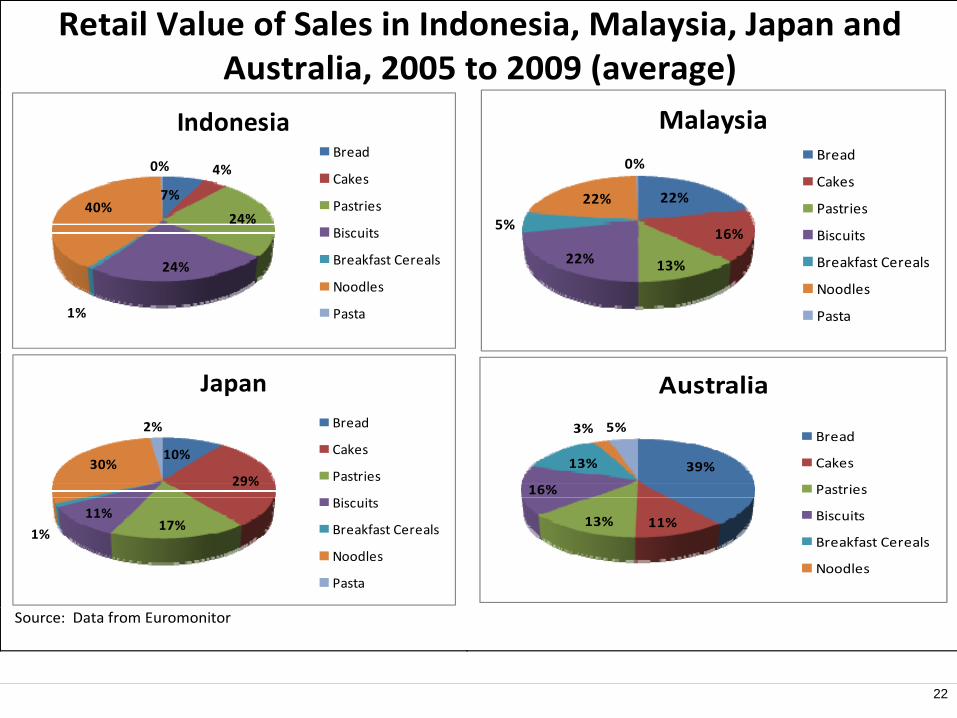
Retail Value of Sales in Indonesia, Malaysia, Japan and Australia, 2005 to 2009 (average)
7%
4%
24%
24%
1%
40%
0%
IndonesiaBread
Cakes
Pastries
Biscuits
Breakfast Cereals
Noodles
Pasta
22%
16%
13%22%
5%
22%
0%
MalaysiaBread
Cakes
Pastries
Biscuits
Breakfast Cereals
Noodles
Pasta
10%
29%
17%11%
1%
30%
2%
JapanBread
Cakes
Pastries
Biscuits
Breakfast Cereals
Noodles
Pasta
39%
11%13%
16%
13%
3% 5%
Australia
Bread
Cakes
Pastries
Biscuits
Breakfast Cereals
Noodles
Source: Data from Euromonitor
22
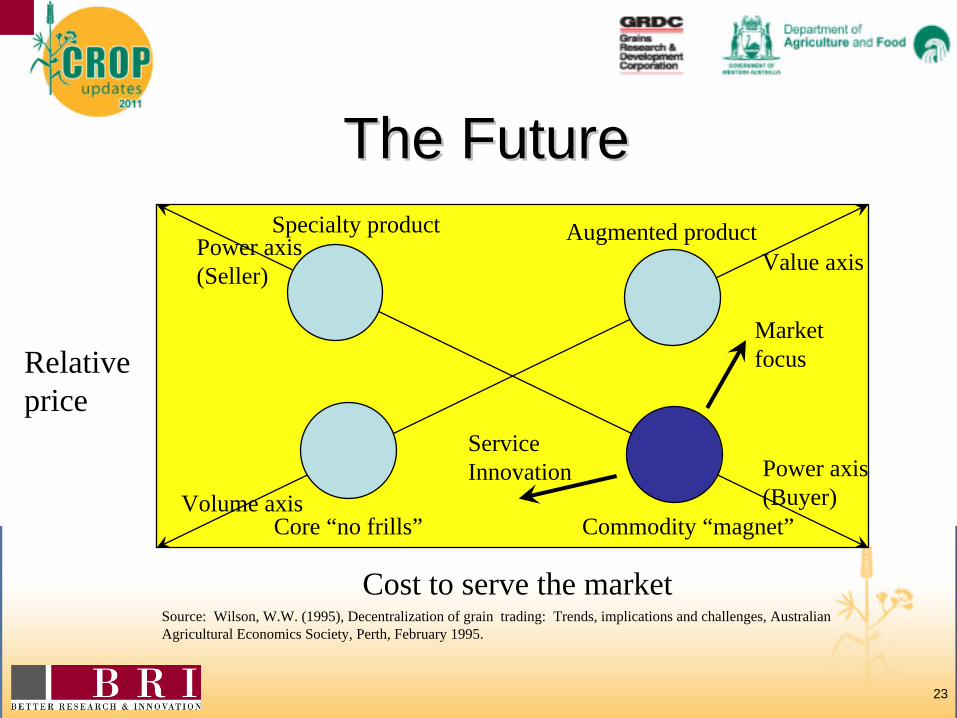
The FutureThe Future
23
Relative price
Source: Wilson, W.W. (1995), Decentralization of grain trading: Trends, implications and challenges, Australian Agricultural Economics Society, Perth, February 1995.
Cost to serve the market
Specialty product Augmented product
Core “no frills” Commodity “magnet”
Marketfocus
ServiceInnovation
Power axis(Seller)
Volume axisPower axis(Buyer)
Value axis
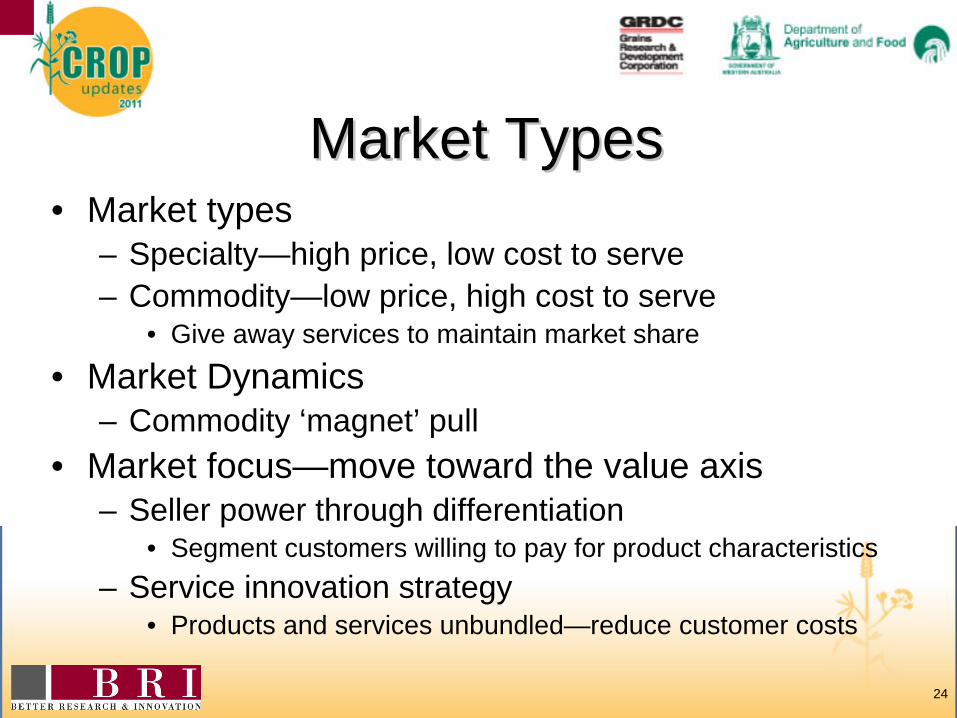
Market TypesMarket Types
24
• Market types– Specialty—high price, low cost to serve– Commodity—low price, high cost to serve
• Give away services to maintain market share
• Market Dynamics– Commodity ‘magnet’ pull
• Market focus—move toward the value axis– Seller power through differentiation
• Segment customers willing to pay for product characteristics– Service innovation strategy
• Products and services unbundled—reduce customer costs
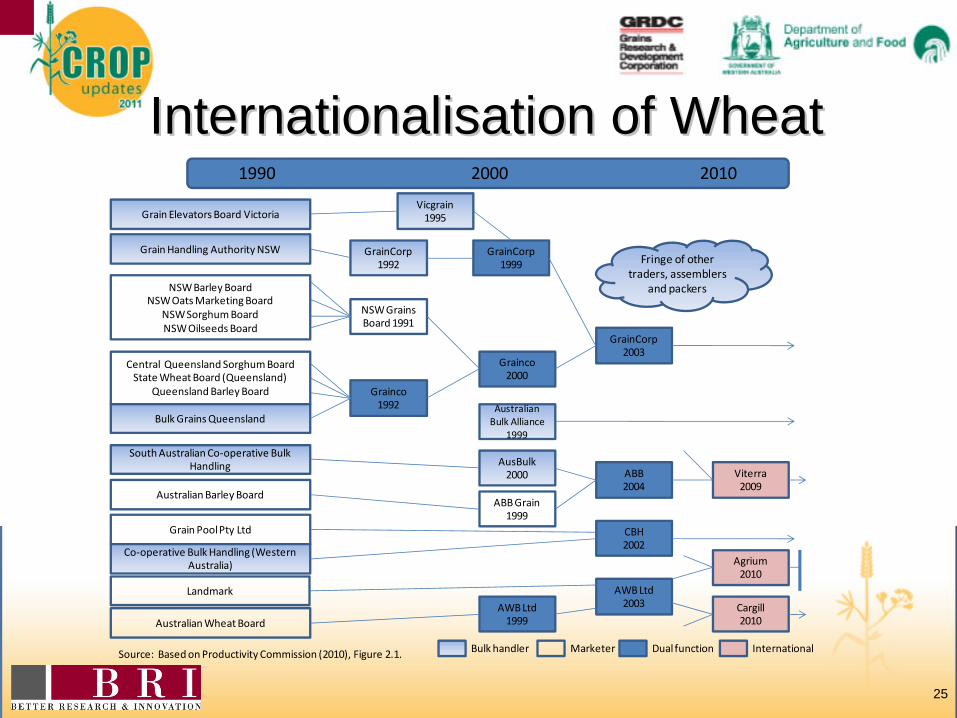
Internationalisation of WheatInternationalisation of Wheat
25
1990 2000 2010
Grain Elevators Board Victoria
Grain Handling Authority NSW
NSW Barley BoardNSW Oats Marketing Board
NSW Sorghum BoardNSW Oilseeds Board
Central Queensland Sorghum BoardState Wheat Board (Queensland)
Queensland Barley Board
Bulk Grains Queensland
South Australian Co‐operative Bulk Handling
Australian Barley Board
Grain Pool Pty Ltd
Co‐operative Bulk Handling (Western Australia)
Australian Wheat Board
GrainCorp1992
GrainCorp1999
GrainCorp2003
Grainco2000
NSW Grains Board 1991
Grainco1992
Vicgrain1995
Australian Bulk Alliance
1999
AusBulk2000
ABB Grain 1999
ABB2004
Viterra2009
CBH 2002
AWB Ltd1999
Cargill2010
Fringe of other traders, assemblers
and packers
Source: Based on Productivity Commission (2010), Figure 2.1. Bulk handler Marketer Dual function
AWB Ltd2003
Landmark
Agrium2010
International
Internationalisation of WheatInternationalisation of Wheat
26
• From export monopoly to oligopoly (few firms)– Economies of scale and scope– International scale firms– Extraction of oligopoly rents (market power)
• Role of the competitive fringe– Frequent entry and exit – Innovative and product differentiate– Keep pressure on oligopoly rents
SummarySummary
27
• World wheat industry is large, complex and risky
• Black Sea Ports are serious competition• Supply and demand are inelastic—price
‘spikes’• Indonesia our largest market• Baking sector is the largest end-use sector• Quality versus yield—consistency required• Production differentiation
– helps both customers and producers
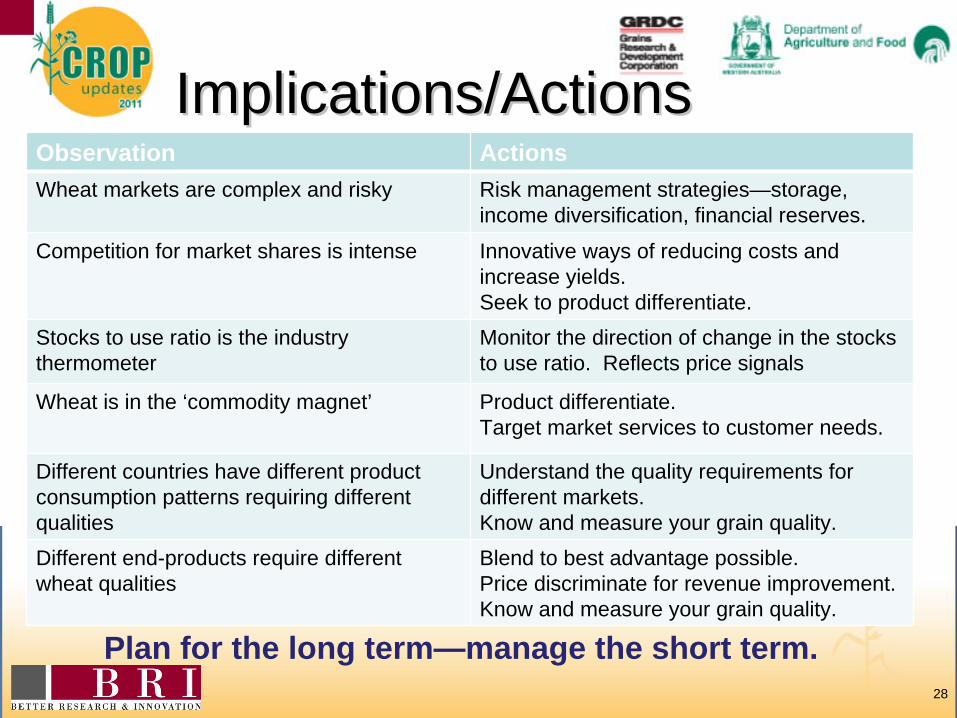
Implications/ActionsImplications/Actions
28
Observation ActionsWheat markets are complex and risky Risk management strategies—storage,
income diversification, financial reserves.
Competition for market shares is intense Innovative ways of reducing costs and increase yields.Seek to product differentiate.
Stocks to use ratio is the industry thermometer
Monitor the direction of change in the stocks to use ratio. Reflects price signals
Wheat is in the ‘commodity magnet’ Product differentiate.Target market services to customer needs.
Different countries have different product consumption patterns requiring different qualities
Understand the quality requirements for different markets.Know and measure your grain quality.
Different end-products require different wheat qualities
Blend to best advantage possible.Price discriminate for revenue improvement.Know and measure your grain quality.
Plan for the long term—manage the short term.
Work on “What the World Wants from Australian Wheat” is a jointly funded project of the
Grain Growers Association and the Department of Agriculture, Fisheries and Forestry.
29
Thank YouThank You
More information can be found at http://www.graingrowers.com.au/
by downloading “What the World Wants from Australian Wheat: Update 2010.”
Thank YouThank You


